





1. Introduction
Contactless gripping or hovering near surfaces is desirable in many applications (Vandaele, Lambert & Delchambre Reference Vandaele, Lambert and Delchambre2005). Fluid-mediated strategies include acoustic levitation to manipulate small objects (Andrade, Pérez & Adamowski Reference Andrade, Pérez and Adamowski2018), Bernoulli grippers to grab delicate items (Waltham, Bendall & Kotlicki Reference Waltham, Bendall and Kotlicki2003; Li et al. Reference Li, Li, Tao, Liu and Kagawa2015), hovercrafts travelling on air cushions, and ground-effect flight used by both birds and vehicles (Ollila Reference Ollila1980; Rayner Reference Rayner1991). In parallel, soft robotics (Whitesides Reference Whitesides2018) has emerged as an alternative to traditional mechanical systems with applications in handling fragile objects (Shintake et al. Reference Shintake, Cacucciolo, Floreano and Shea2018) and bio-inspired locomotion (Calisti, Picardi & Laschi Reference Calisti, Picardi and Laschi2017). Combining contactless dynamics with soft designs, it has been shown that an elastic sheet sustaining travelling waves and placed next to a surface could levitate and translate owing to elastohydrodynamic interactions (Argentina, Skotheim & Mahadevan Reference Argentina, Skotheim and Mahadevan2007; Jafferis, Stone & Sturm Reference Jafferis, Stone and Sturm2011). More recently, Colasante (Reference Colasante2015) and Weston-Dawkes et al. (Reference Weston-Dawkes, Adibnazari, Hu, Everman, Gravish and Tolley2021) devised a novel strategy: they showed experimentally that attaching a vibration motor to an elastic sheet creates a seemingly contactless suction cup that can adhere to surfaces or pick up objects weighing up to several kilograms (see also Colasante (Reference Colasante2016) and references in Ramanarayanan & Sánchez (Reference Ramanarayanan and Sánchez2024)), offering a possible alternative to state-of-the-art contactless grippers. In a broader context, recent studies have highlighted the roles of elastohydrodynamic and vibrations in adhesion: viscous effects have been shown to influence bonding fronts (Rieutord, Bataillou & Moriceau Reference Rieutord, Bataillou and Moriceau2005; Poulain et al. Reference Poulain, Carlson, Mandre and Mahadevan2022), the viscous Stefan adhesion mechanism has been analysed for deformable surfaces (Shao, Wang & Frechette Reference Shao, Wang and Frechette2023; Bertin, Oratis & Snoeijer Reference Bertin, Oratis and Snoeijer2025), and vibrations have been found to enhance dry adhesion (Shui et al. Reference Shui, Jia, Li, Guo, Guo, Liu, Liu and Chen2020; Tricarico, Ciavarella & Papangelo Reference Tricarico, Ciavarella and Papangelo2025) and to improve the stability of suction cups (Zhu et al. Reference Zhu, Liu, Wang and Wang2006; Wu et al. Reference Wu, Cai, Li, Gao and Cao2023).
In an earlier publication, we modelled the viscous flow in the thin gap between a wall and an actuated elastic sheet (Poulain et al. Reference Poulain, Koch, Mahadevan and Carlson2025). We demonstrated how a time-reversible forcing of the soft sheet triggers a non-reversible response, an effect previously examined in the context of microorganism swimming with flagella (Wiggins & Goldstein Reference Wiggins and Goldstein1998; Wiggins et al. Reference Wiggins, Riveline, Ott and Goldstein1998; Yu, Lauga & Hosoi Reference Yu, Lauga and Hosoi2006; Lauga Reference Lauga2007). Indeed, elastohydrodynamic interactions enable breaking the time-reversal symmetry of viscous flows and circumventing the scallop theorem (Taylor Reference Taylor1967; Purcell Reference Purcell1977; Bureau, Coupier & Salez Reference Bureau, Coupier and Salez2023; Rallabandi Reference Rallabandi2024), generating a net effect that attracts or repels the sheet depending on the spatial profile of the forcing. For a localised central forcing, we have shown that the sheet is attracted towards the surface against gravity, enabling adhesion and hovering. This viscous elastohydrodynamic mechanism rationalises qualitatively the experiments of Colasante (Reference Colasante2016) and Weston-Dawkes et al. (Reference Weston-Dawkes, Adibnazari, Hu, Everman, Gravish and Tolley2021). While our analysis isolated the essential physics, it relied on asymptotic calculations assuming a weak forcing, and on the assumptions of incompressible and inertialess flow, leveraging lubrication theory. A more comprehensive understanding, however, may require considering the inertia and compressibility of the fluid, as highlighted by Ramanarayanan, Coenen & Sánchez (Reference Ramanarayanan, Coenen and Sánchez2022); Ramanarayanan & Sánchez (Reference Ramanarayanan and Sánchez2022, Reference Ramanarayanan and Sánchez2024).
Corrections to lubrication theory have long been studied, particularly in squeeze-film settings relevant to bearings (Moore Reference Moore1965) and resonant micro-electro-mechanical systems (MEMS) (Bao & Yang Reference Bao and Yang2007; Pratap & Roychowdhury Reference Pratap and Roychowdhury2014; Fedder et al. Reference Fedder, Hierold, Korvink and Tabata2015). In standard squeeze films, two surfaces of length $\tilde {R}$
immersed in a fluid with ambient pressure
$\tilde {R}$
immersed in a fluid with ambient pressure $\tilde {p}_a$
, ambient density
$\tilde {p}_a$
, ambient density $\tilde {\rho }_a$
and dynamic viscosity
$\tilde {\rho }_a$
and dynamic viscosity $\tilde {\mu }$
oscillate with the distance separating them evolving harmonically as
$\tilde {\mu }$
oscillate with the distance separating them evolving harmonically as $\tilde {h}(\tilde {t})=\tilde {h}_0 (1+a\sin (\tilde {\omega } \tilde {t}) )$
, where
$\tilde {h}(\tilde {t})=\tilde {h}_0 (1+a\sin (\tilde {\omega } \tilde {t}) )$
, where $0\lt a\lt 1$
. Experimental observations reveal that the flow in the gap can generate net normal forces or damping effects that are not predicted by classical lubrication theory, which only considers viscous effects.
$0\lt a\lt 1$
. Experimental observations reveal that the flow in the gap can generate net normal forces or damping effects that are not predicted by classical lubrication theory, which only considers viscous effects.
Considering the viscous and compressible flow of an ideal gas, Taylor & Saffman (Reference Taylor and Saffman1957) and Langlois (Reference Langlois1962) showed that a repulsive normal force between the two surfaces arises for finite squeeze number ${Sq}=\tilde {\mu } \tilde {\omega } \tilde {R}^2/\tilde {h}_0^2 \tilde {p}_a\gt 0$
, i.e. when the magnitude of viscous stresses is comparable to the ambient pressure. These effects, studied in more detail since (Bao & Yang Reference Bao and Yang2007; Melikhov et al. Reference Melikhov, Chivilikhin, Amosov and Jeanson2016; Ramanarayanan et al. Reference Ramanarayanan, Coenen and Sánchez2022), allow for the levitation of small objects (Shi et al. Reference Shi, Feng, Hu, Zhu and Cui2019), are relevant to MEMS sensors employing vibrating micro-cantilever plates or beams (Bao & Yang Reference Bao and Yang2007; Wei et al. Reference Wei, Liu, Zheng, Sun and Wei2021), and may have applications in the design of haptic surfaces (Wiertlewski, Fenton Friesen & Colgate Reference Wiertlewski, Fenton Friesen and Colgate2016). More generally, squeeze films belong to an interesting class of elastohydrodynamic problems where compressible effects are significant even at low Mach numbers (e.g. Mandre, Mani & Brenner Reference Mandre, Mani and Brenner2009; Peng et al. Reference Peng, Cuttle, MacMinn and Pihler-Puzović2023). Compressible squeeze flows can also be coupled with elastic deformations: instead of using rigid-body vibrations, leveraging flexural vibrations has been proposed to enhance levitation efficiency (Hashimoto, Koike & Ueha Reference Hashimoto, Koike and Ueha1996; Minikes & Bucher Reference Minikes and Bucher2003) and control the lateral translation of the levitated object (Ueha, Hashimoto & Koike Reference Ueha, Hashimoto and Koike2000; Andrade et al. Reference Andrade, Pérez and Adamowski2018). The coupling between the elastic deformations of thin cantilever plates with squeeze flows is also key for MEMS (Pandey & Pratap Reference Pandey and Pratap2007; Lee et al. Reference Lee, Tung, Raman, Sumali and Sullivan2009).
${Sq}=\tilde {\mu } \tilde {\omega } \tilde {R}^2/\tilde {h}_0^2 \tilde {p}_a\gt 0$
, i.e. when the magnitude of viscous stresses is comparable to the ambient pressure. These effects, studied in more detail since (Bao & Yang Reference Bao and Yang2007; Melikhov et al. Reference Melikhov, Chivilikhin, Amosov and Jeanson2016; Ramanarayanan et al. Reference Ramanarayanan, Coenen and Sánchez2022), allow for the levitation of small objects (Shi et al. Reference Shi, Feng, Hu, Zhu and Cui2019), are relevant to MEMS sensors employing vibrating micro-cantilever plates or beams (Bao & Yang Reference Bao and Yang2007; Wei et al. Reference Wei, Liu, Zheng, Sun and Wei2021), and may have applications in the design of haptic surfaces (Wiertlewski, Fenton Friesen & Colgate Reference Wiertlewski, Fenton Friesen and Colgate2016). More generally, squeeze films belong to an interesting class of elastohydrodynamic problems where compressible effects are significant even at low Mach numbers (e.g. Mandre, Mani & Brenner Reference Mandre, Mani and Brenner2009; Peng et al. Reference Peng, Cuttle, MacMinn and Pihler-Puzović2023). Compressible squeeze flows can also be coupled with elastic deformations: instead of using rigid-body vibrations, leveraging flexural vibrations has been proposed to enhance levitation efficiency (Hashimoto, Koike & Ueha Reference Hashimoto, Koike and Ueha1996; Minikes & Bucher Reference Minikes and Bucher2003) and control the lateral translation of the levitated object (Ueha, Hashimoto & Koike Reference Ueha, Hashimoto and Koike2000; Andrade et al. Reference Andrade, Pérez and Adamowski2018). The coupling between the elastic deformations of thin cantilever plates with squeeze flows is also key for MEMS (Pandey & Pratap Reference Pandey and Pratap2007; Lee et al. Reference Lee, Tung, Raman, Sumali and Sullivan2009).
Fluid inertia can also contribute to squeeze film dynamics, and inertial corrections to lubrication theory have been derived for finite Reynolds number $ \textit{Re}=\tilde {\rho }_a \tilde {\omega } \tilde {h}_0^2/\tilde {\mu }\gt 0$
in the context of bearings (Ishizawa Reference Ishizawa1966; Kuzma Reference Kuzma1968; Tichy & Winer Reference Tichy and Winer1970; Jones & Wilson Reference Jones and Wilson1975), with later applications to squeeze film levitation (Atalla et al. Reference Atalla, Van Ostayen, Sakes and Wiertlewski2023; Liu, Zhao & Chen Reference Liu, Zhao and Chen2023) and MEMS (Veijola Reference Veijola2004). This corresponds to the regime where the forcing time scale
$ \textit{Re}=\tilde {\rho }_a \tilde {\omega } \tilde {h}_0^2/\tilde {\mu }\gt 0$
in the context of bearings (Ishizawa Reference Ishizawa1966; Kuzma Reference Kuzma1968; Tichy & Winer Reference Tichy and Winer1970; Jones & Wilson Reference Jones and Wilson1975), with later applications to squeeze film levitation (Atalla et al. Reference Atalla, Van Ostayen, Sakes and Wiertlewski2023; Liu, Zhao & Chen Reference Liu, Zhao and Chen2023) and MEMS (Veijola Reference Veijola2004). This corresponds to the regime where the forcing time scale $\tilde {\omega }^{-1}$
and the viscous diffusion time scale
$\tilde {\omega }^{-1}$
and the viscous diffusion time scale $\tilde {\rho }_a \tilde {h}_0^2/\tilde {\mu }$
are comparable. For incompressible flows, inertia leads to a repulsive normal force between the surfaces. The aforementioned analytical corrections to Reynolds’ lubrication theory are limited to rigid geometries or specific types of deformation. Rojas et al. (Reference Rojas, Argentina, Cerda and Tirapegui2010) derived lubrication equations with inertial corrections, which naturally accommodate arbitrary deformable geometries. They have successfully applied this framework to free-surface phenomena; however, to our knowledge, it has not yet been extended to elastohydrodynamics and soft lubrication (Skotheim & Mahadevan Reference Skotheim and Mahadevan2005). More generally, flows at intermediate Reynolds numbers, where both viscous and inertial effects are significant, arise in a variety of physical systems. One of the most striking examples is steady streaming, the generation of a mean flow from periodic oscillations (Riley Reference Riley2001). Streaming is strongly influenced by confinement, as studied in the context of atomic force microscopes and surface force apparatus (Fouxon & Leshansky Reference Fouxon and Leshansky2018; Fouxon et al. Reference Fouxon, Rubinstein, Weinstein and Leshansky2020; Zhang et al. Reference Zhang, Bertin, Essink, Zhang, Fares, Shen, Bickel, Salez and Maali2023; Bigan et al. Reference Bigan, Lizée, Pascual, Niguès, Bocquet and Siria2024), and in physiological flows in tubes (Hall Reference Hall1974; Dragon & Grotberg Reference Dragon and Grotberg1991). Interestingly, streaming can also occur when soft boundaries are involved, even in the absence of inertia (Bhosale, Parthasarathy & Gazzola Reference Bhosale, Parthasarathy and Gazzola2022; Pande, Wang & Christov Reference Pande, Wang and Christov2023; Cui, Bhosale & Gazzola Reference Cui, Bhosale and Gazzola2024; Zhang & Rallabandi Reference Zhang and Rallabandi2024).
$\tilde {\rho }_a \tilde {h}_0^2/\tilde {\mu }$
are comparable. For incompressible flows, inertia leads to a repulsive normal force between the surfaces. The aforementioned analytical corrections to Reynolds’ lubrication theory are limited to rigid geometries or specific types of deformation. Rojas et al. (Reference Rojas, Argentina, Cerda and Tirapegui2010) derived lubrication equations with inertial corrections, which naturally accommodate arbitrary deformable geometries. They have successfully applied this framework to free-surface phenomena; however, to our knowledge, it has not yet been extended to elastohydrodynamics and soft lubrication (Skotheim & Mahadevan Reference Skotheim and Mahadevan2005). More generally, flows at intermediate Reynolds numbers, where both viscous and inertial effects are significant, arise in a variety of physical systems. One of the most striking examples is steady streaming, the generation of a mean flow from periodic oscillations (Riley Reference Riley2001). Streaming is strongly influenced by confinement, as studied in the context of atomic force microscopes and surface force apparatus (Fouxon & Leshansky Reference Fouxon and Leshansky2018; Fouxon et al. Reference Fouxon, Rubinstein, Weinstein and Leshansky2020; Zhang et al. Reference Zhang, Bertin, Essink, Zhang, Fares, Shen, Bickel, Salez and Maali2023; Bigan et al. Reference Bigan, Lizée, Pascual, Niguès, Bocquet and Siria2024), and in physiological flows in tubes (Hall Reference Hall1974; Dragon & Grotberg Reference Dragon and Grotberg1991). Interestingly, streaming can also occur when soft boundaries are involved, even in the absence of inertia (Bhosale, Parthasarathy & Gazzola Reference Bhosale, Parthasarathy and Gazzola2022; Pande, Wang & Christov Reference Pande, Wang and Christov2023; Cui, Bhosale & Gazzola Reference Cui, Bhosale and Gazzola2024; Zhang & Rallabandi Reference Zhang and Rallabandi2024).
Returning to squeeze films, an object may experience a net attractive force towards a vibrating surface, an effect leading to so-called inverted near-field acoustic levitation (Takasaki et al. Reference Takasaki, Terada, Kato, Ishino and Mizuno2010; Andrade et al. Reference Andrade, Ramos, Adamowski and Marzo2020). This observation has recently been theoretically rationalised by Ramanarayanan et al. (Reference Ramanarayanan, Coenen and Sánchez2022), who found that, surprisingly, incorporating both inertial and compressible effects in the lubrication dynamics reveals the possibility of an attractive force when including second-order inertial effects. Ramanarayanan & Sánchez (Reference Ramanarayanan and Sánchez2022, Reference Ramanarayanan and Sánchez2024) later extended their analysis to deformable geometries, showing an enhancement of the attractive effect. In contrast, our previous work (Poulain et al. Reference Poulain, Koch, Mahadevan and Carlson2025) demonstrated that viscous, inertialess and incompressible fluid–structure interactions alone can produce an adhesive effect when an elastic sheet is driven near a surface. In this regime relevant to the experiments of Colasante (Reference Colasante2015) and Weston-Dawkes et al. (Reference Weston-Dawkes, Adibnazari, Hu, Everman, Gravish and Tolley2021), we anticipate that inertial and compressible effects play a secondary role, entering as corrections rather than dictating the primarily viscous adhesion mechanism. Indeed, inverted near-field acoustic levitation typically supports only objects weighing a few milligrams (Andrade et al. Reference Andrade, Ramos, Adamowski and Marzo2020), whereas the viscous mechanism we uncovered predicts a lift capacity of the order of kilograms under typical experimental conditions, in agreement with observations.
This article is organised as follows. In § 2, we present the elastohydrodynamic framework to describe a vibrating elastic sheet lubricated by a thin fluid layer, together with the non-dimensional form of the governing equations. Section 3 focuses on the viscous regime and introduces the distinction between the limits of weak and strong forcing. We provide the corresponding scaling laws for the equilibrium adhesion height and the maximum sheet’s weight before adhesion failure. Sections 4 and 5 extend the analysis to include the first-order effects of fluid inertia and compressibility, characterised by finite Reynolds and squeeze numbers, respectively. Numerical simulations show that both effects weaken adhesion strength when compared with the purely viscous model, in agreement with asymptotic predictions in the rigid-sheet limit (Appendices D and E). Finally, we summarise and discuss the main findings in § 6.
2. Problem set-up and governing equations
2.1. Problem set-up $(a)$
An elastic sheet (radius
$(a)$
An elastic sheet (radius $\tilde {R}$
, density
$\tilde {R}$
, density $\tilde {\rho }_s$
, bending rigidity
$\tilde {\rho }_s$
, bending rigidity $\tilde {B}$
, Poisson’s ratio
$\tilde {B}$
, Poisson’s ratio $\nu$
, thickness
$\nu$
, thickness $\tilde {e}$
) immersed in a fluid (ambient density
$\tilde {e}$
) immersed in a fluid (ambient density $\tilde {\rho }_a$
, ambient pressure
$\tilde {\rho }_a$
, ambient pressure $\tilde {p}_a$
, dynamic viscosity
$\tilde {p}_a$
, dynamic viscosity $\tilde {\mu }$
) and forced periodically at its centre (force
$\tilde {\mu }$
) and forced periodically at its centre (force $\tilde {F}_a$
, angular frequency
$\tilde {F}_a$
, angular frequency $\tilde {\omega }$
, radius
$\tilde {\omega }$
, radius $\tilde {\ell }$
) is placed below a solid substrate with gravity pointing downward.
$\tilde {\ell }$
) is placed below a solid substrate with gravity pointing downward. $\boldsymbol{x}_\perp =(x,y)$
represent the horizontal coordinates. The dynamics is characterised by dimensionless numbers defined in table 1: Reynolds number
$\boldsymbol{x}_\perp =(x,y)$
represent the horizontal coordinates. The dynamics is characterised by dimensionless numbers defined in table 1: Reynolds number $ \textit{Re}_{{bv}}$
, squeeze number
$ \textit{Re}_{{bv}}$
, squeeze number ${Sq}_{{bv}}$
, solid inertia
${Sq}_{{bv}}$
, solid inertia $\mathcal{I}_{{bv}}$
, weight
$\mathcal{I}_{{bv}}$
, weight $\mathcal{G}$
and forcing strength
$\mathcal{G}$
and forcing strength $\alpha$
.
$\alpha$
. $(b)$
When
$(b)$
When $\mathcal{G}$
is small enough, the sheet hovers around an equilibrium position
$\mathcal{G}$
is small enough, the sheet hovers around an equilibrium position $h_{{eq}}$
(illustrated here for
$h_{{eq}}$
(illustrated here for $\alpha =5$
,
$\alpha =5$
, $\mathcal{G}=2.25$
and a purely viscous dynamics,
$\mathcal{G}=2.25$
and a purely viscous dynamics, $\mathcal{I}_{{bv}}={Re}_{{bv}}={Sq}_{{bv}}=0$
). Above a critical weight, the sheet cannot adhere to the substrate (shown for
$\mathcal{I}_{{bv}}={Re}_{{bv}}={Sq}_{{bv}}=0$
). Above a critical weight, the sheet cannot adhere to the substrate (shown for $\mathcal{G}=2.425$
). Thin lines represent the gap thickness at the centre of the sheet
$\mathcal{G}=2.425$
). Thin lines represent the gap thickness at the centre of the sheet $h(x=0,t)$
and thick lines the time-averaged
$h(x=0,t)$
and thick lines the time-averaged $\langle h \rangle (x=0,t)$
.
$\langle h \rangle (x=0,t)$
.

We consider the system shown in figure 1: an elastic sheet of radius $\tilde {R}$
, thickness
$\tilde {R}$
, thickness $\tilde {e}$
, density
$\tilde {e}$
, density $\tilde {\rho }_s$
, Poisson ratio
$\tilde {\rho }_s$
, Poisson ratio $\nu$
, Young’s modulus
$\nu$
, Young’s modulus $\tilde {E}$
and bending modulus
$\tilde {E}$
and bending modulus $\tilde {B}= \tilde {E} \tilde {e}^3/12(1-\nu ^2)$
placed near a solid substrate. The surrounding fluid is Newtonian with ambient density
$\tilde {B}= \tilde {E} \tilde {e}^3/12(1-\nu ^2)$
placed near a solid substrate. The surrounding fluid is Newtonian with ambient density $\tilde {\rho }_a$
, ambient pressure
$\tilde {\rho }_a$
, ambient pressure $\tilde {p}_a$
and a constant viscosity
$\tilde {p}_a$
and a constant viscosity $\tilde {\mu }$
. The sheet is forced at its centre by a harmonic active load with angular frequency
$\tilde {\mu }$
. The sheet is forced at its centre by a harmonic active load with angular frequency $\tilde {\omega }$
, radius
$\tilde {\omega }$
, radius $\tilde {\ell }$
and force magnitude
$\tilde {\ell }$
and force magnitude $\tilde {F}_a$
. We aim to establish equilibrium conditions under which the elastic sheet hovers at a finite, stable time-averaged distance from the wall despite the gravitational pull.
$\tilde {F}_a$
. We aim to establish equilibrium conditions under which the elastic sheet hovers at a finite, stable time-averaged distance from the wall despite the gravitational pull.
An important characteristic scale of the system is the elastohydrodynamic height (Poulain et al. Reference Poulain, Koch, Mahadevan and Carlson2025)
 \begin{align} \tilde {H}_{{bv}}={\tilde {R}^2}{\left (\frac {\tilde {\mu } \tilde {\omega }}{\tilde {B}}\right )^{1/3}} \!, \end{align}
for which viscous stresses scaling as $\tilde {\mu } \tilde {\omega } \tilde {R}^2 / \tilde {H}_{{bv}}^2$
and bending stresses scaling as
$\tilde {\mu } \tilde {\omega } \tilde {R}^2 / \tilde {H}_{{bv}}^2$
and bending stresses scaling as $\tilde {B} \tilde {H}_{{bv}} / \tilde {R}^4$
balance. Associated with
$\tilde {B} \tilde {H}_{{bv}} / \tilde {R}^4$
balance. Associated with $\tilde {H}_{{bv}}$
is the aspect ratio
$\tilde {H}_{{bv}}$
is the aspect ratio $\varepsilon _{{bv}}=\tilde {H}_{{bv}}/\tilde {R}$
and an elastohydrodynamic force scale
$\varepsilon _{{bv}}=\tilde {H}_{{bv}}/\tilde {R}$
and an elastohydrodynamic force scale
 \begin{align} \tilde {F}_{{bv}} = (\tilde {\mu } \tilde {\omega } \tilde {B}^2 )^{1/3}. \end{align}
The scale for elastohydrodynamic stresses is then $\tilde {F}_{{bv}}/\tilde {R}^2$
. In the remainder of the article, we mostly work with dimensionless quantities (written throughout without a tilde, in contrast to dimensional quantities):
$\tilde {F}_{{bv}}/\tilde {R}^2$
. In the remainder of the article, we mostly work with dimensionless quantities (written throughout without a tilde, in contrast to dimensional quantities):
 \begin{align} \begin{split} t = \tilde {t}\tilde {\omega }, \quad \boldsymbol{x}_\perp =\frac {\tilde {\boldsymbol{x}}_\perp }{\tilde {R}}, \quad h(\boldsymbol{x}_\perp ,t)=\frac {\tilde {h}(\tilde {\boldsymbol{x}}_\perp ,\tilde {t})}{\tilde {H}_{{bv}}}, \\ p(\boldsymbol{x}_\perp ,t) = \frac {\tilde {p}(\tilde {\boldsymbol{x}}_\perp ,\tilde {t})}{\tilde {F}_{{bv}}/\tilde {R}^2},\quad \rho (\boldsymbol{x}_\perp ,t)=\frac {\tilde {\rho }(\tilde {\boldsymbol{x}}_\perp ,\tilde {t})}{\tilde {\rho }_a}, \end{split} \end{align}
with $\boldsymbol{x}_\perp =(x,y)$
the horizontal coordinates,
$\boldsymbol{x}_\perp =(x,y)$
the horizontal coordinates, $p(\boldsymbol{x}_\perp ,t)$
the fluid pressure relative to the ambient pressure and
$p(\boldsymbol{x}_\perp ,t)$
the fluid pressure relative to the ambient pressure and $\rho (\boldsymbol{x}_\perp ,t)$
the fluid density.
$\rho (\boldsymbol{x}_\perp ,t)$
the fluid density.
We consider small aspect ratios, $\varepsilon _{{bv}} \ll 1$
, for which the viscous flow in the thin layer separating the sheet and the wall dominates the dynamics. Two other dimensionless numbers describe the flow. Inertial effects are characterised by the film Reynolds number
$\varepsilon _{{bv}} \ll 1$
, for which the viscous flow in the thin layer separating the sheet and the wall dominates the dynamics. Two other dimensionless numbers describe the flow. Inertial effects are characterised by the film Reynolds number $ \textit{Re}_{{bv}}=\tilde {\rho } \tilde {\omega } \tilde {H}_{{bv}}^2/\tilde {\mu }$
that compares the inertial pressure
$ \textit{Re}_{{bv}}=\tilde {\rho } \tilde {\omega } \tilde {H}_{{bv}}^2/\tilde {\mu }$
that compares the inertial pressure $\tilde {\rho } \tilde {R}^2 \tilde {\omega }^2$
to the viscous stress
$\tilde {\rho } \tilde {R}^2 \tilde {\omega }^2$
to the viscous stress $\tilde {F}_{{bv}}/\tilde {R}^2$
. The Reynolds number can also be written as
$\tilde {F}_{{bv}}/\tilde {R}^2$
. The Reynolds number can also be written as ${\textit{Re}}_{{bv}}=(\tilde {H}_{{bv}}/\tilde {\delta })^2$
, with
${\textit{Re}}_{{bv}}=(\tilde {H}_{{bv}}/\tilde {\delta })^2$
, with $\tilde {\delta }=(\tilde {\mu }/\tilde {\rho } \tilde {\omega })^{1/2}$
the viscous penetration length, the length scale for diffusion of vorticity. It may also be interpreted as a Womersley number, and we refer to Appendix A.1 for a detailed discussion of the scaling of inertial effects. We only emphasise here that
$\tilde {\delta }=(\tilde {\mu }/\tilde {\rho } \tilde {\omega })^{1/2}$
the viscous penetration length, the length scale for diffusion of vorticity. It may also be interpreted as a Womersley number, and we refer to Appendix A.1 for a detailed discussion of the scaling of inertial effects. We only emphasise here that ${\textit{Re}}_{{bv}}$
is constructed based on the vertical length and velocity scales,
${\textit{Re}}_{{bv}}$
is constructed based on the vertical length and velocity scales, $\tilde {H}_{{bv}}$
and
$\tilde {H}_{{bv}}$
and $\tilde {\omega } \tilde {H}_{{bv}}$
, as appropriate in the lubrication limit
$\tilde {\omega } \tilde {H}_{{bv}}$
, as appropriate in the lubrication limit $\varepsilon _{{bv}}\ll 1$
(Batchelor Reference Batchelor1967). Compressible effects are characterised by the squeeze number
$\varepsilon _{{bv}}\ll 1$
(Batchelor Reference Batchelor1967). Compressible effects are characterised by the squeeze number ${Sq}_{{bv}} = \tilde {F}_{{bv}}/\tilde {p}_a \tilde {R}^2$
that compares the viscous stress to the ambient pressure
${Sq}_{{bv}} = \tilde {F}_{{bv}}/\tilde {p}_a \tilde {R}^2$
that compares the viscous stress to the ambient pressure $\tilde {p}_a$
(Taylor & Saffman Reference Taylor and Saffman1957). With (2.1), the inertial and compressible effects in the fluid are quantified respectively by
$\tilde {p}_a$
(Taylor & Saffman Reference Taylor and Saffman1957). With (2.1), the inertial and compressible effects in the fluid are quantified respectively by
 \begin{align} \textit{Re}_{{bv}}=\frac {\tilde {\rho }_a \tilde {\omega }^2 \tilde {R}^4 }{\big (\tilde {\mu } \tilde {\omega } \tilde {B}^2\big )^{1/3}}, \qquad {Sq}_{{bv}}=\frac {\big (\tilde {\mu } \tilde {\omega } \tilde {B}^2\big )^{1/3}}{\tilde {p}_a \tilde {R}^2}. \end{align}
2.2. Inertial lubrication
Let us find a depth-integrated description of the flow in the thin gap between the sheet and the wall ( $\varepsilon _{{bv}}\ll 1$
) which includes the first-order effects of inertia at
$\varepsilon _{{bv}}\ll 1$
) which includes the first-order effects of inertia at $\mathcal{O}({{Re}_{{bv}}})$
and compressibility at
$\mathcal{O}({{Re}_{{bv}}})$
and compressibility at $\mathcal{O}({{Sq}_{{bv}}})$
. Mass conservation yields
$\mathcal{O}({{Sq}_{{bv}}})$
. Mass conservation yields
 \begin{align} {\frac {\partial \left (\rho h\right )}{\partial t}} + \boldsymbol{\nabla }_\perp \boldsymbol{\cdot }\left (\rho \boldsymbol{q}\right ) &= 0, \\[-12pt] \nonumber \end{align}
 \begin{align} \rho &= 1 + {Sq}_{{bv}} p, \end{align}
with $\boldsymbol{q}=\int _0^h \boldsymbol{v}_\perp\, {\mathrm{d}}z=\tilde {\boldsymbol{q}} / \tilde {\omega } \tilde {R}$
the horizontal volumetric fluid flux,
$\boldsymbol{q}=\int _0^h \boldsymbol{v}_\perp\, {\mathrm{d}}z=\tilde {\boldsymbol{q}} / \tilde {\omega } \tilde {R}$
the horizontal volumetric fluid flux, $\boldsymbol{v}_\perp$
the horizontal fluid velocity profile and
$\boldsymbol{v}_\perp$
the horizontal fluid velocity profile and $\boldsymbol{\nabla }_\perp =(\partial /\partial x, \partial /\partial y)$
the horizontal gradient operator. Equation (2.4b
) is the dimensionless ideal gas law assuming isothermal conditions,
$\boldsymbol{\nabla }_\perp =(\partial /\partial x, \partial /\partial y)$
the horizontal gradient operator. Equation (2.4b
) is the dimensionless ideal gas law assuming isothermal conditions, $\tilde {\rho }/\tilde {\rho }_a=1+\tilde {p}/\tilde {p}_a$
, an assumption we discuss later in § 5. The volumetric flux
$\tilde {\rho }/\tilde {\rho }_a=1+\tilde {p}/\tilde {p}_a$
, an assumption we discuss later in § 5. The volumetric flux $\boldsymbol{q}$
appearing in (2.4) is found from the Navier–Stokes equations. Rojas et al. (Reference Rojas, Argentina, Cerda and Tirapegui2010) describe a procedure to consider the first-order inertial corrections to lubrication theory for free surface flows. We adapt their derivation to a fluid layer bounded by two solid walls (Appendix A), which yields the depth-integrated horizontal momentum balance, to
$\boldsymbol{q}$
appearing in (2.4) is found from the Navier–Stokes equations. Rojas et al. (Reference Rojas, Argentina, Cerda and Tirapegui2010) describe a procedure to consider the first-order inertial corrections to lubrication theory for free surface flows. We adapt their derivation to a fluid layer bounded by two solid walls (Appendix A), which yields the depth-integrated horizontal momentum balance, to $\mathcal{O}(\varepsilon _{{bv}}^2,{Re}_{{bv}},\varepsilon _{{bv}}^2{Re}_{{bv}},{Re}_{{bv}}{Sq}_{{bv}},{Sq}_{{bv}})$
:
$\mathcal{O}(\varepsilon _{{bv}}^2,{Re}_{{bv}},\varepsilon _{{bv}}^2{Re}_{{bv}},{Re}_{{bv}}{Sq}_{{bv}},{Sq}_{{bv}})$
:
 \begin{align} 12 {\boldsymbol{q}}+ { h^3}{\boldsymbol{\nabla }}_\perp p + {Re}_{{bv}} h^3 \left [ \frac 65 {\frac {\partial }{\partial t}}\left (\frac {{\boldsymbol{q}}}{ h}\right ) +\frac {54}{35} \frac {{\boldsymbol{q}} }{ h} \boldsymbol{\cdot }\boldsymbol{\nabla }_\perp \left (\frac {{\boldsymbol{q}}}{ h}\right ) - \frac 6{35} \frac {{\boldsymbol{q}}}{ h^2}{\frac {\partial h}{\partial t}} \right ]&=0. \end{align}
The first two terms in (2.5) reduce to the Reynolds equation from inertialess lubrication theory, valid for vanishing Reynolds number (Batchelor Reference Batchelor1967). The term proportional to $ \textit{Re}_{{bv}}$
corresponds to the first-order correction due to both the unsteady and convective inertia of the fluid. It corrects the parabolic Poiseuille velocity profile of lubrication theory and predicts a sextic profile, discussed in § 4. Rojas et al. (Reference Rojas, Argentina, Cerda and Tirapegui2010) found good agreement between experiments and this extended lubrication theory for Reynolds numbers of order one. Previous theoretical works from Ishizawa (Reference Ishizawa1966) and Jones & Wilson (Reference Jones and Wilson1975), albeit limited to non-deformable boundaries, suggest that this correction may even be valid as long as the Reynolds number is less than
$ \textit{Re}_{{bv}}$
corresponds to the first-order correction due to both the unsteady and convective inertia of the fluid. It corrects the parabolic Poiseuille velocity profile of lubrication theory and predicts a sextic profile, discussed in § 4. Rojas et al. (Reference Rojas, Argentina, Cerda and Tirapegui2010) found good agreement between experiments and this extended lubrication theory for Reynolds numbers of order one. Previous theoretical works from Ishizawa (Reference Ishizawa1966) and Jones & Wilson (Reference Jones and Wilson1975), albeit limited to non-deformable boundaries, suggest that this correction may even be valid as long as the Reynolds number is less than $100$
. Equation (2.5) recovers the inertial corrections derived in these studies and generalises them to an arbitrary height
$100$
. Equation (2.5) recovers the inertial corrections derived in these studies and generalises them to an arbitrary height $h(\boldsymbol{x}_\perp , t)$
, suggesting that (2.5) may be valid for finite, relatively large values of
$h(\boldsymbol{x}_\perp , t)$
, suggesting that (2.5) may be valid for finite, relatively large values of $ \textit{Re}_{{bv}}$
, say
$ \textit{Re}_{{bv}}$
, say $\mathcal{O}({10})$
.
$\mathcal{O}({10})$
.
2.3. Elastic deformations
To close the system formed by (2.4) and (2.5), the fluid pressure $p$
must be linked to elastic stresses by considering a vertical momentum balance of the elastic sheet. We adopt the Kirchhoff–Love model (Timoshenko & Woinowsky-Krieger Reference Timoshenko and Woinowsky-Krieger1959; Landau & Lifshitz Reference Landau and Lifshitz1986) to describe the deformation of the sheet. We therefore neglect any in-plane stretching, which is justified for a sheet undergoing cylindrical bending, i.e. deforming in a single direction and preserving a zero Gaussian curvature (in which case, the model reduces to the Euler–Bernoulli beam) and for two-dimensional deformations whose amplitude remains small compared with the thickness of the sheet. We also neglect the tension induced by the shear stress from the flow (Poulain et al. Reference Poulain, Koch, Mahadevan and Carlson2025). The normal force per unit area from the aerodynamic interactions in the thin gap is
$p$
must be linked to elastic stresses by considering a vertical momentum balance of the elastic sheet. We adopt the Kirchhoff–Love model (Timoshenko & Woinowsky-Krieger Reference Timoshenko and Woinowsky-Krieger1959; Landau & Lifshitz Reference Landau and Lifshitz1986) to describe the deformation of the sheet. We therefore neglect any in-plane stretching, which is justified for a sheet undergoing cylindrical bending, i.e. deforming in a single direction and preserving a zero Gaussian curvature (in which case, the model reduces to the Euler–Bernoulli beam) and for two-dimensional deformations whose amplitude remains small compared with the thickness of the sheet. We also neglect the tension induced by the shear stress from the flow (Poulain et al. Reference Poulain, Koch, Mahadevan and Carlson2025). The normal force per unit area from the aerodynamic interactions in the thin gap is $p + \mathcal{O}({\varepsilon _{{bv}}^2})$
, so that the force balance in the thin-film limit reads
$p + \mathcal{O}({\varepsilon _{{bv}}^2})$
, so that the force balance in the thin-film limit reads
 \begin{align} \begin{split} \mathcal{I}_{{bv}} {\frac {\partial ^2h}{\partial t^2}} &= p + \boldsymbol{\nabla }_\perp \boldsymbol{\cdot }\left ( \boldsymbol{\nabla }_\perp \boldsymbol{\cdot }\boldsymbol{M}\right ) + f_a(\boldsymbol{x}_\perp ,t)+\mathcal{G} + f_{w}(h), \\ \boldsymbol{M} &=-\left [\left (1-\nu \right ) \boldsymbol \kappa + \nu \operatorname {tr}(\boldsymbol \kappa ) \mathbf I \right ]. \end{split} \end{align}
The dimensionless number $\mathcal{I}_{{bv}}=\tilde {\rho }_s \tilde {e} {\tilde {H}}_{{bv}} \tilde {\omega }^2 \tilde {R}^2/ \tilde {F}_{{bv}}$
compares solid inertia to the elastohydrodynamic stress scale. The right-hand side of (2.6) corresponds respectively to the stress from the fluid, the bending stress (with
$\mathcal{I}_{{bv}}=\tilde {\rho }_s \tilde {e} {\tilde {H}}_{{bv}} \tilde {\omega }^2 \tilde {R}^2/ \tilde {F}_{{bv}}$
compares solid inertia to the elastohydrodynamic stress scale. The right-hand side of (2.6) corresponds respectively to the stress from the fluid, the bending stress (with $\boldsymbol \kappa$
the Hessian of
$\boldsymbol \kappa$
the Hessian of $h$
– the curvatures of the sheet), the periodic active stress
$h$
– the curvatures of the sheet), the periodic active stress $f_a$
, the sheet’s areal weight with
$f_a$
, the sheet’s areal weight with $\mathcal{G}=\tilde {\rho }_s \tilde {e} \tilde {R}^2 \tilde {g}/\tilde {F}_{{bv}}\gt 0$
and a term preventing collision with the wall. We also note that in the case of a constant bending rigidity considered here, the bending stresses simplify to
$\mathcal{G}=\tilde {\rho }_s \tilde {e} \tilde {R}^2 \tilde {g}/\tilde {F}_{{bv}}\gt 0$
and a term preventing collision with the wall. We also note that in the case of a constant bending rigidity considered here, the bending stresses simplify to $\boldsymbol{\nabla }_\perp \boldsymbol{\cdot }( \boldsymbol{\nabla }_\perp \boldsymbol{\cdot }\boldsymbol{M} )=-\boldsymbol{\nabla} ^4_\perp h$
. We emphasise that the sheet is assumed to have a uniform weight:
$\boldsymbol{\nabla }_\perp \boldsymbol{\cdot }( \boldsymbol{\nabla }_\perp \boldsymbol{\cdot }\boldsymbol{M} )=-\boldsymbol{\nabla} ^4_\perp h$
. We emphasise that the sheet is assumed to have a uniform weight: $\mathcal{G}$
is constant. This differs from the experiments of Colasante (Reference Colasante2016) and Weston-Dawkes et al. (Reference Weston-Dawkes, Adibnazari, Hu, Everman, Gravish and Tolley2021), where it is heavier at its centre and may be submitted to an additional pulling force. We have made this choice to isolate the role of elastohydrodynamics without introducing additional complications. Nonetheless, this model is versatile, and non-uniform loading could be studied by prescribing a spatially varying mass distribution
$\mathcal{G}$
is constant. This differs from the experiments of Colasante (Reference Colasante2016) and Weston-Dawkes et al. (Reference Weston-Dawkes, Adibnazari, Hu, Everman, Gravish and Tolley2021), where it is heavier at its centre and may be submitted to an additional pulling force. We have made this choice to isolate the role of elastohydrodynamics without introducing additional complications. Nonetheless, this model is versatile, and non-uniform loading could be studied by prescribing a spatially varying mass distribution $\mathcal{G}(\boldsymbol{x}_\perp )$
, leading also to a spatially varying inertia
$\mathcal{G}(\boldsymbol{x}_\perp )$
, leading also to a spatially varying inertia $\mathcal{I}_{{bv}}(\boldsymbol{x}_\perp )$
, and/or by adding a localised force to (2.6).
$\mathcal{I}_{{bv}}(\boldsymbol{x}_\perp )$
, and/or by adding a localised force to (2.6).
The active forcing behind $f_a$
is harmonic in time and is distributed at the centre of the sheet with a dimensionless radius
$f_a$
is harmonic in time and is distributed at the centre of the sheet with a dimensionless radius $\ell =\tilde {l}/\tilde {R}$
(figure 1). Letting
$\ell =\tilde {l}/\tilde {R}$
(figure 1). Letting $\mathbb H$
the Heaviside function (
$\mathbb H$
the Heaviside function ( $\mathbb H(x)=1$
if
$\mathbb H(x)=1$
if $x\geqslant 0$
,
$x\geqslant 0$
, $=0$
otherwise) and
$=0$
otherwise) and $\alpha =\tilde {F}_a/\tilde {F}_{{bv}}$
the dimensionless strength of the forcing, we have
$\alpha =\tilde {F}_a/\tilde {F}_{{bv}}$
the dimensionless strength of the forcing, we have
 \begin{align} f_a(\boldsymbol{x}_\perp ,t)=\alpha \cos (t) \frac {1-\mathbb H(\lvert \boldsymbol{x}_\perp \rvert -\ell )}{\ell }. \end{align}
With (2.1), the dimensionless numbers in (2.6) read
 \begin{align} \begin{split} \mathcal{I}_{{bv}}&=\frac {\tilde {\rho }_s \tilde {e} \tilde {\omega }^2 \tilde {R}^4}{\tilde {B}} , \quad \mathcal{G} = \frac {\tilde {F}_g}{\tilde {F}_{{bv}}} = \frac {\tilde {\rho }_s \tilde {e} \tilde {g} \tilde {R}^2}{\big (\tilde {\mu } \tilde {\omega } \tilde {B}^{2}\big )^{1/3}}, \quad \alpha =\frac {\tilde {F}_a}{\tilde {F}_{{bv}}}=\frac {\tilde {F}_a}{\big (\tilde {\mu } \tilde {\omega } \tilde {B}^{2}\big )^{1/3}}. \end{split} \end{align}
Finally, as discussed later in § 3.2, we observe that when the forcing and weight both exceed a critical value, the edges of the sheet may contact the wall. To handle this numerically, we introduce a local repulsive force $f_w(h)= (A/h )^n$
,
$f_w(h)= (A/h )^n$
, $n \gt 1$
, modelling an elastic collision with a contact that effectively occurs at the dimensionless height
$n \gt 1$
, modelling an elastic collision with a contact that effectively occurs at the dimensionless height $A\ll 1$
. Indeed,
$A\ll 1$
. Indeed, $f_w$
is conservative, since it derives from the potential
$f_w$
is conservative, since it derives from the potential $A^n h^{1-n}/(n-1)$
, and is only significant for
$A^n h^{1-n}/(n-1)$
, and is only significant for $h\lesssim A$
. The introduction of a short-ranged repulsion is similar to the penalty method commonly employed in contact mechanics (Wriggers Reference Wriggers2006) and in fluid–structure interaction problems (e.g. Glowinski et al. Reference Glowinski, Pan, Hesla, Joseph and Periaux2001).
$h\lesssim A$
. The introduction of a short-ranged repulsion is similar to the penalty method commonly employed in contact mechanics (Wriggers Reference Wriggers2006) and in fluid–structure interaction problems (e.g. Glowinski et al. Reference Glowinski, Pan, Hesla, Joseph and Periaux2001).
2.4. Time scales
To discuss the different physical effects that contribute to the lubrication dynamics, it will prove useful to define characteristic time scales associated with each mechanism. From the viscous lubrication equations (2.4) and (2.5) with ${\textit{Re}}_{{bv}}={{{Sq}}}_{{bv}}=0$
,
${\textit{Re}}_{{bv}}={{{Sq}}}_{{bv}}=0$
, $12\tilde {\mu } \partial \tilde {h}/\partial \tilde {t} = \tilde {\boldsymbol{\nabla }}_\perp \boldsymbol{\cdot }(\tilde {h}^3 \tilde {\boldsymbol{\nabla }}_\perp \tilde {p})$
, a time
$12\tilde {\mu } \partial \tilde {h}/\partial \tilde {t} = \tilde {\boldsymbol{\nabla }}_\perp \boldsymbol{\cdot }(\tilde {h}^3 \tilde {\boldsymbol{\nabla }}_\perp \tilde {p})$
, a time $\tilde {T} = \tilde {\mu } \tilde {R}^2/ (\tilde {H}^2 \tilde {P})$
can be defined with
$\tilde {T} = \tilde {\mu } \tilde {R}^2/ (\tilde {H}^2 \tilde {P})$
can be defined with $\tilde {H}$
a height and
$\tilde {H}$
a height and $\tilde {P}$
the characteristic pressure associated with the mechanism of interest. Considering each effect separately, this defines the following time scales:
$\tilde {P}$
the characteristic pressure associated with the mechanism of interest. Considering each effect separately, this defines the following time scales:
 \begin{align} \mathrm{gravitational}:\,\tilde {T}_g(\tilde {h})=\frac {\tilde {\mu } \tilde {R}^2}{\tilde {\rho }_s \tilde {g} \tilde {e} \tilde {h}^2}; \end{align}
active, $\tilde {T}_a(\tilde {h}) = {\tilde {\mu } \tilde {R}^4}/{(\tilde {F}_a \tilde {h}^2)}$
; elastohydrodynamic,
$\tilde {T}_a(\tilde {h}) = {\tilde {\mu } \tilde {R}^4}/{(\tilde {F}_a \tilde {h}^2)}$
; elastohydrodynamic, $\tilde {T}_{{bv}}(\tilde {h}) = {\tilde {\mu } \tilde {R}^6}/{(\tilde {B} \tilde {h}^3)}$
; compressible,
$\tilde {T}_{{bv}}(\tilde {h}) = {\tilde {\mu } \tilde {R}^6}/{(\tilde {B} \tilde {h}^3)}$
; compressible, $\tilde {T}_c(\tilde {h})={\tilde {\mu } \tilde {R}^2}/({\tilde {p}_a \tilde {h}^2})$
; and inertial,
$\tilde {T}_c(\tilde {h})={\tilde {\mu } \tilde {R}^2}/({\tilde {p}_a \tilde {h}^2})$
; and inertial, $\tilde {T}_i(\tilde {h})={\tilde {\rho }_a \tilde {h}^2}/{\tilde {\mu }}$
. The latter is characteristic of momentum diffusion and is not defined by the same lubrication scaling. While gravity is always present, the effects of elasticity, compressibility and inertia are only relevant when the sheet is forced into motion by the active force. In these cases, we expect the time-averaged and long-term dynamic of the sheet to only depend on even powers of the active force
$\tilde {T}_i(\tilde {h})={\tilde {\rho }_a \tilde {h}^2}/{\tilde {\mu }}$
. The latter is characteristic of momentum diffusion and is not defined by the same lubrication scaling. While gravity is always present, the effects of elasticity, compressibility and inertia are only relevant when the sheet is forced into motion by the active force. In these cases, we expect the time-averaged and long-term dynamic of the sheet to only depend on even powers of the active force $\tilde {F}_a$
, since a change of sign of the force magnitude
$\tilde {F}_a$
, since a change of sign of the force magnitude $\tilde {F}_a$
is equivalent to a phase shift. We therefore define visco-active time scales as the square of the active forcing time scale
$\tilde {F}_a$
is equivalent to a phase shift. We therefore define visco-active time scales as the square of the active forcing time scale $\tilde {T}_a$
divided by the response time scale of the mechanism of interest:
$\tilde {T}_a$
divided by the response time scale of the mechanism of interest:
 \begin{align} \begin{split} \text{elastohydrodynamic,}\;\tilde {T}_{{a},\textit{bv}}(\tilde {h}) &= \frac {\tilde {T}_a^2(\tilde {h})}{\tilde {T}_{{bv}}(\tilde {h})}=\frac {\tilde {\mu } \tilde {R}^2 \tilde {B}}{\tilde {F}_a^2 \tilde {h}}; \\[-3pt] \text{inertial,}\; \tilde {T}_{{a,i}}(\tilde {h})=\frac {\tilde {T}_a^2(\tilde {h})}{\tilde {T}_{i}(\tilde {h})}=\frac {\tilde {\mu }^3 \tilde {R}^8}{\tilde {F}_a^2 \tilde {\rho }_a \tilde {h}^6}; \quad & \text{compressible,}\;\tilde {T}_{{a,c}}(\tilde {h}) = \frac {\tilde {T}_a^2(\tilde {h})}{\tilde {T}_{c}(\tilde {h})}=\frac {\tilde {\mu } \tilde {R}^6 \tilde {p}_a }{\tilde {F}_a^2 \tilde {h}^2}. \end{split} \end{align}
2.5. Boundary conditions
The edges of the elastic sheet are free of bending moment, twisting moment and shear force. The appropriate boundary conditions are (Naghdi Reference Naghdi1973, p. 586)
 \begin{align} \boldsymbol{M} \boldsymbol{e_r} \boldsymbol{\cdot }\boldsymbol{e_r}= 0, \quad \left (\boldsymbol{\nabla }_\perp \boldsymbol{\cdot }\boldsymbol{M} \right )\boldsymbol{\cdot }\boldsymbol{e_r} + \boldsymbol{\nabla }_\perp \left ( \boldsymbol{M} \boldsymbol{e_r} \boldsymbol{\cdot }\boldsymbol{e_\theta }\right )\boldsymbol{\cdot }\boldsymbol{e_\theta }=0, \end{align}
where $\boldsymbol{e_r}$
is the outward unit normal at the edge of the sheet and
$\boldsymbol{e_r}$
is the outward unit normal at the edge of the sheet and $\boldsymbol{e_\theta }$
is the unit tangent. As the third and final boundary condition, we set the pressure at the edges of the sheet as
$\boldsymbol{e_\theta }$
is the unit tangent. As the third and final boundary condition, we set the pressure at the edges of the sheet as
 \begin{align} p= \begin{cases} 0\,&\text{if} \quad \boldsymbol{q} \boldsymbol{\cdot }\boldsymbol{e}_r \gt 0\ \text{(outflow)}, \\ - \dfrac {k}{2} {Re}_{{bv}}\left (\dfrac {\boldsymbol{q} \boldsymbol{\cdot }\boldsymbol{e}_r }{h}\right )^2\,&\text{if} \quad \boldsymbol{q} \boldsymbol{\cdot }\boldsymbol{e}_r \lt 0 \ \text{(inflow)} ,\end{cases} \end{align}
with $k=1/2$
, a loss coefficient. This boundary condition models the pressure loss when fluid enters the thin gap; it is justified and discussed in more detail in Appendix B. In the inertialess case
$k=1/2$
, a loss coefficient. This boundary condition models the pressure loss when fluid enters the thin gap; it is justified and discussed in more detail in Appendix B. In the inertialess case ${\textit{Re}}_{{bv}}=0$
, (2.11) simplifies to the classical condition
${\textit{Re}}_{{bv}}=0$
, (2.11) simplifies to the classical condition $p=0$
, which imposes the ambient pressure at the edges.
$p=0$
, which imposes the ambient pressure at the edges.
2.6. Numerical model
We have formulated the governing equations (2.4a
), (2.5), (2.6), and boundary conditions (2.10) and (2.11) for a two-dimensional (2-D) sheet for completeness. For purely viscous flows, we have shown (Poulain et al. Reference Poulain, Koch, Mahadevan and Carlson2025) that there are no qualitative differences between the one-dimensional (1-D) and 2-D axisymmetric situations. Accordingly, we restrict the present study to 1-D for simplicity: $\boldsymbol{x}_\perp \rightarrow x$
and
$\boldsymbol{x}_\perp \rightarrow x$
and $\partial /\partial y=0$
. We solve the governing equations in conservative form
$\partial /\partial y=0$
. We solve the governing equations in conservative form
 \begin{align} {\frac {\partial \boldsymbol{S}}{\partial t}} + {\frac {\partial \boldsymbol{F}}{\partial x}} = \boldsymbol{Q}, \end{align}
with
 \begin{align} \begin{array}{lllccccccr} \boldsymbol{S}(\boldsymbol{U}) = & \Big[\rho h, & \mathcal{I}_{{bv}} v, & 0, & \dfrac {6{Re}_{{bv}}}{5}u, & h \Big], \\[9pt] \boldsymbol{F}(\boldsymbol{U}) = & \Big[ 0, & -\dfrac {\partial m}{\partial x}, & -\dfrac {\partial h}{\partial x}, & \dfrac {27}{35}{Re}_{{bv}} u^2 + p, & hu \Big], \\[9pt] \boldsymbol{Q}(\boldsymbol{U}) = & \Big[ \rho v, & p + f_a(x,t)+\mathcal{G} + f_w(h), & m, & -\dfrac {12u}{h^2} + \dfrac {6}{35}{Re}_{{bv}}\dfrac {uv}{h}, & 0 \Big], \end{array} \end{align}
and the five primary unknowns $\boldsymbol{U}= [v, m, h, u, p]$
, representing the vertical sheet velocity
$\boldsymbol{U}= [v, m, h, u, p]$
, representing the vertical sheet velocity $v={\partial h}/{\partial t}$
, bending moment
$v={\partial h}/{\partial t}$
, bending moment $m=- \partial ^2 h/\partial x^2$
, height
$m=- \partial ^2 h/\partial x^2$
, height $h$
, average horizontal fluid velocity
$h$
, average horizontal fluid velocity $u=q/h$
and fluid pressure
$u=q/h$
and fluid pressure $p$
. We note that
$p$
. We note that $\rho =1+{Sq}_{{bv}} p$
.
$\rho =1+{Sq}_{{bv}} p$
.
We consider a domain $x \in [0,1]$
with symmetric boundary conditions at
$x \in [0,1]$
with symmetric boundary conditions at $x=0$
and the appropriate boundary conditions at
$x=0$
and the appropriate boundary conditions at $x=1$
:
$x=1$
:
 \begin{align} m = 0, \quad {\frac {\partial m}{\partial x}} = 0, \quad p&= \begin{cases} 0\,&\text{if}\,u \geqslant 0, \\ - k{Re}_{{bv}} u^2/2\,&\text{if}\,u \lt 0. \end{cases} \end{align}
We solve (2.12) using the DuMu $^x$
library (Koch, Weishaupt & Gläser Reference Koch, Weishaupt and Gläser2021). We discretise space using a staggered finite volume scheme, where pressure unknowns are located at cell centres and other unknowns are located at vertices. This set-up avoids checkerboard oscillations in the fluid pressure. The flux term in
$^x$
library (Koch, Weishaupt & Gläser Reference Koch, Weishaupt and Gläser2021). We discretise space using a staggered finite volume scheme, where pressure unknowns are located at cell centres and other unknowns are located at vertices. This set-up avoids checkerboard oscillations in the fluid pressure. The flux term in $u^2$
is treated with a first-order upwind scheme. The equations are advanced in time using a diagonally implicit third-order Runge–Kutta scheme (Alexander Reference Alexander1977, Thm. 5) and the nonlinear system at each Runge–Kutta stage is solved with Newton’s method. Lower-order methods either yielded unsatisfactory accuracy or required excessively small time step sizes. We used time step sizes
$u^2$
is treated with a first-order upwind scheme. The equations are advanced in time using a diagonally implicit third-order Runge–Kutta scheme (Alexander Reference Alexander1977, Thm. 5) and the nonlinear system at each Runge–Kutta stage is solved with Newton’s method. Lower-order methods either yielded unsatisfactory accuracy or required excessively small time step sizes. We used time step sizes $10^{-4} \leqslant \Delta t \leqslant 0.2$
and spatial step sizes
$10^{-4} \leqslant \Delta t \leqslant 0.2$
and spatial step sizes $0.002\leqslant \Delta x \leqslant 0.02$
. The numerical simulations have been run to a time-averaged steady state – which could take from
$0.002\leqslant \Delta x \leqslant 0.02$
. The numerical simulations have been run to a time-averaged steady state – which could take from $t=\mathcal{O}({10})$
up to
$t=\mathcal{O}({10})$
up to $t=\mathcal{O}({10^6})$
depending on the parameters – or until the height diverged. We systematically ensured that any divergence of the numerical solution was independent of the numerical parameters and therefore corresponded to adhesion failure. For initial conditions, we considered a flat sheet,
$t=\mathcal{O}({10^6})$
depending on the parameters – or until the height diverged. We systematically ensured that any divergence of the numerical solution was independent of the numerical parameters and therefore corresponded to adhesion failure. For initial conditions, we considered a flat sheet, $\boldsymbol{U}(x,t=0)=[0, 0, h(x,t=0), 0, 0]$
, with
$\boldsymbol{U}(x,t=0)=[0, 0, h(x,t=0), 0, 0]$
, with $h(x,t=0)$
a constant. For large values of
$h(x,t=0)$
a constant. For large values of $\alpha$
and
$\alpha$
and $\mathcal{G}$
, this initialisation sometimes leads to divergence, even though a time-averaged steady state exists. In these cases, we initialised the simulation using the steady-state solution from a run with the same
$\mathcal{G}$
, this initialisation sometimes leads to divergence, even though a time-averaged steady state exists. In these cases, we initialised the simulation using the steady-state solution from a run with the same $\alpha$
but smaller
$\alpha$
but smaller $\mathcal{G}$
(numerical continuation). The repulsion force was either turned off (
$\mathcal{G}$
(numerical continuation). The repulsion force was either turned off ( $A=0$
) or, when needed, chosen as
$A=0$
) or, when needed, chosen as $f_w(h)= (A/h )^n$
with
$f_w(h)= (A/h )^n$
with $A=10^{-5}$
and
$A=10^{-5}$
and $n=5$
. We have verified that this choice does not significantly affect the results as long as
$n=5$
. We have verified that this choice does not significantly affect the results as long as $A$
is small and
$A$
is small and $n$
is large.
$n$
is large.
2.7. Choice of dimensionless parameters
Equations (2.4b
), (2.5) and (2.6) depend on five dimensionless numbers defined in (2.1) and (2.8), with $\varepsilon _{{bv}}$
not appearing in the governing equations and
$\varepsilon _{{bv}}$
not appearing in the governing equations and $\ell$
defined in (2.7). They are summarised in table 1. Since dimensional quantities such as the sheet’s bending rigidity
$\ell$
defined in (2.7). They are summarised in table 1. Since dimensional quantities such as the sheet’s bending rigidity $\tilde {B}$
or the excitation frequency
$\tilde {B}$
or the excitation frequency $\tilde {\omega }$
enter multiple dimensionless groups, independently varying them in experiments is not feasible. Nevertheless, numerical simulations enable us to disentangle the respective roles of the dimensionless numbers in the dynamics and to clarify the underlying physical mechanisms they influence. We consider a uniform sheet with a uniformly distributed weight:
$\tilde {\omega }$
enter multiple dimensionless groups, independently varying them in experiments is not feasible. Nevertheless, numerical simulations enable us to disentangle the respective roles of the dimensionless numbers in the dynamics and to clarify the underlying physical mechanisms they influence. We consider a uniform sheet with a uniformly distributed weight: $\mathcal{I}_{{bv}}$
and
$\mathcal{I}_{{bv}}$
and $\mathcal{G}$
are constants. We also consider the limit where the forcing is localised at a single point,
$\mathcal{G}$
are constants. We also consider the limit where the forcing is localised at a single point, $\ell \rightarrow 0$
; in practice, we set
$\ell \rightarrow 0$
; in practice, we set $\ell =0.05$
in our numerical simulations. The effect of a finite
$\ell =0.05$
in our numerical simulations. The effect of a finite $\ell$
and a sheet locally rigid at its centre has already been discussed in prior work (Poulain et al. Reference Poulain, Koch, Mahadevan and Carlson2025).
$\ell$
and a sheet locally rigid at its centre has already been discussed in prior work (Poulain et al. Reference Poulain, Koch, Mahadevan and Carlson2025).
Characteristic scales and dimensionless parameters.

To guide our study, we consider the experiments of Weston-Dawkes et al. (Reference Weston-Dawkes, Adibnazari, Hu, Everman, Gravish and Tolley2021), who report a time-averaged equilibrium height (figure 1 $b$
)
$b$
)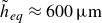 $\tilde {h}_{{eq}} \approx 600\,\unicode{x03BC}\mathrm{m}$
for a sheet of thickness
$\tilde {h}_{{eq}} \approx 600\,\unicode{x03BC}\mathrm{m}$
for a sheet of thickness $\tilde {e} \approx 300\,\unicode{x03BC}\mathrm{m}$
, Young’s modulus
$\tilde {e} \approx 300\,\unicode{x03BC}\mathrm{m}$
, Young’s modulus $\tilde {E} \approx 3\,\mathrm{GPa}$
, radius
$\tilde {E} \approx 3\,\mathrm{GPa}$
, radius $\tilde {R} \simeq 10\,\mathrm{cm}$
, vibrating at frequency
$\tilde {R} \simeq 10\,\mathrm{cm}$
, vibrating at frequency $\tilde {\omega } = 2\pi \times 200\,\mathrm{Hz}$
and supporting a weight
$\tilde {\omega } = 2\pi \times 200\,\mathrm{Hz}$
and supporting a weight $\tilde {W} \approx 5\,\mathrm{N}$
. The density ratio between the sheet and air is
$\tilde {W} \approx 5\,\mathrm{N}$
. The density ratio between the sheet and air is $\tilde {\rho }_s/\tilde {\rho }_a\approx 10^3$
. The vibrations are generated by an eccentric rotating mass motor, with an estimated mass
$\tilde {\rho }_s/\tilde {\rho }_a\approx 10^3$
. The vibrations are generated by an eccentric rotating mass motor, with an estimated mass $\tilde {m} \approx 0.6\,\mathrm{g}$
and gyration radius
$\tilde {m} \approx 0.6\,\mathrm{g}$
and gyration radius $\tilde {r} \approx 1\,\mathrm{mm}$
, yielding a driving force
$\tilde {r} \approx 1\,\mathrm{mm}$
, yielding a driving force $\tilde {F}_a=\tilde {m} \tilde {r} \tilde {\omega }^2$
. This gives a dimensionless forcing strength
$\tilde {F}_a=\tilde {m} \tilde {r} \tilde {\omega }^2$
. This gives a dimensionless forcing strength $\alpha =\tilde {F}_a/\tilde {F}_{{bv}}\approx 90$
. While this is overestimated due to the rigid central support (Poulain et al. Reference Poulain, Koch, Mahadevan and Carlson2025), it nevertheless suggests that the regime
$\alpha =\tilde {F}_a/\tilde {F}_{{bv}}\approx 90$
. While this is overestimated due to the rigid central support (Poulain et al. Reference Poulain, Koch, Mahadevan and Carlson2025), it nevertheless suggests that the regime $\alpha =\mathcal{O}({10})$
is relevant experimentally.
$\alpha =\mathcal{O}({10})$
is relevant experimentally.
From the above-mentioned parameters, the height scale is $\tilde {H}_{{bv}} \approx 14\,\mathrm{mm}$
, while the dimensionless equilibrium height is only a small fraction of this value:
$\tilde {H}_{{bv}} \approx 14\,\mathrm{mm}$
, while the dimensionless equilibrium height is only a small fraction of this value: $h_{{eq}}=\tilde {h}_{{eq}}/\tilde {H}_{{bv}} \approx 0.04$
. Our theoretical and numerical analysis will recover this observation. However, this shows that the dimensionless numbers based on
$h_{{eq}}=\tilde {h}_{{eq}}/\tilde {H}_{{bv}} \approx 0.04$
. Our theoretical and numerical analysis will recover this observation. However, this shows that the dimensionless numbers based on $\tilde {H}_{{bv}}$
, such as
$\tilde {H}_{{bv}}$
, such as $ \textit{Re}_{{bv}}$
,
$ \textit{Re}_{{bv}}$
, ${Sq}_{{bv}}$
and
${Sq}_{{bv}}$
and $\mathcal{I}_{{bv}}$
, which allow for a compact theoretical description of the system dynamics, are not accurate indicators of the relative effect of fluid inertia, fluid compressibility or solid inertia when the system is at equilibrium height. Hence, we additionally define dimensionless numbers using
$\mathcal{I}_{{bv}}$
, which allow for a compact theoretical description of the system dynamics, are not accurate indicators of the relative effect of fluid inertia, fluid compressibility or solid inertia when the system is at equilibrium height. Hence, we additionally define dimensionless numbers using $\tilde {h}_{{eq}}$
as the vertical scale:
$\tilde {h}_{{eq}}$
as the vertical scale:
 \begin{align} {Re}_{{eq}} = \frac {\tilde {\rho }_a \tilde {\omega } \tilde {h}_{{eq}}^2}{\tilde {\mu }}=h_{{eq}}^2 {Re}_{{bv}}, \quad {{{Sq}}}_{{eq}}=\frac {\tilde {\mu } \tilde {\omega } \tilde {R}^2}{\tilde {h}_{{eq}}^2 \tilde {p}_a} = h_{{eq}}^{-2} {Sq}_{{bv}}, \quad \mathcal{I}_{{eq}}=\frac {\tilde {\rho }_s\tilde {e} \tilde {h}_{{eq}}^3 \tilde {\omega }}{\tilde {\mu } \tilde {R}^2}=h_{{eq}}^{3}\mathcal{I}_{{bv}}. \end{align}
Unlike the original dimensionless groups, these quantities cannot be computed a priori since $\tilde {h}_{{eq}}$
is selected by the system and is initially unknown. The experimental values yield
$\tilde {h}_{{eq}}$
is selected by the system and is initially unknown. The experimental values yield $\alpha =\mathcal{O}({10})$
and we systematically vary
$\alpha =\mathcal{O}({10})$
and we systematically vary $\alpha$
in § 3. The Reynolds number is
$\alpha$
in § 3. The Reynolds number is $ \textit{Re}_{{eq}} \approx 30$
, indicating that fluid inertia may play a significant role, studied in § 4. We also note that in some of the experiments of Weston-Dawkes et al. (Reference Weston-Dawkes, Adibnazari, Hu, Everman, Gravish and Tolley2021), when the sheet is steadily pulled instead of equilibrating under a constant load, the central height can reach up to 3 mm, corresponding to Reynolds numbers of several hundred. This further highlights the importance of understanding inertial effects from the surrounding fluid. The parameter controlling solid inertia, however, is smaller,
$ \textit{Re}_{{eq}} \approx 30$
, indicating that fluid inertia may play a significant role, studied in § 4. We also note that in some of the experiments of Weston-Dawkes et al. (Reference Weston-Dawkes, Adibnazari, Hu, Everman, Gravish and Tolley2021), when the sheet is steadily pulled instead of equilibrating under a constant load, the central height can reach up to 3 mm, corresponding to Reynolds numbers of several hundred. This further highlights the importance of understanding inertial effects from the surrounding fluid. The parameter controlling solid inertia, however, is smaller, $\mathcal{I}_{{eq}} \approx 0.6$
, suggesting a weaker yet potentially non-negligible effect of solid inertia. In this study, we focus on the influence of fluid effects and leave a systematic investigation of solid inertia for future work. A related investigation into the coupling between solid inertia and elastohydrodynamics can be found in Ramanarayanan & Sánchez (Reference Ramanarayanan and Sánchez2024). Finally, although
$\mathcal{I}_{{eq}} \approx 0.6$
, suggesting a weaker yet potentially non-negligible effect of solid inertia. In this study, we focus on the influence of fluid effects and leave a systematic investigation of solid inertia for future work. A related investigation into the coupling between solid inertia and elastohydrodynamics can be found in Ramanarayanan & Sánchez (Reference Ramanarayanan and Sánchez2024). Finally, although ${{{Sq}}}_{{eq}}\approx 0.006$
, we show in § 5 that compressibility could still noticeably affect the dynamics even for small squeeze numbers.
${{{Sq}}}_{{eq}}\approx 0.006$
, we show in § 5 that compressibility could still noticeably affect the dynamics even for small squeeze numbers.
3. Incompressible and inertialess analysis
3.1. Weak active forcing ( $\alpha \lesssim 1$
)
$\alpha \lesssim 1$
)

Asymptotic results for $\alpha \lesssim 1$
,
$\alpha \lesssim 1$
, $\mathcal{I}_{{bv}}={Re}_{{bv}}={Sq}_{{bv}}=0$
, adapted from Poulain et al. (Reference Poulain, Koch, Mahadevan and Carlson2025).
$\mathcal{I}_{{bv}}={Re}_{{bv}}={Sq}_{{bv}}=0$
, adapted from Poulain et al. (Reference Poulain, Koch, Mahadevan and Carlson2025). $(a)$
Schematic illustration of the link between the active force direction and the sheet’s convexity.
$(a)$
Schematic illustration of the link between the active force direction and the sheet’s convexity. $(b)$
Equilibrium height
$(b)$
Equilibrium height $h_{{eq}}$
as a function of the the rescaled dimensionless weight
$h_{{eq}}$
as a function of the the rescaled dimensionless weight $\mathcal{G}/\alpha ^2$
. Symbols are results from numerical simulations, the lines are the prediction of (3.2) obtained by numerical continuation (with a cutoff
$\mathcal{G}/\alpha ^2$
. Symbols are results from numerical simulations, the lines are the prediction of (3.2) obtained by numerical continuation (with a cutoff $N=5$
). For
$N=5$
). For $\mathcal{G}/\alpha ^2\gt \mathcal{G}_{\textit{max}}/\alpha ^2\simeq 0.137$
, no equilibrium is possible and the sheet always detaches from the substrate (greyed area).
$\mathcal{G}/\alpha ^2\gt \mathcal{G}_{\textit{max}}/\alpha ^2\simeq 0.137$
, no equilibrium is possible and the sheet always detaches from the substrate (greyed area).

We first consider the regime for which inertia and compressibility are negligible, $\mathcal{I}_{{bv}}={Re}_{{bv}}={Sq}_{{bv}}=0$
, so that the dynamics is solely governed by viscous elastohydrodynamic interactions. Then, the governing equations (2.4) and (2.5) simplify to the Reynolds equation
$\mathcal{I}_{{bv}}={Re}_{{bv}}={Sq}_{{bv}}=0$
, so that the dynamics is solely governed by viscous elastohydrodynamic interactions. Then, the governing equations (2.4) and (2.5) simplify to the Reynolds equation
 \begin{align} 12{\frac {\partial h}{\partial t}}-\boldsymbol{\nabla }_\perp \boldsymbol{\cdot }\big (h^3 \boldsymbol{\nabla }_\perp p\big )=0. \end{align}
We have already studied this regime (Poulain et al. Reference Poulain, Koch, Mahadevan and Carlson2025) in the limit $\alpha \lesssim 1$
. More precisely, we used an asymptotic expansion to
$\alpha \lesssim 1$
. More precisely, we used an asymptotic expansion to $\mathcal{O}({\alpha ^2})$
and found the results valid up to
$\mathcal{O}({\alpha ^2})$
and found the results valid up to $\alpha \simeq 1$
. In short, when periodic vibrations drive an elastic sheet at its centre, it tends to adhere to a nearby surface due to the coupling between its elastic deformation and the lubrication flow in the intervening gap. As the sheet is pushed towards the surface, it adopts a convex shape that favours fluid outflow; while when it is pulled away from the surface, it adopts a concave shape that resists inflow (figure 2
$\alpha \simeq 1$
. In short, when periodic vibrations drive an elastic sheet at its centre, it tends to adhere to a nearby surface due to the coupling between its elastic deformation and the lubrication flow in the intervening gap. As the sheet is pushed towards the surface, it adopts a convex shape that favours fluid outflow; while when it is pulled away from the surface, it adopts a concave shape that resists inflow (figure 2 $a$
). This asymmetry in the flow response over a period of oscillation results in a net outflow, leading to a time-averaged attraction towards the surface. This symmetry breaking can be traced back to the non-time-reversible pressure distribution in a rigid squeeze film (as shown later in figure 7
$a$
). This asymmetry in the flow response over a period of oscillation results in a net outflow, leading to a time-averaged attraction towards the surface. This symmetry breaking can be traced back to the non-time-reversible pressure distribution in a rigid squeeze film (as shown later in figure 7 $b$
). When the soft sheet deforms under this pressure, its kinematics inherit the irreversibility, so that the dynamics is no longer constrained by the scallop theorem (Purcell Reference Purcell1977; Lauga Reference Lauga2011). The resulting rectified flow can then counteract the sheet’s weight and give rise to an equilibrium hovering height. We have used these insights to study the system analytically and present the conclusions of our analysis in the following. We refer the reader to Appendix C for further details on the underlying assumptions and to Poulain et al. (Reference Poulain, Koch, Mahadevan and Carlson2025) for the complete derivation. In short, the height
$b$
). When the soft sheet deforms under this pressure, its kinematics inherit the irreversibility, so that the dynamics is no longer constrained by the scallop theorem (Purcell Reference Purcell1977; Lauga Reference Lauga2011). The resulting rectified flow can then counteract the sheet’s weight and give rise to an equilibrium hovering height. We have used these insights to study the system analytically and present the conclusions of our analysis in the following. We refer the reader to Appendix C for further details on the underlying assumptions and to Poulain et al. (Reference Poulain, Koch, Mahadevan and Carlson2025) for the complete derivation. In short, the height $h(x,t)$
is decomposed into spatial eigenmodes (we note that similar modal expansion have recently been used in related problems (Papanicolaou & Christov Reference Papanicolaou and Christov2025)), and an asymptotic analysis allows to find an evolution equation for time-averaged height
$h(x,t)$
is decomposed into spatial eigenmodes (we note that similar modal expansion have recently been used in related problems (Papanicolaou & Christov Reference Papanicolaou and Christov2025)), and an asymptotic analysis allows to find an evolution equation for time-averaged height $\langle h_0 \rangle (t) = \int _t^{t+2\pi }h(x=0,t')\,{\mathrm{d}}t'$
at
$\langle h_0 \rangle (t) = \int _t^{t+2\pi }h(x=0,t')\,{\mathrm{d}}t'$
at $\mathcal{O}({\alpha ^2})$
:
$\mathcal{O}({\alpha ^2})$
:
 \begin{align} \begin{split} \frac {1}{\alpha ^2 \langle h_0\rangle ^2} \frac {{\mathrm{d}}\langle h_0\rangle }{{\mathrm{d}}t}&= \frac {1}{4}\frac {\mathcal{G}}{\alpha ^2} \langle h_0\rangle - d_0 + \sum _{i,j=1}^{\infty } d_{\textit{ij}} g_{\textit{ij}}\left (\langle h_0 \rangle \right ),\\\quad g_{\textit{ij}}(h)&= \frac {1+\left (\dfrac {h}{\sqrt {e_ie_{\kern-1pt j}}}\right )^6}{\left (1+\left (\dfrac {h}{e_i}\right )^6\right )\left (1+\left (\dfrac {h}{e_{\kern-1.5pt j}}\right )^6\right )}, \quad e_i = \frac {0.242}{i^2}. \end{split} \end{align}
In dimensional units, this can be expressed compactly using the gravitational time scale $\tilde {T}_g$
and the active elastohydrodynamic time scale
$\tilde {T}_g$
and the active elastohydrodynamic time scale $\tilde {T}_{{a,bv}}$
introduced in (2.9):
$\tilde {T}_{{a,bv}}$
introduced in (2.9):
 \begin{align} \frac {{\mathrm{d}}\langle \tilde {h}_0\rangle }{{\mathrm{d}}\tilde {t}}=\frac {\langle \tilde {h}_0 \rangle }{4\tilde {T}_g\left (\langle \tilde {h}_0 \rangle \right )} + \frac {\langle \tilde {h}_0 \rangle }{\tilde {T}_{{a,bv}}\left (\langle \tilde {h}_0 \rangle \right )}\left [ -d_0 + \sum _{i,j=1}^{\infty } d_{\textit{ij}} g_{\textit{ij}}\left (\frac {\langle \tilde {h}_0 \rangle }{\tilde {H}_{{bv}}}\right )\right ]\!. \end{align}
The first two terms on the right-hand side of (3.2) correspond respectively to the effect of gravity, with $\mathcal{G}/\alpha ^2 = \mathcal{O}({1})$
, and to the first-order effect of elastohydrodynamics, with
$\mathcal{G}/\alpha ^2 = \mathcal{O}({1})$
, and to the first-order effect of elastohydrodynamics, with $d_0=0.0122$
. The third term corresponds to the effects of the eigenmodes
$d_0=0.0122$
. The third term corresponds to the effects of the eigenmodes $\zeta _i$
(shown in figure 11) on the dynamics, with the
$\zeta _i$
(shown in figure 11) on the dynamics, with the $e_i=0.242/i^2$
characteristic heights below which the
$e_i=0.242/i^2$
characteristic heights below which the $i$
th spatial mode
$i$
th spatial mode $\zeta _i$
is excited. This means that we predict higher-order excitation modes as the sheet approaches the wall. The
$\zeta _i$
is excited. This means that we predict higher-order excitation modes as the sheet approaches the wall. The $d_{\textit{ij}}$
are numerical coefficients of the symmetric matrix
$d_{\textit{ij}}$
are numerical coefficients of the symmetric matrix $d_{\textit{ij}}$
characterising the strength of the effect of mode
$d_{\textit{ij}}$
characterising the strength of the effect of mode $i$
(
$i$
( $i=j$
) or of the coupling between modes
$i=j$
) or of the coupling between modes $i$
and
$i$
and $j$
on the dynamics; their values are given in Appendix C.
$j$
on the dynamics; their values are given in Appendix C. $(a)$
Illustration of the decomposition (3.3) of the sheet’s shape into a rigid-body translation
$(a)$
Illustration of the decomposition (3.3) of the sheet’s shape into a rigid-body translation $\bar h(t)-h_{{eq}}$
, a static shape
$\bar h(t)-h_{{eq}}$
, a static shape $\langle h \rangle (x)$
(independent of time at the time-averaged steady state) and a time-periodic deformation
$\langle h \rangle (x)$
(independent of time at the time-averaged steady state) and a time-periodic deformation $h_d(x,t)$
.
$h_d(x,t)$
. $(b{,}c{,}d)$
Time-averaged shape
$(b{,}c{,}d)$
Time-averaged shape $\langle h \rangle$
and the periodic deformation
$\langle h \rangle$
and the periodic deformation $h_d$
for
$h_d$
for $G=0.02,\,0.04,\,0.06$
, respectively, and
$G=0.02,\,0.04,\,0.06$
, respectively, and $\alpha =1$
,
$\alpha =1$
, $\mathcal{I}_{{bv}}={{Re}}_{{bv}}={{{Sq}}}_{{bv}}=0$
. These are obtained from numerical simulations at the time-averaged steady state.
$\mathcal{I}_{{bv}}={{Re}}_{{bv}}={{{Sq}}}_{{bv}}=0$
. These are obtained from numerical simulations at the time-averaged steady state. $h_d$
is shown at various times of one vibration cycle, with scale bars showing the amplitude of the deformations. As
$h_d$
is shown at various times of one vibration cycle, with scale bars showing the amplitude of the deformations. As $G$
and correspondingly
$G$
and correspondingly $h_{{eq}}$
decrease, higher-order vibration modes are excited.
$h_{{eq}}$
decrease, higher-order vibration modes are excited.

The bifurcation diagram of (3.2) is shown in figure 2 $(b)$
. If the rescaled weight is too large,
$(b)$
. If the rescaled weight is too large, $\mathcal{G}\gt \mathcal{G}_{\textit{max}}=0.137 \alpha ^2$
, there is no equilibrium and the sheet fails to adhere: gravity overcomes the adhesive elastohydrodynamic effect and
$\mathcal{G}\gt \mathcal{G}_{\textit{max}}=0.137 \alpha ^2$
, there is no equilibrium and the sheet fails to adhere: gravity overcomes the adhesive elastohydrodynamic effect and $\langle h_0 \rangle \rightarrow \infty$
. For
$\langle h_0 \rangle \rightarrow \infty$
. For $0\lt \mathcal{G}\lt \mathcal{G}_{\textit{max}}$
, the sheet finds an equilibrium near the wall,
$0\lt \mathcal{G}\lt \mathcal{G}_{\textit{max}}$
, the sheet finds an equilibrium near the wall, $\langle h_0 \rangle \rightarrow h_{{eq}}$
. We show in figure 2
$\langle h_0 \rangle \rightarrow h_{{eq}}$
. We show in figure 2 $(b)$
that numerical simulations of the governing equations (2.6) and (3.1) agree remarkably well with the bifurcation diagram of the reduced model (3.2) for
$(b)$
that numerical simulations of the governing equations (2.6) and (3.1) agree remarkably well with the bifurcation diagram of the reduced model (3.2) for $\alpha \lesssim 1$
.
$\alpha \lesssim 1$
.
To study the sheet’s deformations numerically, we consider the time-averaged equilibrium and let
 \begin{align} h(x,t)=h_d(x,t)+\langle h\rangle (x,t) + \bar h(t)-h_{{eq}}, \end{align}
where $\langle h \rangle (x,t)=(1/2\pi )\int _t^{t+2\pi } h(x,t')\,{\mathrm{d}}t'$
is the time average (independent of time once a time-averaged steady state is reached),
$\langle h \rangle (x,t)=(1/2\pi )\int _t^{t+2\pi } h(x,t')\,{\mathrm{d}}t'$
is the time average (independent of time once a time-averaged steady state is reached), $\bar h (t)=(1/2) \int _{-1}^{1} h(x',t)\,{\mathrm{d}}x'$
is the spatial average, and
$\bar h (t)=(1/2) \int _{-1}^{1} h(x',t)\,{\mathrm{d}}x'$
is the spatial average, and $h_{{eq}}=\langle \bar h \rangle$
the time- and space-averaged height. The function
$h_{{eq}}=\langle \bar h \rangle$
the time- and space-averaged height. The function $h_d(x,t)$
then represents the periodic deformations to the static shape
$h_d(x,t)$
then represents the periodic deformations to the static shape $\langle h \rangle (x)$
, with
$\langle h \rangle (x)$
, with $\langle h_d \rangle = \bar h_d = 0$
. The decomposition (3.3) is illustrated in figure 3, where we also show that higher-order modes of deformation are indeed excited as
$\langle h_d \rangle = \bar h_d = 0$
. The decomposition (3.3) is illustrated in figure 3, where we also show that higher-order modes of deformation are indeed excited as $\mathcal{G}/\alpha ^2$
and
$\mathcal{G}/\alpha ^2$
and $h_{{eq}}$
decrease.
$h_{{eq}}$
decrease.
Finally, our analysis shows that for $\alpha \lesssim 1$
, the maximum supported weight
$\alpha \lesssim 1$
, the maximum supported weight $\mathcal{G}_{\textit{max}}$
scales as
$\mathcal{G}_{\textit{max}}$
scales as $\alpha ^2$
. Coming back to dimensional quantities gives
$\alpha ^2$
. Coming back to dimensional quantities gives $\tilde {W}_{\textit{max}} \sim \tilde {F}_a^2/\tilde {F}_{{bv}}$
. This predicts that for a given forcing amplitude
$\tilde {W}_{\textit{max}} \sim \tilde {F}_a^2/\tilde {F}_{{bv}}$
. This predicts that for a given forcing amplitude $\tilde {F}_a$
, an increasingly soft sheet would sustain arbitrarily large weights
$\tilde {F}_a$
, an increasingly soft sheet would sustain arbitrarily large weights $\tilde {W}_{\textit{max}}$
. However, as the sheet becomes softer (
$\tilde {W}_{\textit{max}}$
. However, as the sheet becomes softer ( $\tilde {F}_{{bv}}$
decreases),
$\tilde {F}_{{bv}}$
decreases), $\alpha =\tilde {F}_a/\tilde {F}_{{bv}}$
increases and cannot be considered small anymore. We study this second regime next.
$\alpha =\tilde {F}_a/\tilde {F}_{{bv}}$
increases and cannot be considered small anymore. We study this second regime next.
3.2. Strong active forcing (
$\alpha \gg 1$
)

3.2.1. Contactless adhesion – maximum supported weight
Varying active forcing $\alpha$
for an inertialess and incompressible system,
$\alpha$
for an inertialess and incompressible system, $\mathcal{I}_{{bv}}={{Re}}_{{bv}}={{{Sq}}}_{{bv}}=0$
.
$\mathcal{I}_{{bv}}={{Re}}_{{bv}}={{{Sq}}}_{{bv}}=0$
. $(a{,}b)$
Equilibrium height as a function of the dimensionless weight. Open symbols represent cases where contact occurs at the edges of the sheet.
$(a{,}b)$
Equilibrium height as a function of the dimensionless weight. Open symbols represent cases where contact occurs at the edges of the sheet. $(c)$
Regime map showing the three different possibilities (adhesion with or without edge contact, and adhesion failure) as a function of the dimensionless weight and forcing. The solid line represents the prediction
$(c)$
Regime map showing the three different possibilities (adhesion with or without edge contact, and adhesion failure) as a function of the dimensionless weight and forcing. The solid line represents the prediction $\mathcal{G}_{\textit{max}}=0.137\alpha ^2$
derived for
$\mathcal{G}_{\textit{max}}=0.137\alpha ^2$
derived for $\alpha \ll 1$
, and the dashed line is the interpolation (3.4). The inset is a zoom near the origin on a logarithmic scale. (d) Regime maps from (3.4) as
$\alpha \ll 1$
, and the dashed line is the interpolation (3.4). The inset is a zoom near the origin on a logarithmic scale. (d) Regime maps from (3.4) as $\tilde {F}_a$
varies for fixed
$\tilde {F}_a$
varies for fixed $\tilde {F}_{{bv}}$
(left), and
$\tilde {F}_{{bv}}$
(left), and $\tilde {F}_{{bv}}$
varies for fixed
$\tilde {F}_{{bv}}$
varies for fixed $\tilde {F}_a$
(right).
$\tilde {F}_a$
(right).

We show in figure 4 bifurcation diagrams obtained by numerically solving the governing equations (2.6) and (3.1) for $0\lt \alpha \leq 100$
,
$0\lt \alpha \leq 100$
, $\mathcal{I}_{{bv}}={{Re}}_{{bv}}={{{Sq}}}_{{bv}}=0$
. The corresponding regime map of accessible dimensionless weight reveals three distinct regions: (i) a regime where adhesion is not possible and the system fails; (ii) a regime of contactless adhesion; and (iii) a regime where we predict adhesion, but with the sheet’s edges periodically touching the substrate. The latter is discussed in § 3.2.4; we first focus on contactless adhesion. For a given
$\mathcal{I}_{{bv}}={{Re}}_{{bv}}={{{Sq}}}_{{bv}}=0$
. The corresponding regime map of accessible dimensionless weight reveals three distinct regions: (i) a regime where adhesion is not possible and the system fails; (ii) a regime of contactless adhesion; and (iii) a regime where we predict adhesion, but with the sheet’s edges periodically touching the substrate. The latter is discussed in § 3.2.4; we first focus on contactless adhesion. For a given $\alpha$
, we define
$\alpha$
, we define $\mathcal{G}_{\textit{max}}$
as the threshold weight above which contactless adhesion cannot take place.
$\mathcal{G}_{\textit{max}}$
as the threshold weight above which contactless adhesion cannot take place.
We see in figure 4 $(c)$
that the relation
$(c)$
that the relation $\mathcal{G}_{\textit{max}}=0.137 \alpha ^2$
is well verified for
$\mathcal{G}_{\textit{max}}=0.137 \alpha ^2$
is well verified for $\alpha \lesssim 1$
, but that
$\alpha \lesssim 1$
, but that $\mathcal{G}_{\textit{max}}$
reaches an approximately constant value of 7.8 for
$\mathcal{G}_{\textit{max}}$
reaches an approximately constant value of 7.8 for $\alpha \gtrsim 20$
. These two asymptotic behaviours are captured by the following interpolation, which also describes well the data over the whole range
$\alpha \gtrsim 20$
. These two asymptotic behaviours are captured by the following interpolation, which also describes well the data over the whole range $0\lt \alpha \leqslant 100$
:
$0\lt \alpha \leqslant 100$
:
 \begin{align} \mathcal{G}_{\textit{max}} \simeq 0.137 \frac {\alpha ^2}{1+0.0176\alpha ^2}, \quad \tilde {W}_{\textit{max}}\simeq 0.137 \dfrac {\tilde {F}_a^2/\tilde {F}_{{bv}}}{1+0.0176 \tilde {F}_a^2/\tilde {F}_{{bv}}^2}. \end{align}
In dimensional quantities, we find $\tilde {W}_{\textit{max}}=0.137 \tilde {F}_a^2/\tilde {F}_{{bv}}$
for
$\tilde {W}_{\textit{max}}=0.137 \tilde {F}_a^2/\tilde {F}_{{bv}}$
for $\tilde {F}_a \lesssim \tilde {F}_{{bv}}$
(weak forcing), and
$\tilde {F}_a \lesssim \tilde {F}_{{bv}}$
(weak forcing), and $\tilde {W}_{\textit{max}}\simeq 7.8 \tilde {F}_{{bv}}$
for
$\tilde {W}_{\textit{max}}\simeq 7.8 \tilde {F}_{{bv}}$
for $\tilde {F}_a \gg \tilde {F}_{{bv}}$
(strong forcing). In other words, if the forcing is strong enough, the maximum supported weight becomes independent of the forcing amplitude and scales as
$\tilde {F}_a \gg \tilde {F}_{{bv}}$
(strong forcing). In other words, if the forcing is strong enough, the maximum supported weight becomes independent of the forcing amplitude and scales as $\tilde {F}_{{bv}}$
. Equation (3.4) is consistent with the symmetry of the system: the long-term, time-averaged behaviour can only depend on even powers of
$\tilde {F}_{{bv}}$
. Equation (3.4) is consistent with the symmetry of the system: the long-term, time-averaged behaviour can only depend on even powers of $\alpha$
or
$\alpha$
or $\tilde {F}_a$
, as reversing the sign of the forcing is equivalent to a mere phase shift. It is also worth noting that the regimes of weak and strong forcing correspond to small and large deformations, respectively, of the sheet relative to
$\tilde {F}_a$
, as reversing the sign of the forcing is equivalent to a mere phase shift. It is also worth noting that the regimes of weak and strong forcing correspond to small and large deformations, respectively, of the sheet relative to $\tilde {h}_{{eq}}$
. In other soft lubrication problems, these two limits also lead to different scalings (Essink et al. Reference Essink, Pandey, Karpitschka, Venner and Snoeijer2021).
$\tilde {h}_{{eq}}$
. In other soft lubrication problems, these two limits also lead to different scalings (Essink et al. Reference Essink, Pandey, Karpitschka, Venner and Snoeijer2021).
Figure 4 $(d)$
shows that (3.4) provides insights into the evolution of the maximum supported weight
$(d)$
shows that (3.4) provides insights into the evolution of the maximum supported weight $\tilde {W}_{\textit{max}}$
. At fixed
$\tilde {W}_{\textit{max}}$
. At fixed $\tilde {F}_{{bv}}$
(left panel), increasing the forcing strength initially enhance adhesion, but
$\tilde {F}_{{bv}}$
(left panel), increasing the forcing strength initially enhance adhesion, but $\tilde {W}_{\textit{max}}$
saturates beyond
$\tilde {W}_{\textit{max}}$
saturates beyond $\tilde {F}_a/\tilde {F}_{{bv}} \approx 20$
. Conversely, at fixed
$\tilde {F}_a/\tilde {F}_{{bv}} \approx 20$
. Conversely, at fixed $\tilde {F}_a$
(right panel), softening the sheet by decreasing
$\tilde {F}_a$
(right panel), softening the sheet by decreasing $\tilde {F}_{{bv}}$
first increases the maximum weight, before weakening adhesion. This shows an optimum at
$\tilde {F}_{{bv}}$
first increases the maximum weight, before weakening adhesion. This shows an optimum at $\tilde {F}_{{bv}}^\star =(\tilde {\mu } \tilde {\omega } \tilde {B}^2)^\star \approx 0.13 \tilde {F}_a$
, with an associated bending stiffness
$\tilde {F}_{{bv}}^\star =(\tilde {\mu } \tilde {\omega } \tilde {B}^2)^\star \approx 0.13 \tilde {F}_a$
, with an associated bending stiffness $\tilde {B}^\star \approx 0.05 \tilde {F}_a^{3/2} (\tilde {\mu } \tilde {\omega } )^{-1/2}$
. If
$\tilde {B}^\star \approx 0.05 \tilde {F}_a^{3/2} (\tilde {\mu } \tilde {\omega } )^{-1/2}$
. If $\tilde {F}_{{bv}}$
and
$\tilde {F}_{{bv}}$
and $\tilde {F}_a$
can be tuned independently, the largest
$\tilde {F}_a$
can be tuned independently, the largest $\tilde {W}_{\textit{max}}$
is achieved by maximising
$\tilde {W}_{\textit{max}}$
is achieved by maximising $\tilde {F}_a$
. In practice, this means using the most powerful available actuator and adjusting the sheet’s bending rigidity accordingly. Practical design would also need to account for energy consumption and for the fact that powerful vibration motors are typically both heavy and bulky; their lateral extent also limits adhesion (Poulain et al. Reference Poulain, Koch, Mahadevan and Carlson2025). Nevertheless, our prediction resonates qualitatively with experimental observations: using relatively small motors, Weston-Dawkes et al. (Reference Weston-Dawkes, Adibnazari, Hu, Everman, Gravish and Tolley2021) demonstrated
$\tilde {F}_a$
. In practice, this means using the most powerful available actuator and adjusting the sheet’s bending rigidity accordingly. Practical design would also need to account for energy consumption and for the fact that powerful vibration motors are typically both heavy and bulky; their lateral extent also limits adhesion (Poulain et al. Reference Poulain, Koch, Mahadevan and Carlson2025). Nevertheless, our prediction resonates qualitatively with experimental observations: using relatively small motors, Weston-Dawkes et al. (Reference Weston-Dawkes, Adibnazari, Hu, Everman, Gravish and Tolley2021) demonstrated $\tilde {W}_{\textit{max}}\approx 5\,\mathrm{N}$
using thin and soft sheets, while experiments by Colasante (Reference Colasante2016) (see also experiments from the same author reported by Ramanarayanan & Sánchez (Reference Ramanarayanan and Sánchez2024)) show
$\tilde {W}_{\textit{max}}\approx 5\,\mathrm{N}$
using thin and soft sheets, while experiments by Colasante (Reference Colasante2016) (see also experiments from the same author reported by Ramanarayanan & Sánchez (Reference Ramanarayanan and Sánchez2024)) show $\tilde {W}_{\textit{max}}=\mathcal{O}({100\mathrm{N}})$
using stronger motors attached to stiffer sheets.
$\tilde {W}_{\textit{max}}=\mathcal{O}({100\mathrm{N}})$
using stronger motors attached to stiffer sheets.
3.2.2. Contactless adhesion – equilibrium height
We observe a remarkable linear relationship between $ h_{{eq}}$
and
$ h_{{eq}}$
and $\mathcal{G}$
for
$\mathcal{G}$
for $\alpha \gg 1$
in the inset of figure 4
$\alpha \gg 1$
in the inset of figure 4 $(b)$
, for
$(b)$
, for $\mathcal{G} \lesssim \mathcal{G}_{\textit{max}}$
. Combining this observation with the asymptotic results of the previous section, we find
$\mathcal{G} \lesssim \mathcal{G}_{\textit{max}}$
. Combining this observation with the asymptotic results of the previous section, we find
 \begin{align} h_{{eq}} \approx \begin{cases} f \left (\dfrac {\mathcal{G}}{\alpha ^2}\right ) \quad \text{if} \quad \alpha \lesssim 1 \\[20pt] 0.05 \mathcal{G} \quad \text{if} \quad \alpha \gg 1 \end{cases} \quad \text{for} \quad \mathcal{G}\lesssim \mathcal{G}_{\textit{max}}, \end{align}
or, in dimensional units,
 \begin{align} \tilde {h}_{{eq}} \approx \begin{cases} \tilde {H}_{{bv}} \times f\! \left (\dfrac {\tilde {W} \tilde {F}_{{bv}}}{\tilde {F}_a^2}\right ) \quad \text{if} \quad \tilde {F}_a \lesssim \tilde {F}_{{bv}} \\[20pt] 0.05 \dfrac {\tilde {W} \tilde {R}^2}{\tilde {B} } \quad \text{if} \quad \tilde {F}_a \gg \tilde {F}_{{bv}} \end{cases} \quad \text{for} \quad \tilde {W}\lesssim \tilde {W}_{\textit{max}}, \end{align}
with the maximum weight given by (3.4). The function $f$
represents the stable fixed points of (3.2) and is shown in figure 2
$f$
represents the stable fixed points of (3.2) and is shown in figure 2 $(a)$
; its analytical approximations are discussed by Poulain et al. (Reference Poulain, Koch, Mahadevan and Carlson2025). Equation (3.5b
) shows that, for strong forcing
$(a)$
; its analytical approximations are discussed by Poulain et al. (Reference Poulain, Koch, Mahadevan and Carlson2025). Equation (3.5b
) shows that, for strong forcing $\alpha \gg 1$
, the equilibrium height results from a balance between the bending force and gravity, with viscosity setting the maximum supported weight. Remarkably, the equilibrium height at the maximum supported weight is, in both limits,
$\alpha \gg 1$
, the equilibrium height results from a balance between the bending force and gravity, with viscosity setting the maximum supported weight. Remarkably, the equilibrium height at the maximum supported weight is, in both limits,
 \begin{align} \tilde {h}_{{eq}}(\tilde {W}_{\textit{max}}) \approx 0.3 \tilde {H}_{{bv}}. \end{align}
While it is not straightforward to rationalise the linear relation between $h_{{eq}}$
and
$h_{{eq}}$
and $\mathcal{G}$
, we note that
$\mathcal{G}$
, we note that $\tilde {B}/\tilde {R}^2 = \tilde {F}_{{\mathrm{bv}}}/\tilde {H}_{{bv}}=\tilde {k}_{{bv}}$
, with
$\tilde {B}/\tilde {R}^2 = \tilde {F}_{{\mathrm{bv}}}/\tilde {H}_{{bv}}=\tilde {k}_{{bv}}$
, with $\tilde {k}_{{bv}}$
a natural scale for stiffness, analogous to a spring constant. Then, (3.5b
) for
$\tilde {k}_{{bv}}$
a natural scale for stiffness, analogous to a spring constant. Then, (3.5b
) for $\alpha \gg 1$
can be written
$\alpha \gg 1$
can be written $\tilde {h}_{{eq}} \approx 0.05 \tilde {W}/\tilde {k}_{{bv}}$
.
$\tilde {h}_{{eq}} \approx 0.05 \tilde {W}/\tilde {k}_{{bv}}$
.
Time-averaged shape $\langle h \rangle$
and the periodic deformation
$\langle h \rangle$
and the periodic deformation $h_d$
for
$h_d$
for $\alpha =20$
,
$\alpha =20$
, $\mathcal{I}_{{bv}}={Re}_{{bv}}={Sq}_{{bv}}=0$
, and
$\mathcal{I}_{{bv}}={Re}_{{bv}}={Sq}_{{bv}}=0$
, and $\mathcal{G}=1,\,2,\,4$
in panels
$\mathcal{G}=1,\,2,\,4$
in panels $(a,b,c)$
, respectively.
$(a,b,c)$
, respectively.

3.2.3. Contactless adhesion – sheet’s deformations
Some of the insights gained from the weak forcing analysis presented in § 3.1 carry over to the regime $\alpha \gg 1$
. In particular, figure 5 shows that the excitation of higher-order modes of deformation as
$\alpha \gg 1$
. In particular, figure 5 shows that the excitation of higher-order modes of deformation as $\mathcal{G}\rightarrow 0$
,
$\mathcal{G}\rightarrow 0$
, $h_{{eq}}\rightarrow 0$
remains valid. One important difference, however, is the amplitude of the sheet’s deformation. In particular, we show in figure 6
$h_{{eq}}\rightarrow 0$
remains valid. One important difference, however, is the amplitude of the sheet’s deformation. In particular, we show in figure 6 $(a{,}b)$
an illustration of the sheet’s shape for
$(a{,}b)$
an illustration of the sheet’s shape for $\alpha =20$
. For
$\alpha =20$
. For $\mathcal{G}\lt \mathcal{G}_{\textit{max}}$
, panel
$\mathcal{G}\lt \mathcal{G}_{\textit{max}}$
, panel $(a)$
, the sheet remains convex, as expected from the large gravitational pull alone. For
$(a)$
, the sheet remains convex, as expected from the large gravitational pull alone. For $\mathcal{G}\gt \mathcal{G}_{\textit{max}}$
, panel
$\mathcal{G}\gt \mathcal{G}_{\textit{max}}$
, panel $(b)$
, the sheet becomes concave when the active forcing pulls it away from the wall. This, in turn, causes the sheet’s edge to come into contact with the substrate. We confirm in figure 6
$(b)$
, the sheet becomes concave when the active forcing pulls it away from the wall. This, in turn, causes the sheet’s edge to come into contact with the substrate. We confirm in figure 6 $(c)$
that turning the sheet concave during part of the vibration cycle is what leads to contact with the wall, and therefore what sets
$(c)$
that turning the sheet concave during part of the vibration cycle is what leads to contact with the wall, and therefore what sets $G_{\textit{max}}$
. This change in convexity occurs when the active pull is maintained for a sufficiently long time compared with the time it takes for the sheet to undergo a significant change in shape. This process is associated with the time scale
$G_{\textit{max}}$
. This change in convexity occurs when the active pull is maintained for a sufficiently long time compared with the time it takes for the sheet to undergo a significant change in shape. This process is associated with the time scale $\tilde {T}_g(\tilde {h}_{{eq}})$
defined in (2.9), with
$\tilde {T}_g(\tilde {h}_{{eq}})$
defined in (2.9), with $\tilde {h}_{{eq}}\sim \tilde {W}/\tilde {k}_{bv}$
from (3.5b
). The criterion for contact is then
$\tilde {h}_{{eq}}\sim \tilde {W}/\tilde {k}_{bv}$
from (3.5b
). The criterion for contact is then $\tilde {\omega } \tilde {T}_g(\tilde {h}_{{eq}}) \sim (\tilde {F}_{{bv}}/\tilde {W})^3 \lesssim 1$
, and we recover the scaling (3.4), i.e.
$\tilde {\omega } \tilde {T}_g(\tilde {h}_{{eq}}) \sim (\tilde {F}_{{bv}}/\tilde {W})^3 \lesssim 1$
, and we recover the scaling (3.4), i.e. $\tilde {W}_{\textit{max}} \sim \tilde {F}_{{bv}}$
for
$\tilde {W}_{\textit{max}} \sim \tilde {F}_{{bv}}$
for $\alpha \gg 1$
. We note that this understanding relies heavily on the convexity of the sheet and, consequently, on the specific distribution of weight and of active force. While we have assumed a uniform weight distribution, the effects of non-uniform weight distribution remain to be explored.
$\alpha \gg 1$
. We note that this understanding relies heavily on the convexity of the sheet and, consequently, on the specific distribution of weight and of active force. While we have assumed a uniform weight distribution, the effects of non-uniform weight distribution remain to be explored. $(a{,}b)$
Sheet’s shape and pressure field over a period of vibration for
$(a{,}b)$
Sheet’s shape and pressure field over a period of vibration for $\alpha =20$
and
$\alpha =20$
and $(a)$
$(a)$ $\mathcal{G}=4$
,
$\mathcal{G}=4$
, $(b)$
$(b)$ $\mathcal{G}=8$
. The arrows represent the active force periodically pushing and pulling at the centre of the sheet. In panel
$\mathcal{G}=8$
. The arrows represent the active force periodically pushing and pulling at the centre of the sheet. In panel $(b)$
, at
$(b)$
, at $t=3\pi /2$
, the edges of the sheet touch the bottom wall.
$t=3\pi /2$
, the edges of the sheet touch the bottom wall. $(c)$
The difference in height between the sheet’s centre
$(c)$
The difference in height between the sheet’s centre $h(0,t)$
and its edge
$h(0,t)$
and its edge $h(1,t)$
is a measure of the sheet’s convexity: when
$h(1,t)$
is a measure of the sheet’s convexity: when $\mathrm{min}_t(h(x=1,t)-h(x=0,t))\gt 0$
, the sheet always remain convex as in panel
$\mathrm{min}_t(h(x=1,t)-h(x=0,t))\gt 0$
, the sheet always remain convex as in panel $(a)$
, and the relationship
$(a)$
, and the relationship $h_{{eq}}\simeq 0.05 \mathcal{G}$
between equilibrium height and weight is verified (see figure 4
$h_{{eq}}\simeq 0.05 \mathcal{G}$
between equilibrium height and weight is verified (see figure 4 $b$
). The existence of a concave part during the vibration cycle, as shown at
$b$
). The existence of a concave part during the vibration cycle, as shown at $t=\pi ,\,5\pi /4$
and
$t=\pi ,\,5\pi /4$
and $3\pi /2$
in panel
$3\pi /2$
in panel $(b)$
, is associated with contact. Filled symbols represent the case when the sheet never touches the wall, open symbols correspond to the sheet periodically touching it.
$(b)$
, is associated with contact. Filled symbols represent the case when the sheet never touches the wall, open symbols correspond to the sheet periodically touching it.

3.2.4. Adhesion with contact
For $\alpha \gtrsim 9$
and sufficiently large
$\alpha \gtrsim 9$
and sufficiently large $\mathcal{G}$
, we observe in figure 4
$\mathcal{G}$
, we observe in figure 4 $(b{,}c)$
that adhesion can be maintained, while the sheet’s edges come in periodic contact with the substrate. The dynamics in this regime is illustrated in figure 6. To handle contact numerically, we have introduced the repulsive potential
$(b{,}c)$
that adhesion can be maintained, while the sheet’s edges come in periodic contact with the substrate. The dynamics in this regime is illustrated in figure 6. To handle contact numerically, we have introduced the repulsive potential $f_w(h)$
in (2.6), which models an elastic collision. Although numerical simulations can access the contact regime, contact introduces additional physical effects beyond the scope of the present model. This regime is therefore not examined further in this article. Nonetheless, we want to point to a possible analogy with suction cups (Ramanarayanan Reference Ramanarayanan2024), which achieve strong adhesion through edge contact and pressure differentials. Suction cups are prone to failure, with small perturbations at their edges leading to detachment (Tiwari & Persson Reference Tiwari and Persson2019). It has been demonstrated that applying vibrations to suction cups improves their performance and reliability (Zhu et al. Reference Zhu, Liu, Wang and Wang2006; Wu et al. Reference Wu, Cai, Li, Gao and Cao2023), an idea that shares similarities with the contact regime of vibrated sheets described previously. An experimental confirmation of this regime would be valuable and could guide further investigations into its modelling and underlying dynamics.
$f_w(h)$
in (2.6), which models an elastic collision. Although numerical simulations can access the contact regime, contact introduces additional physical effects beyond the scope of the present model. This regime is therefore not examined further in this article. Nonetheless, we want to point to a possible analogy with suction cups (Ramanarayanan Reference Ramanarayanan2024), which achieve strong adhesion through edge contact and pressure differentials. Suction cups are prone to failure, with small perturbations at their edges leading to detachment (Tiwari & Persson Reference Tiwari and Persson2019). It has been demonstrated that applying vibrations to suction cups improves their performance and reliability (Zhu et al. Reference Zhu, Liu, Wang and Wang2006; Wu et al. Reference Wu, Cai, Li, Gao and Cao2023), an idea that shares similarities with the contact regime of vibrated sheets described previously. An experimental confirmation of this regime would be valuable and could guide further investigations into its modelling and underlying dynamics.
4. Inertial effects: influence of the Reynolds number
We now introduce the effects of a finite Reynolds number $ \textit{Re}_{{bv}}=\tilde {\rho }_a \tilde {\omega } \tilde {R}^4/\tilde {B}\gt 0$
for an incompressible fluid and an inertialess sheet (
$ \textit{Re}_{{bv}}=\tilde {\rho }_a \tilde {\omega } \tilde {R}^4/\tilde {B}\gt 0$
for an incompressible fluid and an inertialess sheet ( ${Sq}_{{bv}}=\mathcal{I}_{{bv}}=0$
). The governing equations are then (2.4)–(2.6) with
${Sq}_{{bv}}=\mathcal{I}_{{bv}}=0$
). The governing equations are then (2.4)–(2.6) with $\rho =1$
. Using the parameter from § 2.7,
$\rho =1$
. Using the parameter from § 2.7, $ \textit{Re}_{{bv}} = \mathcal{O}({10^4})$
. The actual effect of fluid inertia is, in fact, more properly characterised by
$ \textit{Re}_{{bv}} = \mathcal{O}({10^4})$
. The actual effect of fluid inertia is, in fact, more properly characterised by $ \textit{Re}_{{eq}}=h_{{eq}}^2 {Re}_{{bv}} \lesssim \mathcal{O}({10})$
, the Reynolds number that uses the equilibrium height as the characteristic length. Further,
$ \textit{Re}_{{eq}}=h_{{eq}}^2 {Re}_{{bv}} \lesssim \mathcal{O}({10})$
, the Reynolds number that uses the equilibrium height as the characteristic length. Further, $ \textit{Re}_{{bv}}$
depends strongly on the details of the experiment (vibration frequency, sheet’s radius and bending modulus), and both the regimes of small and large
$ \textit{Re}_{{bv}}$
depends strongly on the details of the experiment (vibration frequency, sheet’s radius and bending modulus), and both the regimes of small and large $ \textit{Re}_{{bv}}$
can be relevant.
$ \textit{Re}_{{bv}}$
can be relevant.
4.1. Rigid sheets
To qualitatively understand the effect of fluid inertia, we begin with an idealised, simplified set-up: a standard squeeze film where the gap between the wall and a rigid sheet oscillates harmonically. We consider the flow in the gap and project the Navier–Stokes momentum equations along a streamline:
 \begin{align} \tilde {\rho }\left ({\frac {\partial \tilde {v}_s}{\partial \tilde {t}}}+ \tilde {v}_s{\frac {\partial \tilde {v}_s}{\partial \tilde {s}}}\right )=-{\frac {\partial \tilde {p}}{\partial \tilde {s}}} + \tilde {\mu } \tilde {{\nabla} }^2 \tilde {v}_s, \end{align}
where $\tilde {s}$
and
$\tilde {s}$
and $\tilde {v}_s$
refer to the position and velocity along the streamline, respectively. We integrate this equation along a streamline whose ends are at the top of the sheet, close to
$\tilde {v}_s$
refer to the position and velocity along the streamline, respectively. We integrate this equation along a streamline whose ends are at the top of the sheet, close to $x=0$
, and within the gap at a position
$x=0$
, and within the gap at a position $\tilde {s}$
, as shown in figure 7
$\tilde {s}$
, as shown in figure 7 $(a)$
, to find an energy balance analogous to Bernoulli’s principle:
$(a)$
, to find an energy balance analogous to Bernoulli’s principle:
 \begin{align} \left ( \tilde {p}\big \rvert _{\tilde {s}=0}+\frac {1}{2} \tilde {\rho } \tilde {v}_s^2\big \rvert _{\tilde {s}=0}\right ) - \left ( \tilde {p}\big \rvert _{\tilde {s}}+\frac {1}{2} \tilde {\rho } \tilde {v}_s^2\big \rvert _{\tilde {s}}\right )+\int _0^{\tilde {s}} \tilde {\rho } {\frac {\partial \tilde {v}_s}{\partial \tilde {t}}}\biggr \rvert _{\tilde {s}'}\,{\mathrm{d}} \tilde {s}'=\Delta \tilde {p}_{{visc}}, \end{align}
with $\Delta \tilde {p}_{{visc}}=\int _0^{\tilde {s}} \tilde {\mu } \tilde {\boldsymbol{\nabla} }^2 \tilde {v}_s\,{\mathrm{d}} \tilde {s}'$
the pressure loss due to viscous stresses. According to lubrication scalings,
$\Delta \tilde {p}_{{visc}}=\int _0^{\tilde {s}} \tilde {\mu } \tilde {\boldsymbol{\nabla} }^2 \tilde {v}_s\,{\mathrm{d}} \tilde {s}'$
the pressure loss due to viscous stresses. According to lubrication scalings, $ \tilde {v}_s\rvert _{\tilde {s}=0} = \tilde {\dot {h}} \ll \tilde {v}_s\rvert _{\tilde {s}}\simeq - \tilde {\dot {h}}\tilde {x}/\tilde {h}$
, with overdots denoting time derivatives. We use
$ \tilde {v}_s\rvert _{\tilde {s}=0} = \tilde {\dot {h}} \ll \tilde {v}_s\rvert _{\tilde {s}}\simeq - \tilde {\dot {h}}\tilde {x}/\tilde {h}$
, with overdots denoting time derivatives. We use $\tilde {s} \simeq \tilde {x}$
away from
$\tilde {s} \simeq \tilde {x}$
away from $\tilde {s}=0$
since the flow in the gap is predominantly horizontal. Then,
$\tilde {s}=0$
since the flow in the gap is predominantly horizontal. Then, $\int _0^{\tilde {s}} (\partial { \tilde {v}_s}/\partial { \tilde {t}}){\mathrm{d}} \tilde {s}' \sim [(\tilde {\dot h})^2-\tilde {\ddot h}/\tilde {h}] \, \tilde {x}^2$
and
$\int _0^{\tilde {s}} (\partial { \tilde {v}_s}/\partial { \tilde {t}}){\mathrm{d}} \tilde {s}' \sim [(\tilde {\dot h})^2-\tilde {\ddot h}/\tilde {h}] \, \tilde {x}^2$
and $\Delta \tilde {p}_{{visc}} \sim -\tilde {\mu } \tilde {\dot h}\tilde {x}^2/\tilde {h}^3$
. Equation (4.2) together with these scalings gives the pressure profile
$\Delta \tilde {p}_{{visc}} \sim -\tilde {\mu } \tilde {\dot h}\tilde {x}^2/\tilde {h}^3$
. Equation (4.2) together with these scalings gives the pressure profile $\tilde {p}(\tilde {x},\tilde {t}) \sim (\tilde {R}^2-\tilde {x}^2)[-\tilde {\mu } \tilde {\dot h}/\tilde {h}^3 - \tilde {\rho } {\tilde {\ddot h}}/{\tilde {h}}+\tilde {\rho }{\tilde {\dot h}^2}/{\tilde {h}^2} ]$
, with prefactors missing. The formal inertial lubrication analysis from (2.5) leads to the following, in dimensionless form:
$\tilde {p}(\tilde {x},\tilde {t}) \sim (\tilde {R}^2-\tilde {x}^2)[-\tilde {\mu } \tilde {\dot h}/\tilde {h}^3 - \tilde {\rho } {\tilde {\ddot h}}/{\tilde {h}}+\tilde {\rho }{\tilde {\dot h}^2}/{\tilde {h}^2} ]$
, with prefactors missing. The formal inertial lubrication analysis from (2.5) leads to the following, in dimensionless form:
 \begin{align} p(x,t)&=\big (1-x^2\big )\left (-6 \frac {\dot h}{h^3} - \frac {3{{Re}}}{5} \frac {\ddot h}{h} + \frac {51{{Re}}}{35}\frac {\dot h^2}{h^2}\right ) + p(x=1,t), \end{align}
with $p(x=1,t)$
the pressure at the edge found from the boundary condition (2.11),
$p(x=1,t)$
the pressure at the edge found from the boundary condition (2.11),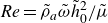 ${\textit{Re}} = \tilde {\rho }_a \tilde {\omega } \tilde {h}_0^2/\tilde {\mu }$
, and
${\textit{Re}} = \tilde {\rho }_a \tilde {\omega } \tilde {h}_0^2/\tilde {\mu }$
, and $\tilde {h}_0$
the characteristic gap height. The first term describes the viscous losses and is captured by standard lubrication theory. The unsteady acceleration term, proportional to
$\tilde {h}_0$
the characteristic gap height. The first term describes the viscous losses and is captured by standard lubrication theory. The unsteady acceleration term, proportional to $-\ddot h/h$
, is equivalent to an added mass effect as discussed later. The edge pressure tends to decrease the pressure in the gap; however, the dominant effect of inertia is to convert the kinetic energy density of the fluid drawn into (or flowing out from) the gap into pressure. This is illustrated in figure 7, where a squeeze flow is imposed by setting the height as
$-\ddot h/h$
, is equivalent to an added mass effect as discussed later. The edge pressure tends to decrease the pressure in the gap; however, the dominant effect of inertia is to convert the kinetic energy density of the fluid drawn into (or flowing out from) the gap into pressure. This is illustrated in figure 7, where a squeeze flow is imposed by setting the height as $h(t)=1+a\cos (t)$
,
$h(t)=1+a\cos (t)$
, $0\lt a\lt 1$
. Over one period of oscillations, the net normal force from viscous effects cancels out:
$0\lt a\lt 1$
. Over one period of oscillations, the net normal force from viscous effects cancels out: $\int _{-1}^1 \langle p_{v\textit{iscous}}(x,t) \rangle \,{\mathrm{d}}x=0$
, with
$\int _{-1}^1 \langle p_{v\textit{iscous}}(x,t) \rangle \,{\mathrm{d}}x=0$
, with $p_{{ viscous}}(x,t)=-6 (1-x^2 )\dot h(t)/h^3(t)$
. However, the force from inertial effects is positive,
$p_{{ viscous}}(x,t)=-6 (1-x^2 )\dot h(t)/h^3(t)$
. However, the force from inertial effects is positive, $ \int _{-1}^1 \langle p_{\textit{inertial}}(x)\rangle \,{\mathrm{d}}x = (1-7k/24)a^2{{Re}}/1.5 + \mathcal{O}({a^4})\gt 0$
, with
$ \int _{-1}^1 \langle p_{\textit{inertial}}(x)\rangle \,{\mathrm{d}}x = (1-7k/24)a^2{{Re}}/1.5 + \mathcal{O}({a^4})\gt 0$
, with $p_{\textit{inertial}}=p-p_{v\textit{iscous}}$
and
$p_{\textit{inertial}}=p-p_{v\textit{iscous}}$
and $k=0.5$
a loss coefficient introduced in the boundary condition (2.11), showing that inertia leads to a normal force that pushes the sheet away from the wall. This effect has long been known in the context of bearings (e.g. Kuzma Reference Kuzma1968; Tichy & Winer Reference Tichy and Winer1970; Jones & Wilson Reference Jones and Wilson1975). In addition to modifying the pressure, a non-zero Reynolds number also alters the parabolic velocity profile predicted by the purely viscous theory: the horizontal velocity profile becomes a sixth-order polynomial which allows for secondary flows (figure 7
$k=0.5$
a loss coefficient introduced in the boundary condition (2.11), showing that inertia leads to a normal force that pushes the sheet away from the wall. This effect has long been known in the context of bearings (e.g. Kuzma Reference Kuzma1968; Tichy & Winer Reference Tichy and Winer1970; Jones & Wilson Reference Jones and Wilson1975). In addition to modifying the pressure, a non-zero Reynolds number also alters the parabolic velocity profile predicted by the purely viscous theory: the horizontal velocity profile becomes a sixth-order polynomial which allows for secondary flows (figure 7 $d$
), a common feature of pulsatile flows (Womersley Reference Womersley1955). We finally note that the unsteady acceleration term, proportional to
$d$
), a common feature of pulsatile flows (Womersley Reference Womersley1955). We finally note that the unsteady acceleration term, proportional to $\ddot {h}$
, appears as a height-dependent added mass. Indeed, integrating the pressure over the sheet’s length
$\ddot {h}$
, appears as a height-dependent added mass. Indeed, integrating the pressure over the sheet’s length $2\tilde {R}$
gives rise to a force per unit length
$2\tilde {R}$
gives rise to a force per unit length $-\tilde {m}_a \tilde {\ddot {h}}$
, with
$-\tilde {m}_a \tilde {\ddot {h}}$
, with $\tilde {m}_a=4\tilde {\rho } \tilde {R}^3/5\tilde {h}$
an added mass per unit length (see also (D5)). In contrast, the added mass of a plate far from any boundary is proportional to
$\tilde {m}_a=4\tilde {\rho } \tilde {R}^3/5\tilde {h}$
an added mass per unit length (see also (D5)). In contrast, the added mass of a plate far from any boundary is proportional to $\tilde {\rho } \tilde {R}^2$
(Brennen Reference Brennen1982).
$\tilde {\rho } \tilde {R}^2$
(Brennen Reference Brennen1982).
Squeeze flow of a rigid plate moving normal to a wall with a height evolving as $h(t)=1+a\cos (t)$
, shown for illustration here with
$h(t)=1+a\cos (t)$
, shown for illustration here with $a=0.4$
. The pressure is computed from (4.3) and the fluid velocity from the calculations carried out in Appendix A.
$a=0.4$
. The pressure is computed from (4.3) and the fluid velocity from the calculations carried out in Appendix A. $(a)$
Streamlines of the flow associated with a rigid sheet moving towards a wall or away from it.
$(a)$
Streamlines of the flow associated with a rigid sheet moving towards a wall or away from it. $(b)$
Integral of pressure in space for the viscous component and inertial component. Integrated in time, the viscous component averages to zero while the inertial component gives a positive force. The inertial pressure is rescaled by the Reynolds number.
$(b)$
Integral of pressure in space for the viscous component and inertial component. Integrated in time, the viscous component averages to zero while the inertial component gives a positive force. The inertial pressure is rescaled by the Reynolds number. $(c{,}d)$
Velocity profiles (arrows) and pressure field (colours) isolating
$(c{,}d)$
Velocity profiles (arrows) and pressure field (colours) isolating $(c)$
the dominant viscous flow and
$(c)$
the dominant viscous flow and $(d)$
the inertial corrections.
$(d)$
the inertial corrections.

While we initially considered a sheet constrained in position for simplicity, we are more interested in the case of a weightless rigid sheet driven periodically by a dimensionless force $\alpha \cos (t)$
. In this case, we use a two-time scale asymptotic analysis to find the evolution of the height
$\alpha \cos (t)$
. In this case, we use a two-time scale asymptotic analysis to find the evolution of the height $h(t)$
in the limit
$h(t)$
in the limit $\alpha ^2{{Re}} \ll 1$
. We present the derivation in Appendix D, where we show that the sheet slowly moves away from the wall to accommodate the inertial pressure increase while maintaining a force balance. The sheet’s time-averaged position has the following evolution equation, in dimensionless and dimensional form:
$\alpha ^2{{Re}} \ll 1$
. We present the derivation in Appendix D, where we show that the sheet slowly moves away from the wall to accommodate the inertial pressure increase while maintaining a force balance. The sheet’s time-averaged position has the following evolution equation, in dimensionless and dimensional form:
 \begin{align} \begin{split} \frac {1}{\alpha ^2\langle h \rangle ^2}{\frac {{\mathrm{d}}\langle h \rangle }{\mathrm{d}t}}=c_k{{Re}} \langle h \rangle ^5, \quad {\frac {{\mathrm{d}}\langle \tilde {h} \rangle }{{\mathrm{d}}\tilde {t}}=c_k \frac {\tilde {F}_a^2 \tilde {\rho }_a \langle \tilde {h} \rangle ^7}{\tilde {\mu }^3 \tilde {R}^8}=\frac {c_k \langle \tilde {h} \rangle }{\tilde {T}_{{a,i}}\!\left (\langle \tilde {h} \rangle \right )}}, \quad c_k=\frac {1-\frac {7k}{16}}{224}. \end{split} \end{align}
The fact that ${\mathrm{d}}(\langle h \rangle )/{\mathrm{d}}t \sim \langle h\rangle ^7$
– a much stronger dependence on
${\mathrm{d}}(\langle h \rangle )/{\mathrm{d}}t \sim \langle h\rangle ^7$
– a much stronger dependence on $\langle h\rangle$
than the effects of gravity and elastohydrodynamic, see (3.2) – follows from the expressions of the relevant time scales discussed in § 2.4. In particular, the inertial time scale shows the strongest dependence on the height,
$\langle h\rangle$
than the effects of gravity and elastohydrodynamic, see (3.2) – follows from the expressions of the relevant time scales discussed in § 2.4. In particular, the inertial time scale shows the strongest dependence on the height, $\tilde {T}_{a,i}(\tilde {h})\sim \tilde {h}^{-6}$
. We also note that the boundary condition (2.11) appears in the prefactor
$\tilde {T}_{a,i}(\tilde {h})\sim \tilde {h}^{-6}$
. We also note that the boundary condition (2.11) appears in the prefactor $c_k$
and leads to a correction of the order of
$c_k$
and leads to a correction of the order of $7k/16 \simeq 22\,\%$
for
$7k/16 \simeq 22\,\%$
for $k=0.5$
as compared with the standard boundary condition
$k=0.5$
as compared with the standard boundary condition $p=0$
.
$p=0$
.
4.2. Soft sheets
We expect that the destabilising influence of fluid inertia extends to soft sheets, weakening the viscous adhesion mechanism discussed in the previous section. We solve the governing equations with ${Sq}_{{bv}}=I_{{bv}}=0$
and for
${Sq}_{{bv}}=I_{{bv}}=0$
and for $\alpha =1$
and
$\alpha =1$
and $\alpha =20$
, corresponding to the regimes of weak and strong forcing, respectively. For both values, we systematically studied the relationship between the equilibrium height
$\alpha =20$
, corresponding to the regimes of weak and strong forcing, respectively. For both values, we systematically studied the relationship between the equilibrium height $h_{\textit{eq}}$
and the weight
$h_{\textit{eq}}$
and the weight $\mathcal{G}$
as a function of the Reynolds number
$\mathcal{G}$
as a function of the Reynolds number $ \textit{Re}_{{bv}}$
. As discussed in § 2.7, for each set of parameters, we define the equilibrium Reynolds number
$ \textit{Re}_{{bv}}$
. As discussed in § 2.7, for each set of parameters, we define the equilibrium Reynolds number ${\textit{Re}}_{{eq}}=h_{{eq}}^2 {{Re}}_{{bv}}$
that is based on the equilibrium height rather than on the height scale
${\textit{Re}}_{{eq}}=h_{{eq}}^2 {{Re}}_{{bv}}$
that is based on the equilibrium height rather than on the height scale $\tilde {H}_{{bv}}$
and which is representative of the actual magnitude of inertial over viscous effects; hence,
$\tilde {H}_{{bv}}$
and which is representative of the actual magnitude of inertial over viscous effects; hence, ${\textit{Re}}_{{eq}}$
may be small even when
${\textit{Re}}_{{eq}}$
may be small even when ${\textit{Re}}_{{bv}}$
is large.
${\textit{Re}}_{{bv}}$
is large.
Figure 8 summarises our results for $\alpha =1$
. There, we show examples of bifurcation diagrams and the associated regime map of adhesion. For small values of
$\alpha =1$
. There, we show examples of bifurcation diagrams and the associated regime map of adhesion. For small values of ${\textit{Re}}_{{bv}}$
, increasing the Reynolds number first marginally increases the maximum weight
${\textit{Re}}_{{bv}}$
, increasing the Reynolds number first marginally increases the maximum weight $\mathcal{G}_{\textit{max}}$
. Further increasing
$\mathcal{G}_{\textit{max}}$
. Further increasing ${\textit{Re}}_{{bv}}$
then leads to a sharp decrease in
${\textit{Re}}_{{bv}}$
then leads to a sharp decrease in $\mathcal{G}_{\textit{max}}$
, explained by the destabilising effect of fluid inertia discussed previously. Figure 8
$\mathcal{G}_{\textit{max}}$
, explained by the destabilising effect of fluid inertia discussed previously. Figure 8 $(d)$
shows the range of accessible equilibrium Reynolds numbers
$(d)$
shows the range of accessible equilibrium Reynolds numbers $ \textit{Re}_{{eq}}$
as a function of
$ \textit{Re}_{{eq}}$
as a function of $ \textit{Re}_{{bv}}$
. This demonstrates that
$ \textit{Re}_{{bv}}$
. This demonstrates that $ \textit{Re}_{{bv}}$
has little effect on the dynamics as long as
$ \textit{Re}_{{bv}}$
has little effect on the dynamics as long as $ \textit{Re}_{{eq}} \lesssim 1$
. Once
$ \textit{Re}_{{eq}} \lesssim 1$
. Once $ \textit{Re}_{{eq}}=\mathcal{O}({1})$
,
$ \textit{Re}_{{eq}}=\mathcal{O}({1})$
, $\mathcal{G}_{\textit{max}}$
decreases together with
$\mathcal{G}_{\textit{max}}$
decreases together with $h_{{eq}}$
to ensure
$h_{{eq}}$
to ensure $ \textit{Re}_{{eq}}$
remains relatively small. In particular, we observe a sharp drop in
$ \textit{Re}_{{eq}}$
remains relatively small. In particular, we observe a sharp drop in $\mathcal{G}_{\textit{max}}$
for
$\mathcal{G}_{\textit{max}}$
for $ \textit{Re}_{{bv}} \gtrsim 30 \approx 1/e_1^2$
, with
$ \textit{Re}_{{bv}} \gtrsim 30 \approx 1/e_1^2$
, with $e_1$
the height scale introduced in (3.2a
). As
$e_1$
the height scale introduced in (3.2a
). As $ \textit{Re}_{{bv}}$
keeps increasing, the first branch of the bifurcation diagram (continuous black line for
$ \textit{Re}_{{bv}}$
keeps increasing, the first branch of the bifurcation diagram (continuous black line for ${h_{{eq}}}\gt 0.1$
in figure 8
${h_{{eq}}}\gt 0.1$
in figure 8 $a$
) is eventually not accessible anymore for
$a$
) is eventually not accessible anymore for ${\textit{Re}}_{{bv}} \gtrsim 200 \approx 1/e_2^2$
. We observe a similar drop of
${\textit{Re}}_{{bv}} \gtrsim 200 \approx 1/e_2^2$
. We observe a similar drop of $\mathcal{G}_{\textit{max}}$
for
$\mathcal{G}_{\textit{max}}$
for ${\textit{Re}}_{{bv}} \approx 2000 \approx 1/e_3^2$
, as the first part of the second equilibrium branch (corresponding to the excitation of the second eigenmode
${\textit{Re}}_{{bv}} \approx 2000 \approx 1/e_3^2$
, as the first part of the second equilibrium branch (corresponding to the excitation of the second eigenmode $\zeta _2$
for
$\zeta _2$
for $h_{{eq}} \approx e_2$
) is also no longer accessible.
$h_{{eq}} \approx e_2$
) is also no longer accessible. $(a{,}b)$
Equilibrium height as a function of the dimensionless weight with
$(a{,}b)$
Equilibrium height as a function of the dimensionless weight with ${Sq}_{{bv}}=\mathcal{I}_{{bv}}=0$
and
${Sq}_{{bv}}=\mathcal{I}_{{bv}}=0$
and $\alpha =1$
for
$\alpha =1$
for $(a)$
$(a)$ $ \textit{Re}_{{bv}}\lt 200$
and
$ \textit{Re}_{{bv}}\lt 200$
and $(b)$
$(b)$ $ \textit{Re}_{{bv}}\gt 200$
. Black lines are the stable equilibria of (3.2).
$ \textit{Re}_{{bv}}\gt 200$
. Black lines are the stable equilibria of (3.2). $(c)$
Phase diagram showing the accessible weights as a function of
$(c)$
Phase diagram showing the accessible weights as a function of $ \textit{Re}_{{bv}}$
. The first equilibrium branch corresponds to
$ \textit{Re}_{{bv}}$
. The first equilibrium branch corresponds to $h_{{eq}}\gt 0.1$
, the second branch to
$h_{{eq}}\gt 0.1$
, the second branch to $h_{{eq}}\lt 0.1$
.
$h_{{eq}}\lt 0.1$
. $(d)$
Reynolds number based on the equilibrium height
$(d)$
Reynolds number based on the equilibrium height $h_{{eq}}$
,
$h_{{eq}}$
,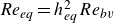 ${\textit{Re}}_{\textit{eq}}=h_{{eq}}^2 {Re}_{{bv}}$
as a function of the control parameter
${\textit{Re}}_{\textit{eq}}=h_{{eq}}^2 {Re}_{{bv}}$
as a function of the control parameter $ \textit{Re}_{{bv}}$
. The dashed lines represent the expected behaviour if fluid inertia did not affect the system.
$ \textit{Re}_{{bv}}$
. The dashed lines represent the expected behaviour if fluid inertia did not affect the system.

Effect of the fluid inertia with ${{{Sq}}}_{{bv}}=\mathcal{I}_{{bv}}=0$
and
${{{Sq}}}_{{bv}}=\mathcal{I}_{{bv}}=0$
and ${\textit{Re}}_{{bv}}\gt 0$
for
${\textit{Re}}_{{bv}}\gt 0$
for $\alpha =20$
.
$\alpha =20$
. $(a)$
Equilibrium height as a function of the dimensionless weight for the regime of contactless adhesion.
$(a)$
Equilibrium height as a function of the dimensionless weight for the regime of contactless adhesion. $(b)$
Regime maps and the associated
$(b)$
Regime maps and the associated $(c)$
range of Reynolds number based on equilibrium height
$(c)$
range of Reynolds number based on equilibrium height $ \textit{Re}_{{eq}}$
. The inertial lubrication theory is not expected to be valid for
$ \textit{Re}_{{eq}}$
. The inertial lubrication theory is not expected to be valid for ${\textit{Re}}_{\textit{eq}}\gtrsim 50.$
In panel
${\textit{Re}}_{\textit{eq}}\gtrsim 50.$
In panel $(b)$
, we show illustrations of
$(b)$
, we show illustrations of $h_d$
(as defined in (3.3)) for
$h_d$
(as defined in (3.3)) for ${\textit{Re}}_{{bv}}$
= 100, 1000 and 5000 at
${\textit{Re}}_{{bv}}$
= 100, 1000 and 5000 at $t=\pi /2$
and
$t=\pi /2$
and $3\pi /2$
.
$3\pi /2$
.

Figure 9 shows that the system’s behaviour is qualitatively similar in the regime of strong forcing ( $\alpha =20$
): the maximum supported weight decreases as
$\alpha =20$
): the maximum supported weight decreases as ${\textit{Re}}_{{bv}}$
increases, with sharp drops at specific Reynolds numbers, while the equilibrium height shows minor variations with
${\textit{Re}}_{{bv}}$
increases, with sharp drops at specific Reynolds numbers, while the equilibrium height shows minor variations with ${\textit{Re}}_{{bv}}$
. Similarly to the weak forcing case, these drops are associated with higher-order modes as illustrated in panel
${\textit{Re}}_{{bv}}$
. Similarly to the weak forcing case, these drops are associated with higher-order modes as illustrated in panel $(b)$
. The main difference between the two regimes is that
$(b)$
. The main difference between the two regimes is that ${\textit{Re}}_{{eq}}$
can become relatively large when
${\textit{Re}}_{{eq}}$
can become relatively large when $\alpha \gg 1$
: we observe values up to
$\alpha \gg 1$
: we observe values up to ${\textit{Re}}_{{eq}}=\mathcal{O}({10^2})$
for
${\textit{Re}}_{{eq}}=\mathcal{O}({10^2})$
for $ \textit{Re}_{{bv}}=\mathcal{O}({10^4})$
. For such large values, inertial lubrication theory may no longer be valid, and higher-order corrections, or full Navier–Stokes simulations, may be necessary to accurately describe the flow and
$ \textit{Re}_{{bv}}=\mathcal{O}({10^4})$
. For such large values, inertial lubrication theory may no longer be valid, and higher-order corrections, or full Navier–Stokes simulations, may be necessary to accurately describe the flow and $\mathcal{G}_{\textit{max}}$
. This may be relevant to the experiments of Weston-Dawkes et al. (Reference Weston-Dawkes, Adibnazari, Hu, Everman, Gravish and Tolley2021).
$\mathcal{G}_{\textit{max}}$
. This may be relevant to the experiments of Weston-Dawkes et al. (Reference Weston-Dawkes, Adibnazari, Hu, Everman, Gravish and Tolley2021).
5. Compressible effects: influence of the squeeze number
In this section, we neglect inertia ( $\mathcal{I}_{{bv}}={{Re}}_{{bv}}=0$
) and study the influence of the fluid’s compressibility,
$\mathcal{I}_{{bv}}={{Re}}_{{bv}}=0$
) and study the influence of the fluid’s compressibility, ${{{Sq}}}_{{bv}}\gt 0$
. We assume that the fluid behaves as an isothermal ideal gas and that the two bounding surfaces are isothermal. The characteristic time scale for temperature variations within the thickness of the gap is
${{{Sq}}}_{{bv}}\gt 0$
. We assume that the fluid behaves as an isothermal ideal gas and that the two bounding surfaces are isothermal. The characteristic time scale for temperature variations within the thickness of the gap is $\tilde {H}_{{bv}}^2/\tilde {D}_{{th}}$
with
$\tilde {H}_{{bv}}^2/\tilde {D}_{{th}}$
with $\tilde {D}_{{th}}$
the thermal diffusivity of the gas. This defines a Péclet number
$\tilde {D}_{{th}}$
the thermal diffusivity of the gas. This defines a Péclet number ${Pe}=\tilde {\omega } \tilde {H}_{{bv}}^2/\tilde {D}_{{ th}}={Re}_{{bv}}{Pr}$
with
${Pe}=\tilde {\omega } \tilde {H}_{{bv}}^2/\tilde {D}_{{ th}}={Re}_{{bv}}{Pr}$
with ${Pr}=\tilde {\mu }/\tilde {\rho }_a \tilde {D}_{{th}}\simeq 0.7$
the Prandtl number. The isothermal assumption is appropriate for small
${Pr}=\tilde {\mu }/\tilde {\rho }_a \tilde {D}_{{th}}\simeq 0.7$
the Prandtl number. The isothermal assumption is appropriate for small ${Pe}$
and therefore for small Reynolds numbers. In the opposite limit of an isentropic gas, valid for large Péclet numbers, the pressure–density relation would become
${Pe}$
and therefore for small Reynolds numbers. In the opposite limit of an isentropic gas, valid for large Péclet numbers, the pressure–density relation would become $\tilde {\rho }$
/
$\tilde {\rho }$
/ $\tilde {\rho }_a= (1+\tilde {p}/\tilde {p}_a )^{1/\gamma }$
with
$\tilde {\rho }_a= (1+\tilde {p}/\tilde {p}_a )^{1/\gamma }$
with $\gamma$
the adiabatic index (
$\gamma$
the adiabatic index ( $\gamma \simeq 1.4$
for air (Haynes Reference Haynes2016)), or in dimensionless units
$\gamma \simeq 1.4$
for air (Haynes Reference Haynes2016)), or in dimensionless units $\rho =(1+{{{Sq}}}_{{bv}}p)^{1/\gamma }$
. The essential mechanism of increase in density with increasing pressure would still be present, such that the results discussed next would be qualitatively similar. In particular, the first-order Taylor expansion of the isentropic relation is
$\rho =(1+{{{Sq}}}_{{bv}}p)^{1/\gamma }$
. The essential mechanism of increase in density with increasing pressure would still be present, such that the results discussed next would be qualitatively similar. In particular, the first-order Taylor expansion of the isentropic relation is $\rho =1+{{{Sq}}}_{{bv}} p /\gamma$
, identical to the isothermal one (2.4b
) up to a prefactor in
$\rho =1+{{{Sq}}}_{{bv}} p /\gamma$
, identical to the isothermal one (2.4b
) up to a prefactor in ${{{Sq}}}_{{bv}}$
.
${{{Sq}}}_{{bv}}$
.
5.1. Rigid sheets
To build intuition, we first consider the rigid squeeze film set-up: $\tilde {h}=\tilde {h}_0(1+a\cos (\tilde {\omega } \tilde {t}))$
. The effects of compressibility are quantified with the squeeze number
$\tilde {h}=\tilde {h}_0(1+a\cos (\tilde {\omega } \tilde {t}))$
. The effects of compressibility are quantified with the squeeze number ${{{Sq}}}=\tilde {\mu }\tilde {\omega }\tilde {R}^2/\tilde {h}_0^2\tilde {p}_a$
, which compares the viscous stresses with the ambient pressure
${{{Sq}}}=\tilde {\mu }\tilde {\omega }\tilde {R}^2/\tilde {h}_0^2\tilde {p}_a$
, which compares the viscous stresses with the ambient pressure $\tilde {p}_a$
. When the sheet approaches the wall, a competition arises between the outflow of fluid from the gap, resisted by viscosity, and the compression of the fluid, resisted by its pressure. For
$\tilde {p}_a$
. When the sheet approaches the wall, a competition arises between the outflow of fluid from the gap, resisted by viscosity, and the compression of the fluid, resisted by its pressure. For ${{{Sq}}} \ll 1$
, an incompressible description is appropriate. Conversely, for
${{{Sq}}} \ll 1$
, an incompressible description is appropriate. Conversely, for ${{{Sq}}} \gg 1$
, viscous stresses become so large that there is almost no outflow and the fluid is compressed with the sheet acting as a piston. Likewise, fluid is expanded when the surface moves away from the wall. In this limit, also examined by Salbu (Reference Salbu1964), the work per unit area to expand from
${{{Sq}}} \gg 1$
, viscous stresses become so large that there is almost no outflow and the fluid is compressed with the sheet acting as a piston. Likewise, fluid is expanded when the surface moves away from the wall. In this limit, also examined by Salbu (Reference Salbu1964), the work per unit area to expand from $\tilde {h}_0$
to
$\tilde {h}_0$
to $\tilde {h}_0(1+a)$
is
$\tilde {h}_0(1+a)$
is $\tilde {w}_{+a}=\int _{\tilde {h}_0}^{\tilde {h}_0(1+a)} \tilde {p}\,{\mathrm{d}}\tilde {h}=\tilde {p}_a \tilde {h}_0\ln (1+a)$
, and the work to compress from
$\tilde {w}_{+a}=\int _{\tilde {h}_0}^{\tilde {h}_0(1+a)} \tilde {p}\,{\mathrm{d}}\tilde {h}=\tilde {p}_a \tilde {h}_0\ln (1+a)$
, and the work to compress from $\tilde {h}_0$
to
$\tilde {h}_0$
to $\tilde {h}_0(1-a)$
is
$\tilde {h}_0(1-a)$
is $\tilde {w}_{-a}=\tilde {p}_a\tilde {h}_0\ln (1-a)$
. This gives
$\tilde {w}_{-a}=\tilde {p}_a\tilde {h}_0\ln (1-a)$
. This gives $\lvert \tilde {w}_{-a}\rvert -\lvert \tilde {w}_{+a}\rvert =-\tilde {p}_a\tilde {h}_0\ln (1-a^2)=\tilde {p}_a \tilde {h}_0 \tilde {a}^2 + \mathcal{O}({a^4})\gt 0$
, i.e. it is more energetically costly to compress than to expand an ideal gas by the same volume increment. This is because the isothermal bulk modulus of the gas is its pressure, which increases during compression and decreases during expansion.
$\lvert \tilde {w}_{-a}\rvert -\lvert \tilde {w}_{+a}\rvert =-\tilde {p}_a\tilde {h}_0\ln (1-a^2)=\tilde {p}_a \tilde {h}_0 \tilde {a}^2 + \mathcal{O}({a^4})\gt 0$
, i.e. it is more energetically costly to compress than to expand an ideal gas by the same volume increment. This is because the isothermal bulk modulus of the gas is its pressure, which increases during compression and decreases during expansion.
We now come back to the original setting, the displacement of the rigid sheet not constrained, but controlled by a time-periodic force $\alpha \cos (t)$
. We can anticipate that at each cycle, there will be more expansion than compression, i.e. the sheet will slowly move away from the wall. An asymptotic expansion performed in Appendix E confirms this picture and shows that the sheet’s time averaged position follows at
$\alpha \cos (t)$
. We can anticipate that at each cycle, there will be more expansion than compression, i.e. the sheet will slowly move away from the wall. An asymptotic expansion performed in Appendix E confirms this picture and shows that the sheet’s time averaged position follows at $\mathcal{O}({\alpha ^2 {{{Sq}}}})$
, in dimensional and dimensionless form:
$\mathcal{O}({\alpha ^2 {{{Sq}}}})$
, in dimensional and dimensionless form:
 \begin{align} \frac {1}{\alpha ^2\langle h \rangle ^2}{\frac {{\mathrm{d}}\langle h \rangle }{\mathrm{d}t}}=\frac {3}{8}{Sq}_{{bv}} \langle h \rangle , \quad {\frac {{\mathrm{d}}\langle \tilde {h} \rangle }{{\mathrm{d}}\tilde {t}}=\frac 38 \frac {\tilde {F}_a^2 \langle \tilde {h} \rangle ^3}{\tilde {\mu } \tilde {R}^6 \tilde {p}_a}=\frac 38 \frac {\langle \tilde {h} \rangle }{\tilde {T}_{{a,c}} (\langle \tilde {h}\rangle)}}. \end{align}
We can compare (5.1) with (3.2), where the isolated effect of gravity on a rigid sheet leads to ${\mathrm{d}}\langle h\rangle /{\mathrm{d}}t = \mathcal{G} \langle h \rangle ^3/4$
. The fact that these two different physical processes lead to the same scaling
${\mathrm{d}}\langle h\rangle /{\mathrm{d}}t = \mathcal{G} \langle h \rangle ^3/4$
. The fact that these two different physical processes lead to the same scaling ${\mathrm{d}}\langle h\rangle /{\mathrm{d}}t \sim \langle h \rangle ^3$
originates from the expression of the compressible time scale
${\mathrm{d}}\langle h\rangle /{\mathrm{d}}t \sim \langle h \rangle ^3$
originates from the expression of the compressible time scale $\tilde {T}_{{a,c}}$
and gravitational time scale
$\tilde {T}_{{a,c}}$
and gravitational time scale $\tilde {T}_{g}$
in (2.9). It shows that the first-order effect of compressibility can be interpreted as an increase in the effective dimensionless weight
$\tilde {T}_{g}$
in (2.9). It shows that the first-order effect of compressibility can be interpreted as an increase in the effective dimensionless weight $\mathcal{G}_{{eff}}$
(or dimensional weight
$\mathcal{G}_{{eff}}$
(or dimensional weight $\tilde {W}_{{ eff}}$
) such that
$\tilde {W}_{{ eff}}$
) such that
 \begin{align} \mathcal{G}_{{eff}} = \mathcal{G} + \frac 32 \alpha ^2 {Sq}_{{bv}}, \quad \tilde {W}_{{eff}} = \tilde {W} + \frac 32 \frac {\tilde {F}_a^2}{\tilde {p}_a \tilde {R}^2}. \end{align}
While we focus on small squeeze numbers, we note for completeness that the averaged normal force acting on a sheet subject to a squeeze film motion can be approximated analytically for arbitrary values of ${{{Sq}}}_{{bv}}$
(Taylor & Saffman Reference Taylor and Saffman1957; Langlois Reference Langlois1962).
${{{Sq}}}_{{bv}}$
(Taylor & Saffman Reference Taylor and Saffman1957; Langlois Reference Langlois1962).
5.2. Soft sheets $(a{,}b)$
Effect of the fluid compressibility for
$(a{,}b)$
Effect of the fluid compressibility for $ \textit{Re}_{{bv}}=\mathcal{I}_{{bv}}=0$
and
$ \textit{Re}_{{bv}}=\mathcal{I}_{{bv}}=0$
and ${{{Sq}}}_{{bv}}\gt 0$
. Panels
${{{Sq}}}_{{bv}}\gt 0$
. Panels $(a{,}b)$
correspond to the weak forcing regime with
$(a{,}b)$
correspond to the weak forcing regime with $\alpha =1$
and panels
$\alpha =1$
and panels $(c{,}d)$
to the strong forcing regime with
$(c{,}d)$
to the strong forcing regime with $\alpha =20$
. The dashed lines in panels
$\alpha =20$
. The dashed lines in panels $(b)$
and
$(b)$
and $(d)$
are derived from (5.2) and show
$(d)$
are derived from (5.2) and show $\mathcal{G}_{\textit{max}}({{{Sq}}}_{{bv}})=\mathcal{G}_{\textit{max}}({{{Sq}}}_{{bv}}=0)-1.5 \alpha ^2 {{{Sq}}}_{{bv}}$
. We primarily captured the first equilibrium branch and did not systematically investigate the entire extent of the bifurcation diagrams.
$\mathcal{G}_{\textit{max}}({{{Sq}}}_{{bv}})=\mathcal{G}_{\textit{max}}({{{Sq}}}_{{bv}}=0)-1.5 \alpha ^2 {{{Sq}}}_{{bv}}$
. We primarily captured the first equilibrium branch and did not systematically investigate the entire extent of the bifurcation diagrams.

We solve the governing equations (2.4)–(2.6) with boundary conditions (2.10) and (2.11) in the inertialess limit ( $ \textit{Re}_{{bv}}=\mathcal{I}_{{bv}}=0$
); in this case, the pressure boundary condition reduces to
$ \textit{Re}_{{bv}}=\mathcal{I}_{{bv}}=0$
); in this case, the pressure boundary condition reduces to $p=0$
. Our results for the weak forcing regime,
$p=0$
. Our results for the weak forcing regime, $\alpha =1$
, are shown in figure 10
$\alpha =1$
, are shown in figure 10 $(a{,}b)$
. They are consistent with (5.2) and the main effect of compressibility is indeed to modify the effective weight. As compressibility translates the bifurcation diagrams to lower weights, we observe the possibility of reaching an equilibrium height
$(a{,}b)$
. They are consistent with (5.2) and the main effect of compressibility is indeed to modify the effective weight. As compressibility translates the bifurcation diagrams to lower weights, we observe the possibility of reaching an equilibrium height $h_{{eq}}\gt 0$
for
$h_{{eq}}\gt 0$
for $\mathcal{G}\lt 0$
, corresponding to gravity pointing towards the wall. In these cases, the repulsive effect of compressibility can balance the adhesive effects of both elastohydrodynamics and gravity. This is reminiscent of squeeze-film and near-field acoustic levitation (Shi et al. Reference Shi, Feng, Hu, Zhu and Cui2019), where objects can levitate above rapidly vibrating surfaces.
$\mathcal{G}\lt 0$
, corresponding to gravity pointing towards the wall. In these cases, the repulsive effect of compressibility can balance the adhesive effects of both elastohydrodynamics and gravity. This is reminiscent of squeeze-film and near-field acoustic levitation (Shi et al. Reference Shi, Feng, Hu, Zhu and Cui2019), where objects can levitate above rapidly vibrating surfaces.
Figure 10 $(c{,}d)$
shows similar results for the strong forcing regime,
$(c{,}d)$
shows similar results for the strong forcing regime, $\alpha =20$
. The relation (5.2) predicts
$\alpha =20$
. The relation (5.2) predicts $\mathcal{G}_{\textit{max}}$
accurately up to
$\mathcal{G}_{\textit{max}}$
accurately up to ${{{Sq}}}_{{bv}} \approx 10^{-3}$
, but underestimates the effective weight by up to
${{{Sq}}}_{{bv}} \approx 10^{-3}$
, but underestimates the effective weight by up to $50\,\%$
at larger squeeze numbers, likely because of the interactions between elastic deformations and compressibility are neglected by this simple scaling. The effects on the equilibrium curves are also more complex than a simple translation of the bifurcation diagram; in particular, we observe the possibility of hysteresis.
$50\,\%$
at larger squeeze numbers, likely because of the interactions between elastic deformations and compressibility are neglected by this simple scaling. The effects on the equilibrium curves are also more complex than a simple translation of the bifurcation diagram; in particular, we observe the possibility of hysteresis.
6. Discussion and conclusion
We have investigated numerically the adhesion of elastic sheets vibrating near a wall. Our analysis extends our previous work (Poulain et al. Reference Poulain, Koch, Mahadevan and Carlson2025) by systematically exploring the regime beyond the weak-forcing limit, and by incorporating the first-order corrections of fluid inertia and fluid compressibility into the viscous lubrication dynamics. By using a combination of asymptotic analysis and numerical simulations, we have characterised the conditions under which contactless adhesion or hovering can be maintained.
First, we have neglected additional effects and have shown that the viscous elastohydrodynamic adhesion exhibits two regimes depending on the relative strength of the forcing, $\alpha =\tilde {F}_a/\tilde {F}_{{bv}}$
with
$\alpha =\tilde {F}_a/\tilde {F}_{{bv}}$
with $\tilde {F}_a$
the forcing amplitude and
$\tilde {F}_a$
the forcing amplitude and $\tilde {F}_{{bv}}=(\tilde {\mu } \tilde {\omega } \tilde {B}^2)^{1/3}$
the elastohydrodynamic force scale. For weak forcings (
$\tilde {F}_{{bv}}=(\tilde {\mu } \tilde {\omega } \tilde {B}^2)^{1/3}$
the elastohydrodynamic force scale. For weak forcings ( $\alpha \lesssim 1$
), the full dynamics can be treated analytically using asymptotic analysis, and the maximum supported weight scales as
$\alpha \lesssim 1$
), the full dynamics can be treated analytically using asymptotic analysis, and the maximum supported weight scales as $\tilde {W}_{\textit{max}}\sim \tilde {F}_a^2/\tilde {F}_{{bv}}$
. As the forcing strength increases, the maximum supported weight saturates and our simulations show
$\tilde {W}_{\textit{max}}\sim \tilde {F}_a^2/\tilde {F}_{{bv}}$
. As the forcing strength increases, the maximum supported weight saturates and our simulations show $\tilde {W}_{\textit{max}}\sim \tilde {F}_{{bv}}$
for
$\tilde {W}_{\textit{max}}\sim \tilde {F}_{{bv}}$
for $\alpha \gg 1$
. In both cases, the adhesion height scales as
$\alpha \gg 1$
. In both cases, the adhesion height scales as $\tilde {h}_{{eq}}\sim \tilde {H}_{{bv}}=\tilde {R}^2 (\tilde {\mu } \tilde {\omega }/\tilde {B})^{1/3}$
and the sheets respond with higher-order modes of deformation as both the weight and adhesion height decrease.
$\tilde {h}_{{eq}}\sim \tilde {H}_{{bv}}=\tilde {R}^2 (\tilde {\mu } \tilde {\omega }/\tilde {B})^{1/3}$
and the sheets respond with higher-order modes of deformation as both the weight and adhesion height decrease.
In the strong forcing limit, we have identified a transition from contactless adhesion to a regime where the sheet’s edges periodically come into contact with the wall. While the present model captures this transition numerically, a complete description of the physics of contact would require additional modelling of the sheet–substrate interactions, and physical effects at a very small scale may additionally impact the dynamics. We also expect that the precise weight distribution, assumed uniform in this work, would influence not only contact but the overall hovering dynamics. Studying the effect of a non-uniform weight or of an external pulling force would thus be a natural extension enabling more direct quantitative comparison with experiments.
In addition to the viscous elastohydrodynamics, we have analysed the role of fluid inertia by accounting for finite Reynolds numbers ${\textit{Re}}_{{bv}}=\tilde {\rho }_a \tilde {R}^2 \tilde {\omega }^{2}/\tilde {F}_{{bv}}$
. We have quantified how the Bernoulli-like increase of pressure due to the stagnation point in the thin gap leads to an overall destabilising effect. This decreases the maximum supported weight such that the Reynolds number based on the equilibrium height,
${\textit{Re}}_{{bv}}=\tilde {\rho }_a \tilde {R}^2 \tilde {\omega }^{2}/\tilde {F}_{{bv}}$
. We have quantified how the Bernoulli-like increase of pressure due to the stagnation point in the thin gap leads to an overall destabilising effect. This decreases the maximum supported weight such that the Reynolds number based on the equilibrium height, ${\textit{Re}}_{{eq}}={\tilde {\rho }_a \tilde {\omega } \tilde {h}_{{eq}}^2}/{\tilde {\mu }}$
remains of order 1–10. In particular, we predict that the sheet cannot respond solely through the first-order mode of bending deformations and that higher-order deformation modes must be excited in experiments; a prediction that can be tested experimentally. While fluid inertia is expected to influence elastohydrodynamic adhesion significantly, our current understanding of its contribution remains qualitative. A more detailed analysis of the fluid–structure coupling at intermediate Reynolds numbers would be valuable for future work and directly relevant to experiments. Indeed, Weston-Dawkes et al. (Reference Weston-Dawkes, Adibnazari, Hu, Everman, Gravish and Tolley2021) report heights such that
${\textit{Re}}_{{eq}}={\tilde {\rho }_a \tilde {\omega } \tilde {h}_{{eq}}^2}/{\tilde {\mu }}$
remains of order 1–10. In particular, we predict that the sheet cannot respond solely through the first-order mode of bending deformations and that higher-order deformation modes must be excited in experiments; a prediction that can be tested experimentally. While fluid inertia is expected to influence elastohydrodynamic adhesion significantly, our current understanding of its contribution remains qualitative. A more detailed analysis of the fluid–structure coupling at intermediate Reynolds numbers would be valuable for future work and directly relevant to experiments. Indeed, Weston-Dawkes et al. (Reference Weston-Dawkes, Adibnazari, Hu, Everman, Gravish and Tolley2021) report heights such that ${\textit{Re}}_{{eq}}=\mathcal{O}({10{-}100})$
. The range of validity of inertial corrections to lubrication theory, as well as the appropriate boundary conditions, remains an open question.
${\textit{Re}}_{{eq}}=\mathcal{O}({10{-}100})$
. The range of validity of inertial corrections to lubrication theory, as well as the appropriate boundary conditions, remains an open question.
Finally, we have considered the influence of the ambient pressure for small values of the squeeze number ${{{Sq}}}_{{bv}}=(\tilde {\mu } \tilde {\omega } \tilde {B}^2)^{1/3}/\tilde {p}_a \tilde {R}^2$
and find that compressibility corrections can be interpreted as an effective weight, which modifies the adhesion threshold predicted by the incompressible analysis. This destabilising effect remains modest under typical experimental conditions, and our analysis suggests that compressibility is not a dominant mechanism in the experiments of Colasante (Reference Colasante2016) and Weston-Dawkes et al. (Reference Weston-Dawkes, Adibnazari, Hu, Everman, Gravish and Tolley2021).
${{{Sq}}}_{{bv}}=(\tilde {\mu } \tilde {\omega } \tilde {B}^2)^{1/3}/\tilde {p}_a \tilde {R}^2$
and find that compressibility corrections can be interpreted as an effective weight, which modifies the adhesion threshold predicted by the incompressible analysis. This destabilising effect remains modest under typical experimental conditions, and our analysis suggests that compressibility is not a dominant mechanism in the experiments of Colasante (Reference Colasante2016) and Weston-Dawkes et al. (Reference Weston-Dawkes, Adibnazari, Hu, Everman, Gravish and Tolley2021).
The present model relies on several simplifying assumptions. In particular, it treats the deformation of the sheets as pure bending. While we do not expect qualitatively different behaviours between results in one or two dimensions for small deformations, this neglects any stretching that would be important for large deformations and the possibility of non-axisymmetrical effects. Second, we have neglected solid inertia. In practice, the dimensionless parameter comparing effects of solid inertia to viscous effects, $\mathcal{I}_{{bv}}=\tilde {\rho }_s \tilde {e} \tilde {\omega }^2 \tilde {R}^4/\tilde {B} ={{Re}}_{{bv}} (\tilde {\rho }_s/\tilde {\rho }_a) \tilde {e} (\tilde {\mu } \tilde {\omega }/\tilde {B})^{1/3}$
, can be large and the role of solid inertia, along with possible resonance effects (Ramanarayanan & Sánchez Reference Ramanarayanan and Sánchez2024), should be addressed to characterise the system fully.
$\mathcal{I}_{{bv}}=\tilde {\rho }_s \tilde {e} \tilde {\omega }^2 \tilde {R}^4/\tilde {B} ={{Re}}_{{bv}} (\tilde {\rho }_s/\tilde {\rho }_a) \tilde {e} (\tilde {\mu } \tilde {\omega }/\tilde {B})^{1/3}$
, can be large and the role of solid inertia, along with possible resonance effects (Ramanarayanan & Sánchez Reference Ramanarayanan and Sánchez2024), should be addressed to characterise the system fully.
In conclusion, our model provides a comprehensive framework for understanding viscous elastohydrodynamic adhesion in active systems across scales. While our analysis has been motivated by forced centimetric sheets, experimentally shown to support from a few hundred grams to tens of kilograms, the underlying interplay among periodic forcing, elastic deformation and the nonlinear response of confined viscous flows is general. We anticipate that similar principles could be leveraged in microscale systems: applications might include tuneable adhesion forces in MEMS or novel pick-and-place strategies for small objects as an alternative to standard, rigid inverted near-field acoustic levitation. One natural avenue for future investigation is the effect of surface texture, as experiments have shown that surface roughness can be detrimental to adhesion (Weston-Dawkes et al. Reference Weston-Dawkes, Adibnazari, Hu, Everman, Gravish and Tolley2021) while large cracks are detrimental at larger scales (Ramanarayanan & Sánchez Reference Ramanarayanan and Sánchez2024). This remains to be understood, and also raises the question of whether textured surfaces can be used as a means to control adhesion and, possibly, lateral translation. Indeed, the vibrating sheet can translate along the surface when lateral symmetry is broken (Weston-Dawkes et al. Reference Weston-Dawkes, Adibnazari, Hu, Everman, Gravish and Tolley2021; Jia et al. Reference Jia, Ramanarayanan, Sanchez and Tolley2023; Ramanarayanan & Sánchez Reference Ramanarayanan and Sánchez2023), either through spatially varying forcing or gradients in material properties such as stiffness. Exploring this dynamics could allow for the design not only of contactless grippers, but also of soft vibrating ‘swimmers’ able to hover near surfaces. We hope that the predictions and perspectives developed herein will inspire detailed experimental investigations.
Acknowledgements
We thank Sami Al-Izzi, Annette Cazaubiel and Jingbang Liu for insightful discussions.
Funding
S.P. and A.C. acknowledge funding from the Research Council of Norway through project 341989. T.K. acknowledges funding from the European Union’s Horizon 2020 research and innovation programme under the Marie Sklodowska-Curie grant agreement No 801133. L.M. acknowledges funding from the Simons Foundation and the Henri Seydoux Fund.
Declaration of interests
The authors report no conflict of interest.
Appendix A. Inertial correction to lubrication theory
In this appendix, we consider no compressible effect and start from the incompressible Navier–Stokes equation:
 \begin{align} \tilde {\rho } \left ({\frac {\partial \boldsymbol{\tilde {v}}}{\partial \tilde {t}}}+\boldsymbol{\tilde {v}} \boldsymbol{\cdot }\boldsymbol{\tilde {\boldsymbol{\nabla }}} \boldsymbol{\tilde {v}} \right )&=-\boldsymbol{\tilde {\boldsymbol{\nabla }}} \tilde {p} + \tilde {\mu } {\nabla }^2 \boldsymbol{\tilde {v}}, \\[-10pt] \nonumber \end{align}
 \begin{align} \boldsymbol{\tilde {\boldsymbol{\nabla }}} \boldsymbol{\cdot }\boldsymbol{\tilde {v}} &= 0. \\[9pt] \nonumber \end{align}
A.1 Scalings
We introduce the characteristic horizontal length scale $\tilde {R}$
and vertical length scale
$\tilde {R}$
and vertical length scale $\tilde {H}$
representing respectively the radius of the sheet and the thickness of the gap. The aspect ratio is
$\tilde {H}$
representing respectively the radius of the sheet and the thickness of the gap. The aspect ratio is $\varepsilon =\tilde {H}/\tilde {R}\ll 1$
. We let
$\varepsilon =\tilde {H}/\tilde {R}\ll 1$
. We let $\tilde {U}$
be the vertical velocity scale; (A1b
) gives the horizontal velocity scale as
$\tilde {U}$
be the vertical velocity scale; (A1b
) gives the horizontal velocity scale as $\tilde {U}/\tilde {\varepsilon }$
. Following lubrication theory, we scale the pressure by realising that the longitudinal pressure gradients induce a flow resisted by transverse viscous stresses (Batchelor Reference Batchelor1967), leading to the pressure scale
$\tilde {U}/\tilde {\varepsilon }$
. Following lubrication theory, we scale the pressure by realising that the longitudinal pressure gradients induce a flow resisted by transverse viscous stresses (Batchelor Reference Batchelor1967), leading to the pressure scale $\tilde {P}=\tilde {\mu } \tilde {U} /(\varepsilon ^2 \tilde {H})$
. We decompose the velocity
$\tilde {P}=\tilde {\mu } \tilde {U} /(\varepsilon ^2 \tilde {H})$
. We decompose the velocity $\boldsymbol{v}=(\boldsymbol{v}_\perp , v_z)$
into its horizontal and vertical components, and introduce the following dimensionless variables:
$\boldsymbol{v}=(\boldsymbol{v}_\perp , v_z)$
into its horizontal and vertical components, and introduce the following dimensionless variables:
 \begin{align} \begin{split} t = \tilde {t}\tilde {\omega }, \quad ( x, y)=(\tilde {x},\tilde {y})/\tilde {R}, \quad ( z, h)=(\tilde {z},\tilde {h})/\tilde {H}, \\ \quad {\boldsymbol{v}}_\perp =\varepsilon \tilde {\boldsymbol{v}}_\perp /\tilde {U}, \quad v_z =\tilde {v}_z/\tilde {U}, \quad p = \varepsilon ^2 \tilde {p} / (\tilde {\mu } \tilde {U}), \quad \rho = \tilde {\rho }/\tilde {\rho }_a. \end{split} \end{align}
The dimensionless horizontal momentum balance (A1a ) is
 \begin{align}{Wo}^2 {\frac {\partial \boldsymbol{v}_\perp }{\partial t}} + {{Re}}\left (\boldsymbol{v} \boldsymbol{\cdot }\boldsymbol{\nabla }\right )\boldsymbol{v}_\perp =-\boldsymbol{\nabla }_\perp p + {\frac {\partial ^2\boldsymbol{v}_\perp }{\partial z^2}}+ \mathcal{O}({\varepsilon ^2}). \end{align}
We let $\tilde {t}_\mu =\tilde {\rho }_a \tilde {H}^2/\tilde {\mu }$
be the time scale for transverse diffusion and
$\tilde {t}_\mu =\tilde {\rho }_a \tilde {H}^2/\tilde {\mu }$
be the time scale for transverse diffusion and $\tilde {t}_c=\tilde {H}/\tilde {V}$
the advective time scale. The Womersley number
$\tilde {t}_c=\tilde {H}/\tilde {V}$
the advective time scale. The Womersley number ${Wo}$
is defined as
${Wo}$
is defined as ${Wo}^2=\tilde {\omega } \tilde {t}_\mu =\tilde {\rho }_a \tilde {\omega } \tilde {H}^2/\tilde {\mu }$
and characterises the unsteady inertia, while the Reynolds number
${Wo}^2=\tilde {\omega } \tilde {t}_\mu =\tilde {\rho }_a \tilde {\omega } \tilde {H}^2/\tilde {\mu }$
and characterises the unsteady inertia, while the Reynolds number ${\textit{Re}}=\tilde {t}_\mu /\tilde {t}_c=\tilde {\rho }_a \tilde {V} \tilde {H}/\tilde {\mu }$
characterises convective inertia. Their ratio defines a Strouhal number
${\textit{Re}}=\tilde {t}_\mu /\tilde {t}_c=\tilde {\rho }_a \tilde {V} \tilde {H}/\tilde {\mu }$
characterises convective inertia. Their ratio defines a Strouhal number ${St}=\tilde {\omega } \tilde {t}_c=\mathrm{Wo}^2/{{Re}}=\tilde {\omega } \tilde {H}/\tilde {V}$
.
${St}=\tilde {\omega } \tilde {t}_c=\mathrm{Wo}^2/{{Re}}=\tilde {\omega } \tilde {H}/\tilde {V}$
.
The flow is driven by vibrations of amplitude $\tilde {a}$
and frequency
$\tilde {a}$
and frequency $\tilde {\omega }$
. The vertical speed scale is then
$\tilde {\omega }$
. The vertical speed scale is then $\tilde {V}=\tilde {\omega } \tilde {a}$
, so that
$\tilde {V}=\tilde {\omega } \tilde {a}$
, so that ${St}=\tilde {H}/\tilde {a}$
. When
${St}=\tilde {H}/\tilde {a}$
. When $\tilde {a}/\tilde {H} \ll 1$
, i.e. for small vibration amplitude, it may be possible to neglect convective acceleration but to include unsteady effects. This leads to the unsteady Stokes equation, which is linear and allows for analytical treatments of oscillatory flows (e.g. Womersley Reference Womersley1955; Fouxon & Leshansky Reference Fouxon and Leshansky2018; Fouxon et al. Reference Fouxon, Rubinstein, Weinstein and Leshansky2020; Zhang et al. Reference Zhang, Bertin, Essink, Zhang, Fares, Shen, Bickel, Salez and Maali2023; Bigan et al. Reference Bigan, Lizée, Pascual, Niguès, Bocquet and Siria2024). In our case, the vibration amplitude is a priori unknown and can be comparable to
$\tilde {a}/\tilde {H} \ll 1$
, i.e. for small vibration amplitude, it may be possible to neglect convective acceleration but to include unsteady effects. This leads to the unsteady Stokes equation, which is linear and allows for analytical treatments of oscillatory flows (e.g. Womersley Reference Womersley1955; Fouxon & Leshansky Reference Fouxon and Leshansky2018; Fouxon et al. Reference Fouxon, Rubinstein, Weinstein and Leshansky2020; Zhang et al. Reference Zhang, Bertin, Essink, Zhang, Fares, Shen, Bickel, Salez and Maali2023; Bigan et al. Reference Bigan, Lizée, Pascual, Niguès, Bocquet and Siria2024). In our case, the vibration amplitude is a priori unknown and can be comparable to $\tilde {H}$
. We therefore scale it as the gap height itself, letting
$\tilde {H}$
. We therefore scale it as the gap height itself, letting $\tilde {a}=\tilde {H}$
. Then,
$\tilde {a}=\tilde {H}$
. Then, ${St}=1$
,
${St}=1$
, ${Wo}^2={{Re}}=\tilde {\rho }_a \omega \tilde {H}^2/\tilde {\mu }$
, and we include the effects of unsteady and convective inertia at the same asymptotic order
${Wo}^2={{Re}}=\tilde {\rho }_a \omega \tilde {H}^2/\tilde {\mu }$
, and we include the effects of unsteady and convective inertia at the same asymptotic order $\mathcal{O}({{{Re}}})$
.
$\mathcal{O}({{{Re}}})$
.
A.2 Elastohydrodynamic inertial lubrication equations
We make the assumption ${St}=1$
,
${St}=1$
, ${\textit{Re}}={Wo}$
, and rewrite (A1) differentiating between the horizontal direction
${\textit{Re}}={Wo}$
, and rewrite (A1) differentiating between the horizontal direction $\boldsymbol{x}_\perp =(x,y)$
and the vertical direction
$\boldsymbol{x}_\perp =(x,y)$
and the vertical direction $z$
:
$z$
:
 \begin{align} {{Re}} \left ( {\frac {\partial }{\partial t}}+\left (\boldsymbol{ v} \boldsymbol{\cdot }\boldsymbol{\nabla }\right )\right )\boldsymbol{ v}_\perp &= -{{\boldsymbol{\nabla }}}_\perp p + {\frac {\partial ^2\boldsymbol{ v}_\perp }{\partial z^2}} + \mathcal{O}({\varepsilon ^2}), \\[-10pt] \nonumber \end{align}
 \begin{align} 0 &= -{\frac {\partial p}{\partial z}} + \mathcal{O} \big({\varepsilon ^2,\varepsilon ^2 {{Re}}}\big) , \\[-10pt] \nonumber \end{align}
 \begin{align} \boldsymbol{\nabla }_\perp \boldsymbol{\cdot }{\boldsymbol{v}}_\perp + {\frac {\partial v_z}{\partial z}} &=0. \\[9pt] \nonumber \end{align}
We seek a depth-integrated description of the flow. The momentum balance normal to the wall (A4b
) shows that $p$
is independent of
$p$
is independent of $z$
. Integrating (A4c
) from the wall at
$z$
. Integrating (A4c
) from the wall at $z=0$
to the sheet at
$z=0$
to the sheet at $z=h$
and applying Leibniz integral rule together with the kinematic boundary condition
$z=h$
and applying Leibniz integral rule together with the kinematic boundary condition $\partial h/\partial t + \boldsymbol{v}_\perp \boldsymbol{\nabla }_\perp h = v_z\lvert _{z=h}$
yields
$\partial h/\partial t + \boldsymbol{v}_\perp \boldsymbol{\nabla }_\perp h = v_z\lvert _{z=h}$
yields
 \begin{align} \begin{split} {\frac {\partial h}{\partial t}} + \boldsymbol{\nabla }_\perp \boldsymbol{\cdot }\boldsymbol{q}=0, \end{split} \end{align}
with $ \boldsymbol{q}= \int _0^h \boldsymbol{v}_\perp \,{\mathrm{d}}z = \tilde {\boldsymbol{q}}/\tilde {\omega } \tilde {L} \tilde {h}$
the volumetric flux along the wall.
$ \boldsymbol{q}= \int _0^h \boldsymbol{v}_\perp \,{\mathrm{d}}z = \tilde {\boldsymbol{q}}/\tilde {\omega } \tilde {L} \tilde {h}$
the volumetric flux along the wall.
We then follow ideas from Rojas et al. (Reference Rojas, Argentina, Cerda and Tirapegui2010), who included the effects of inertia at first order in the Reynolds number to study thin liquid films: we adapt their derivation to consider a solid surface instead. We start with a Taylor expansion of the velocity and pressure in the normal direction:
 \begin{align} \begin{split} \boldsymbol{v}_\perp (\boldsymbol{x},t)&=\sum _{n=0}^{+\infty } \boldsymbol{v}_n(\boldsymbol{x}_\perp ,t)\frac {z^{n+1}}{(n+1)!}, \\ v_z (\boldsymbol{x},t)&=-\sum _{n=0}^{+\infty }\left (\boldsymbol{\nabla }_\perp \boldsymbol{\cdot }\boldsymbol{v}_n\right )(\boldsymbol{x}_\perp ,t)\frac {z^{n+2}}{(n+2)!}, \\ p (\boldsymbol{x},t)&=\sum _{n=0}^{+\infty } p_n(\boldsymbol{x}_\perp ,t)\frac {z^{n}}{n!}. \end{split} \end{align}
We can write the first expression thanks to the no-slip condition $\boldsymbol{v}_\perp =0$
at
$\boldsymbol{v}_\perp =0$
at $z=0$
, while the second expression comes from both the no-penetration condition
$z=0$
, while the second expression comes from both the no-penetration condition $v_z=0$
at
$v_z=0$
at $z=0$
and the continuity equation (A4c
). Inserting (A6) into (A4) and identifying the coefficients of the Taylor series yields
$z=0$
and the continuity equation (A4c
). Inserting (A6) into (A4) and identifying the coefficients of the Taylor series yields
 \begin{align} \begin{split} p_{n\geqslant 1} &= \mathcal{O}(\varepsilon ^2,\varepsilon ^2{{Re}}), \\[5pt]\boldsymbol{v}_1 &= \boldsymbol{\nabla }_\perp p_0, \\[5pt]\boldsymbol{v}_2 &={{Re}} {\frac {\partial \boldsymbol{v}_0}{\partial t}} + \mathcal{O}(\varepsilon ^2), \\[5pt]\boldsymbol{v}_3 &= {{Re}} \left [{\frac {\partial \left (\boldsymbol{\nabla }_\perp p_0\right )}{\partial t}} + 2\left (\boldsymbol{v}_0 \boldsymbol{\cdot }\boldsymbol{\nabla }_\perp \right )\boldsymbol{v}_0 - \boldsymbol{v}_0\left (\boldsymbol{\nabla }_\perp \boldsymbol{\cdot }\boldsymbol{v}_0\right )\right ] +\mathcal{O}(\varepsilon ^2),\\[5pt]\boldsymbol{v}_4 &= {{Re}} \left [3\left (\boldsymbol{\nabla }_\perp p_0\boldsymbol{\cdot }\boldsymbol{\nabla }_\perp \right )\boldsymbol{v}_0 - 3\left (\boldsymbol{\nabla }_\perp \boldsymbol{\cdot }\boldsymbol{v}_0\right )\boldsymbol{\nabla }_\perp p_0 + 3 \left (\boldsymbol{v}_0\boldsymbol{\cdot }\boldsymbol{\nabla }_\perp \right )\boldsymbol{\nabla }_\perp p_0 - \right . \\[5pt]& \qquad \qquad \left . - \boldsymbol{v}_0\left (\boldsymbol{\nabla }_\perp ^2 p_0\right ) \right ] +\mathcal{O}\big (\varepsilon ^2,\varepsilon ^2{{Re}},{{Re}}^2\big ), \\[5pt]\boldsymbol{v}_5 &= {{Re}}\left [-4\boldsymbol{\nabla }_\perp p_0 \left (\boldsymbol{\nabla }_\perp ^2p_0\right ) + 6\left (\boldsymbol{\nabla }_\perp p_0 \boldsymbol{\cdot }\boldsymbol{\nabla }_\perp \right )\boldsymbol{\nabla }_\perp p_0\right ] + \mathcal{O}\big (\varepsilon ^2,\varepsilon ^2{{Re}},{{Re}}^2\big ), \\[5pt]\boldsymbol{v}_{n \geqslant 6} &= \mathcal{O}\big (\varepsilon ^2,\varepsilon ^2{{Re}},{{Re}}^2\big ). \end{split} \end{align}
We seek $\boldsymbol{v}_0$
and
$\boldsymbol{v}_0$
and $p_0$
, and expand them in powers of the Reynolds number:
$p_0$
, and expand them in powers of the Reynolds number:
 \begin{align} \begin{split} \boldsymbol{v}_0 &= \boldsymbol{v}_0^{(0)} + {{Re}}\,\boldsymbol{v}_0^{(1)} + \mathcal{O}({{Re}}^2), \\ p_0 &= p_0^{(0)} + {{Re}}\,p_0^{(1)} + \mathcal{O}({{Re}}^2). \end{split} \end{align}
Using the definition of the volumetric flux $\boldsymbol{q}$
and evaluating the no-slip condition
$\boldsymbol{q}$
and evaluating the no-slip condition $\boldsymbol{v}_\perp =0$
at
$\boldsymbol{v}_\perp =0$
at $z=h$
, we find
$z=h$
, we find
 \begin{align} \begin{split} \boldsymbol{q} =& \left [\boldsymbol{v}_0^{(0)} \frac {h^2}{2!} + \boldsymbol{\nabla }_\perp p_0^{(0)} \frac {h^3}{3!}\right ] + \\& {{Re}} \left [ \boldsymbol{v}_0^{(1)} \frac {h^2}{2!} + \boldsymbol{\nabla }_\perp p_0^{(1)} \frac {h^3}{3!} + \boldsymbol{v}_2^{(1)} \frac {h^4}{4!} + \boldsymbol{v}_3^{(1)} \frac {h^5}{5!} + \boldsymbol{v}_4^{(1)} \frac {h^6}{6!} + \boldsymbol{v}_5 ^{(1)}\frac {h^7}{7!} \right ]\!, \\0 =& \left [\boldsymbol{v}_0^{(0)}h + \boldsymbol{\nabla }_\perp p_0^{(0)} \frac {h^2}{2!}\right ] + \\& {{Re}} \left [ \boldsymbol{v}_0^{(1)} h + \boldsymbol{\nabla }_\perp p_0^{(1)} \frac {h^2}{2!} + \boldsymbol{v}_2^{(1)} \frac {h^3}{3!} + \boldsymbol{v}_3^{(1)} \frac {h^4}{4!} + \boldsymbol{v}_4^{(1)} \frac {h^5}{5!} + \boldsymbol{v}_5^{(1)} \frac {h^6}{6!} \right ]\!. \end{split} \end{align}
We can solve this linear system order by order to express $\boldsymbol{v}_0$
and
$\boldsymbol{v}_0$
and $\boldsymbol{\nabla }_\perp p_0$
as a function of
$\boldsymbol{\nabla }_\perp p_0$
as a function of $\boldsymbol{q}$
and
$\boldsymbol{q}$
and $h$
:
$h$
:
 \begin{align} \begin{aligned} \boldsymbol{v}_0^{(0)} &= \frac {6 \boldsymbol{q}}{h^2}, \\ \boldsymbol{\nabla }_\perp p_0^{(0)} &= -\frac {12 \boldsymbol{q}}{h^3}, \\ \boldsymbol{v}_0^{(1)} &= \frac {h^2}{12}\boldsymbol{v}_2^{(1)} + \frac {h^3}{30}\boldsymbol{v}_3^{(1)} + \frac {h^4}{120}\boldsymbol{v}_4^{(1)} + \frac {h^5}{630}\boldsymbol{v}_5^{(1)} , \\ \boldsymbol{\nabla }_\perp p_0^{(1)} &= -\frac {h}{2}\boldsymbol{v}_2^{(1)} - \frac {3h^2}{20}\boldsymbol{v}_3^{(1)} - \frac {h^3}{30}\boldsymbol{v}_4^{(1)} - \frac {h^4}{168}\boldsymbol{v}_5^{(1)} , \end{aligned} \end{align}
where the $\boldsymbol{v}_{\boldsymbol{n}}$
,
$\boldsymbol{v}_{\boldsymbol{n}}$
, $n\geqslant 2$
, are found from (A7). After lengthy calculations, we find the contribution at
$n\geqslant 2$
, are found from (A7). After lengthy calculations, we find the contribution at $\mathcal{O} ({{Re}})$
of the pressure gradient as
$\mathcal{O} ({{Re}})$
of the pressure gradient as
 \begin{align} \boldsymbol{\nabla }_\perp p_0^{(1)}= -\frac 65 {\frac {\partial }{\partial t}}\left (\frac {\boldsymbol{q}}{h}\right ) - \frac {54}{35} \frac {\boldsymbol{q}}{h} \boldsymbol{\cdot }\boldsymbol{\nabla }_\perp \left (\frac {\boldsymbol{q}}{h}\right ) + \frac 6{35} \frac {\boldsymbol{q}}{h^2}{\frac {\partial h}{\partial t}}, \end{align}
which is the same as for the case of a free surface (Rojas et al. Reference Rojas, Argentina, Cerda and Tirapegui2010), even though the velocity profile (A7) differs. Equation (A10) finally gives the link between the velocity flux $\boldsymbol{q}$
flux and the pressure gradient as
$\boldsymbol{q}$
flux and the pressure gradient as
 \begin{align} 12 \boldsymbol{q} + h^3\boldsymbol{\nabla }_\perp p + \frac 65{{Re}} h^3 \left ({\frac {\partial }{\partial t}}\left (\frac {\boldsymbol{q}}{h}\right ) + \frac {9}{7} \frac {\boldsymbol{q}}{h} \boldsymbol{\cdot }\boldsymbol{\nabla }_\perp \left (\frac {\boldsymbol{q}}{h}\right ) - \frac 1{7} \frac {\boldsymbol{q}}{h^2}{\frac {\partial h}{\partial t}}\right ) = 0, \end{align}
or, in dimensional units,
 \begin{align} 12\tilde {\mu } \tilde {\boldsymbol{q}} + \tilde {h}^3 \tilde {\boldsymbol{\nabla }}_\perp \tilde {p} + \frac 65\tilde {\rho } \tilde {h}^3 \left ({\frac {\partial }{\partial \tilde {t}}}\left (\frac {\tilde {\boldsymbol{q}}}{\tilde {h}}\right ) + \frac {9}{7} \frac {\tilde {\boldsymbol{q}}}{\tilde {h}} \boldsymbol{\cdot }\boldsymbol{\nabla }_\perp \left (\frac {\tilde {\boldsymbol{q}}}{\tilde {h}}\right ) - \frac 1{7} \frac {\tilde {\boldsymbol{q}}}{\tilde {h}^2}{\frac {\partial \tilde {h}}{\partial \tilde {t}}}\right ) = 0. \end{align}
This recovers the results of the analyses of Kuzma (Reference Kuzma1968), Tichy & Winer (Reference Tichy and Winer1970), Jones & Wilson (Reference Jones and Wilson1975) when $h$
is the distance between two rigid, horizontal plates with then
$h$
is the distance between two rigid, horizontal plates with then $h=h(t)$
,
$h=h(t)$
, $q(x,t)=-(x/h)\,\mathrm{d }h/{\mathrm{d}}t$
in 1-D and
$q(x,t)=-(x/h)\,\mathrm{d }h/{\mathrm{d}}t$
in 1-D and $q(r,t)=-(r^2/2h)\,\mathrm{d }h/{\mathrm{d}}t$
in axisymmetric cylindrical coordinates with
$q(r,t)=-(r^2/2h)\,\mathrm{d }h/{\mathrm{d}}t$
in axisymmetric cylindrical coordinates with $r$
the radial coordinate. This also matches the first-order correction of Ishizawa (Reference Ishizawa1966) when, in addition,
$r$
the radial coordinate. This also matches the first-order correction of Ishizawa (Reference Ishizawa1966) when, in addition, $h(t)$
oscillates sinusoidally. We note that in (A12), the terms in parenthesis come respectively from the terms
$h(t)$
oscillates sinusoidally. We note that in (A12), the terms in parenthesis come respectively from the terms $\partial \boldsymbol{u}_\perp /\partial t$
,
$\partial \boldsymbol{u}_\perp /\partial t$
, $ \boldsymbol{u}_\perp \boldsymbol{\cdot }\boldsymbol{\nabla } \boldsymbol{u}_\perp$
and
$ \boldsymbol{u}_\perp \boldsymbol{\cdot }\boldsymbol{\nabla } \boldsymbol{u}_\perp$
and $\tilde {u}_z \partial \boldsymbol{u}_\perp /\partial z$
of the horizontal momentum balance (A4a
), with
$\tilde {u}_z \partial \boldsymbol{u}_\perp /\partial z$
of the horizontal momentum balance (A4a
), with $\boldsymbol{q}/h$
is the averaged horizontal velocity in the gap and
$\boldsymbol{q}/h$
is the averaged horizontal velocity in the gap and $(1/h) \partial h/\partial t$
the average vertical gradient of vertical velocity.
$(1/h) \partial h/\partial t$
the average vertical gradient of vertical velocity.
Appendix B. Pressure boundary condition
Without fluid inertia, for $ \textit{Re}_{{bv}}=0$
, we can impose the pressure at the edge of the sheet to match the ambient pressure:
$ \textit{Re}_{{bv}}=0$
, we can impose the pressure at the edge of the sheet to match the ambient pressure: $p=0$
. There is, in fact, a non-slender region near the edges where lubrication theory breaks down. There, we assume that the pressure difference scales as
$p=0$
. There is, in fact, a non-slender region near the edges where lubrication theory breaks down. There, we assume that the pressure difference scales as $\Delta \tilde {p}\sim \tilde {\mu } \tilde {v}_\perp /\tilde {L} \sim \tilde {\mu } \tilde {\omega }$
with
$\Delta \tilde {p}\sim \tilde {\mu } \tilde {v}_\perp /\tilde {L} \sim \tilde {\mu } \tilde {\omega }$
with $\tilde {v}_\perp =\tilde {\omega } \tilde {L}$
the horizontal velocity scale. Comparing this with the dynamic pressure, we find
$\tilde {v}_\perp =\tilde {\omega } \tilde {L}$
the horizontal velocity scale. Comparing this with the dynamic pressure, we find $\tilde {\rho }_a (\tilde {\omega } \tilde {H}_{{bv}})^2/\Delta \tilde {p} \sim {Re}_{{bv}}$
, which suggests a boundary effect at
$\tilde {\rho }_a (\tilde {\omega } \tilde {H}_{{bv}})^2/\Delta \tilde {p} \sim {Re}_{{bv}}$
, which suggests a boundary effect at $\mathcal{O}({{Re}_{{bv}}})$
.
$\mathcal{O}({{Re}_{{bv}}})$
.
This problem has been discussed in prior works. For the steady translation of a rigid sheet, Tuck & Bentwich (Reference Tuck and Bentwich1983) argue that when fluid leaves the gap, the pressure at the edge matches the ambient pressure, the classical condition for an exit jet. However, when fluid enters the gap, fluid is drawn from an extended region, leading to a pressure drop. Significant effects of inertia on the pressure distribution can arise due to this sole asymmetry in entrance and exit boundary conditions (Tuck & Bentwich Reference Tuck and Bentwich1983; Tichy & Bourgin Reference Tichy and Bourgin1985). For thin film flows between an oscillating plate and a stationary wall, the early study of Kuroda & Hori (Reference Kuroda and Hori1976) has been extensively followed (Hori Reference Hori2006) and matches the work of Tuck & Bentwich (Reference Tuck and Bentwich1983): at the edges, the author assumes $p=0$
when
$p=0$
when $\boldsymbol{q}\boldsymbol{\cdot }\boldsymbol{e_r}\gt 0$
(outflow) and
$\boldsymbol{q}\boldsymbol{\cdot }\boldsymbol{e_r}\gt 0$
(outflow) and $\tilde {p}=-(k/2)\tilde {\rho }_a ( \tilde {\boldsymbol{q}} \boldsymbol{\cdot }\boldsymbol{e_r} / \tilde {h} )^2$
otherwise (inflow). Here,
$\tilde {p}=-(k/2)\tilde {\rho }_a ( \tilde {\boldsymbol{q}} \boldsymbol{\cdot }\boldsymbol{e_r} / \tilde {h} )^2$
otherwise (inflow). Here, $\tilde {\boldsymbol{q}} \boldsymbol{\cdot }\boldsymbol{e_r}/\tilde {h}$
is the average velocity of the fluid leaving or entering the gap and
$\tilde {\boldsymbol{q}} \boldsymbol{\cdot }\boldsymbol{e_r}/\tilde {h}$
is the average velocity of the fluid leaving or entering the gap and $k\gt 0$
is a dimensionless coefficient taking into account losses in the Bernoulli pressure drop. In dimensionless quantities, this boundary condition reads
$k\gt 0$
is a dimensionless coefficient taking into account losses in the Bernoulli pressure drop. In dimensionless quantities, this boundary condition reads
 \begin{align} p= \begin{cases} 0\,&\text{if}\,\boldsymbol{q} \boldsymbol{\cdot }\boldsymbol{e}_r \gt 0\ \text{(outflow)}, \\ - \dfrac {k}{2} {Re}_{{bv}} \left (\dfrac {\boldsymbol{q} \boldsymbol{\cdot }\boldsymbol{e}_r }{h}\right )^2\,&\text{if}\,\boldsymbol{q} \boldsymbol{\cdot }\boldsymbol{e}_r \lt 0 \ \text{(inflow)}. \end{cases} \end{align}
The value $k=0.5$
is often adopted (Kuroda & Hori Reference Kuroda and Hori1976; Hori Reference Hori2006) by analogy with high-Reynolds-number pipe flows (Çengel & Cimbala Reference Çengel and Cimbala2013).
$k=0.5$
is often adopted (Kuroda & Hori Reference Kuroda and Hori1976; Hori Reference Hori2006) by analogy with high-Reynolds-number pipe flows (Çengel & Cimbala Reference Çengel and Cimbala2013).
Recently, Ramanarayanan et al. (Reference Ramanarayanan, Coenen and Sánchez2022) studied in detail the effect of inertia for the flow under a flat and circular rigid plate undergoing oscillations above a solid substrate as $\tilde {h}(\tilde {t})=\tilde {h}_0 ( 1+a\sin (\tilde {\omega } \tilde {t}) )$
,
$\tilde {h}(\tilde {t})=\tilde {h}_0 ( 1+a\sin (\tilde {\omega } \tilde {t}) )$
, $0\lt a\lt 1$
. They matched the thin-film flow in the gap to numerical solutions of the Navier–Stokes equations outside the gap for a wide range of Reynolds numbers
$0\lt a\lt 1$
. They matched the thin-film flow in the gap to numerical solutions of the Navier–Stokes equations outside the gap for a wide range of Reynolds numbers ${\textit{Re}}=\tilde {\rho }_a \tilde {\omega } \tilde {H}/\tilde {\mu }$
. They found that the pressure at the edges averaged over one period of oscillation is
${\textit{Re}}=\tilde {\rho }_a \tilde {\omega } \tilde {H}/\tilde {\mu }$
. They found that the pressure at the edges averaged over one period of oscillation is $\langle \tilde {p}_e \rangle =-K \tilde {\rho }_a \tilde {R}^2 a^2 \tilde {\omega }^2$
, with
$\langle \tilde {p}_e \rangle =-K \tilde {\rho }_a \tilde {R}^2 a^2 \tilde {\omega }^2$
, with $K$
a coefficient found numerically. For
$K$
a coefficient found numerically. For ${\textit{Re}}\lesssim 5$
,
${\textit{Re}}\lesssim 5$
, $K \approx 0.096$
. For
$K \approx 0.096$
. For ${\textit{Re}}\gtrsim 100$
,
${\textit{Re}}\gtrsim 100$
, $K=1/16$
if
$K=1/16$
if $(\tilde {H}/\tilde {R}) \ll a$
and
$(\tilde {H}/\tilde {R}) \ll a$
and $K=1/32$
if
$K=1/32$
if $(\tilde {H}/\tilde {R}) \gg a$
. The boundary condition (B1) applied to the same situation yields the same scaling:
$(\tilde {H}/\tilde {R}) \gg a$
. The boundary condition (B1) applied to the same situation yields the same scaling: $\langle \tilde {p}_e \rangle =-(k \pi /16) \tilde {\rho } \tilde {L}^2 a^2 \tilde {\omega }^2$
. This matches the various cases studied by Ramanarayanan et al. (Reference Ramanarayanan, Coenen and Sánchez2022) if
$\langle \tilde {p}_e \rangle =-(k \pi /16) \tilde {\rho } \tilde {L}^2 a^2 \tilde {\omega }^2$
. This matches the various cases studied by Ramanarayanan et al. (Reference Ramanarayanan, Coenen and Sánchez2022) if $k\simeq 0.49$
,
$k\simeq 0.49$
, $k\simeq 0.32$
and
$k\simeq 0.32$
and $k \simeq 0.16$
, respectively. Since we will be dealing with Reynolds numbers that remain small, we adopt (B1) with
$k \simeq 0.16$
, respectively. Since we will be dealing with Reynolds numbers that remain small, we adopt (B1) with $k=0.5$
.
$k=0.5$
.
Appendix C. Viscous adhesion under weak active forcing
To study theoretically (3.1) with the force balance (2.6), we use a Galerkin projection of the height. We let
 \begin{align} h(x,t)=h_0(t)+\mathcal{G} H_1(x) + \alpha \cos (t) H_0(x) + \alpha \sum _{i=1}^{\infty }a_i(t)\zeta _i(x), \end{align}
where $h_0(t)$
and
$h_0(t)$
and $(a_i(t))_{i \in \mathbb N^\star }$
are unknown time-dependent coefficients. The functions
$(a_i(t))_{i \in \mathbb N^\star }$
are unknown time-dependent coefficients. The functions $H_0$
,
$H_0$
, $H_1$
and
$H_1$
and $(\zeta _i)_{i \in \mathbb N^\star }$
are chosen as
$(\zeta _i)_{i \in \mathbb N^\star }$
are chosen as
 \begin{align} H_{0}(x)&=-\frac {x^6}{240}+\frac {x^4}{16}-\frac {\lvert x\rvert ^3}{6}+\frac {3x^2}{16}, \quad H_{1}(x)=-\frac {x^6}{240}+\frac {x^4}{48}-\frac {x^2}{16}, \nonumber \\\zeta _n(x)&=I_n \times \begin{cases} (-1)^{\frac{n}{2}}\cosh \left (\dfrac {\sqrt 3}{2}n\pi \right )\cos (n\pi x) + 2\cosh \left (n\pi \dfrac {\sqrt {3}}{2}x\right )\cos \left (\dfrac {n\pi }2x\right ), \,n\,\mathrm{even},\\(-1)^{\frac {n-1}{2}}\sinh \left (\dfrac {\sqrt 3}{2}n\pi \right )\cos (n\pi x)-2\sinh \left (n\pi \dfrac {\sqrt {3}}{2}x\right )\sin \left (\dfrac {n\pi }2x\right ), \,n\,\mathrm{odd}, \end{cases} \end{align}
with $I_n$
a normalisation coefficient ensuring that
$I_n$
a normalisation coefficient ensuring that $\int _0^1 \zeta _n^2=1$
. This expansion matches the first-order deformation
$\int _0^1 \zeta _n^2=1$
. This expansion matches the first-order deformation $H_1$
and
$H_1$
and $H_0$
due to a uniform load and to a point-active forcing, respectively, while allowing for higher-order modes of deformation. The
$H_0$
due to a uniform load and to a point-active forcing, respectively, while allowing for higher-order modes of deformation. The $\zeta _n$
, shown in figure 2
$\zeta _n$
, shown in figure 2 $(d)$
, are the even eigenmodes of the triharmonic operator
$(d)$
, are the even eigenmodes of the triharmonic operator $\partial /\partial x^6$
satisfying the boundary conditions
$\partial /\partial x^6$
satisfying the boundary conditions $\partial ^2 \zeta _n/\partial x^2=\partial ^3 \zeta _n/\partial x^3=\partial ^4 \zeta _n/\partial x^4=0$
at
$\partial ^2 \zeta _n/\partial x^2=\partial ^3 \zeta _n/\partial x^3=\partial ^4 \zeta _n/\partial x^4=0$
at $x=\pm 1$
, such that this ansatz for
$x=\pm 1$
, such that this ansatz for $h$
satisfies the boundary conditions (2.10) and (2.11).
$h$
satisfies the boundary conditions (2.10) and (2.11).
Upon inserting (C1) in the governing equations and projecting in space, we make use of an averaging method considering a separation of time scales between the fast oscillation time $t$
and the slow time
$t$
and the slow time $\alpha ^2 t$
associated with the long-time evolution of the system (figure 1
$\alpha ^2 t$
associated with the long-time evolution of the system (figure 1 $b$
). This gives rise to an evolution equation at
$b$
). This gives rise to an evolution equation at $\mathcal{O}({\alpha ^2})$
for
$\mathcal{O}({\alpha ^2})$
for $\langle h_0 \rangle (t) = \int _t^{t+2\pi }h(x=0,t')\,{\mathrm{d}}t'$
, the time-averaged evolution of the sheet’s centre height, given by (3.2).
$\langle h_0 \rangle (t) = \int _t^{t+2\pi }h(x=0,t')\,{\mathrm{d}}t'$
, the time-averaged evolution of the sheet’s centre height, given by (3.2).
Up to $N=5$
, the coefficients
$N=5$
, the coefficients $d_{\textit{ij}}$
appearing in (3.2) are found numerically and are given by the entries of the following symmetric matrix:
$d_{\textit{ij}}$
appearing in (3.2) are found numerically and are given by the entries of the following symmetric matrix:
 \begin{align} \boldsymbol{d}=\begin{pmatrix} 1.14\times 10^{-2} & 2.04\times 10^{-6} & -6.91\times 10^{-6} & 1.64\times 10^{-5} & -3.24\times 10^{-5 }\\ & 6.95\times 10^{-4} & 9.24\times 10^{-7} & -2.05\times 10^{-6} & 4.01\times 10^{-6} \\ & & 1.49\times 10^{-4} & 7.08\times 10^{-7} & -1.24\times 10^{-6} \\ & & & 3.00\times 10^{-5} & 6.12\times 10^{-7} \\ & & & & 4.73\times 10^{-5} \end{pmatrix}, \end{align}
and $d_0=0.122$
.
$d_0=0.122$
.
Appendix D. Rigid sheet and non-zero Reynolds number
We consider the case of a rigid and weightless one-dimensional sheet in an incompressible fluid to isolate the effects of fluid inertia: $\tilde {B} \rightarrow \infty ,\,\mathcal{G}=0,\,{Sq}=0,\,{{Re}}\gt 0$
. The governing equations reduce to
$\tilde {B} \rightarrow \infty ,\,\mathcal{G}=0,\,{Sq}=0,\,{{Re}}\gt 0$
. The governing equations reduce to
 \begin{align} &12{\frac {\partial h}{\partial t}} - {\frac {\partial }{\partial x}}\left (h^3{\frac {\partial p}{\partial x}}\right )=0, \\[-12pt] \nonumber \end{align}
 \begin{align} &\int _{-1}^{+1}p\,\mathrm{dx}=-2\alpha \cos (t), \\[9pt] \nonumber \end{align}
with the boundary condition at $x=\pm 1$
:
$x=\pm 1$
:
 \begin{align} \begin{aligned} p&= \begin{cases} 0\,&\text{if} \quad q\gt 0, \\ - \dfrac {k}{2} {{Re}} \left (\dfrac qh\right )^2\,&\text{if} \quad q\lt 0. \end{cases} \end{aligned} \end{align}
Asymptotic results for $\alpha \lesssim 1$
,
$\alpha \lesssim 1$
, $\mathcal{I}_{{bv}}={Re}_{{bv}}={Sq}_{{bv}}=0$
, adapted from Poulain et al. (Reference Poulain, Koch, Mahadevan and Carlson2025). As
$\mathcal{I}_{{bv}}={Re}_{{bv}}={Sq}_{{bv}}=0$
, adapted from Poulain et al. (Reference Poulain, Koch, Mahadevan and Carlson2025). As $\mathcal{G}$
and
$\mathcal{G}$
and $h_{{eq}}$
decrease, the sheet presents higher and higher order deformation modes. The
$h_{{eq}}$
decrease, the sheet presents higher and higher order deformation modes. The $i$
th mode
$i$
th mode $\zeta _i$
is excited if
$\zeta _i$
is excited if $h \lesssim e_i$
.
$h \lesssim e_i$
.

We consider a sheet aligned with the wall, $h=h(t)$
. We can express the pressure gradient as a function of the height from (D1):
$h=h(t)$
. We can express the pressure gradient as a function of the height from (D1):
 \begin{align} \frac 1x {\frac {\partial p}{\partial x}} = 12 \frac {\dot h}{h^3} + \frac {6{{Re}}}{5} \frac {\ddot h}{h} - \frac {102{{Re}}}{35}\frac {\dot h^2}{h^2}. \end{align}
This can be integrated using the boundary condition to give the pressure profile:
 \begin{align} p(x,t)&= (1-x^2)\left (-6 \frac {\dot h}{h^3} - \frac {3{{Re}}}{5} \frac {\ddot h}{h} + \frac {51{{Re}}}{35}\frac {\dot h^2}{h^2}\right ) + p_{{edge}}, \\[-12pt] \nonumber \end{align}
 \begin{align} p_{{edge}}&=-\frac k2 {{Re}} \mathbb{H}\left ({\dot h}\right ) \left (\frac {\dot h}{h}\right )^2\! , \\[9pt] \nonumber \end{align}
with $\mathbb H$
the Heaviside function. Using (D1b
), this leads to the following ordinary differential equation for
$\mathbb H$
the Heaviside function. Using (D1b
), this leads to the following ordinary differential equation for $h(t)$
, together with the initial conditions
$h(t)$
, together with the initial conditions $h(0)=1,\,\dot h(0)=0$
:
$h(0)=1,\,\dot h(0)=0$
:
 \begin{align} \frac {2{{Re}}}{5h} \ddot h + 4 \frac {\dot h}{h^3} + {{Re}} \frac {\dot h^2}{h^2} \left [ \frac k2\mathbb{H}\left ({\dot h}\right ) - \frac {34}{35} \right ] -\alpha \cos (t)=0. \end{align}
The unsteady inertial term, proportional to $\ddot {h}$
, appears as an added mass as mentioned in § 4.1.
$\ddot {h}$
, appears as an added mass as mentioned in § 4.1.
To find an approximate solution to (D5), we introduce a slow time scale $\tau _{{Re}}={{Re}} t$
and expand the height in powers of
$\tau _{{Re}}={{Re}} t$
and expand the height in powers of $ \textit{Re}$
:
$ \textit{Re}$
:
 \begin{align} h(t)=h_0(t,\tau _{{Re}})+{{Re}} h_1(t,\tau _{{Re}})+\mathcal{O}({{{Re}}^2}). \end{align}
Inserting into (D5) yields
 \begin{align} \mathcal{O}({1}):& \quad 4{\frac {\partial h_0}{\partial t}}+\alpha \cos (t)h_0^3=0, \\[-12pt] \nonumber \end{align}
 \begin{align} \mathcal{O}({{{Re}}}):& \quad 4{\frac {\partial h_1}{\partial t}}+3h_0^2\alpha \cos (t)h_1= \nonumber \\ &\qquad \qquad -4{\frac {\partial h_0}{\partial \tau _{{Re}}}}-\frac 25h_0^2{\frac {\partial ^2h_0}{\partial t^2}}+h_0\left ({\frac {\partial h_0}{\partial t}}\right )^2 \left [\frac {34}{35}-\frac k2 \mathbb{H}\left ({\dot h_0}\right ) \right ]\!. \\[9pt] \nonumber \end{align}
Equation (D7a
) can be integrated directly as a linear differential equation in $t$
. Introducing
$t$
. Introducing $f_{{{Re}}}({\tau _{{Re}}})$
as an integration constant (a function of
$f_{{{Re}}}({\tau _{{Re}}})$
as an integration constant (a function of $\tau _{{Re}}$
independent of
$\tau _{{Re}}$
independent of $t$
), we find
$t$
), we find
 \begin{align} h_0=\left [f_{{Re}}(\tau _{{Re}})+\frac {\alpha }2\sin (t)\right ]^{-1/2}. \end{align}
Knowing $h_0$
, (D7b
) is also a linear ordinary differential equation for
$h_0$
, (D7b
) is also a linear ordinary differential equation for $h_1$
which can be solved as
$h_1$
which can be solved as
 \begin{align} \begin{split} h_1(t,\tau _{{Re}}) = h_0^3(t) \int _0^t \bigg [ -\frac {1}{h_0^3} {\frac {\partial h_0}{\partial \tau _{{Re}}}} - &\frac {1}{10 h_0} {\frac {\partial ^2h_0}{\partial t^2}} \\ &+ \frac {1}{h_0^2} \left ( {\frac {\partial h_0}{\partial t}} \right )^2 \left ( \frac {17}{70} - \frac {k}{8} \mathbb{H}\left ( {\frac {\partial h_0}{\partial t}} \right ) \right ) \bigg ]\,{\mathrm{d}}t'. \end{split} \end{align}
Both $h_0$
and the integrand of (D9) are
$h_0$
and the integrand of (D9) are $2\pi $
-periodic in
$2\pi $
-periodic in $t$
. Therefore, if the average value of the integrand was non-zero,
$t$
. Therefore, if the average value of the integrand was non-zero, $h_1$
would diverge as
$h_1$
would diverge as $t\rightarrow \infty$
. This would break the asymptotic expansion (D6). We conclude that this integrand must have a zero mean, which is equivalent to requesting that
$t\rightarrow \infty$
. This would break the asymptotic expansion (D6). We conclude that this integrand must have a zero mean, which is equivalent to requesting that $h_1$
must be
$h_1$
must be $2\pi$
-periodic in
$2\pi$
-periodic in $t$
. In particular,
$t$
. In particular, $h_1(0,\tau _{{Re}})=h_1(2\pi ,\tau _{{Re}})$
. This non-secularity condition gives a differential equation for
$h_1(0,\tau _{{Re}})=h_1(2\pi ,\tau _{{Re}})$
. This non-secularity condition gives a differential equation for $f_{{Re}}(\tau _{{Re}})$
:
$f_{{Re}}(\tau _{{Re}})$
:
 \begin{align} \begin{split} \pi f'_{{Re}}(\tau _{{Re}})=\frac {\alpha }{40} &\int _0^{2\pi }\frac {\sin (t)}{f_{{Re}}(\tau _{{Re}})+\frac {\alpha }{2}\cos (t)}\,{\mathrm{d}}t + \\ & + {\alpha ^2}\left (\frac {1}{280}+\frac {k}{128}\right )\int _0^{2\pi }\frac {\cos ^2(t)}{\left (f_{{Re}}(\tau _{{Re}})+\frac {\alpha }{2}\sin (t)\right )^2}\,{\mathrm{d}}t. \end{split} \end{align}
We use a first-order Taylor expansion for small $\varGamma /(2f_{{Re}})$
and find
$\varGamma /(2f_{{Re}})$
and find
 \begin{align} \begin{aligned} f^2_{{Re}}(\tau _{{Re}})f'_{{Re}}(\tau _{{Re}})&=-\frac {1}{112}\left (1-\frac {7k}{16}\right )\alpha ^2,\\ h_0(t)&=\left [\left (1-\frac {3}{112}\left (1-\frac {7k}{16}\right )\alpha ^2{{Re}} t\right )^{1/3} + \frac {\alpha }{2}\sin (t)\right ]^{-1/2}. \end{aligned} \end{align}
We have kept an arbitrary value for the loss coefficient $k$
for completeness. We argue in Appendix B for
$k$
for completeness. We argue in Appendix B for $k=0.5$
, and with this value,
$k=0.5$
, and with this value, $3(1-7k/16)/112 \simeq 0.021$
. Therefore,
$3(1-7k/16)/112 \simeq 0.021$
. Therefore, $\langle h\rangle (t) \simeq (1-0.021 \alpha ^2{{Re}} t )^{-1/6}$
, where we denote
$\langle h\rangle (t) \simeq (1-0.021 \alpha ^2{{Re}} t )^{-1/6}$
, where we denote $\langle h\rangle (t)= \int _{t'}^{t'+2\pi }h(t')\,{\mathrm{d}}t'/2\pi$
the time-averaged evolution. These results are verified in figure 12
$\langle h\rangle (t)= \int _{t'}^{t'+2\pi }h(t')\,{\mathrm{d}}t'/2\pi$
the time-averaged evolution. These results are verified in figure 12 $(a)$
.
$(a)$
.
Comparison between numerical results (symbols) and first-order asymptotic calculations from two-time scale analysis (lines) for the height evolution of a rigid sheet with $(a)$
$(a)$ ${\textit{Re}}\gt 0$
,
${\textit{Re}}\gt 0$
, ${{Sq}}=0$
and
${{Sq}}=0$
and $(b)$
$(b)$ ${{{Sq}}}\gt 0$
,
${{{Sq}}}\gt 0$
, ${\textit{Re}}=0$
.
${\textit{Re}}=0$
.

Appendix E. Rigid sheet and non-zero squeeze number
We neglect inertia, ${\textit{Re}}=0$
, but assume a non-zero squeeze number
${\textit{Re}}=0$
, but assume a non-zero squeeze number ${Sq}\gt 0$
. The mass conservation equation (2.4) and the momentum balance (2.5) give
${Sq}\gt 0$
. The mass conservation equation (2.4) and the momentum balance (2.5) give
 \begin{align} 12{\frac {\partial \left (\rho h\right )}{\partial t}}-\frac {\partial }{\partial x}\left (\rho h^3 {\frac {\partial p}{\partial }}x \right )=0, \quad \rho =1+{Sq}\times p. \end{align}
We let $\tau _{{{Sq}}}={Sq} t$
, and expand
$\tau _{{{Sq}}}={Sq} t$
, and expand $h(t)=h_0(t,\tau _{{{Sq}}}) + {Sq} h_1(t,\tau _{{{Sq}}})+ \mathcal{O}({{Sq}^2})$
and
$h(t)=h_0(t,\tau _{{{Sq}}}) + {Sq} h_1(t,\tau _{{{Sq}}})+ \mathcal{O}({{Sq}^2})$
and $p(x,t)=p_0(x,t,\tau _{{{Sq}}}) + {Sq} p_1(x,t,\tau _{{{Sq}}}) + \mathcal{O}({{Sq}^2})$
. Collecting terms of the same order, (E1) yields
$p(x,t)=p_0(x,t,\tau _{{{Sq}}}) + {Sq} p_1(x,t,\tau _{{{Sq}}}) + \mathcal{O}({{Sq}^2})$
. Collecting terms of the same order, (E1) yields
 \begin{align} \mathcal{O}({1}): \quad &12{\frac {\partial h_0}{\partial t}}-h_0^3{\frac {\partial ^2p_0}{\partial x^2}}=0, \\[-12pt] \nonumber \end{align}
 \begin{align} \mathcal{O}({{Sq}}): \quad &12{\frac {\partial h_1}{\partial t}}-h_0^3{\frac {\partial ^2p_1}{\partial x^2}}= \nonumber \\ &\qquad -12{\frac {\partial \left (p_0h_0\right )}{\partial t}}-12{\frac {\partial h_0}{\partial \tau _{{{Sq}}}}}+3h_0^2h_1{\frac {\partial ^2p_0}{\partial x^2}}+h_0^3\frac {\partial }{\partial x}\left (p_0{\frac {\partial p_0}{\partial x}}\right ), \\[9pt] \nonumber \end{align}
while the integrated version of the force balance (2.6) and the boundary condition (2.11) yield
 \begin{align} \begin{split} \int _{-1}^1 p_0\,{\mathrm{d}}x=2\alpha \cos (t), \quad \int _{-1}^{+1} p_1\,{\mathrm{d}}x=0, \\ \quad p_0(x=\pm 1,t)=p_1(x=\pm 1,t)=0. \end{split} \end{align}
The problem at $\mathcal{O}({1})$
is simply the rigid incompressible problem and the solution is directly found as
$\mathcal{O}({1})$
is simply the rigid incompressible problem and the solution is directly found as
 \begin{align} p_0=\frac {\alpha }{4}\cos (t)(1-x^2), \quad h_0=\left (f_{{{Sq}}}(\tau _{{{Sq}}})+\frac {\alpha }{2}\sin (t)\right )^{-1/2}, \end{align}
with $f_{{{Sq}}}(\tau _{{{Sq}}})$
an integration constant that depends on the slow time. At
$f_{{{Sq}}}(\tau _{{{Sq}}})$
an integration constant that depends on the slow time. At $\mathcal{O}({{Sq}})$
, we can integrate (E2b
) to obtain
$\mathcal{O}({{Sq}})$
, we can integrate (E2b
) to obtain $p_1$
, then use the force balance to obtain a single ordinary differential equation for
$p_1$
, then use the force balance to obtain a single ordinary differential equation for $h_1$
:
$h_1$
:
 \begin{align} {\frac {\partial h_1}{\partial t}}+&\frac {3\alpha \cos (t)}{4\left (1+\alpha \sin (t)/2\right )}h_1= \\[-12pt] \nonumber \end{align}
 \begin{align} &\frac {20f_{{{Sq}}}'(\tau _{{{Sq}}})+30\alpha ^2-18\alpha ^2\cos (2t)+96\alpha f_{{{Sq}}}(\tau _{{{Sq}}})\sin (t)}{80\left (1+\alpha \sin (t)/2\right )^{3/2}} . \\[9pt] \nonumber \end{align}
Using a non-secularity condition similar to the one used in Appendix D, we find
 \begin{align} f_{{{Sq}}}'(\tau _{{{Sq}}})=-\frac {3\alpha ^2}{4}, \quad h_0(t)\approx \left (1-\frac 34 \alpha ^2 {Sq} t \right )^{-1/2}, \end{align}
which is verified in figure 12 $(b)$
. The pressure at
$(b)$
. The pressure at $\mathcal{O}({{S_q}})$
is
$\mathcal{O}({{S_q}})$
is
 \begin{align} p_1(x,t,\tau )=\frac {3\alpha }{20}\big (1-x^2\big )\big (5x^2-1\big )\big [\alpha \cos (2t)-2f_{{{Sq}}}(\tau _{{{Sq}}})\sin (t)\big ]. \end{align}


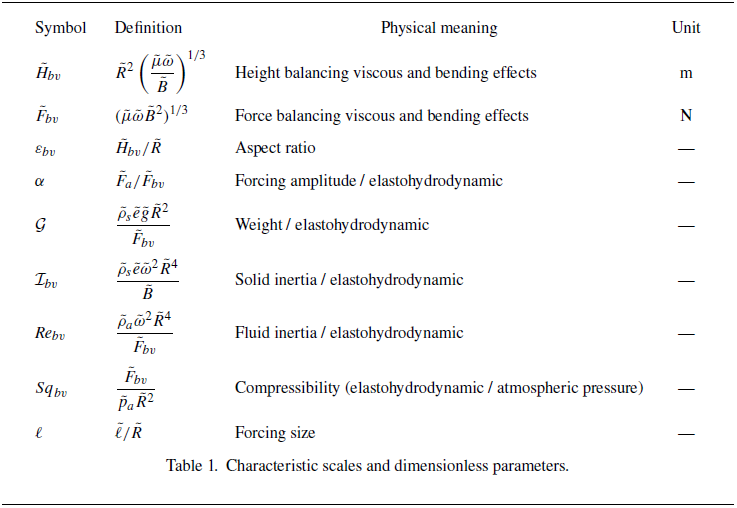


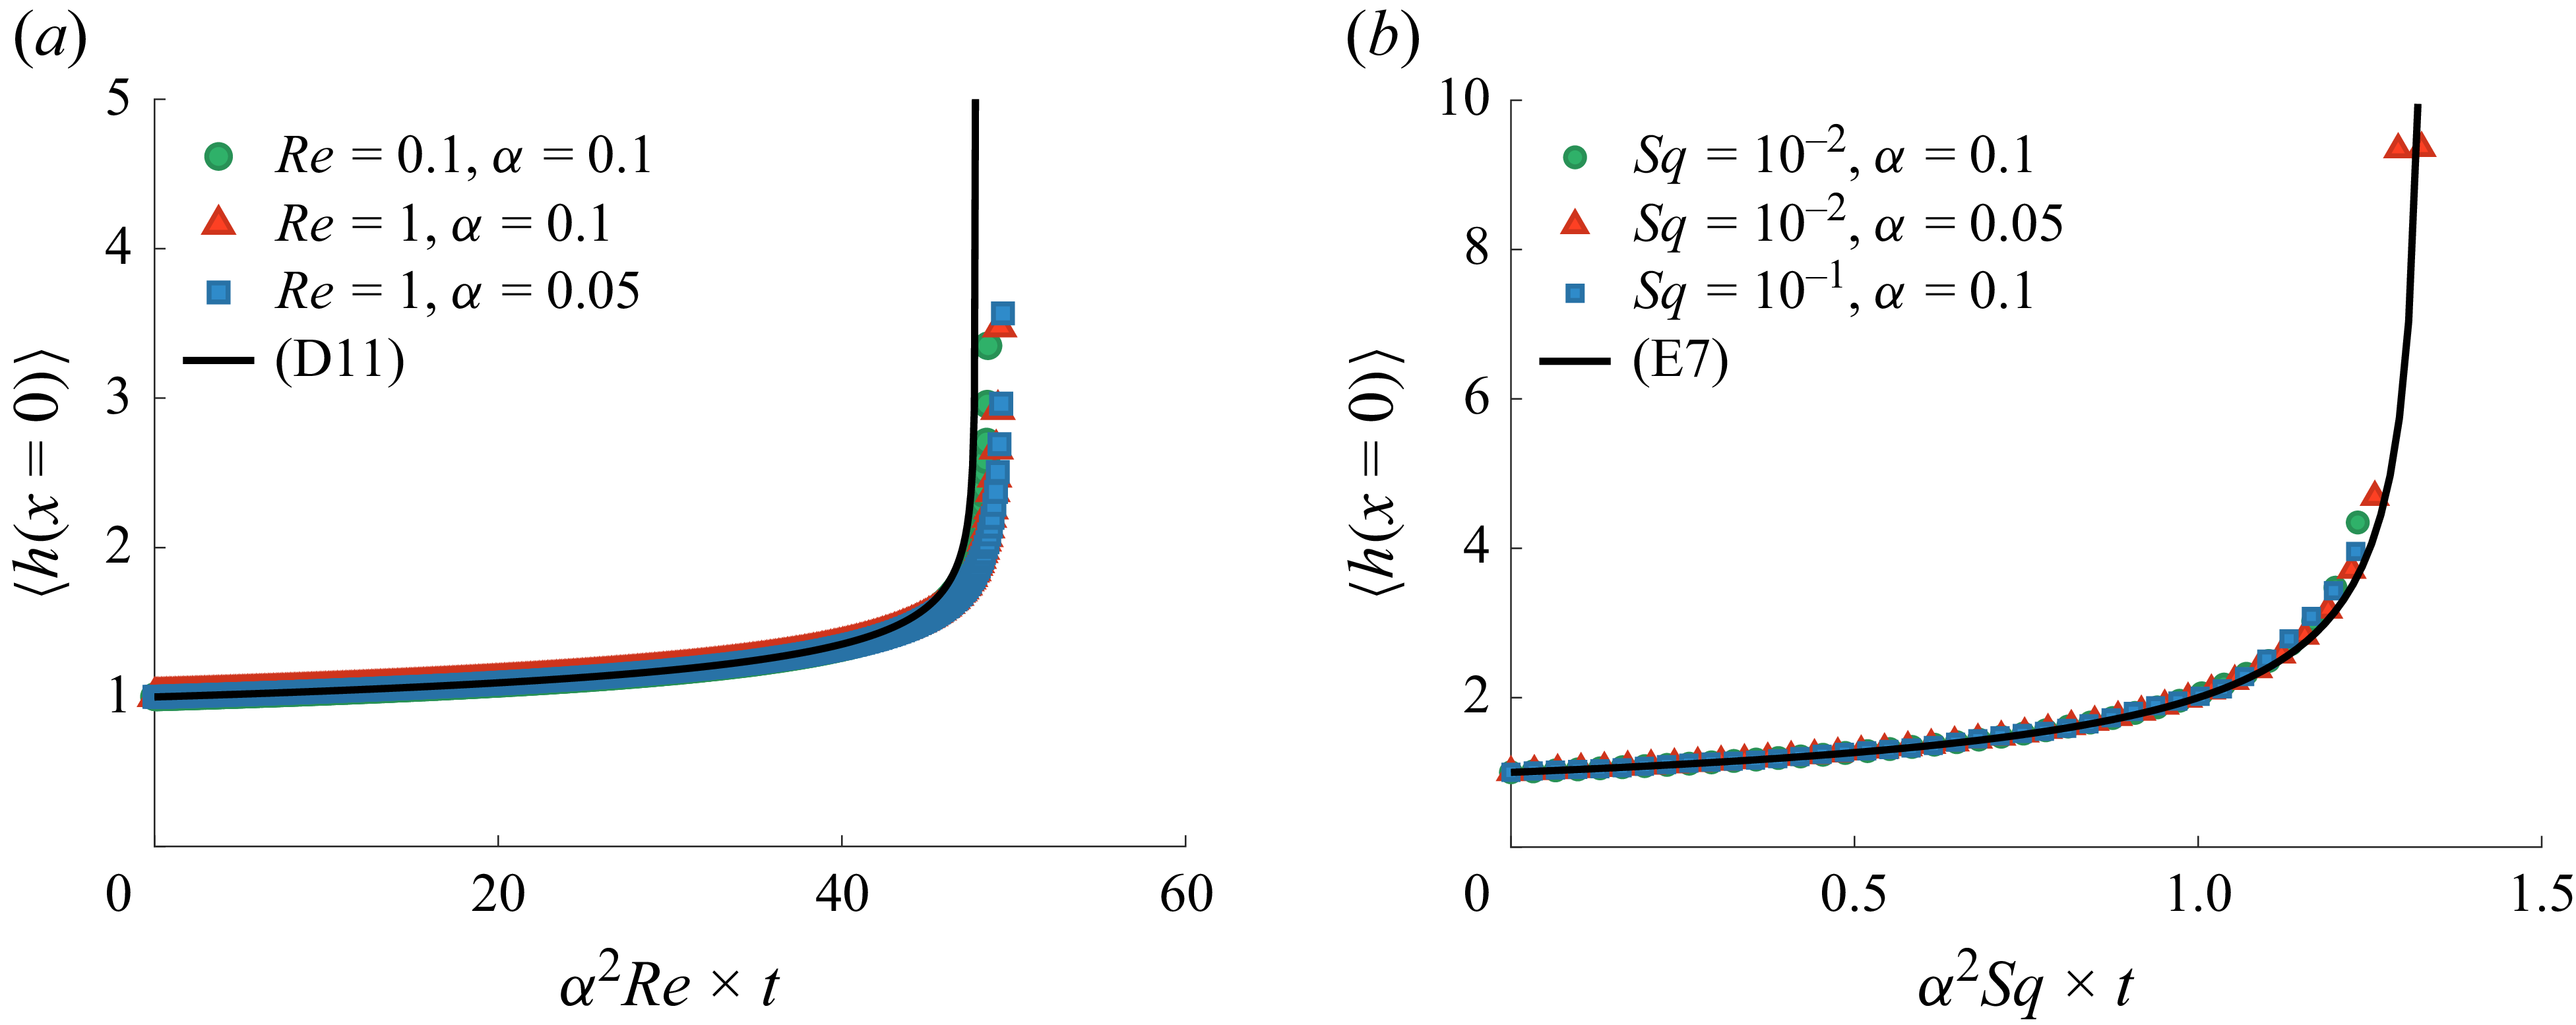


 Open access

