





Many public health organisations including the WHO and government public health offices have targeted increased rates of exclusive breastfeeding for 6 months after birth as important public health goals(1,2) . Although exclusive breastfeeding for the first 6 months of life is associated with improved infant outcomes in all settings, it is particularly important in low-and middle-income countries where non-exclusive breastfeeding can lead to increased risk of severe acute malnutrition(Reference Awoke, Ayana and Gualu3,Reference David, Pricilla and Paul4) and diarrhoeal disease(Reference Fenta and Nigussie5). Low milk production can be particularly dangerous for mothers of vulnerable preterm infants in low-and middle-income countries, and effective interventions that target the physiological lactation processes in the early weeks postpartum are promising to improve milk production in these populations as well(Reference Slusher, Slusher and Biomdo6).
During the first 2 weeks after birth, the mammary gland undergoes profound physiological changes. In the first few days, the process of secretory activation (milk coming in or lactogenesis II) takes place, in which the mammary epithelial cells up-regulate synthesis of milk components and the tight junctions between these cells close, resulting in reduced milk Na concentrations(Reference Hoban, Patel and Medina Poeliniz7). Obesity and insulin resistance have been implicated in disrupting and delaying the achievement of secretory activation(Reference Nommsen-Rivers, Dolan and Huang8,Reference Nommsen-Rivers9) .
Upon achievement of secretory activation, milk volume increases quickly, and lactation transitions from hormonal control to autocrine control, driven primarily by milk removal(Reference Neville, Demerath and Hahn-Holbrook10,Reference Krebs, Belfort and Meier11) . Therefore, the most effective interventions for increasing milk volume target frequent breast-emptying during early lactation. However, evidence shows that some mothers are unable to increase milk volume despite adherence to a frequent breast-emptying regimen(Reference Nommsen-Rivers, Thompson and Riddle12,Reference Nommsen-Rivers, Wagner and Roznowski13) , likely due to obesity, insulin resistance, inflammation or altered lipid metabolism(Reference Nommsen-Rivers, Wagner and Roznowski13,Reference Walker, Harvatine and Ross14) . Therefore, there is a need to understand biomarkers that indicate physiological low milk production to inform future interventions. In our previous work, we found that altered incorporation of fatty acids into milk and changes in the milk fatty acid profile are both associated with low milk production and may be explained by the suppression of lipoprotein lipase in the mammary gland by the inflammatory cytokine, TNF-α (Reference Walker, Harvatine and Ross14). This study found that milk mid-chain fatty acids (MCFA, defined as all measured fatty acids ≥ 6 and < 16 carbons in length) were elevated and the MUFA, oleic acid (C18:1 n-9), was lower in concentration with cases of very low milk production. However, our prior study was conducted in a high-resource clinical setting in the USA, and our results have not been replicated in more vulnerable populations in low-and middle-income countries.
Vitamin D is an important regulator of a multitude of genes through the vitamin D nuclear receptor(Reference Voltan, Cannito and Ferrarese15) and plays a role in regulating rates of lipid metabolism(Reference Jahn, Dorbath and Schilling16,Reference Asano, Watanabe and Ryoden17) . Human studies have observed that vitamin D is associated with improved lipid metabolism in observational(Reference Jiang, Peng and Chen18) and interventional(Reference Dibaba19) study designs. However, it is unknown if vitamin D status is associated with lactation outcomes or milk lipids in humans. In one large study in Canada, milk vitamin D concentrations were associated with maternal obesity, diet and smoking(Reference Hopperton, O’Neill and Chakrabarti20), but the observational and descriptive nature of the study limits interpretation of the results.
Our objective in this paper was to describe the relationship between milk fatty acid profiles at 3 months, particularly MCFA and oleic acid, and the prevalence of current exclusive breastfeeding. We hypothesised that lower milk MCFA and higher oleic acid would be associated with higher rates of currently exclusive breastfeeding as measured from 3 to 6 months. Because this study was conducted in the context of a vitamin D supplementation randomised controlled trial(Reference Roth, Morris and Zlotkin21), we performed a secondary analysis to examine the association between vitamin D supplementation and currently exclusive breastfeeding.
Methods
Study design
The current study is an ancillary observational analysis of associations between milk fatty acids and currently exclusive breastfeeding in a cohort from Dhakha, Bangladesh. The parent trial was a randomised controlled trial investigating the effect of vitamin D (i.e. vitamin D3 or cholecalciferol) supplementation on infant growth (ClinicalTrials.gov number, NCT01924013)(Reference Roth, Morris and Zlotkin21). Participants were recruited during early pregnancy when they attended prenatal clinic visits at the Maternal and Child Health Training Institute in Dhaka, Bangladesh. Mothers were eligible for inclusion if they were ≥ 18 years old, were 17–24 weeks of gestation at the time of recruitment, were carrying a singleton pregnancy, were willing to abstain from vitamin D supplements other than those provided in the trial and were free from certain conditions that would alter their vitamin D status or response to vitamin D supplementation(Reference Roth, Gernand and Morris22). Participants were randomised to one of five supplementation treatment groups consisting of four different prenatal vitamin D supplementation levels, and either placebo or high-dose vitamin D supplementation for 6 months postpartum (A: 0 IU/week prenatal, 0 IU/week postpartum; B: 4200 IU/week prenatal, 0 IU/week postpartum; C: 16 800 IU/week prenatal, 0 IU/week postpartum; D: 28 000 IU/week prenatal, 0 IU/week postpartum; E: 28 000 IU/week prenatal, 28 000 IU/week postpartum). Data were collected weekly from enrolment throughout the first 6 months postpartum. Extensive data and maternal blood samples were collected at baseline, birth and 3 months.
Milk collection and storage
Milk samples were collected at 3 and 6 months postpartum. A 6–8 ml sample was collected by hand expression mid-feed (after 2 min of successful feeding) from the same breast from which the mothers were feeding their infant. Milk collection was supervised by trained study personnel. Samples were taken immediately to the laboratory to be aliquoted and flash-frozen on dry ice. Samples were placed on a transport shuttle to be stored at −80°C at the icddr,b facility. When this transport was not promptly available, samples were frozen at −20°C to await transport. At the end of the trial, samples were transported to the Hospital for Sick Children in Toronto, Canada, and stored at −80°C. Milk samples were later shipped to Penn State packed on dry ice and then stored at −80°C, prior to the final fatty acid analysis.
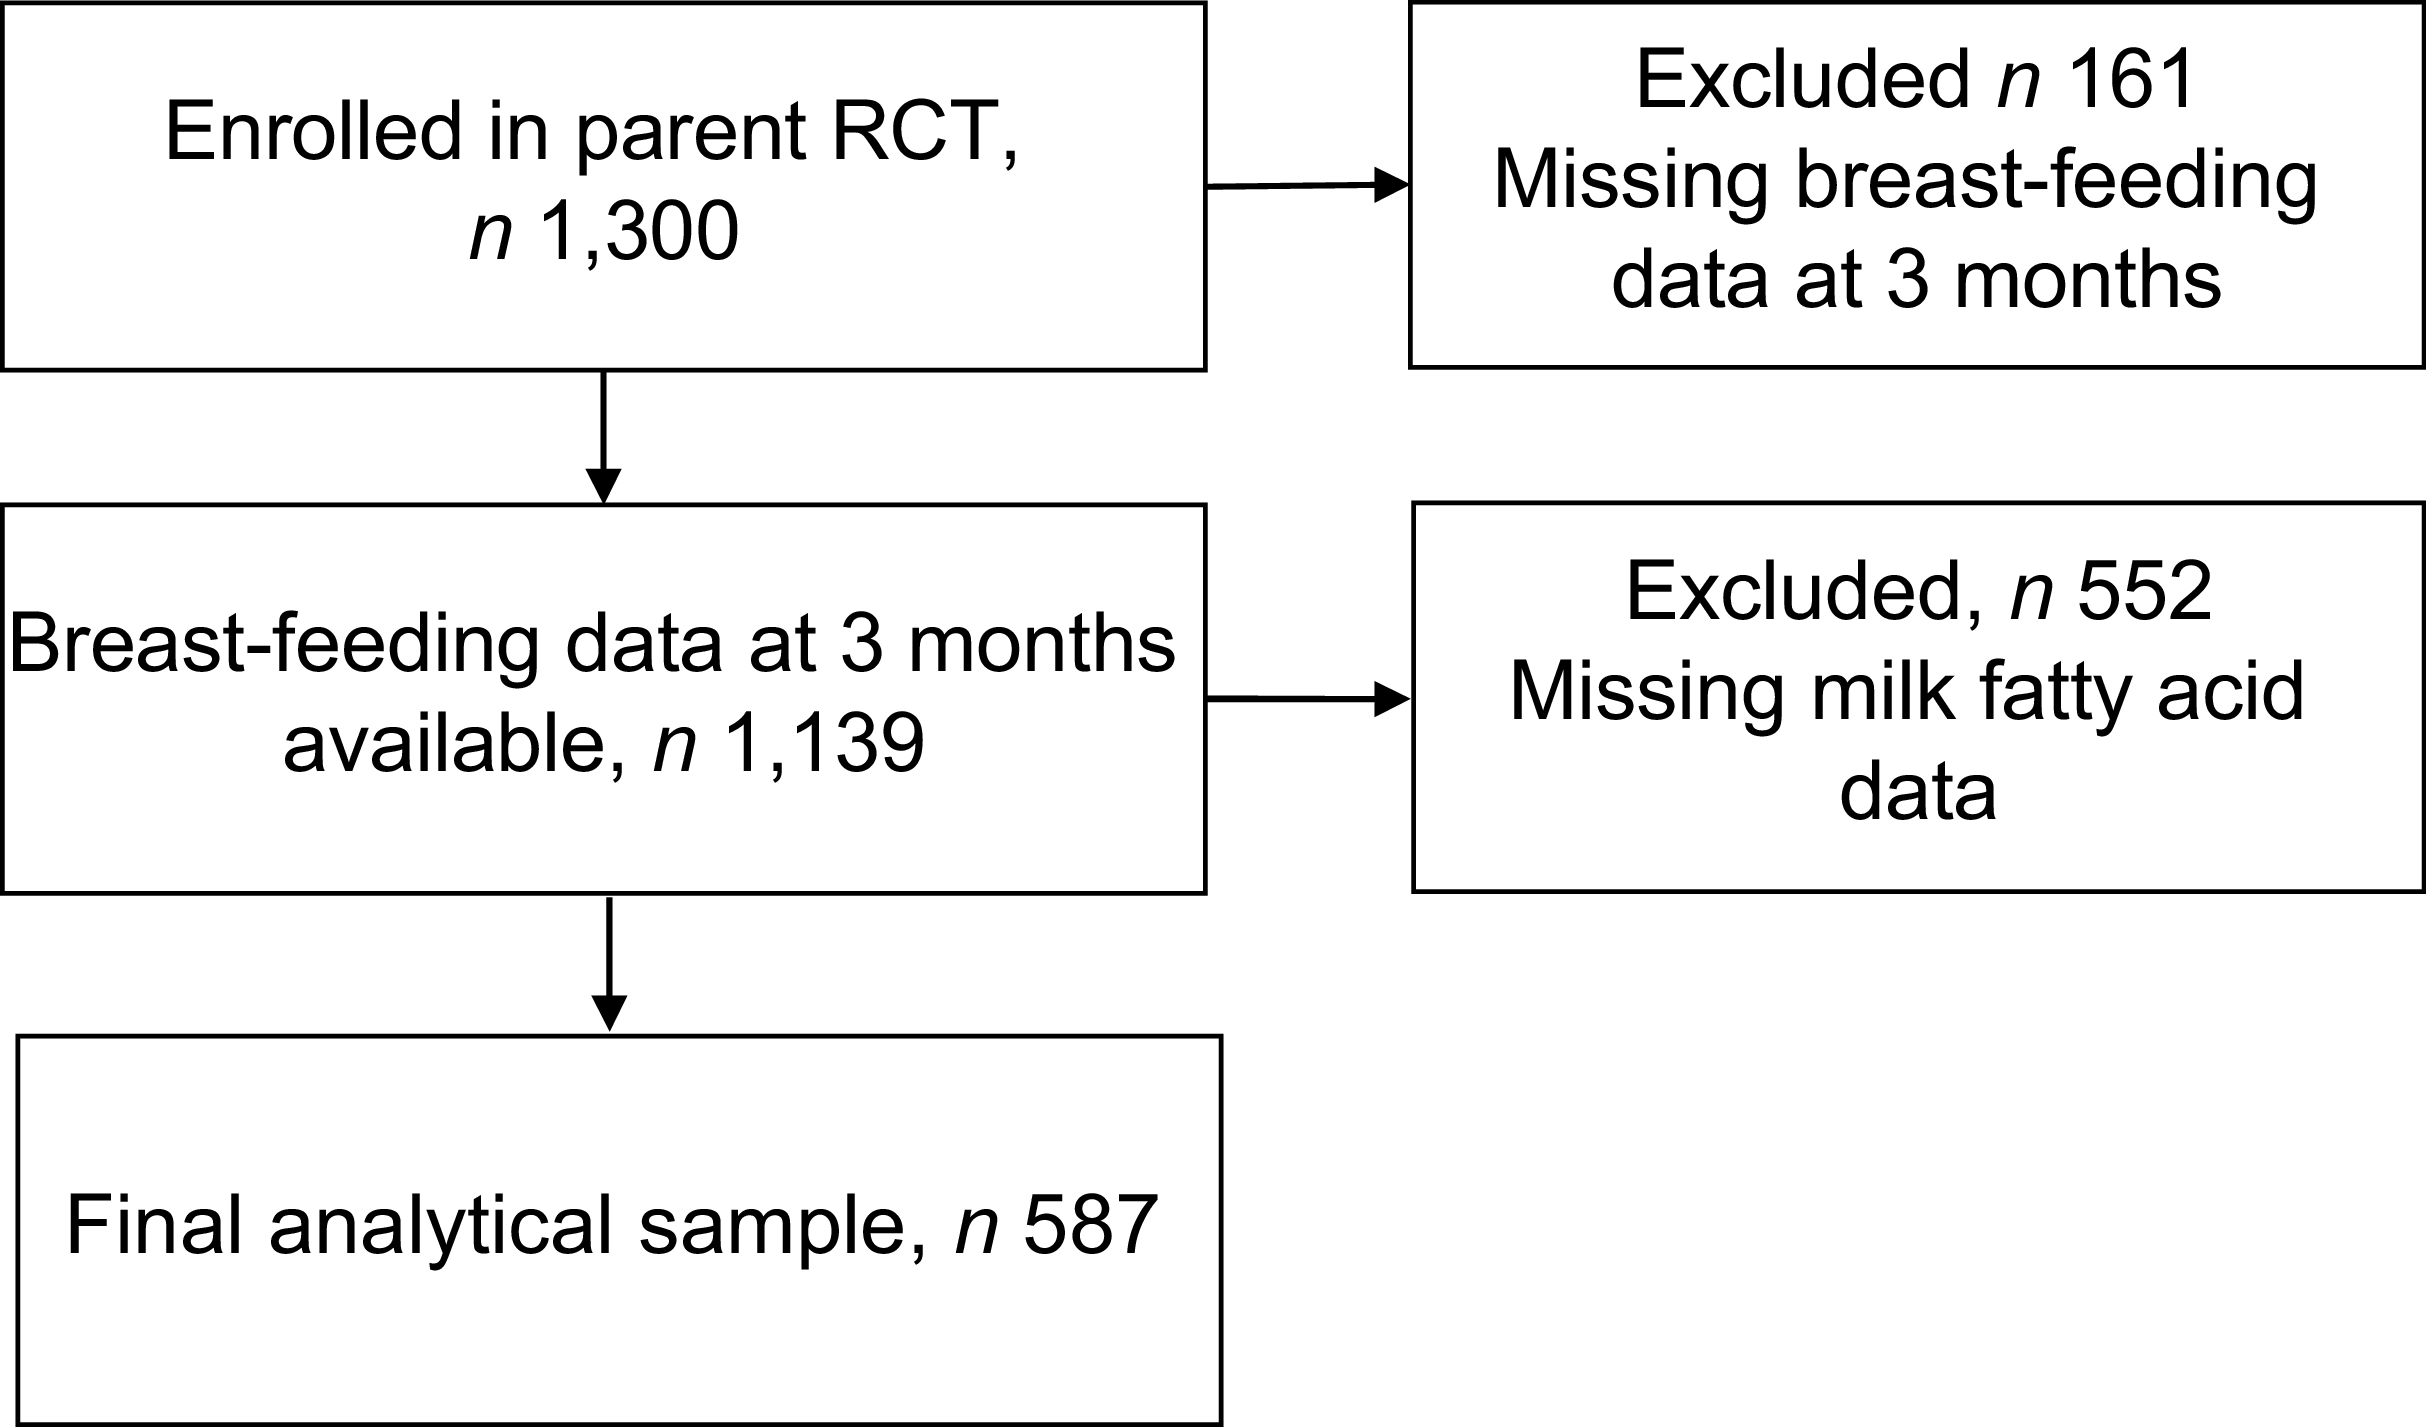
There were 1300 participants recruited in the parent trial from March 2014 until September 2015. For the primary analysis in this study, only participants with milk fatty acid profile data from the 3-month milk sample (n 599) and complete breastfeeding data at 3 months (13 ± 1 week postpartum) were included (final sample size, n 587; Figure 1). For the secondary analysis of vitamin D supplementation and breastfeeding outcomes, milk samples were not used. Therefore, all study participants were eligible if breastfeeding data were recorded at 3 months (13 ± 1 week) postpartum (n 1139).
Flow chart of participant inclusion. The parent randomised controlled trial (RCT) recruited and enrolled 1300 participants. Breastfeeding data were available at 3 months (13 ± 1 week) postpartum for 1139 participants. Of these, 587 participants also had milk fatty acid profiles available from a sample collected at 3 months postpartum.

Ethical considerations
This study was conducted according to the guidelines laid down in the Declaration of Helsinki. Written informed consent was obtained from all subjects/patients. The parent trial protocol was approved by the ethics committees at both the Hospital for Sick Children in Toronto, CA, and the International Centre for Diarrhoeal Disease Research, Bangladesh(Reference Roth, Morris and Zlotkin21). Study protocols for the current analysis were approved by The Pennsylvania State University Institutional Review Board (IRB #00020584) and pre-registered with the Open Science Framework (https://osf.io/nj7a3/overview, https://10.17605/OSF.IO/NJ7A3). All data and samples were deidentified prior to transfer to The Pennsylvania State University from the Hospital for Sick Children in Toronto. In this study, we use the term ‘mother’ to refer to the female biological parent who is lactating and providing human milk to the infant.
Milk fatty acid analysis
Milk fatty acid profile was obtained by GC with flame ionisation detection (GC-FID, Agilent 6890A, Agilent Technologies) of fatty acid methyl esters as described in previous studies(Reference Walker, Harvatine and Ross14,Reference Rico and Harvatine23) . Briefly, lipids from 0·5 ml of whole milk were extracted by liquid–liquid extraction using 2·5 ml of 3:2 (volume:volume) hexane:isopropanol mixture and 1·2 ml of 7 % sodium sulfate solution. After extraction, fatty acids in hexane were methylated using 10 µl of 1M sodium methoxide in methanol at room temperature for 8 min with 10 µl of methyl acetate added to minimise artefacts from the saponification reaction. The reaction was terminated using 50 µl of a termination reagent (oxalic acid, 30 mg/ml, in diethyl ether). Excess methanol and water were removed from the sample using calcium chloride before analysis. Fatty acid methyl esters dissolved in hexane were then transferred to autosampler vials, and 2 µl of each sample was measured by GC-FID with an isothermal temperature program fitted with an SP2560 column (Supelco).
Fatty acids were identified using pure fatty acid standard mixtures (GLC 566 and 780; NuChek Prep Inc.). Fatty acid quantification was performed using OpenLab software (2017, Agilent Technologies) and adjusted using response factors from an equal-weight standard mix of fatty acids (GLC 461; NuChek Prep Inc.). A total of forty fatty acids were identified, and the sum of the adjusted peak areas of all identified fatty acids was used as 100 % for all calculations of relative fatty acid concentrations. All fatty acid concentrations were calculated as % of total fatty acids. A subset of samples were run in duplicate, and common control sample of pooled human milk was run with each batch to calculate intra-and inter-assay CV, respectively. We defined MCFA as all measured fatty acids ≥ 6 and < 16 carbons in length (intra-assay CV: 0·02; inter-assay CV: 0·06) and long-chain fatty acids as > 16 carbons (intra-assay CV: 0·006; inter-assay CV: 0·02). A list of all fatty acids included in categories is listed in online Supplementary Table 1. To better reflect the importance of multiple bioactive fatty acids working together, we created a theoretical MCFA index. To develop this index, milk fatty acid concentrations (% of total fatty acids) associated with higher prevalence of exclusive breastfeeding were placed in the numerator, and milk fatty acid concentrations associated with lower prevalence of exclusive breastfeeding were placed in the denominator. A multiple of 10 was used to scale values to between 1 and 100. The resulting index equation was as follows: MCFA index = [(C6:0 + C15:0) ÷ (C12:0 + C14:0)] × 1000 (intra-assay CV: 0·02; inter-assay CV: 0·06). For all longitudinal analyses using fatty acids as the exposure, participants were categorised into tertiles for each specific fatty acid and fatty acid category (online Supplementary Table 2).
Breastfeeding outcomes
Breastfeeding outcomes for the current analysis were assessed as currently exclusive v. non-exclusive breastfeeding. Infant feeding was assessed by questionnaire weekly at study visits from birth to 6 months. We defined exclusive breastfeeding as an infant being fed only human milk, in accordance with the WHO/UNICEF definition for exclusive breastfeeding(24). While the WHO/UNICEF definition specifies feeding only human milk for the past day, the MDIG data collection form asked for infant feeding across the past 7 d, making our exclusive breastfeeding category slightly more restrictive. Unlike the original MDIG trial(Reference Roth, Morris and Zlotkin21), we only assessed exclusive breastfeeding for the most recent 7 d and not for the entire time since birth. There were two reasons for using this modified definition. First, there were a significant number of mothers who reported feeding other liquids and foods in the early postpartum weeks but were exclusively breastfeeding at 3 months. Second, although infant outcomes are associated with any non-human milk feedings(24), in this study we were most interested in biological characteristics of the mothers at the time of analysis. We defined non-exclusive breastfeeding to include both predominant and partial breastfeeding for the past 7 d. Predominant breastfeeding is an infant being fed human milk and other liquids, but no infant formula or solid food, while partial breastfeeding is an infant being fed human milk along with infant formula and/or solid food. Infants fed no human milk for the past 7 d were categorised as not breastfeeding and were not included in the primary analysis due to the lack of milk samples.
Covariates
Additional data were considered as covariates if previous literature suggested an association with either exposures or outcomes of interest. Potential covariates considered for this study included maternal serum inflammatory biomarkers at delivery, maternal age, parity, birth mode, gestational age at birth, infant birth weight and infant sex. Two maternal inflammatory biomarkers, C-reactive protein (CRP) and α-1-acid glycoprotein (AGP), were measured in serum samples collected at the time of delivery in a subset of participants as part of the parent study(Reference Roth, Gernand and Morris22). Maternal age in years and maternal parity (total number of previous live births) were collected as self-reported data at baseline by questionnaire. Birth mode was extracted from the medical record by study personnel in the parent study. Gestational age at birth in weeks was calculated by the parent study personnel based on second-trimester ultrasound when available. When a second-trimester ultrasound was not available, the date of the last recalled menstrual period was used(Reference Roth, Gernand and Morris22). Infant birth weight was measured, and infant sex was recorded by study personnel at birth as part of the neonatal assessment in the parent study. Weight was measured twice, and the mean of the two measurements was used.
Statistical analysis
We analysed and reported descriptive demographic statistics by the total sample of participants with breastfeeding data available at 3 months (13 ± 1 weeks) and the total sample of participants with both breastfeeding data and milk fatty acids available at 3 months. Categorical variables were calculated as number (proportion), and continuous numeric variables were calculated as either mean and standard deviation for normally distributed variables or median and interquartile range for non-normally distributed variables. Normality of continuous variables was assessed visually using kernel density plots and quantitatively using coefficients of skewness and kurtosis.
For our primary analysis, we compared participant characteristics and milk fatty acids cross-sectionally at 3 months by exclusive breastfeeding status using t tests for variables with normally distributed concentrations and non-parametric Kruskal–Wallis comparisons for fatty acid concentrations with non-normal distributions. We modelled the longitudinal association between milk fatty acids and exclusive breastfeeding as measured from 12 to 26 weeks postpartum using repeated-measures Poisson regression models, with exclusive breastfeeding at 3 months as the outcome and milk fatty acid tertiles as the exposure of interest. Poisson regressions were run with an interaction between fatty acids and time points with a random effect for participant included in the model to calculate the prevalence ratio of exclusive v. non-exclusive breastfeeding as the outcome. All models were adjusted for the supplementation group from the parent randomised controlled trial. Based on prior literature, maternal age, birth mode, parity, gestational age at birth, infant birth weight and infant sex were considered as potential confounders and tested in the full model. We also included vitamin D supplementation arm (A: 0 IU/week prenatal, 0 IU/week postpartum; B: 4200 IU/week prenatal, 0 IU/week postpartum; C: 16 800 IU/week prenatal, 0 IU/week postpartum; D: 28 000 IU/week prenatal, 0 IU/week postpartum; E: 28 000 IU/week prenatal, 28 000 IU/week postpartum) to account for parent study design. Due to missing data on infant birth weight (117 missing), it was not included in final adjusted models. Similarly, maternal inflammatory biomarkers were only measured in a subset of participants (serum CRP, n 456; serum AGP, n 391) and were not included in final models. However, both inflammatory biomarkers and infant birth weight were considered in sensitivity analyses.
To examine the association between vitamin D supplementation and the prevalence of exclusive breastfeeding at 3 months in our secondary analysis, we modelled the association between supplementation group and exclusive breastfeeding cross-sectionally at 3 months (13 ± 1 week) and longitudinally from 12 to 26 weeks postpartum using adjusted Poisson regression models, with exclusive breastfeeding as the outcome and supplementation group as the exposure of interest. Longitudinal regressions were run with an interaction between supplementation groups and time points with a random effect for participant included in the model. Finally, we examined the effect of vitamin D supplementation on milk fatty acid concentrations. To complete this analysis, we used ANCOVA models with vitamin D supplementation groups as the exposure to model the continuous outcome of milk fatty acid concentrations. Covariates were selected and defined as described above, with birth mode, gestational age at birth, maternal age, infant sex and parity included in the final adjusted models.
To test for the impact of other factors on our results, the primary analysis was re-run to complete the following sensitivity analyses. First, the primary analysis was performed including inflammation (CRP > 5 mg/l and AGP > 1 g/l at birth) in the model (n 391) and then with infant birth weight in the model (n 470). Second, the primary analysis was performed with all preterm births excluded. Finally, the impact of infant sex was assessed by repeating the primary analysis stratified for infant sex. We stratified for infant sex because including a three-way interaction with time and exclusive breastfeeding in the longitudinal model would not have been feasible or easily interpreted.
Results
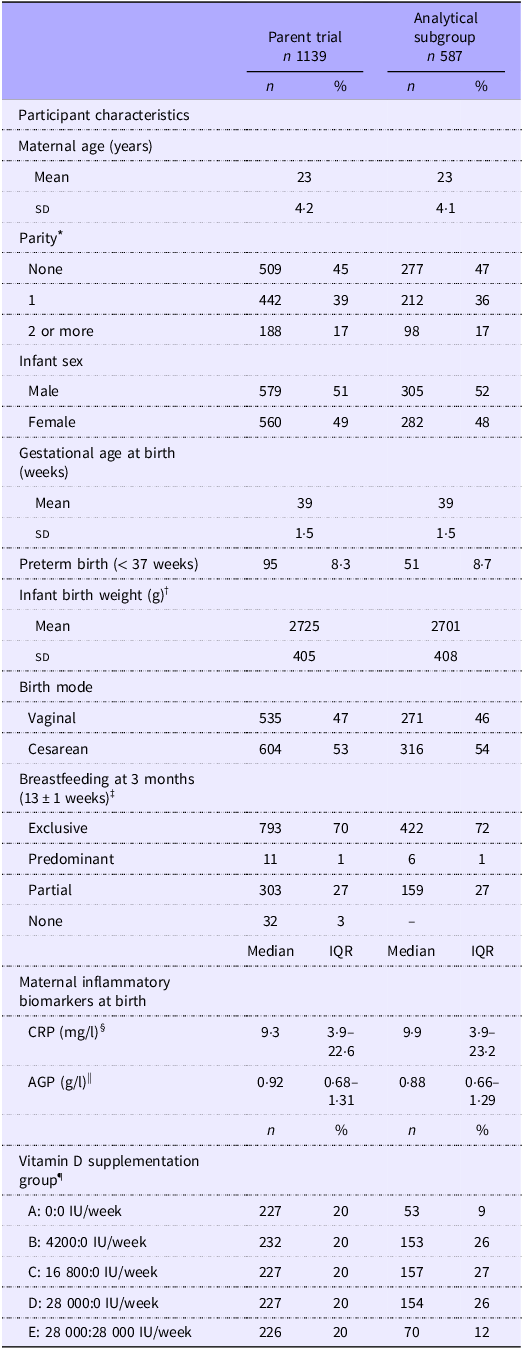
The participants in this study were generally young (mean maternal age of 23 ± 4·2 years) with 92 % delivering full-term infants (Table 1). Approximately half were primiparous, and slightly over half delivered by Cesarean section. At 3 months, most mothers (about 70 %) were exclusively breastfeeding their infants, with about 1 % predominantly breast-feeding (providing other fluids, but no infant formula or solid foods) and a larger number (27 %) practising partial breastfeeding (providing some infant formula or solid foods). In the total sample, only 3 % were not breastfeeding at all. Participants were evenly represented in all five vitamin D treatment groups in the total sample, but the sample sizes in the placebo (A: 0:0 IU/week) and postpartum (E: 28 000:28 000 IU/week) groups were smaller in the analytical subgroup due to some samples being used for a previous study(Reference Pell, Ohuma and Yonemitsu25). Infant birth weight was missing for some participants, and maternal inflammatory markers were only available for a subset of participants.
Participant characteristics in Bangladeshi parent trial participants with breast-feeding data available and in the analytical subgroup with milk fatty acid measures available at 3 months (13 ± 1 weeks postpartum)

Table 1. Long description
A table comparing participant characteristics in a Bangladeshi study. The table has 18 rows and 6 columns. Column headers are Participant characteristics, Parent trial n 1139 n, Parent trial n 1139 %, Analytical subgroup n 587 n, and Analytical subgroup n 587 %. Row labels include Maternal age (years), Parity, Infant sex, Gestational age at birth (weeks), Preterm birth (< 37 weeks), Infant birth weight (g), Birth mode, Breast-feeding at 3 months (13 ± 1 weeks)1, Maternal inflammatory biomarkers at birth, and Vitamin D supplementation group. Each row provides specific data points for both the parent trial and the analytical subgroup. For example, the mean maternal age is 23 years for both groups, and the mean gestational age at birth is 39 weeks for both groups. The table also includes data on parity, infant sex, preterm birth, infant birth weight, birth mode, breast-feeding practices, maternal inflammatory biomarkers, and vitamin D supplementation groups.
IQR, interquartile range; CRP, C-reactive protein; AGP, α-1-acid glycoprotein; IU, international units.
* Parity was defined as number of births prior to the current pregnancy and birth.
† Fatty acid analytical group: Infant birth weight missing for 117 participants, n 470; Whole population: Infant birth weight missing for 224 participants, n 915.
‡ Exclusive: Infant only fed human milk for past 7 d; Predominant: Infant fed human milk and other liquids, but no infant formula or solid food for the past 7 d; Partial: Infant fed human milk along with infant formula and/or solid food for past 7 d; None: Infant fed no human milk for past 7 d.
§ Fatty acid analytical group: Maternal CRP only available in a subset of participants, n 456; Whole population: n 888.
|| Fatty acid analytical group: Maternal AGP only available in a subset of participants; n 391; Whole population: n 734.
¶ Supplementation groups are defined as prenatal dose:postpartum dose (IU/week).
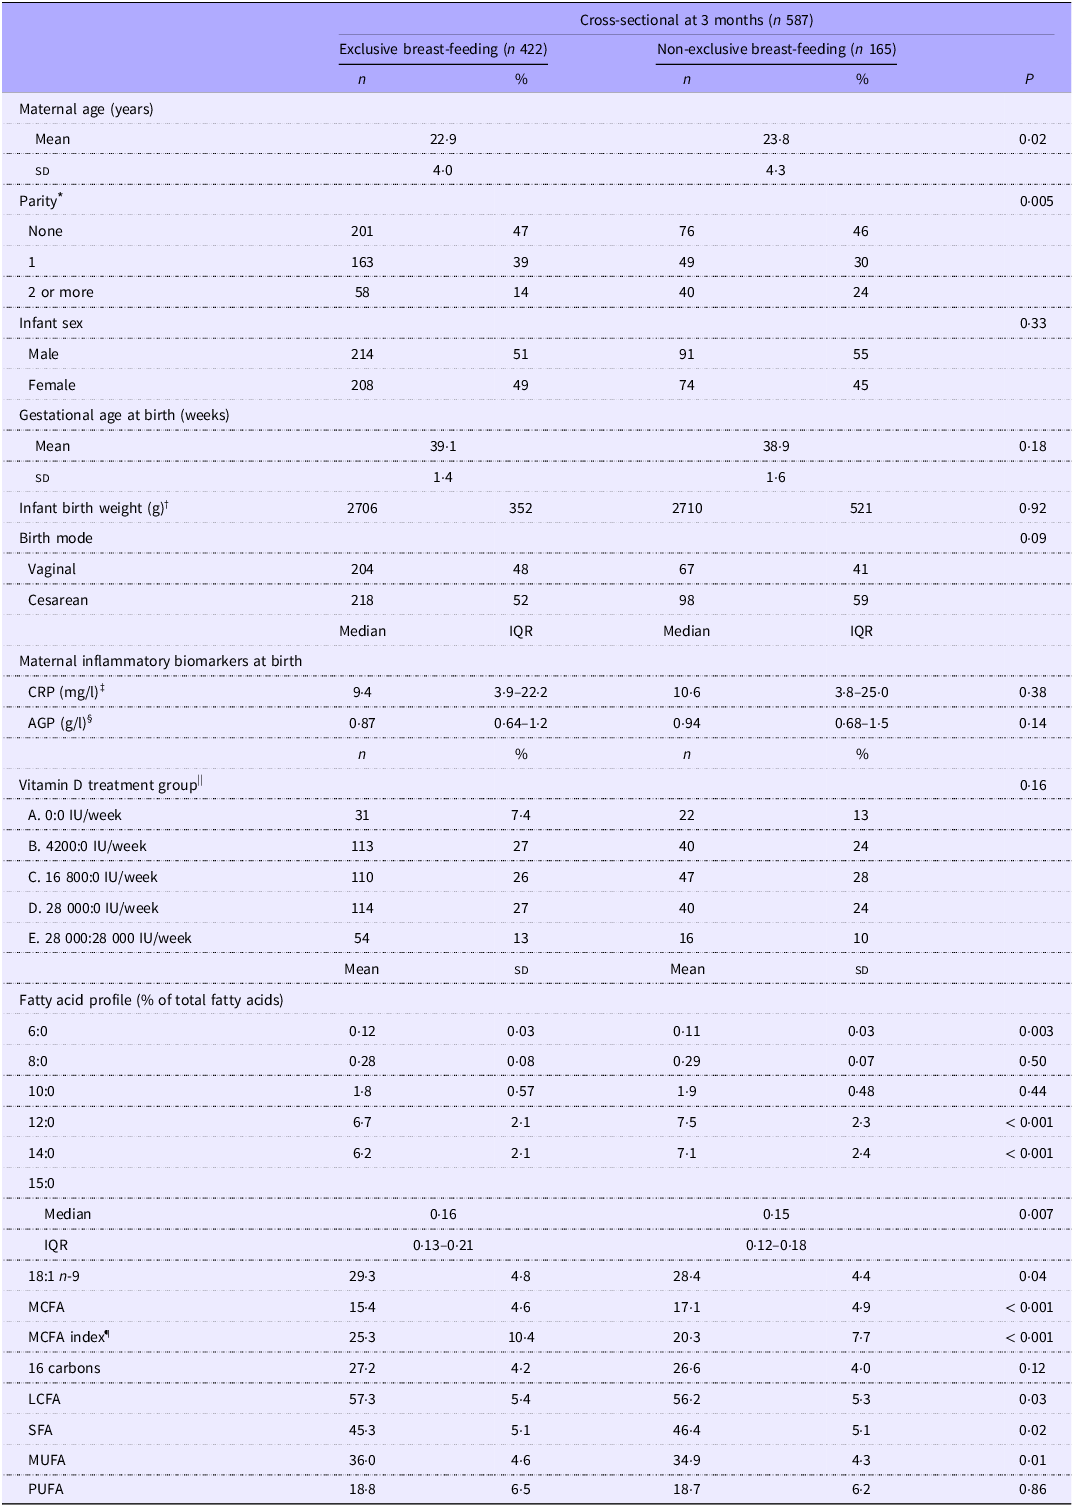
In cross-sectional analysis at 3 months, we found that mothers who were exclusively breastfeeding at 3 months were slightly younger and more likely to have a lower parity compared with mothers who were non-exclusively breastfeeding at that time (Table 2). We also found that the milk MCFA were strongly associated with exclusive breastfeeding, with lower milk MCFA concentrations found in mothers who were exclusively breastfeeding. This was primarily driven by the 12-and 14-carbon MCFA (C12:0 and C14:0). In contrast, the 8-and 10-carbon MCFA were not associated with exclusive breastfeeding (P > 0·05), while the 6-and 15-carbon MCFA (C6:0 and C15:0) were higher with exclusive breastfeeding. The MCFA index was higher in exclusive compared with non-exclusive breastfeeding (P < 0·001). Both oleic acid (C18:1 n-9) and total long-chain fatty acids were higher in exclusive compared with non-exclusive breastfeeding at 3 months, but the association was not as strong as the MCFA (oleic acid, P = 0·04; long-chain fatty acids, P = 0·03). Full fatty acid profile data are presented in online Supplementary Table 3.
Univariate differences in demographic characteristics and fatty acid profiles between exclusive and non-exclusive breast-feeding

Table 2. Long description
The table presents a cross-sectional analysis at 3 months, comparing demographic characteristics and fatty acid profiles between exclusive and non-exclusive breastfeeding. It has 25 rows and 10 columns. The columns are labeled as follows: Cross-sectional at 3 months (n 587), Exclusive breast-feeding (n 422), Non-exclusive breast-feeding (n 165), and P. The rows are labeled as follows: Maternal age (years), Parity, Infant sex, Gestational age at birth (weeks), Infant birth weight (g), Birth mode, Maternal inflammatory biomarkers at birth, Vitamin D treatment group, Fatty acid profile (% of total fatty acids), and various fatty acids. Row 1: Maternal age (years), Mean, 22.9, 23.8, 0.02. Row 2: Maternal age (years), SD, 4.0, 4.3. Row 3: Parity, None, 201, 47, 76, 46, 0.005. Row 4: Parity, 1, 163, 39, 49, 30. Row 5: Parity, 2 or more, 58, 14, 40, 24. Row 6: Infant sex, Male, 214, 51, 91, 55, 0.33. Row 7: Infant sex, Female, 208, 49, 74, 45. Row 8: Gestational age at birth (weeks), Mean, 39.1, 38.9, 0.18. Row 9: Gestational age at birth (weeks), SD, 1.4, 1.6. Row 10: Infant birth weight (g), 2706, 352, 2710, 521, 0.92. Row 11: Birth mode, Vaginal, 204, 48, 67, 41, 0.09. Row 12: Birth mode, Cesarean, 218, 52, 98, 59. Row 13: Maternal inflammatory biomarkers at birth, CRP (mg/l), 9.4, 3.9-22.2, 10.6, 3.8-25.0, 0.38. Row 14: Maternal inflammatory biomarkers at birth, AGP (g/l), 0.87, 0.64-1.2, 0.94, 0.68-1.5, 0.14. Row 15: Vitamin D treatment group, A. 0 IU/week, 31, 7.4, 22, 13, 0.16. Row 16: Vitamin D treatment group, B. 4200 IU/week, 113, 27, 40, 24. Row 17: Vitamin D treatment group, C. 16 800 IU/week, 110, 26, 47, 28. Row 18: Vitamin D treatment group, D. 28 000 IU/week, 114, 27, 40, 24. Row 19: Vitamin D treatment group, E. 28 000:28 000 IU/week, 54, 13, 16, 10. Row 20: Fatty acid profile (% of total fatty acids), 6:0, 0.12, 0.03, 0.11, 0.03, 0.003. Row 21: Fatty acid profile (% of total fatty acids), 8:0, 0.28, 0.08, 0.29, 0.07, 0.50. Row 22: Fatty acid profile (% of total fatty acids), 10:0, 1.8, 0.57, 1.9, 0.48, 0.44. Row 23: Fatty acid profile (% of total fatty acids), 12:0, 6.7, 2.1, 7.5, 2.3, < 0.001. Row 24: Fatty acid profile (% of total fatty acids), 14:0, 6.2, 2.1, 7.1, 2.4, < 0.001. Row 25: Fatty acid profile (% of total fatty acids), 15:0, 0.16, 0.13-0.21, 0.15, 0.12-0.18, 0.007.
CRP, C-reactive protein; AGP, α-1-acid glycoprotein; IU, international units; IQR, interquartile range; MCFA, mid-chain fatty acids; LCFA, long-chain fatty acids.
* Parity was defined as number of births prior to the current pregnancy and birth.
† Infant birth weight missing for 117 participants, n 470.
‡ Maternal CRP only available in a subset of participants, n 456.
§ Maternal AGP only available in a subset of participants; n 391.
|| Treatment groups are defined as prenatal dose:postpartum dose (IU/week).
¶ MCFA index = [(C6:0 + C15:0) ÷ (C12:0 + C14:0)] × 1000.
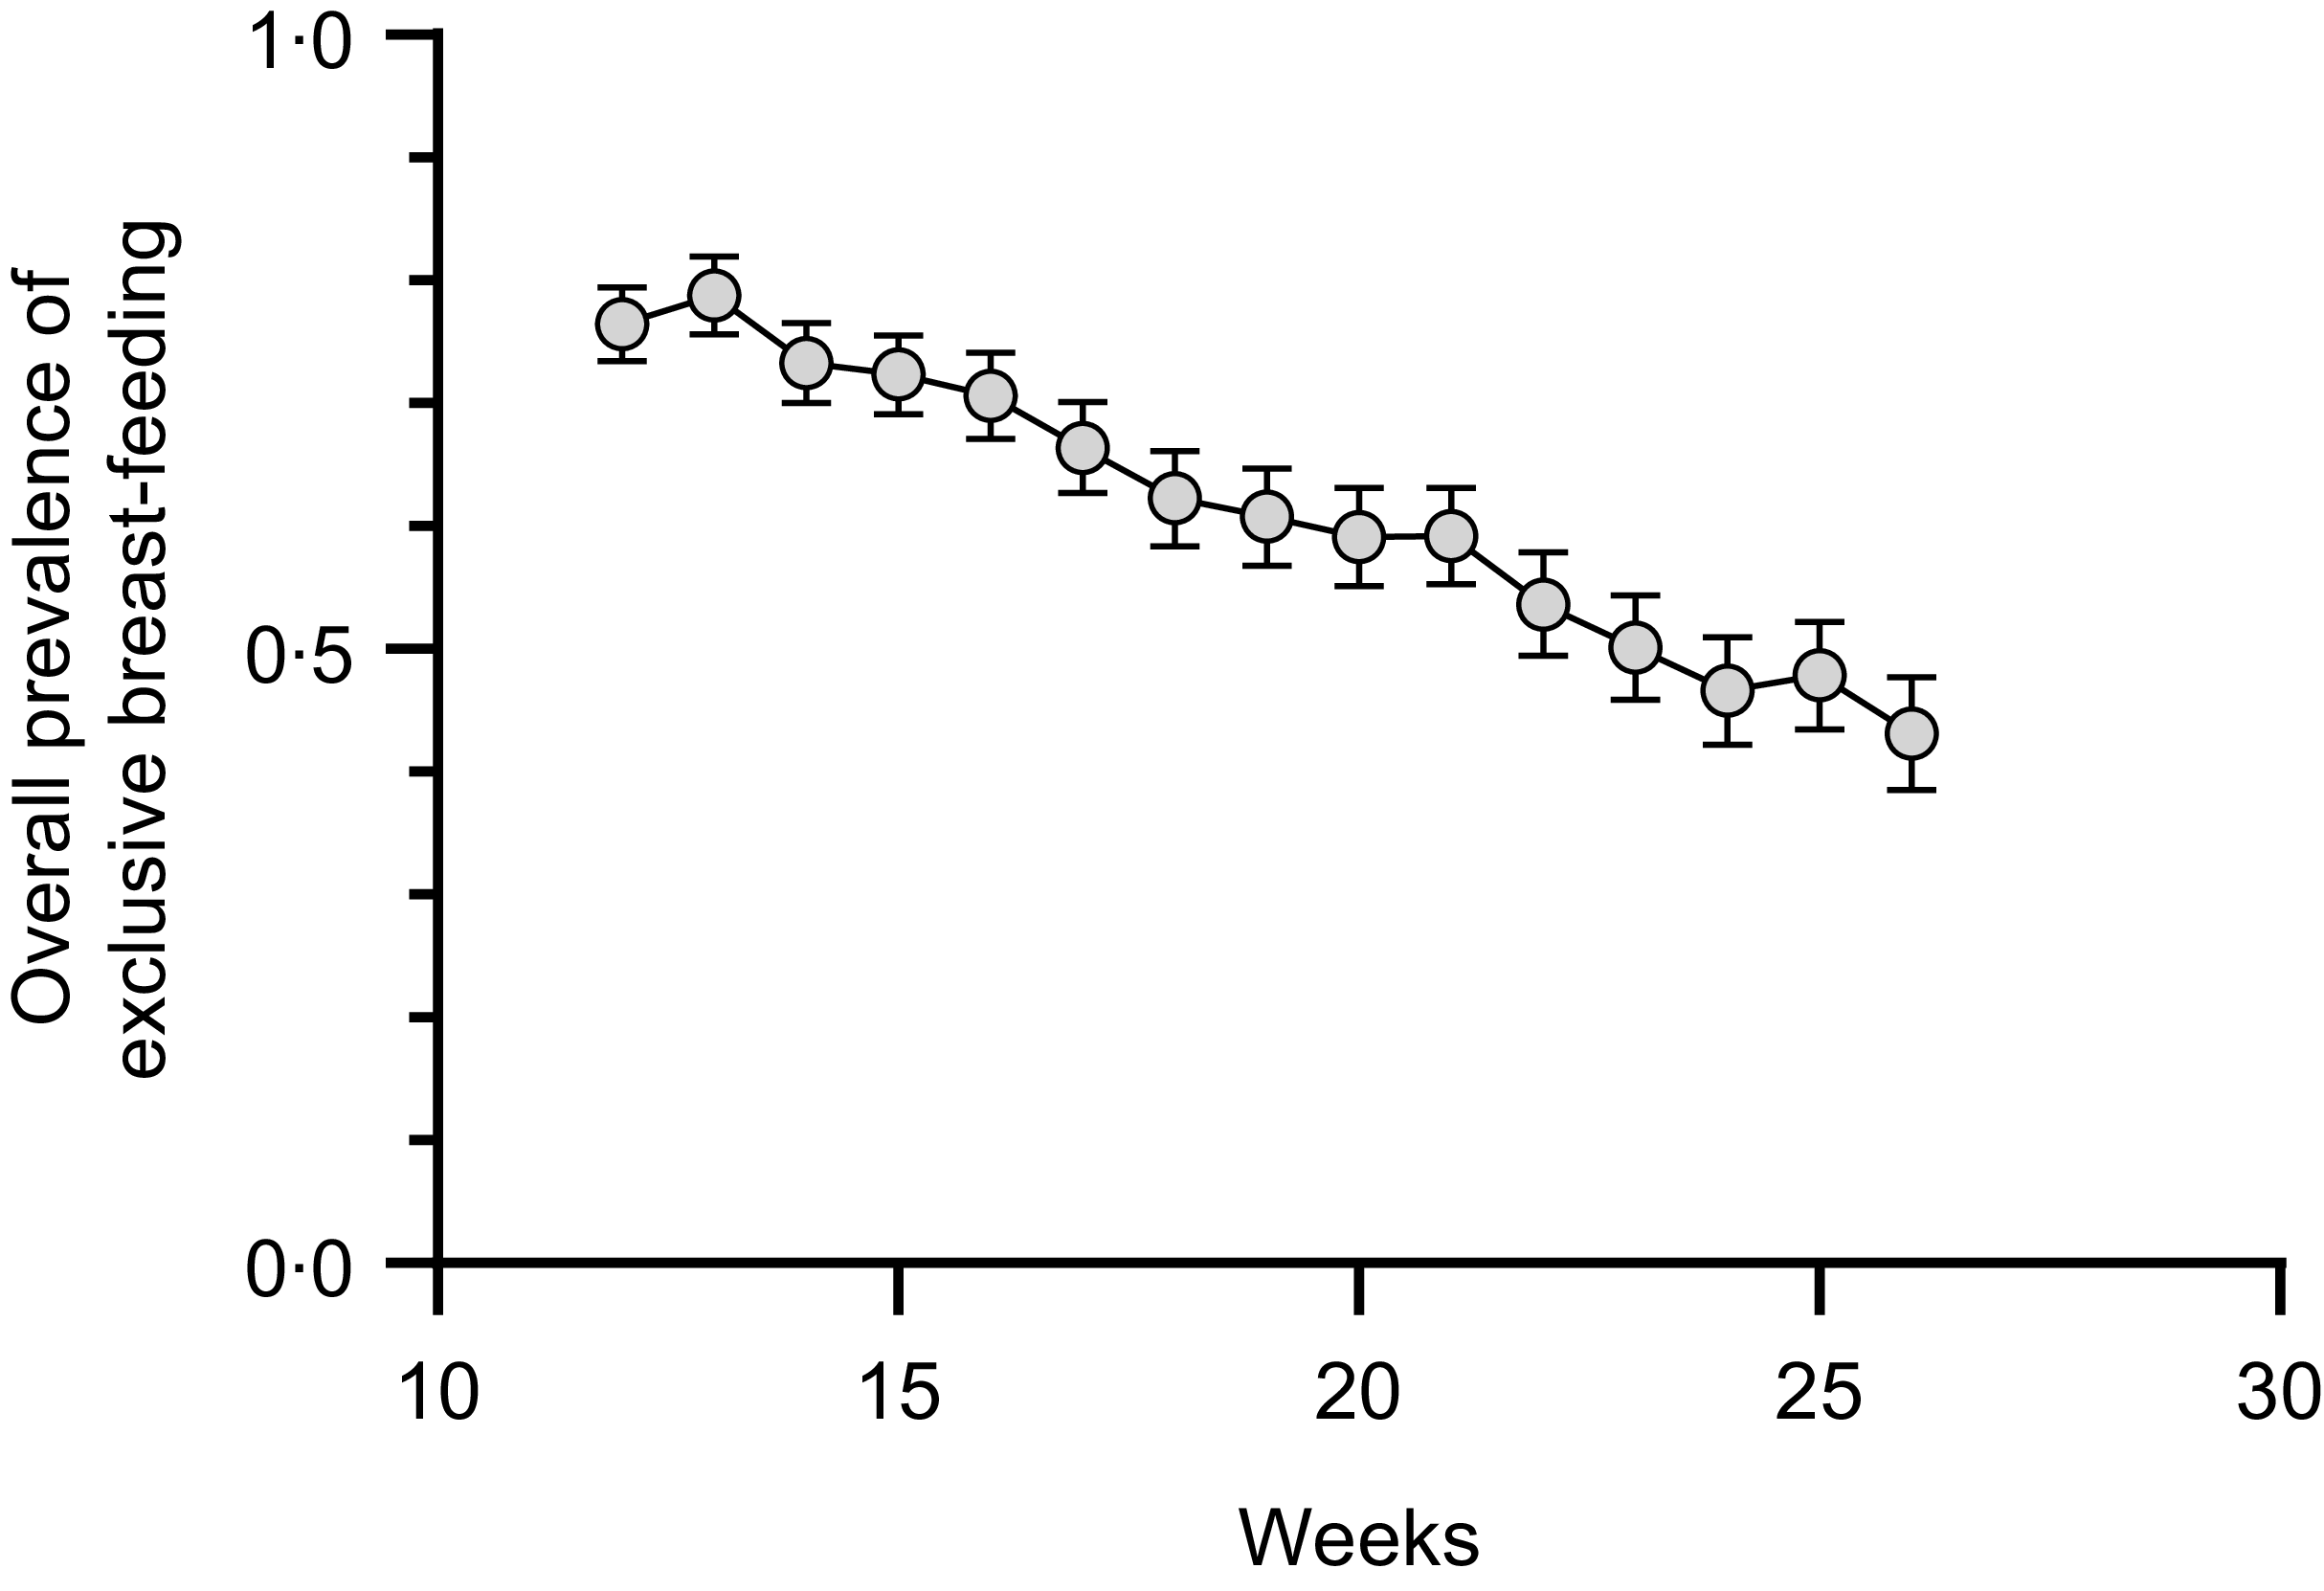
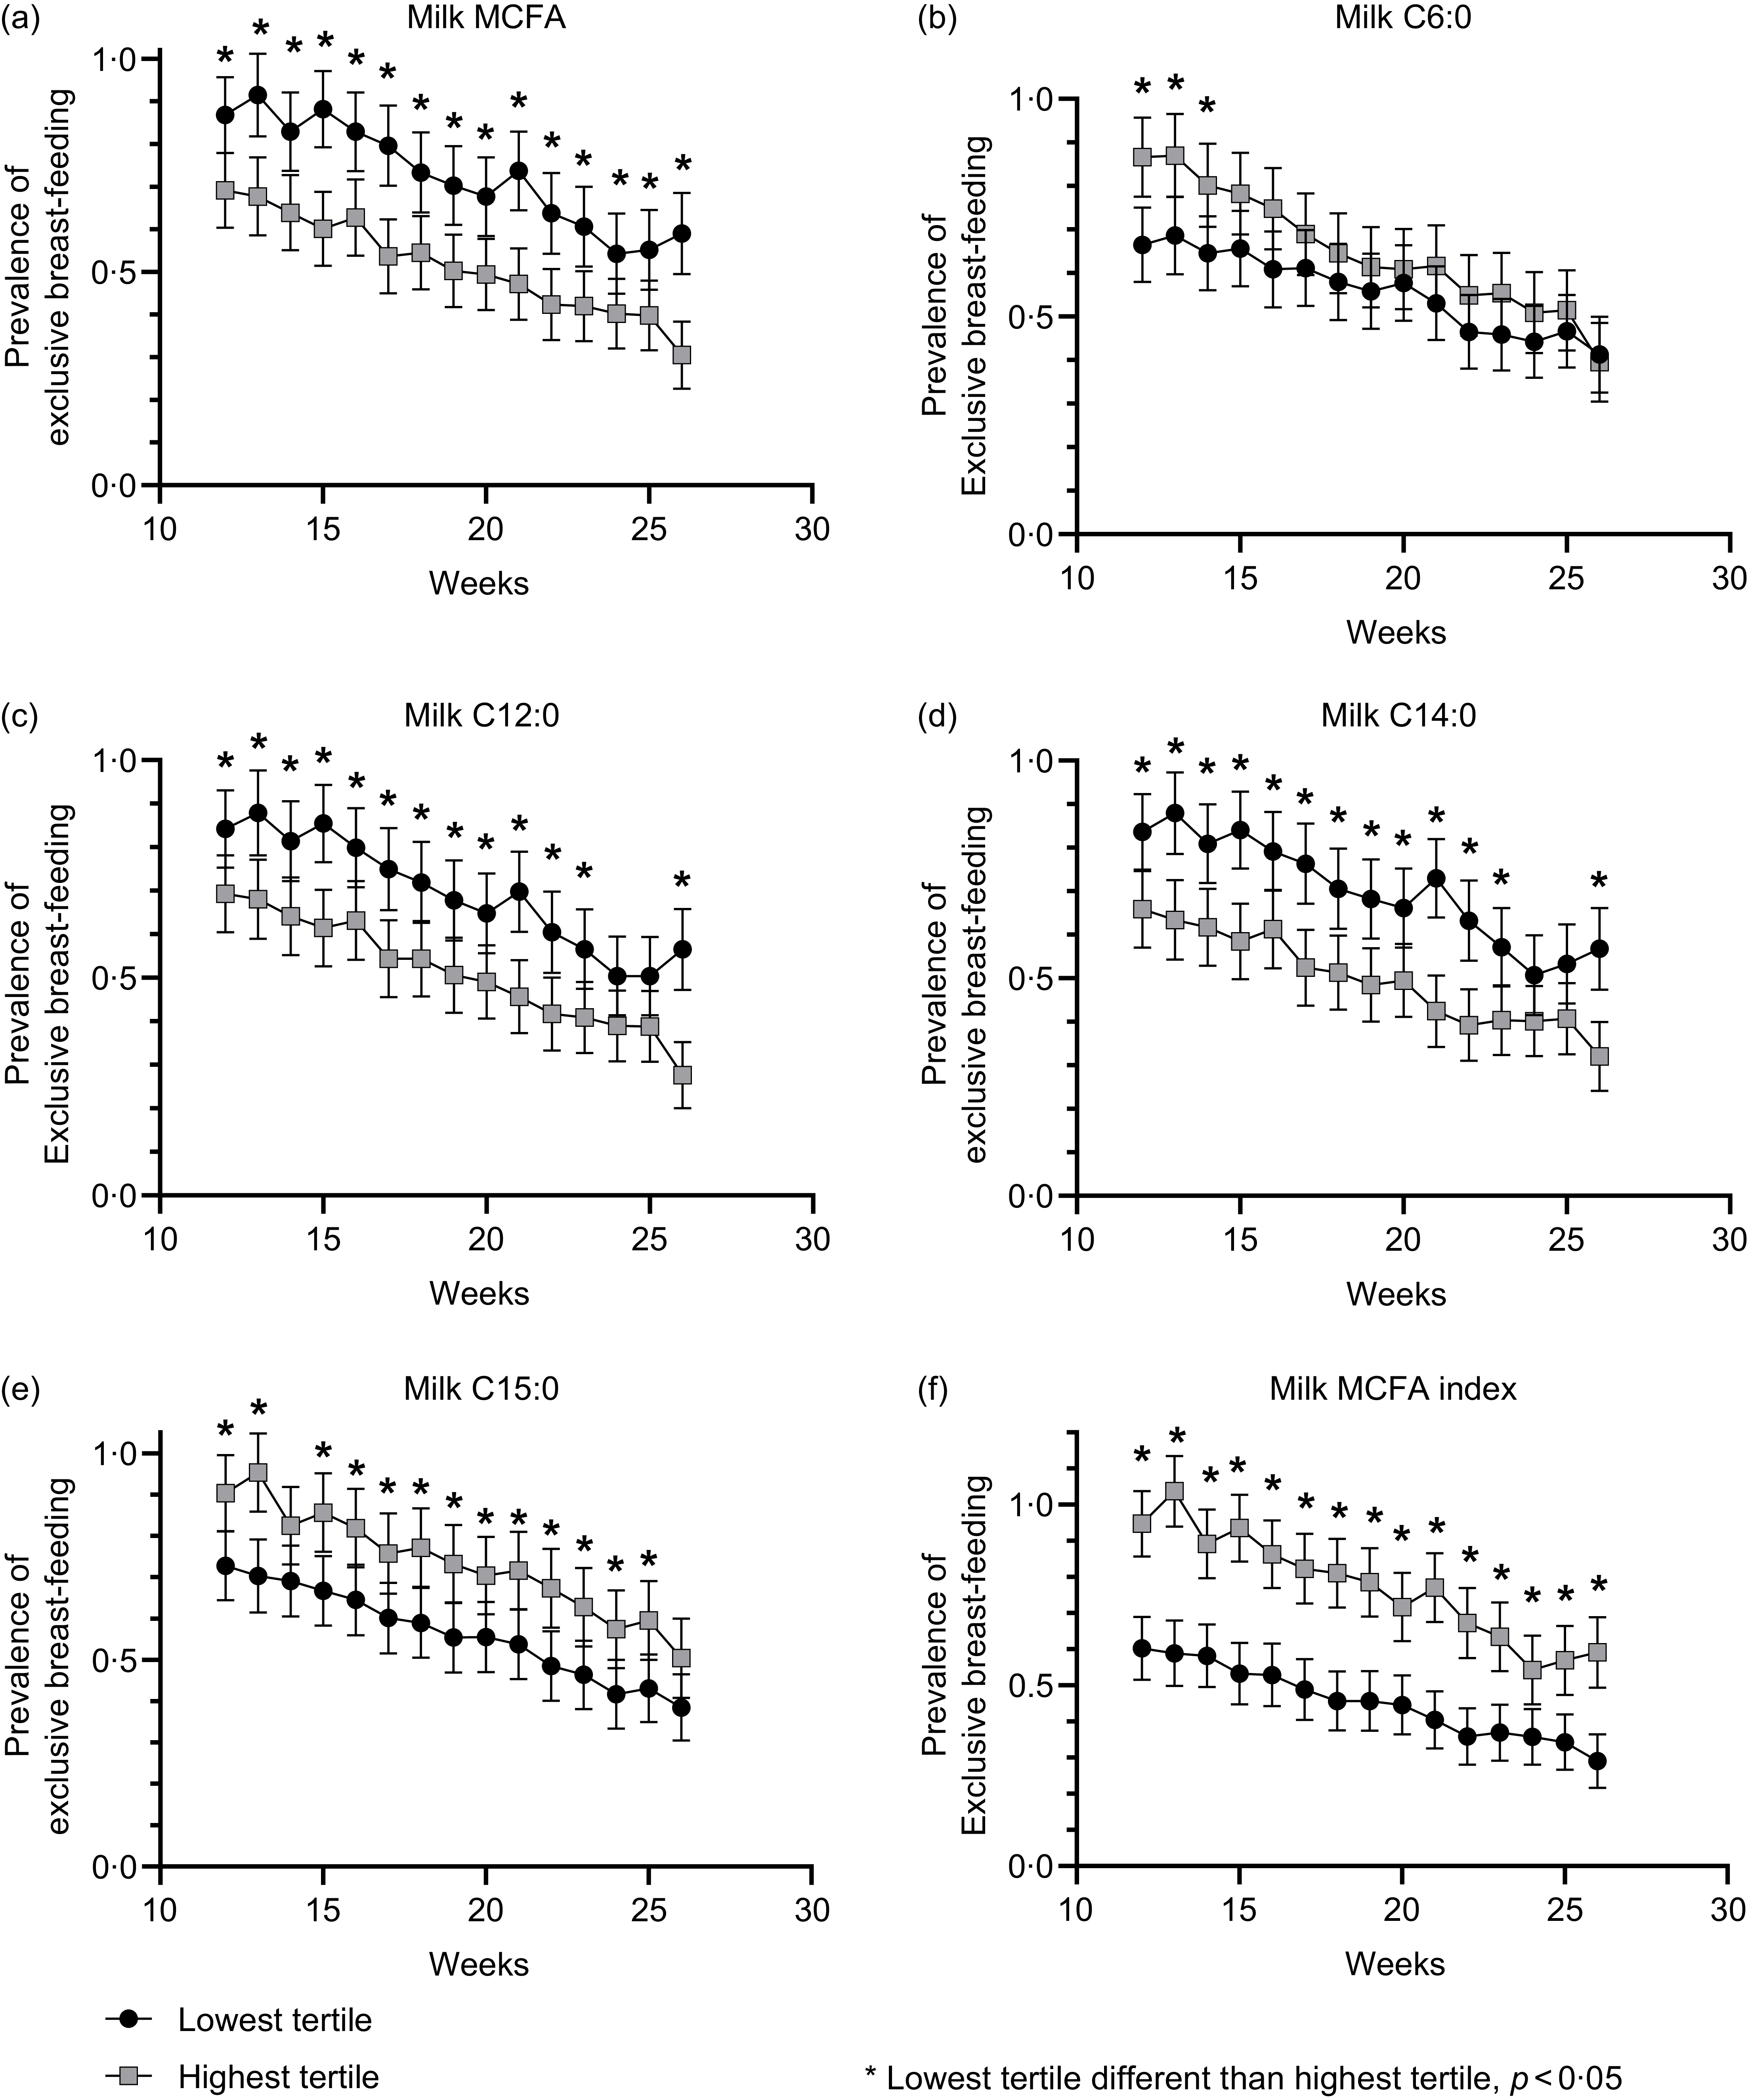
In our adjusted longitudinal models, we found that the overall prevalence of exclusive breastfeeding decreased by approximately 40 % from 3 to 6 months (12–26 weeks) postpartum from 76 % to 43 % (Figure 2). Mothers in the highest and lowest milk MCFA tertiles had a prevalence of exclusive breastfeeding of 69 % and 87 % at 3 months, respectively (P = 0·02), and this difference persisted until 6 months (Figure 3(a)). We found similar results using C12:0 and C14:0 (Figure 3(c) and (d)). Mothers in the highest tertile of C6:0 had a higher exclusive breastfeeding prevalence at 3 months compared with the lowest tertile, but the difference disappeared prior to 6 months (Figure 3(b)). Mothers in the highest tertile of C15:0 had a higher exclusive breastfeeding prevalence that persisted from 3 to 6 months compared with the lowest tertile (Figure 3(e)). Mothers in the highest and lowest MCFA index tertiles had a strikingly different prevalence of exclusive breastfeeding of 95 % and 60 % at 3 months, respectively (P < 0·001), and this difference persisted to 6 months (Figure 3(f); online Supplementary Table 4).
Longitudinal overall prevalence of exclusive v. non-exclusive breastfeeding after 3 months in Bangladeshi mothers. The model-adjusted prevalence of exclusive breastfeeding was calculated using repeated-measures Poisson regression. Covariates included vitamin D supplementation group, birth mode, gestational age at birth, maternal age, parity and infant sex. Analytical subgroup, n 587.

Longitudinal prevalence of exclusive v. non-exclusive breastfeeding after 3 months based on milk fatty acid profile. The model-adjusted prevalence of exclusive breastfeeding was calculated using repeated-measures Poisson regression. All models included vitamin D supplementation group, birth mode, gestational age at birth, maternal age, parity and infant sex as covariates. (a) Prevalence of exclusive breastfeeding by milk mid-chain fatty acid (MCFA) tertiles, (b) milk C6:0 (caproic acid) tertiles, (c) milk C12:0 (lauric acid) tertiles, (d) milk C14:0 (myristic acid) tertiles, (e) milk C15:0 (pentadecanoic acid) tertiles and (f) milk MCFA index = [(C6:0 + C15:0) ÷ (C12:0 + C14:0)] × 1000 tertiles. Analytical subgroup, n 587.

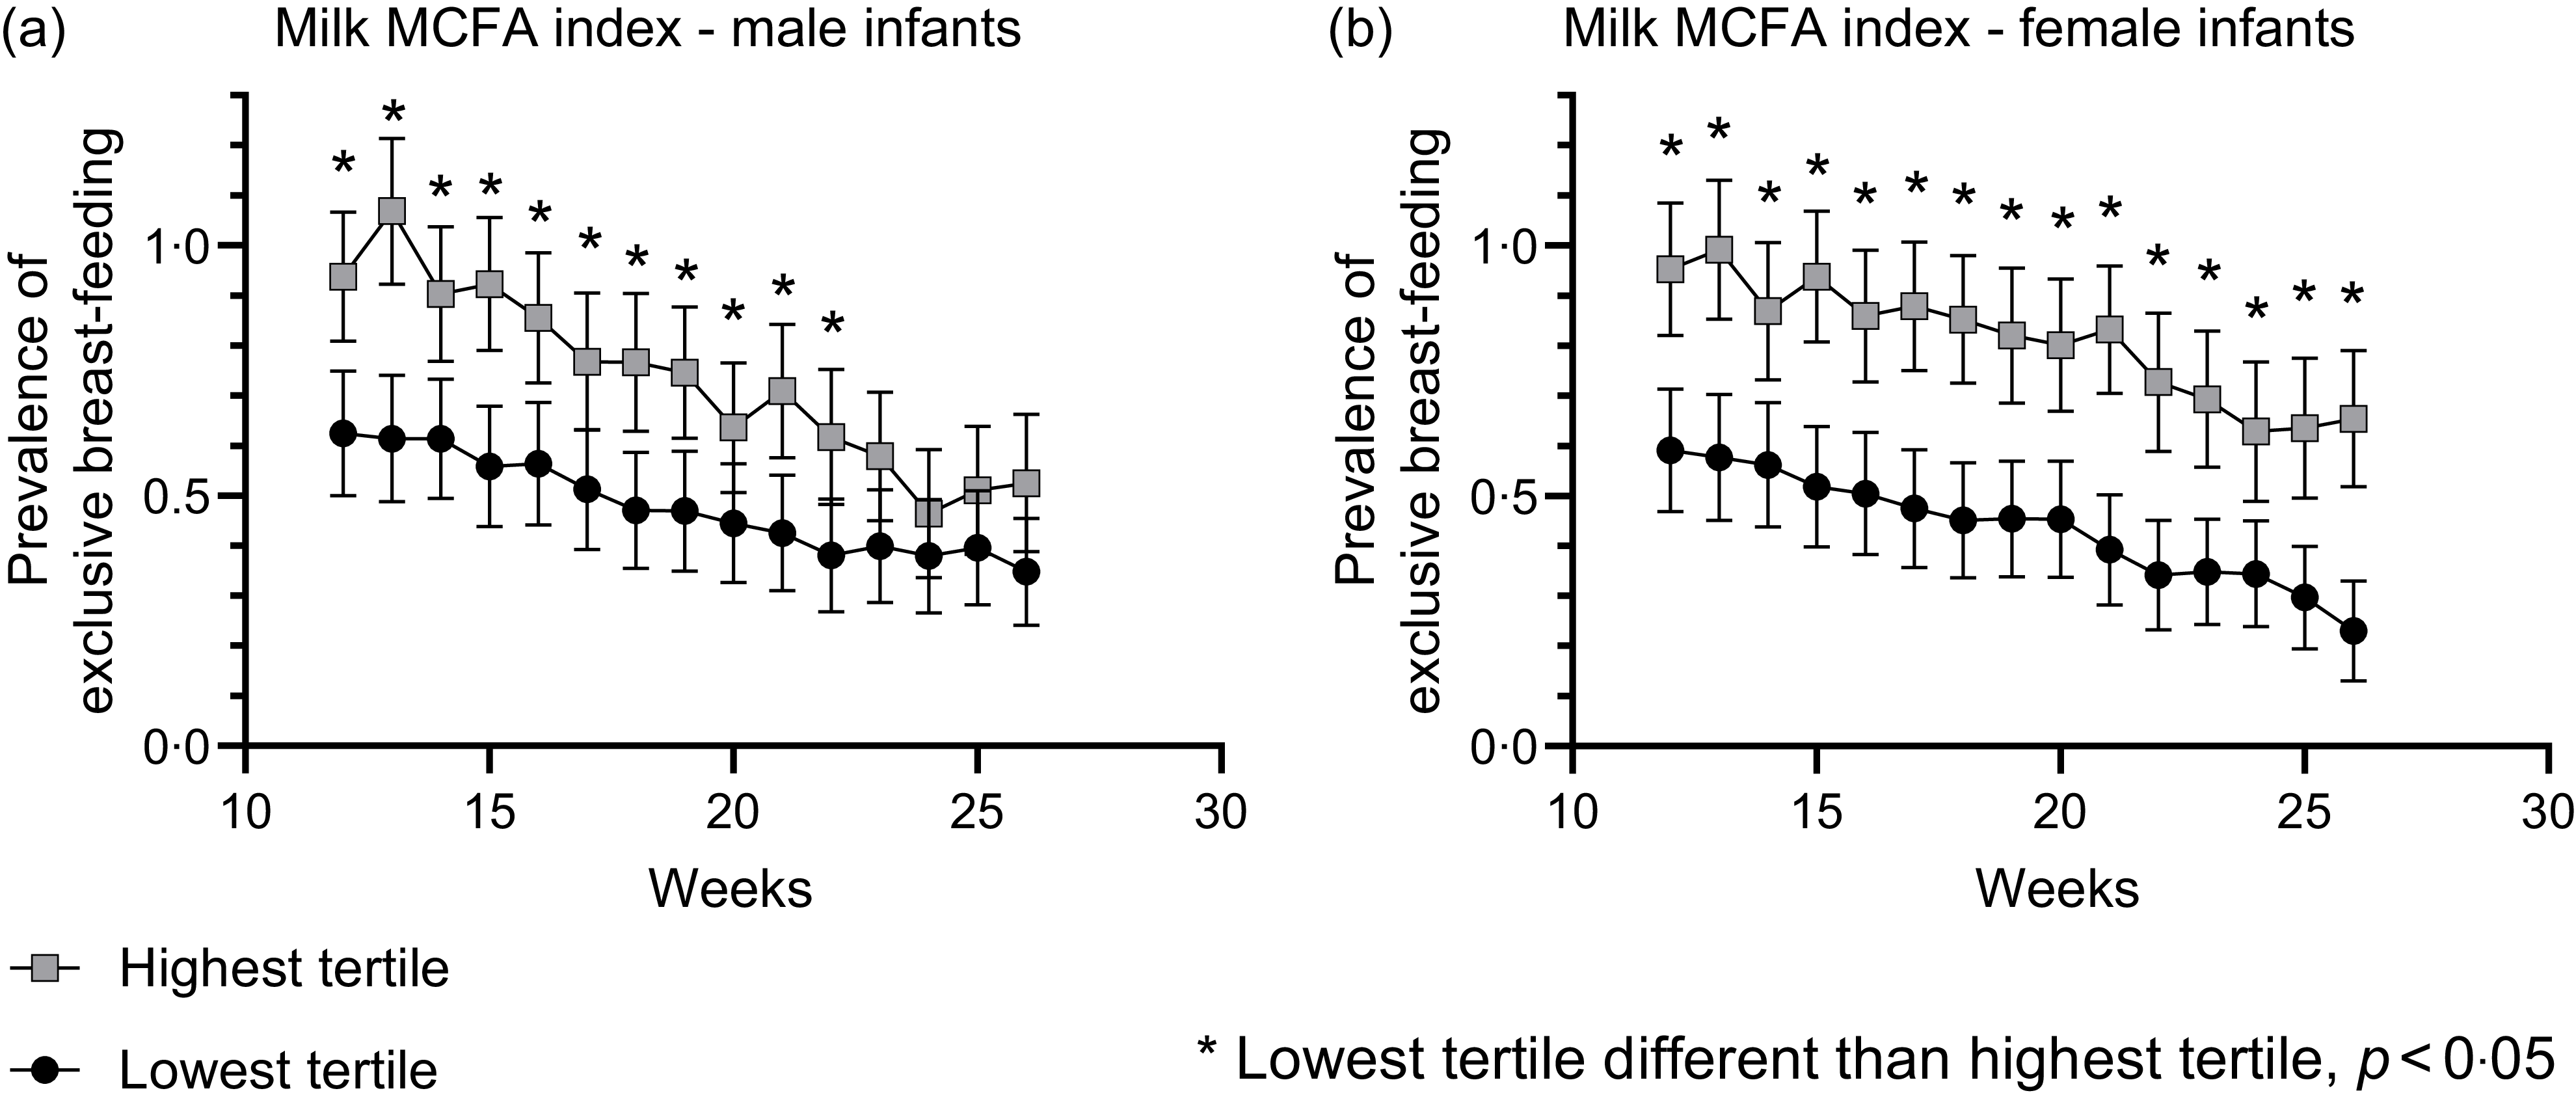
Maternal inflammatory biomarkers measured at birth, serum CRP and AGP, were correlated with some milk fatty acids, particularly some specific individual MCFA (online Supplementary Table 5). However, sensitivity analyses revealed similar results in our longitudinal analysis of the association between milk MCFA index and exclusive breastfeeding, regardless of inflammatory status (CRP > 5 mg/l and AGP > 1 g/l; online Supplementary Figure 1(a)). Similarly, results were not meaningfully altered by the inclusion of infant birth weight as a covariate (online Supplementary Figure 1(b)) or the exclusion of preterm births (online Supplementary Figure 1(c)). When stratifying for infant sex, results were similar for both male and female infants, but the association was stronger for female infants (Figure 4). Milk fatty acid profiles were not meaningfully different between mothers of male and female infants (online Supplementary Table 6).
Longitudinal prevalence of exclusive v. non-exclusive breastfeeding after 3 months based on milk fatty acid profile (MCFA Index) stratified by infant sex. The model-adjusted prevalence of exclusive breastfeeding was modelled using repeated-measures Poisson regression stratified by male and female infant sex. All models included vitamin D supplementation group, birth mode, gestational age at birth, maternal age and parity as covariates. (a) Prevalence of exclusive breastfeeding by milk MCFA index ([(C6:0 + C15:0) ÷ (C12:0 + C14:0)] × 1000) tertiles in only male infant births (n 305) and (b) in only female infant births (n 282). MCFA, mid-chain fatty acids.

Figure 4. Long description
Two line graphs depict the prevalence of exclusive breastfeeding in male and female infants over weeks, comparing highest and lowest tertiles of milk MCFA index. Panel A: The line graph shows the prevalence of exclusive breastfeeding in male infants. The x-axis represents weeks, ranging from 10 to 30, and the y-axis represents the prevalence of exclusive breastfeeding, ranging from 0 to 1. The graph includes two lines: one for the highest tertile (grey squares) and one for the lowest tertile (black circles). The highest tertile line generally shows a higher prevalence of exclusive breastfeeding compared to the lowest tertile line, with significant differences marked by asterisks. Panel B: The line graph shows the prevalence of exclusive breastfeeding in female infants. The x-axis represents weeks, ranging from 10 to 30, and the y-axis represents the prevalence of exclusive breastfeeding, ranging from 0 to 1. The graph includes two lines: one for the highest tertile (grey squares) and one for the lowest tertile (black circles). Similar to Panel A, the highest tertile line shows a higher prevalence of exclusive breastfeeding compared to the lowest tertile line, with significant differences marked by asterisks.
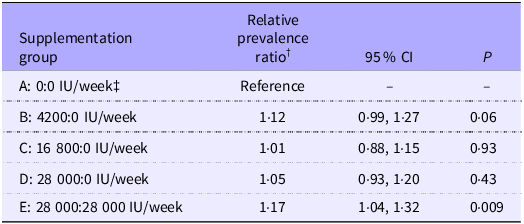
In our secondary analysis, we examined the effect of vitamin D supplementation on breastfeeding and milk outcomes. Adjusted models showed that vitamin D supplementation during both pregnancy and lactation (E: 28 000:28 000 IU/week) had a moderate beneficial effect (17 % (95 % CI 4, 32 %)) on exclusive breastfeeding at 3 months postpartum, while no significant effect was observed for any supplementation groups that provided prenatal supplementation only (Table 3). Longitudinal differences in prevalence by supplementation group were not consistently observed from 3 to 6 months (online Supplementary Figure 2), and we found no meaningful differences in fatty acid profile by vitamin D supplementation group (online Supplementary Figure 3).
Effect of vitamin D supplementation on relative prevalence of exclusive breast-feeding at 3 months * from parent trial (n 1139)

Table 3. Long description
A table with five rows and five columns comparing the effect of different vitamin D supplementation groups on the relative prevalence of exclusive breast-feeding at 3 months. The columns are labeled Supplementation group, Relative prevalence ratio, 95 percent CI, and P. The rows are labeled A: 0 IU/week, B: 4200 IU/week, C: 16 800 IU/week, D: 28 000 IU/week, and E: 28 000:28 000 IU/week. Row 1: Supplementation group, A: 0 IU/week; Relative prevalence ratio, Reference; 95 percent CI, -; P, -. Row 2: Supplementation group, B: 4200 IU/week; Relative prevalence ratio, 1.12; 95 percent CI, 0.99, 1.27; P, 0.06. Row 3: Supplementation group, C: 16 800 IU/week; Relative prevalence ratio, 1.01; 95 percent CI, 0.88, 1.15; P, 0.93. Row 4: Supplementation group, D: 28 000 IU/week; Relative prevalence ratio, 1.05; 95 percent CI, 0.93, 1.20; P, 0.43. Row 5: Supplementation group, E: 28 000:28 000 IU/week; Relative prevalence ratio, 1.17; 95 percent CI, 1.04, 1.32; P, 0.009.
IU, international units.
* Cross-sectional analysis using infant feeding data from week 13 (±1 week).
† The relative prevalence of exclusive breast-feeding was modelled using a Poisson regression with the placebo treatment group as the reference value. Covariates included birth mode, gestational age at birth, maternal age, parity and infant sex.
‡ Supplementation groups are defined as prenatal dose:postpartum dose (IU/week).
Discussion
In this study of Bangladeshi mothers, total milk MCFA concentrations were lower in participants who were exclusively compared with non-exclusively breastfeeding. However, concentrations of certain individual MCFA (C6:0 and C15:0) were higher with exclusive breastfeeding. Combining the relative concentrations of different individual MCFA (C6:0, C12:0, C14:0 and C15:0) into an MCFA index resulted in a very strong association with exclusive v. non-exclusive breastfeeding and appears to be a promising biomarker to identify non-exclusive breastfeeding, potentially indicating low milk production. Milk oleic acid concentrations were higher with exclusive compared with non-exclusive breastfeeding, but the difference was quite modest (about 1 % of total fatty acids). The overall prevalence of exclusive breastfeeding decreased longitudinally from 3 to 6 months in the entire cohort, which is expected as families transition from exclusive milk feeding to complementary foods. Throughout the duration of 3–6 months, differences in milk fatty acids remained associated with differences in the prevalence of exclusive breastfeeding. Additionally, we found that vitamin D supplementation compared with placebo during lactation was moderately associated with lower rates of non-exclusive breastfeeding, but supplementation in pregnancy alone was not. Vitamin D supplementation during pregnancy and lactation did not result in meaningful changes in milk MCFA concentrations.
This study replicated our previous results showing that milk MCFA may be a biomarker of lactation outcomes. In the previous study, milk MCFA concentrations were higher in rigorously defined cases of very low milk volume in a high-resource setting in the USA(Reference Walker, Harvatine and Ross14). In that study, we found that low milk production was not only associated with higher concentrations of MCFA but also with disrupted transfer of long-chain fatty acids from blood to milk and elevated inflammatory markers(Reference Walker, Harvatine and Ross14). When combined with the connection between biomarkers of the metabolic syndrome and adverse lactation outcomes(Reference Nommsen-Rivers, Dolan and Huang8,Reference Nommsen-Rivers, Wagner and Roznowski13,Reference Christensen, Rom and Greve26) , these results led us to hypothesise that milk MCFA is elevated in response to chronic inflammation in the mammary gland. However, in high-resource settings, chronic maternal inflammation is highly confounded by maternal overweight and obesity. The strength of using data from the Bangladeshi cohort is that rates of obesity are extremely low. In fact, even with weight measured during pregnancy (which is expected to be higher due to gestational weight gain), the proportion of people with BMI ≥ 30 was only 8·6 % (98 out of 1139). Therefore, observing similar biomarkers of adverse breastfeeding outcomes in this cohort suggests that MCFA are a robust marker of milk production regardless of adiposity.
It is important to recognise that non-exclusive breastfeeding and early weaning could be a result of many factors, including family choice, maternal return to work and illness(Reference Bookhart, Devane-Johnson and Esquerra-Zwiers27,Reference Hoban, Pei and Medina Poeliniz28) . However, in this specific Bangladeshi population, exclusive breastfeeding for approximately 6 months is the cultural expectation, and < 7 % of mothers in this study worked outside of the home(Reference Roth, Morris and Zlotkin21). Therefore, we expect that the majority of non-exclusive breastfeeding will be due to difficulties with physiological or perceived low milk production. It is also true that the addition of supplemental foods and formula will decrease the demand for mother’s milk, leading to lower milk production. Therefore, lower milk production could be a result of supplementation, or supplementation could be the result of low milk production. It could be that milk MCFA is a physiological biomarker of lower milk production in both cases of primary low milk production and weaning as a result of supplementation. It is not possible to assess the causal pathway in this observational analysis.
Unfortunately, maternal inflammatory biomarkers in this study were only available at birth, not at the time of milk collection, and only in a small subset of the total sample. Therefore, we were unable to formally assess the associations between inflammation and non-exclusive breastfeeding or milk fatty acids at 3 months. There was a weak association between maternal inflammatory markers at birth and some specific milk fatty acids in univariate regression analysis (online Supplementary Table 3). However, including these biomarkers in the model as covariates did not alter the association between the MCFA index and exclusive breastfeeding in the sensitivity analysis (online Supplementary Figure 1(a)).
Although much work has investigated the link between diet and milk fatty acids, very few other studies have linked fatty acid profiles with lactation outcomes. One secondary analysis in the CHILD cohort study in Canada found lower concentrations of both milk lauric acid (C12:0) and milk myristic acid (C14:0) with exclusive breastfeeding(Reference Miliku, Duan and Moraes29). The CHILD study also found that these milk MCFA were higher with maternal smoking, overweight, obesity and a particular polymorphism (rs174575 GG) in the FADS2 gene. This gene is important in the synthesis of long-chain PUFA, and it is generally associated with lower levels of maternal serum and milk n-6 and n-3 fatty acid concentrations(Reference Miliku, Duan and Moraes29). These results from the large CHILD cohort provide evidence that milk MCFA may be associated with lower rates of exclusive breastfeeding and less favourable maternal health indicators.
A separate study also conducted in Canada found a similar result, with both milk lauric acid and myristic acid being lower with exclusive breastfeeding(Reference Hopperton, O’Neill and Chakrabarti20). Importantly, this study also found that milk lauric and myristic acid were both significantly associated with gestational hypertension and lauric acid with pre-eclampsia. However, the relationship was in an unexpected direction, with milk MCFA being lower in the presence of both these conditions. These results suggest that the biological mechanisms regulating milk MCFA concentrations are complex and require further investigation.
An important finding of our sensitivity analysis was that the association between milk MCFA and exclusive breastfeeding differed by sex. Specifically, differences in the prevalence of exclusive breastfeeding by milk MCFA were stronger in mothers of female infants compared with mothers of male infants. This suggests that female infant sex may amplify the impact of maternal physiology and lipid metabolism on lactation outcomes. It is possible that sex differences in lactation outcomes are driven by differences in feeding patterns and volume, with male babies consuming more milk volume(Reference Eckart, Peck and Kharbanda30,Reference da Costa, Haisma and Wells31) . However, findings related to sex differences in feeding patterns and milk composition are inconsistent in the literature(Reference Eckart, Peck and Kharbanda30).
The current study provides some moderate evidence that vitamin D supplementation during pregnancy and lactation could be associated with increased prevalence of exclusive breastfeeding. Our finding of a 17 % increased prevalence of exclusive breastfeeding with 28 000 IU/week during pregnancy and lactation compared with placebo is a substantial difference worth further investigation. Vitamin D is known to be a pluripotent nuclear regulator with downstream genes involved in lipid metabolism and inflammatory pathways(Reference Voltan, Cannito and Ferrarese15–Reference Asano, Watanabe and Ryoden17). Therefore, it is plausible that vitamin D deficiency could be involved in physiological difficulties with lactation. However, we suggest caution in overinterpreting our results since the parent randomised controlled trial was not designed to test breastfeeding outcomes.
Strengths and limitations
Strengths of this study include the use of data and samples from a highly controlled, rigorous randomised controlled trial with a rich dataset. Because of the inherent challenges of working with postpartum mother–infant dyads, the majority of studies in low milk production are very small. This study had the advantage of a relatively large sample size (n 598), allowing for more power to see differences between groups. Another advantage of this dataset was the weekly data on infant feeding allowing for the longitudinal analysis of changes in exclusive breastfeeding over time.
Some limitations of this study include the lack of maternal inflammatory biomarker data at 3 months, which limited our ability to interpret the role of inflammation in this cohort. We hope to include these data in future studies as well as other inflammatory and metabolic biomarkers, such as lipid mediators, blood lipids and markers of insulin resistance, as well as mammary gene expression of related pathways. These additional data will help to elucidate more detailed mechanisms underlying differences in mammary lipid metabolism observed in mothers with adverse lactation outcomes. Some loss of sample integrity could have been caused by storage at −20°C for some of the samples. However, this storage was usually minimal (< 12 h), and relative milk fatty acid concentrations are generally robust to variation in storage conditions(Reference Bertino, Giribaldi and Baro32,Reference Romeu-Nadal, Castellote and López-Sabater33) . Another limitation of this study is the lack of maternal dietary data collection, since maternal dietary intake can impact milk fatty acid profile, particularly the milk PUFA(Reference Neville and Picciano34,Reference Dror and Allen35) . The parent trial only collected limited intake data focused on vitamin D, Ca and related foods(Reference Roth, Gernand and Morris22). However, milk MCFA concentrations are largely independent of maternal diet, since they are primarily produced by de novo synthesis in the mammary gland(Reference Neville and Picciano34). Finally, milk fatty acids were only measured at 3 months, limiting our ability to understand physiological differences that may be present in the early stages of lactation.
Conclusions
The results of this study support our previous findings that milk MCFA are important biomarkers of adverse lactation outcomes such as non-exclusive breastfeeding. Identifying biomarkers and biological mechanisms associated with non-exclusive breastfeeding and low milk production is crucial to begin developing interventions that can improve breastfeeding outcomes for mothers and infants.
Supplementary material
For supplementary material/s referred to in this article, please visit https://doi.org/10.1017/S000711452610796X
Acknowledgements
The authors are grateful to Kevin Harvatine’s laboratory in the Department of Animal Sciences at Penn State for access to their GC equipment and for the excellent technical assistance of Sarah Burtnett and Yusuf Adeniji.
Funding for this study was provided by the Huck Institutes of the Life Sciences at Penn State University through the Huck Innovative and Transformational Seed Grant (HITS) and an internal grant from the College of Health and Human Development at Penn State (REW). All content is the responsibility of the authors only and does not necessarily represent the views of the Huck Institutes. Funding for the original trial was provided by the Gates Foundation (OPP1066764).
R. E. W.: Conceptualisation-Lead, Data curation-Lead, Formal analysis-Lead, Funding acquisition-Lead, Investigation-Lead, Methodology-Lead, Project administration-Lead, Visualisation-Lead, Writing – original draft-Lead and Writing – review and editing-Lead; S. M. S.: Formal analysis-Supporting, Investigation-Supporting, Visualisation-Supporting, Writing – original draft-Supporting and Writing – review and editing-Supporting; A. A. M.: Conceptualisation-Supporting, Data curation-Supporting, Formal analysis-Supporting and Writing – review and editing-Supporting; M. M. I.: Conceptualisation-Supporting, Data curation-Supporting, Formal analysis-Supporting, Writing – original draft-Supporting and Writing – review and editing-Supporting; A. D. G.: Conceptualisation-Supporting, Data curation-Equal, Formal analysis-Equal, Funding acquisition-Supporting, Investigation-Supporting, Methodology-Supporting, Resources-Lead, Visualisation-Supporting, Writing – original draft-Supporting and Writing – review and editing-Supporting. All authors have read and approved the final manuscript.
R. E. W. serves on the board of directors for the International Society for the Study of Fatty Acids and Lipids. All other authors have no conflicts to disclose.
Data described in the manuscript, code book and analytic code will be made available upon request pending approval by Penn State.


 Open access

