

Transportation played a leading role in the Industrial Revolution, and its history raises important questions regarding costs, technology, and marketing. Advances in transportation broadened markets, connecting ever more producers and consumers with each other. Rivers and roads were improved, and a large network of canals was built. Over time, they got better. Transportation embodies indivisibilities and network externalities, which meant that non-competitive pricing could and did emerge.
I will explore these issues in the case of coal. While coal was not everything, it was fundamental to the Industrial Revolution. In the 1560s, Britain produced about .23 million metric tons of coal (Hatcher Reference Hatcher1993, p. 68). By 1831, output had increased 137-fold to 31.5 million tons. Britain was very much in the lead in creating the coal economy: total production in the United States, Germany, France, and Belgium in 1831 was only 6.7 million tons, and output elsewhere was negligible (Mitchell Reference Mitchell1992, p. 416). All of the coal had to be shipped from mines to consumers, and that made coal an important class of freight. Its transport raises many questions I investigate: How did the cost of shipping vary between transport modes and over time? How integrated were markets across the country? To what degree did monopoly affect prices and the geographical pattern of marketing? How much did productivity in shipping coal increase and what were the main avenues for improvement?
Answering these questions sheds light on some important general themes of the Industrial Revolution. The first is the importance of coal. While coal has long been regarded as a pillar of Britain’s industrial strength in the nineteenth century (Allen Reference Allen2009; Wrigley Reference Wrigley2010), this view is challenged by Clark and Jack’s (2007) finding that coal mining achieved little productivity growth during the Industrial Revolution. I do not dispute that result, but believe more was involved. What mattered to the consumers of coal was its delivered price, and transport costs from the mine to the user were often multiples of the pithead price. I find that there was substantial productivity growth in the shipment of coal, and this restores to coal some of its dynamism and importance.
Second, our findings bear on the question of balanced versus unbalanced growth in the Industrial Revolution (Harley 1982; Crafts 1989; Crafts and Harley 1992; Temin Reference Temin1997). We find that all sectors of coal transport—sea, river, road, and canal—achieved significant productivity growth between 1695 and 1842, and this shows that growth was balanced within the transport sector itself. Strong productivity growth within transport complements the strong productivity growth in agriculture and manufacturing (even if it may have been uneven within that sector) and reinforces the view that the incentives and capacities to achieve considerable productivity growth operated across the entire British economy and were not confined to a small niche.
Third, the paper expands our knowledge of market integration during the Industrial Revolution. Adam Smith’s (1937) description of the economy celebrated its supposed competitive, integrated markets. But how integrated were they really? This question has been pursued mainly for grain, and substantial integration has been found (Granger and Elliott Reference Granger and Elliott1967; Keller and Shiue Reference Keller and Shiue2007; Tan Reference Tan2009). Generally, these investigations use time series data. We extended the discussion to coal and used cross-sectional data. By interpreting that data in terms of the law of one price, we can show that coal markets in c. 1695, c. 1795, and 1842 were highly integrated and fully arbitraged.
Fourth, the paper examines the importance of the British constitution as an institution to promote economic growth. Parliament played a key role by passing thousands of acts authorizing canals, roads, and river improvements. Since raising the value of land is a fundamental criterion for cost-benefit assessments of “small” projects that do not change prices, and since parliament was composed mainly of landowners keen to raise the value of their estates, it is not surprising that it would pass improvement acts that contributed to economic development. But a parliament of landowners was a two-edged sword. We will see that the owners of mining rights in Northumberland and Durham had enough clout to prevent canal construction from achieving its full potential, which would have lowered the value of their mines.
This paper develops a new method for measuring transport costs using geographical information systems and regression analysis. In principle, costs can be established from business records showing the prices charged for the services involved, and much has been established through these methods (Beveridge Reference Beveridge1939; Bogart et al. 2021; Freeman Reference Freeman1977; Gerhold 2005, 2014; Hatcher Reference Hatcher1993; Jackman Reference Jackman1966; Maw Reference Maw2013; Nef Reference Nef1932). It is hard to get a comprehensive overview, however—comprehensive both in the sense of geographical coverage and of the services involved. Moreover, in studies of the trans-Atlantic grain and cotton trades, historians have found that freight rates are only a part of the costs and do not account for the difference between prices in the United States and the United Kingdom (Harley 1992; Persson Reference Persson2004). Was the same true of coal during the Industrial Revolution? The basic approach of this paper is to ask: What level of shipping costs accounts for changes from place to place in the price of coal? Costs of shipping by sea, rivers, canals, and roads are worked out for cross-sections of prices spanning the Industrial Revolution. These costs allow us to establish regional marketing patterns for the various mining districts, trace their changing fortunes over the Industrial Revolution, examine the impact of canal building on those patterns, measure the effectiveness of the monopolistic practices of Northeast coast producers, and estimate productivity in transporting coal.
DATA AND THE GEOGRAPHY OF THE COAL TRADE
The principal data analyzed in this paper are three cross-sections of coal prices. These are referenced as 1695, 1795, and 1842. Most prices in the first two cross sections were collected by local correspondents reporting on prices in markets in their town, so these prices were of coal for heating and cooking rather than industrial applications. Other prices in these years were taken from the accounts of schools and colleges, and so they would have been of similar character. In 1842, the prices were of coal purchased by poor law unions, so they too would have been domestic coal. All of these prices are like “c.i.f.” prices in that they include all mining costs, taxes, and shipment costs, including insurance. Before 1842, most steam engines were used to drain mines, and they were fuelled by the coal from those mines, so no transport costs were incurred for this use (Figure 1).
PLACES MENTIONED IN THE TEXT
Source: OpenStreetMap downloaded from QGIS with additional towns indicated.

The core of the first data set are the prices collected by John Houghton for his market reports in his Collection for Improvement of Husbandry and Trade. I use averages for 1691–1702 as tabulated by Rogers (Reference Rogers1887, pp. 385–91). (In most cases, 1702 prices are markedly higher than those in the preceding decade.) The data set includes pricesFootnote 1 for 72 towns.Footnote 2 Houghton got his information from local correspondents. Chartres (Reference Chartres1985, pp. 456–65) discusses their reliability and uses them extensively, as did other historians in the Agrarian History of England & Wales. The data set was expanded by using prices reported in Rogers (Reference Rogers1887), Beveridge (Reference Beveridge1939), Nef (Reference Nef1932), and Hatcher (Reference Hatcher1993). Since coal prices were trendless in the late seventeenth and early eighteenth centuries, prices dated to any of those years were included in the data set.
The core of the second data set are prices collected in Sir Frederick Eden’s The State of the Poor (1797). When his village reports are dated, they derive from the mid-1790s. Some price quotations come from Davies (1795). Others from Arthur Young (1771a, 1771b) were also included. Since the price of coal had risen about 30 percent in the interim,Footnote 3 Young’s prices were increased by that proportion. In addition, some coal prices for 1795 were taken from Beveridge (Reference Beveridge1939), von Tunzelmann (Reference von Tunzelmann1978), and Rimmer (Reference Rimmer1955). Altogether, the data set includes prices of coal in 49 towns or villages.
The third data set was extracted from the report on the prices paid for coal by Poor Unions in 1842 (Poor Law Commission 1843). Crafts (1982) discussed the reliability of this source and used the prices reported in 1843 to study regional price variations in England. Prices were collected for towns and villages that appeared in either of the other two data sets. Other parishes along important transport routes were also included. When a town was missing in the Poor Law report, the price of an adjacent Poor Law Union was used.
Since the geographical pattern of prices is the basis of the analysis, I begin with it. Figure 2 maps prices for c. 1695. The pattern is well known, but the salient points need emphasis since they are fundamental to the procedure. The cheapest coal was in Coalbrookdale, located northwest of Birmingham (3 shillings per ton), and Newcastle (5 shillings per ton). There are only a few midlands locations, and prices there were a bit higher (e.g., 6 shillings in Derby and 10 in Nottingham). Welsh prices were also higher (e.g., 17 shillings in Pembroke). Prices were even higher along the east coast (24 shillings at Norwich) and higher still in the Thames Valley. The highest prices were along the south coast (e.g., 50 at Chichester), the upper Thames Valley (41 in Oxford), and north and northwest of London (40 at Northampton or 54 at Hitchin).
COAL PRICES IN 1695 (SHILLINGS PER TON)
Source: See text.

Mutatis mutandis, the same pattern characterizes c. 1795 and 1842 (Figures 3 and 4). The latter has the most data points, so I review it. The cheapest price was in Lancashire (4 shillings), followed closely by the Newcastle region (5–6 shillings). The midlands posted higher prices of 6–9 shillings per ton on the coal field running from Leeds to Derby. Coal in the Black Country was also cheap (9 shillings at Dudley) and on the Warwickshire field (9 shillings per ton in Coventry). A change from the 1695 pattern was the price in Coalbrookdale (12 shillings), which had risen noticeably. Earlier patterns were continued, however, with higher prices along the east and south coasts (22 in Norwich and 24 in Chichester). Prices in London were higher, but not as high as in 1695. The highest prices were again northwest of London in places like Dunstable (37 shillings per ton).
COAL PRICES IN 1795 (SHILLINGS PER TON)
Source: See text.

COAL PRICES IN 1842 (SHILLINGS PER TON)
Source: See text.

That coal prices were lower in the North than in the South has been well known since the start of the coal trade in view of its one-way direction. The explanation is obvious: the coal was mined in the North and shipped to consumers in the South, where costs were raised by the transportation mark-up. We can distinguish five major coal routes.
The largest coal trade by far involved coal mined in Newcastle and northern Durham. It was loaded onto lighters at the staiths (coal terminals) on the Tyne and Wear, taken to the North Sea, and reloaded onto colliers that took it to Greenwich (by London), where it was unloaded, heavily taxed, and taken ashore for use in London or for reshipment by barge up the Thames or downstream. Newcastle coal was also unloaded at other ports along the east and south coasts, including, in particular, King’s Lynn for shipment up the Ouse and Nene, as well as in Yarmouth for shipment to Norwich, Southhampton for local distribution, and so forth.
An important feature of the east coast coal trade was its potential for monopolization. The mines in Northumberland and Durham were close to the Tyne and the Wear. Since all of the coal was loaded along two short stretches of river, it was comparatively easy for the mine operators in Northumberland and Durham to restrict output and raise prices, and attempts were frequently made to do so. How successful they were and how much they affected the regional distribution of production and consumption is something we investigate.
The second important trade was in coal mined at Coalbrookdale. This coal was used locally to smelt iron. Large quantities for domestic use were also shipped down the Severn as far as Gloucester and up the Severn’s tributaries, including the Avon.
A third trade was Welsh coal shipped out of ports including Swansea, Cardiff, and Milford Haven. Welsh coal predominated in Cornwall and Devon and much of Somerset. For most of the industrial revolution, coal mines in the Forest of Dean and the vicinity of Bristol were price-takers and of only limited, local importance. The Somerset coal field southeast of Bristol was hemmed in by hilly terrain, which rendered it too expensive to compete nationally until canals were constructed that allowed the district to expand sales across south-central England.
The fourth trade involved midlands mines. In 1695, many of them were confined to local markets by the hilly terrain that surrounded them. Wagon transport of coal under these circumstances was too expensive for distant sales. One exception was mines immediately north of Nottingham, which found a market when sent by barge down the Trent. By the late eighteenth century, however, the geographic barriers that limited the marketing of midlands mines were being eliminated as canals were built. Initially, their impact was primarily local in that they linked up neighboring mining districts that had previously supplied only their immediate locales. The creation of a regional midlands market led to regional rationalization. Low-cost mines expanded their output, while high-cost mines contracted. In 1795, the Coventry Canal was extended to Oxford, and that threatened to flood the high-priced Thames Valley with cheap midlands coal. In the early nineteenth century, the Grand Junction Canal followed suit when it connected the Warwick coal field to the Thames at Brentford. Evidently, this competition did not materialize since the price gaps between the Midlands and the Thames Valley remained large in 1842. Why that was so is another problem to investigate.
As noted, canal construction also led to the emergence of a fifth region—Somerset. Coal had been mined near Radstock and Midsomer Norton since the Middle Ages, but production was limited since the terrain precluded distant sales. This barrier was eliminated with the construction of the Somerset Coal Canal and the Kennet & Avon Canal, which allowed coal to be shipped across Wiltshire to the Thames Valley.
THE ESTIMATION METHOD
A feature of the marketing channels just described is that coal traveled in only one direction—from the mine to the consumer. Nobody took coal to Newcastle. The methodology used here requires that the direction of movement be known since the procedure is based on the accounting that describes such a journey. We begin with the identity that the price paid by the consumer at the destination equals the price at the point of shipment plus the cost of shipping it to the destination. Next, we separate the cost of shipping into the costs incurred on each of the four possible transport modes. We also include the cost of the taxes assessed on all coal unloaded at Greenwich (here referred to as thames cost), as it was at times very high:
 $$\begin{gathered}
{\text{destination price = price at origin + sea cost + river cost + canal cost }} \\
{\text{ + land cost + thames cost}} \\
\end{gathered}$$
$$\begin{gathered}
{\text{destination price = price at origin + sea cost + river cost + canal cost }} \\
{\text{ + land cost + thames cost}} \\
\end{gathered}$$
This tautology is turned into an equation for empirical implementation by representing each travel cost as the product of the kilometers traversed and the corresponding charge per kilometer. It is initially assumed that the ton-km rates for each mode were the same everywhere in the country (although this assumption can be replaced by more complex parameterizations). The basic model becomes:
 \[\begin{gathered}{\text{destination price = constant + A*seakm + B*riverkm + C* canalkm }} \\
{\text{ + D*landkm + E*thames}} \\ \end{gathered} \]
\[\begin{gathered}{\text{destination price = constant + A*seakm + B*riverkm + C* canalkm }} \\
{\text{ + D*landkm + E*thames}} \\ \end{gathered} \]
A, B, C, and D are the costs per ton-kilometer of shipping for each transportation mode. E is the tax burden of unloading at Greenwich, and thames is a dummy variable equal to one for coal unloaded there. The constant represents the price at the point of initial shipment (often, but not necessarily, the point of production) and is estimated by the regression. In practice, there is a set of dummy variables representing various origins (Newcastle staiths, midland mines, Coalbrookdale, South Wales ports). Variables representing loading and unloading coal have also been included in some specifications since those costs were most likely independent of distance, but they were neither substantial nor statistically significant. These costs were subsumed in the ton-kilometer rates and the constants (Wanklyn Reference Wanklyn1996).
Like all prices, these ton-kilometer rates are determined by demand, cost of production, and market structure. In the long run, I assume that price equals unit cost in sea voyages, river voyages, and road haulage since these were competitive industries with many service providers, free entry, and constant costs. On the other hand, canals were large and not easily replicable in most of the country (Birmingham being a likely exception). Transport services were provided by shippers who operated the barges and paid tolls to the canal companies for the privilege. Canals companies could set tolls as they wished up to the maximum values specified in their enabling legislation. They generally charged high rates until the introduction of railways, whose competition forced them to drastically cut prices.
The equation is estimated for each of the three time periods. Each observation is a price plotted in Figures 2–4. For each of these prices, the source and the routing to the destination must be worked out. This is clear for most of the prices. The leading historians of the coal industry have given considerable attention to identifying the regions supplied by each of the major mining districts. Nef (Reference Nef1932, Vol. I facing p. 19, pp. 23–122), for instance, has produced a detailed map showing this for the end of the seventeenth century and explained it at length. Hatcher (Reference Hatcher1993, pp. 70–184, 459–507) and Flinn (Reference Flinn1984, pp. 5–35, 212–285) have even more extensive discussions in their histories of coal in the eighteenth century and in the Industrial Revolution. Most of the towns in my samples could be unambiguously located in one of the marketing zones identified by these authorities, and the towns were coded accordingly. For example, coal sold in London was supplied by mines in Durham and Northumberland, and the coal was shipped down the east coast of England by sea and unloaded at Greenwich. Towns up the Thames Valley as far as Oxford were usually supplied by shipping coal up the river from Greenwich. Other towns along the east coast and some of the South coast were also supplied by Newcastle. Welsh mines supplied southwest England for much of the period, and Coalbrookdale supplied the Severn Valley until it was displaced by midlands coal during the canal era. Coal from Derbyshire and Nottinghamshire was floated down the Trent to supply towns along the way as well as Lincoln via the Fossdyke Navigation.
Not only must the route be established, but the distances by the various transport modes must also be ascertained (Alvarez-Palau and Dunn Reference Alvarez-Palau and Dunn2019). Distances for sea voyages were taken from www.sea-distances.org. These distances were checked against direct measurements of the voyage length using OpenStreetMap and the measuring tool in QGIS.
The distances by interior waterway were measured from the port of transhipment (e.g., Greenwich) or the mine (e.g., Coalbrookdale) to a port of unloading (Satchell n.d.). These ports were generally market towns on the river or canal, like Reading or Bedford. There were 187 ports and 24 mines or mining districts in the data set. The distances along the canal or river from these points were ascertained from modern route descriptions and boating, canoeing, and walking guides.Footnote 4 In a few cases, distances were taken from Priestley (Reference Priestley1831). The QGIS measuring tool was used if other sources were lacking.
The road distances from the river and canal ports or the mine (in the case of land sales) were generally measured from the OpenStreetMap using the QGIS measuring tool. It was assumed that routing along A roads and minor roads in use today would give the same distances as would have been traveled between the 1690s and 1842 (Bogart Reference Bogart2005). The most direct route along these roads was measured. Some distances were also taken from motoring route planners when the route corresponded to the historical routing, including https://www.viamichelin.co.uk/web/Routes.
With the routes and the distances ascertained, the coding was straightforward. The journey from Newcastle to Greenwich, for instance, was entirely by sea, so seakm was in this case equal to 576 km, while riverkm, canalkm, and roadkm were all zero. Coal sold in Cambridge was also mined in Northumberland. In this case, the journey from Newcastle to Cambridge involved 330 km on the sea to King’s Lynn and then 73.5 km by river. Likewise, the coal priced in Newton Longville in 1842 was coded as having come 107 km on the Coventry and Grand Junction Canals from the Bedworth mine just north of Coventry plus 4.3 km by road from the canal landing. The distance variables were not collinear, so their coefficients (and hence the shipping costs for the four transport modes) could be accurately estimated.Footnote 5
STATISTICAL RESULTS
Table 1 displays the results of the simple specification. R2 ranges from .861 to .967. These are very high for cross-sectional data. This is important since it indicates a high degree of market integration. “Perfect” integration would mean that prices were exactly predicted by a regression of this sort since deviations from the regression, if correctly specified, indicate an unexploited chance to arbitrage a market.
BASIC REGRESSIONS OF COAL PRICES ON SHIPPING DISTANCES (T-RATIOS IN PARENTHESIS)

Note: The variables seakm, riverkm,and canalkm are distances by those transport modes, so their coefficients are rates per ton-km. Remaining variables are dummy variables indicating the source or transport route. Newcastle indicates Newcastle coastal shipments to London, Ndlocal indicates local sales of northeast coal and measures the difference between coastal sales and local sales, Severn and Swales indicate coal from Coalbrookdale and South Wales mines and indicates the prices at the pithead, and Thames indicates sales from Greenwich up the Thames and measures the effect of taxes and monopoly to those destinations.
Source: See text.
The regression coefficients are highly significant by the usual criteria. They indicate the implied cost per ton-km of moving coal by the various transport modes. Sea voyages were always the cheapest, and increasingly so, followed by river shipment, and then canal transport. Road haulage was always the most costly.
The figures in Table 1 presume that the cost of each transport mode was the same across the country. We can test this for rivers and canals by dividing them into groups. In the case of rivers, we can distinguish five systems: the Thames, the Severn, the Trent, the Ouse/Nene, and the remaining minor rivers. Not all rivers are observed in all time periods. We distinguish three canal systems: the Coventry and Grand Junction Canals (while separate companies, they shared a section of waterway), the Kennet & Avon and Somerset Coal Canals (the latter joined the Somerset coal field to the Kennet & Avon Canal), and the midland canals. The 1842 data set is the only one that contains all of these transport routes.
Table 2 summarizes the results for 1842. Dummy variables for the systems were interacted with riverkm and canalkm to allow measurement of the rates for each system. In the table, the interaction dummies for Severn River and the midland canals are excluded, so the coefficients of severnkm and midlandcanalkm measure the costs of those systems. The coefficient on severnkm is lower than in Table 1 (.016 versus .046 shillings per ton-km). The interaction dummy for the Thames system, dthameskm, is larger (.012) implying that the cost per kilometer of shipping coal on the Thames (.028) was greater than on the Severn (although the coefficient of dthameskm is not significantly different from zero.) The coefficients of the interaction dummies dousekm and dtrentkm are both larger and significant, implying that the cost per kilometer of sending coal on the Ouse/Nene system (.073) and the Trent (.109) were many times the cost on the Severn. The Severn shipments went down stream, which may explain why they were the cheapest. The Thames and Ouse/Nene shipments were upstream. The Trent shipments were also downstream, which raises the question of why they were so expensive.
REGRESSION ANALYSIS OF COAL PRICES IN 1842 (T-RATIOS IN PARENTHESIS)

Notes: The variables are the same as in Table 1, with the addition of interaction dummies for rivers and canals. dthameskm indicates the difference in the cost per ton-km between shipments along the Thames and the Severn, and likewise for the other rivers. dCandGJ indicates the difference between the Coventry and Grand Junction canal systems and the midland canals. Likewise for dKandAkm, which indicates the difference between shipping costs per ton-km on the Kennet & Avon Canal and the midland canals.
Source: See text.
The costs were also unequal across the various canal systems. The cost of shipping on the midlands canals (.077 shillings per ton-km, half the average cost on canals of .143 shillings shown in Table 1) was lower than on the others. The coefficients of the dummies for the Coventry-Grand Junction and Kennet & Avon-Somerset are .077 and .153 implying shipment costs on these canals of .154 shillings/ton-km and .230 shillings/ton-km, respectively.
We gain perspective on these estimates by comparing them to contemporary statements of the cost of shipping. Table 3 shows some comparative data. For some of these costs there are large numbers of contemporary quotations, and, of course, there is variation among them. The figures in the table are representative values.
SHIPPING COSTS AND FREIGHT RATES (SHILLINGS PER TON-KILOMETER)

Sources:
This study:
1695 and 1795-coefficients in Table 1
1842-coefficients in Table 2 except for the canal rate of .143 which is the canal coefficient in Table 1.
Literature Estimates
sea 1695–.013 is Hatcher (Reference Hatcher1993, p. 538), .027 = 19.81–4.34 (London “pool” price minus price at staithes–see text)
Sea 1795–Beveridge (Reference Beveridge1939, p. 295), average of 1794, 1795, 1796
sea 1842–Dunn (Reference Dunn1844, p. 89) and Harley (1988, p. 874)
river 1695–Willan (Reference Willan1938) and this text
rivers 1795–Allnutt (Reference Allnutt1810, p. 3), Mavor (Reference Mavor1809, p. 531), (Jackman Reference Jackman1966 pp. 724–5)
canals 1795–Jackman (Reference Jackman1966, pp. 724–6), Salt (Reference Salt1845, p. 71)
canals 1842–Maw (Reference Maw2013, pp. 76, 86)
road 1695–Alvarez-Palau et al. (Reference Alvarez-Palau, Dan Bogart, Satchell and Shaw-Taylor2020, p. 15) referencing Gerhold (2005)
road 1795–Jackman (Reference Jackman1966, pp. 720–1)
road 1842–Jackman (Reference Jackman1966, pp. 720–1)
The costs per kilometer of shipping by sea and the corresponding regression coefficients are close in 1795 and 1842 (Ville Reference Ville1981). There is a substantial discrepancy in 1695, however. The commonly cited rate from Newcastle to Greenwich of 6 shillings per London Chaldron implies a shipping cost of only .008 shillings/ton-km. This figure is not credible. Hatcher (Reference Hatcher1993, pp. 537–8) has combined it with contemporary estimates of port charges and taxes to see if they are large enough to account for the difference in price between Newcastle and London. They are not. Adding Hatcher’s higher value for the price of coal on the staiths (4.34 shillings per ton), which is in line with the regression, to the total of freight, taxes, and charges gives a cost of delivering coal to the “London pool” of 16.29 shillings per ton. The average value of prices paid by Westminster College for coal in the “pool” for the years reported between 1691 and 1701 was 19.81 shillings (Rogers Reference Rogers1887). The regression predicts the price to have been 20.78 shillings—a closer match. Freight and port charges must have been higher than the contemporary accounting allowed. While this issue needs further investigation, the regression with its implicitly higher shipping costs gives a better overview of the situation.
Costs of shipping by river are available for some routes in 1695 and 1795, although not for 1842. Willan (Reference Willan1938, p. 121) proffered the generalization that river costs came to one pence per ton-mile at the end of the seventeenth century, which equates to .05 shillings per ton-km. Willan cites charges on the Ouse from King’s Lynn to St Ives and Bedford that range from .032 to .049 shillings per ton-km in the period 1696–1705. These figures are in line with the coefficient of .04.
More figures are available for the end of the eighteenth century. Allnutt (Reference Allnutt1810, p. 3) and Mavor (Reference Mavor1809, p. 531) report costs on the Thames. Mavor shows the cost for upstream shipments (the relevant direction for coal) over segments as far as Lechlade. For journeys from London to Oxford and towns in between, the rate was .12–.13 shillings per ton-km. .3 shillings per ton-km was charged on the stretch from Oxford to Lechlade. The charge on the Trent was .1 shillings per ton-km, and the River Wey Navigation was .14 shillings (Jackman Reference Jackman1966, pp. 724–5). These figures are marginally greater than the regression coefficient that puts the cost at .101 shillings per ton-km.
Canals were an important transport mode in the midlands by 1795, but there are insufficient coal price observations in my data set to estimate the ton-kilometer rate on canals for that period. However, Table 3 reports a figure derived from commercial reporting for the cost of shipping by canal for c. 1795 as well as estimates from commercial sources for 1842 and the corresponding regression coefficients. An important feature of canal costs in 1842 was the substantial regional difference: costs were much lower in the midlands than in the South. This is shown by both the estimates taken from commercial sources and the regression coefficients. The two sources agree on the cost of using the Kennet & Avon Canal in 1842, but the regression estimate of midlands costs is lower than the estimate derived from commercial records. However, the average canal rate shown in Table 1 is in accordance with these estimates.
All in all, the regression estimates for water transportation costs are consistent with directly observed charges, which add nuance and provide context for those sources. In contrast, the regression coefficients for shipment by road are only about half as large as the charges gleaned from carrier records. The most likely explanation is differences in the cargoes involved. The regression coefficients apply to coal shipments. In most cases, the carrier charges apply to goods that are easier to damage—sugar, cloth, porcelain, hardware, etc. (e.g., Gerhold 2005, pp. 187–90). Unlike coal, such goods had to be handled more carefully and protected from the elements, so it cost more to ship them (Jackman Reference Jackman1966, pp. 724–9, 731–5).
The cost differences between the canal systems probably reflect differences in the competitive environments. By 1842, there were many interconnected canals in the midlands offering a selection of routes between origin and destination, implying competition between canal companies. There was also a high volume of traffic that spread fixed costs. These features were conducive to low shipping costs. In contrast, the Coventry-Grand Junction and Kennet & Avon-Somerset Canals were long-distance, interregional carriers. The only competition they faced was from wagon carriage, which returned a cost of .184 shillings per ton-km. The long-distance canals may have priced their services so that they were competitive with high-cost wagon haulers rather than with low-cost canals, as in the midlands.
Finally, the intercepts in the regression in Tables 1 and 2 indicate the cost of coal at the place of origin for the midlands. Coefficients on dummy variables for other regions are differences from the midlands cost. In Table 3 in the case of Newcastle, there are two dummies—the variable Newcastle denotes all coal sources on the Northeast coast, while NDlocal indicates pithead sources and distinguishes them from prices at the staiths. With this setup, the coefficient of Newcastle plus the intercept indicates the price at the staiths (11.755=7.692+4.063 shillings), and NDlocal tests whether it was different from the price at the pithead (5.163=11.755–6.592 shillings). The significance of such a difference will be discussed in the next section. In these figures, Welsh coal was always more expensive than English coal at the source; however, the Welsh coal was quoted at ports, which thus includes transport costs from the mine to the port as well as mining costs. Other than Newcastle, this was not the case for English prices. Differences among the English districts were rarely significant. The English coefficients do record one important development, however. That was the declining competitive position of Coalbrookdale, which went from being one of the cheapest mining districts in 1695 to the most expensive in 1842.
MONOPOLY AND TAXATION IN THE COAL TRADE
An important issue in the history of the coal trade is monopoly (Hausman Reference Hausman1977, 1984). The issue arises regarding the northeast coast coal trade, which supplied London with fuel. The situation was not the same throughout the period.
The history of the trade makes it unlikely that monopolization raised prices in c. 1695. Attempts to do this were made by mine owners early in the seventeenth century and by wholesalers in Newcastle towards the end, but none were successful. On the other hand, there was a Committee of Lightermen that united all of the lighters that unloaded coal in Greenwich at the end of the seventeenth century. The Lightermen used their power to push down the price of coal paid to the owners of coastal ships (Nef Reference Nef1932, II, pp. 86–7). In 1730, the City of London modified the Lightermen’s charter to limit their powers of control, rendering their collusion impossible (Flinn Reference Flinn1984, p. 276). Perhaps this monopsony power lowered prices in London?
Industrial organization was dramatically different by the end of the eighteenth century. In 1770, mine owners along the Tyne and the Wear entered into a cartel agreement known as the Limitation of the Vend to restrict output and raise coal prices in London. This agreement continued for decades, with lapses, and was in force in 1842, although it was about to meet its end due to competition from railways. Around 1800, the organization included about 100 owners or lessors of 33 mines along the Tyne and 30 owners or lessors of 17 mines along the Wear (Sweezy Reference Sweezy1938, p. 57). This was most of the industry and may have had the power to make money by raising prices.
Another entity with the power to make money by raising prices was the state. It could accomplish this through taxation. The largest tax was a national tax on coal. It was first enacted in 1695 and then repealed in 1696. Since it was only in effect from 20 September 1695 to 17 May 1696—that is, over the winter when little coal was shipped—it had no significant impact on the market and does not register in the prices (Hausman 1981, pp. 126–9). The tax was re-enacted in an altered form in 1698 at the rate of 5 shillings per London chaldron, or about 3.8 shillings per ton. Prices showed no upward movement until 1702, which may be when tax collection was large enough to affect the market. The tax remained in effect until 1831 and was raised many times during this period. In the 1790s, the tax came to about 6.3 shillings per ton (Beveridge Reference Beveridge1939, p. 269). The 1694 act taxed any coal shipped on inland rivers as well as by sea, while the second applied to coal shipped by sea and delivered to English ports. At the outset, these taxes were imposed across the country (Nef Reference Nef1932, II, pp. 312–14). The statistical findings raise the possibility that collection lapsed outside of London.
We can measure the effect of Tyne and Wear mine owners in raising prices by taking advantage of an important feature of their practice, namely, that they only sought to raise prices on sales to London. They did not try to restrict production or raise prices on exports or on local sales. As a result, the price at the staiths for coal destined for London was higher than the price of land sales at the pithead. We can assess that difference by including a dummy variable in the regressions designating pithead prices in Durham and Northumberland, as was done in Tables 1 and 2. This specification effectively removes these pithead prices from the regression, and the regression constant takes on the value that is consistent with prices at destinations down the coast. The constant is an estimate of the price at the staiths in Newcastle.
The regression for 1695 in Table 1 certainly supports the view that mine owners were ineffective in raising the price to London consumers. The estimated price at the staiths is 3.819 (=4.154–.335) shillings per ton. The coefficient on NDlocal, the dummy variable, indicates that local sales of coal in the region cost less than coal shipped to London by 1.078 shillings per ton. This is not large in comparison to either later values or the price of coal in London, and it is, in any event, not statistically significant. The coefficient of the dummy variable indicating the thames is –2.044. This is on the border of significance. While this variable was introduced to measure the size of London-specific taxes, it captures anything that differentiates London from other ports served by Newcastle. While it is tempting to interpret it as a measure of the success of the cartel of lightermen in pushing down the price of shipping on the east coast, it is more likely an indicator of the superior efficiency of the port of London due to its much higher volume of traffic.
The regressions for c. 1795 and 1842 provide compelling evidence of the power of the Vend. The regression for 1795 puts the price of coal at the staiths at 7.991 (=6.998+.993) shillings per ton. Some corroboration of this figure comes from the Greenwich Hospital accounts. Beveridge (Reference Beveridge1939, p. 271) reports a 1799 price of 8.62 shillings. The price of coal at the mine was only 4.807 =(7.991-3.184) shillings. The mines were making an extra 3.184 shillings on every ton sent to London.Footnote 6
They made even more in 1842. The regression in Table 2 implies a price at the staiths of 11.755 (=7.692+4.063 shillings) and a price at the mine of 5.163 (=11.755–6.592). This represents a substantial monopoly profit of 8.54 shillings per ton. The price at the staiths receives some confirmation from Dunn (Reference Dunn1844, p. 89), who reports that the price in 1836 was 10.8 shillings at the staith.
It was not only the monopoly that was gouging London purchasers of coal. The state played a role as well. The coefficient on the thames dummy in 1795 was 7.256 shillings per ton. At the time, taxes on coal came to the same amount (7.02 shillings), according to Beveridge (Reference Beveridge1939, p. 271). What the regression is picking up is the difference between London costs and costs in other ports serviced from Newcastle. This would imply that the taxes on coal collected in London were not being assessed in other ports. This interpretation receives some support from the regression of 1842. In 1831, the taxes on coal were abolished, and this change is reflected in the coefficient of the thames dummy, which drops effectively to zero.
THE INTEGRATION OF MARKETS AND THE EXPLANATION OF THE GEOGRAPHICAL PATTERN OF PRICES
The analysis of market integration and explaining the geographical pattern of prices are two sides of the same coin. Markets are integrated when it is impossible to make money by diverting coal from one market to another. When diversion is not profitable, the price in a potential diversion market is equal to or less than the price in the source market plus the cost of the shipment. Greater distance allows larger equilibrium price gaps when transport costs increase with distance. Our regression models are attempts to capture that relationship. If they are successful, then they fully explain the price pattern.
A test of this success is the R2 of the regression. R2’s for the regressions reported here are very high for cross-sectional regressions. Those for 1695 and 1795 are .948 and .967, respectively. Both of the 1842 regressions have an R2 greater than .85. These equations do a good job of reducing geographical price patterns to distances and transport rates. The regressions, therefore, indicate a high degree of market integration.
By the same token, the regressions explain the geographical pattern of prices; the patterns we observe in Figures 2–4 are predicted by the models. To see the full implications of the regressions for the geographical pattern of coal marketing, the GIS map of England has been overlaid with a grid of points at 5 km intervals, and the predicted prices have been computed for each point. There are 5,221 points.
The predicted prices were worked out in stages. First, depending on the year, England was divided into eight to ten mining supply regions. The following districts were distinguished in all time periods: Thames Valley, the Ouse/Nene rivers supplied by northeastern mines by sea, other minor ports supplied by sea from the Tyne and Wear, land sales from mines in the Tyne and Wear, land sales from midland mines, coal distributed along the Trent River, Coalbrookdale coal delivered by the Severn and its tributaries, and deliveries of South Wales coal by sea. In 1795 and 1842, sales by points on midlands canals were identified. Somerset coal sales were also identified in 1842.
Second, a list was prepared for each regional mining system showing towns on the system that were potential wholesale delivery points. The wholesale points selected were all either mines that could supply consumers directly or towns that were supplied by mines along water routes (sea, river, or canal). There was no land segment in the transportation link from the mine to these potential wholesale centers. The towns were, in most cases, market towns spaced 15–25 kilometers apart along the river and canal network. The sea, river, and canal distances between each wholesale point and the mine that supplied it were ascertained. Then the straight line distance from each consumption point defined by the 5 km grid to the nearest wholesale point in each of the eight to ten supply systems was computed. The cost of supplying each grid point from each source was then calculated using the regressions reported earlier,Footnote 7 and the least-cost supply system for each of the 5,221 consumption points was determined.
Heat maps of the delivered cost of coal show the impact of transport costs on regional competition. The patterns are broadly similar in all years, and I focus here on the pattern for 1795 shown in Figure 5. The lowest prices were on the Northumberland-Durham coal field, the midlands coal fields, and Coalbrookdale in the upper Severn Valley. The highest prices were in the south-central parts of the country. It is instructive to follow some routes in detail. King’s Lynn on the Wash was a landing point for Newcastle coal, and the price was relatively low. Going west, prices gradually rose to a peak along a moderate north-south price ridge, where the increase was checked by midlands coal shipped east from Coventry. Approaching the price ridge from Coventry also shows a gradual increase, and the increase from that direction was checked by Newcastle coal, once its delivered price dropped below that of coal from Coventry. Likewise, going southwest from King’s Lynn, prices rose gradually to a peak in the Chilterns and the upper Thames Valley. Prices were relatively low at Greenwich and rose gradually going up the Thames. Indeed, ports on the coast where coal was landed all had low prices, and prices increased going inland. This was true in East Anglia, for instance, with low prices at Yarmouth and higher prices at Norwich, and at Ipswich and Rochester. The price at Southampton was higher than the prices at east coast ports due to the longer voyage from Newcastle, but the price increase going inland was similar. Ports on both the north and south coasts of Cornwall and Devon were supplied from Wales and had low prices that increased going inland. The predicted patterns conform to the actual price data plotted in Figures 2–4 since the R2 of the regression model is so high.
DELIVERED PRICE OF COAL, 1795 SHILLINGS PER TON
Note: The darker the gray, the higher the price.
Source: See text.

MARKETING REGIONS
We saw in Figure 5 that boundaries are implicit between regions supplied by different mining districts. We can make these differences explicit by identifying the cheapest source of supply for each point in the 5-kilometer grid of points laid across England and color-coding the results. These coal supply regions are shown in Figures 5–8.
COAL SUPPLY REGIONS, 1695
Source: See text.

COAL SUPPLY REGIONS, 1795
Source: See text.
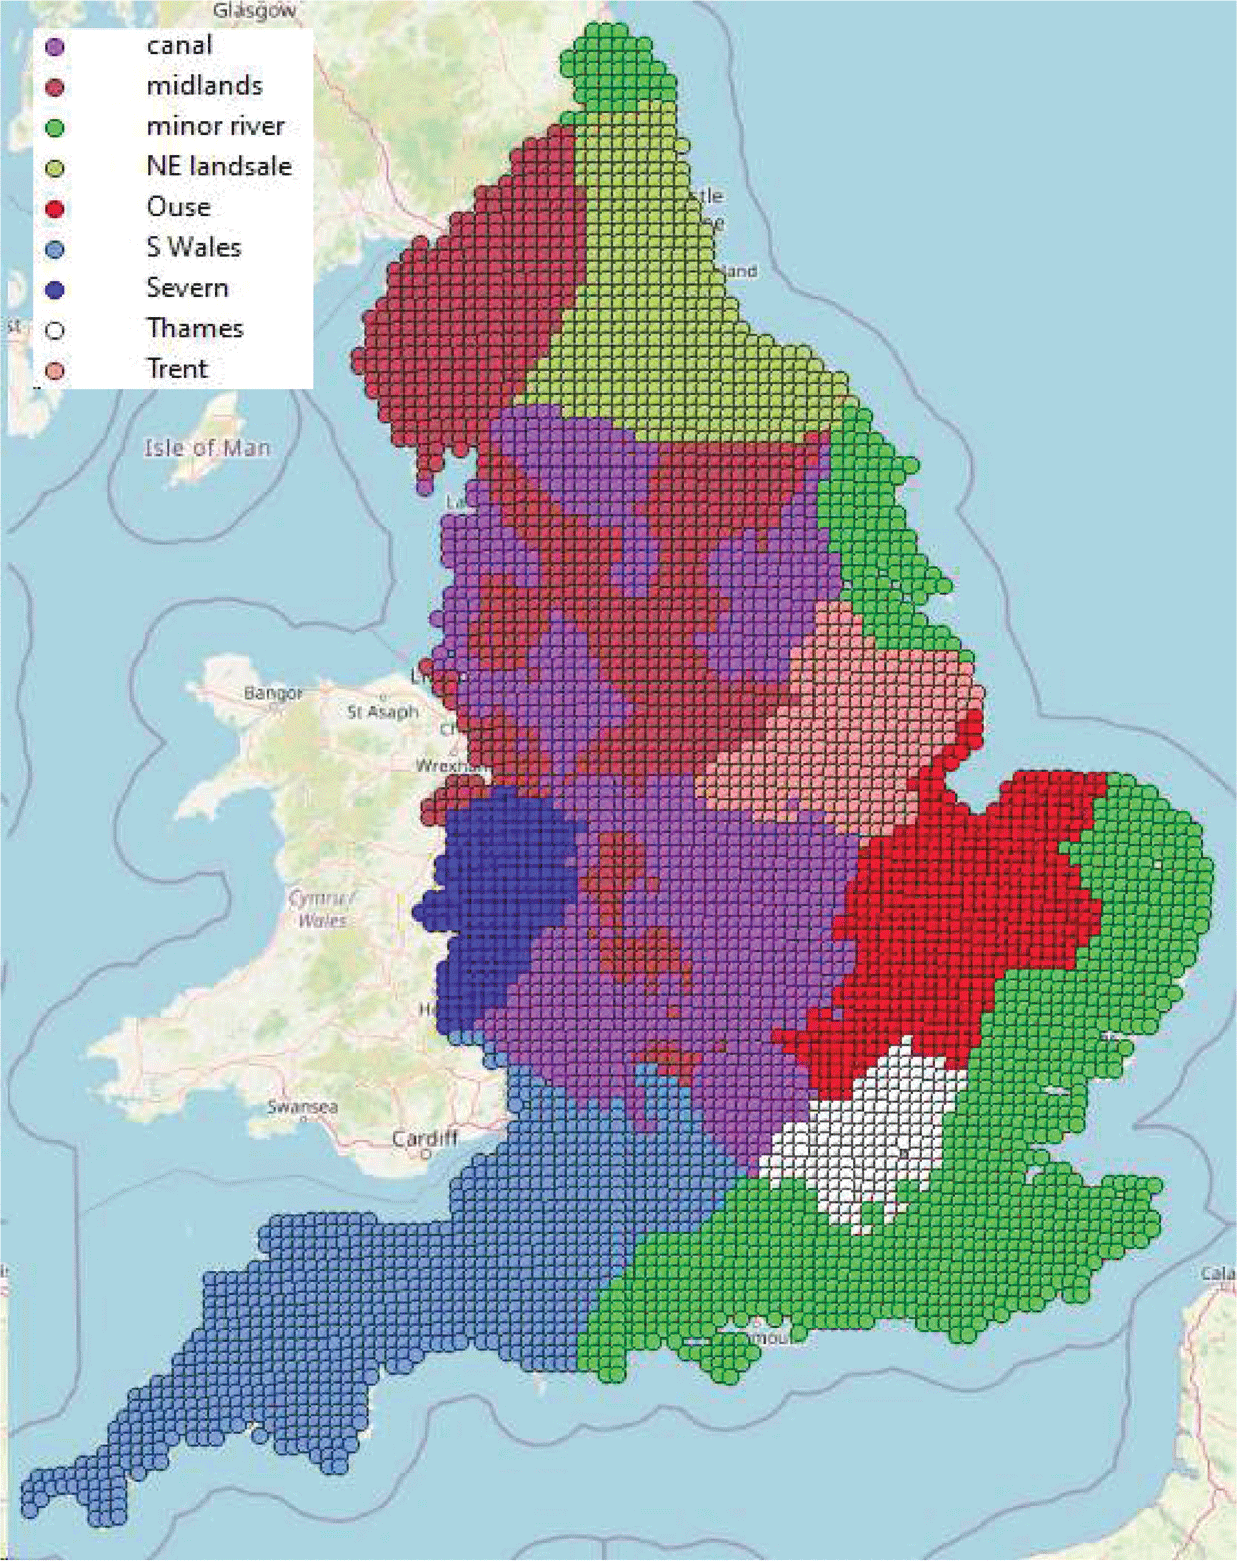
COAL SUPPLY REGIONS, 1842
Source: See text.

Figure 6 shows the situation in 1695. The major coal trades stand out. Newcastle was the source of coal for the east and south of England. Land sales from Newcastle and Durham mines supplied large adjoining areas. The sea trade from Newcastle was of immense importance. The regions colored as Thames, Ouse, and minor ports were all supplied from the northeast coast. Shipments from Welsh ports supplied southwest England. Sales of Coalbrookdale coal down the Severn and Nottingham coal down the Trent are also highlighted. The midlands were supplied by mines in the region through delivery by wagon. Figure 6 is familiar, for it corresponds to the descriptions of coal marketing at the end of the seventeenth century given by Nef (Reference Nef1932) and Hatcher (Reference Hatcher1993).
There were changes over the Industrial Revolution, but they were less dramatic than one might imagine in view of the boom in canal building that was underway (Figure 7). The only notable change to the regional marketing pattern was due to the Shropshire and Worcestershire Canal, which connected the Black Country to the Severn at Stourport. This allowed midlands coal to compete on the Severn with coal from Coalbrookdale. Towns like Dudley were marginally closer by water to Stourport than Coalbrookdale. The upshot was that Staffordshire coal from the Dudley area displaced Shropshire coal from Coalbrookdale below Stourport.
One new canal that had seemingly little effect was the Oxford canal, which linked the mines immediately north of Coventry to the Thames at Oxford. Northeast coal producers had objected to the construction of that canal since it threatened their competitive position in the Thames Valley and forced the inclusion of a clause in the authorizing legislation that prohibited the shipment of coal downstream from Oxford (Flinn Reference Flinn1984, p. 186). Had this clause not been enacted and had the northeast mines maintained their discriminatory pricing system, Warwickshire coal might have been the cheaper choice as far down the Thames as Richmond.Footnote 8 How the mine owners would have reacted is not certain since London would have remained in the northeast coal marketing area, and it was by far the biggest market. While the northeast producers could have cut the price on shipments to Greenwich to preserve their market in the Thames Valley, they might, instead, have sacrificed that market in exchange for the continued exploitation of London.
Another canal that had less effect than might have been expected was the Thames & Severn Canal, which was completed in 1789. It connected the Severn via the Stroud Navigation to the Thames at Lechlade. Coal from the Black Country could be sent to the Thames over this system. Mavor (Reference Mavor1809, p. 434), however, reports that coal from this canal was also prohibited from being shipped down the Thames to London. At the time Mavor wrote, the Wilts & Berks Canal, which linked the Kennet & Avon Canal to the Thames at Abingdon, had apparently also opened, for he reports that Newcastle coal was shipped upriver as far as Wallingford and Abingdon, where it competed with Somerset coal and Staffordshire coal.Footnote 9 Despite the legal prohibitions, Flinn (Reference Flinn1984, p. 187) quotes a contemporary source of 1804 that claimed “from Staffordshire immense quantities [of coal] are brought down the canals and smuggled into London where they can be bought and sold at a much cheaper rate than the sea coals, no duty being paid of them—they have now got to such a pitch of hardihood that they publicly advertise them.”
Most of the canals built before 1795 were in the midlands. It was cheaper to ship coal by canal than by wagon, and the principal effect was to replace wagon cartage with canal shipments within the region. By linking up midlands mines and consumers, the canals created a regional market with uniform prices. Low-cost mines expanded, and high-cost mines contracted their production. This lowered fuel costs in the midlands and, in that way, made a contribution to industrial development (Maw, Wyke, and Kidd Reference Maw, Wyke and Kidd2009; Maw Reference Maw2013). They did not, however, greatly change the regional market patterns established by 1695 (Turnbull Reference Turnbull1987, figure 6).
Figure 8 shows the marketing regions in 1842. The area serviced by canals had expanded by displacing wagon haulage from mines in the midlands. Otherwise, the pattern remained much as before.Footnote 10 The main exception to that generalization was in the southwest, where the Somerset Coal Canal and the Kennet & Avon Canal broke the transportation cost barrier that had prevented long-distance sales from the Somerset coal field. By 1842, it had expanded sales eastward, almost to Marlborough.
Another potentially destabilizing development that came to naught was the Grand Junction Canal, which connected the midlands to the Thames at Brentford. While there was much trade in manufactured goods, there was little trade in coal. The Northeast coal producers had again used their political influence to check the possibility. The parliamentary act authorizing the Grand Junction Canal limited its coal shipments to the Thames to 50 thousand tons per year (Flinn Reference Flinn1984, p. 187)—an inconsequential amount compared to the two million plus tons shipped to London by sea (Flinn Reference Flinn1984, p. 218).
One might have expected the legal prohibitions on shipping coal to London by canal to have led to marked discontinuities in the price of coal on either side of Oxford and on the Grand Junction Canal. This, however, was not the case. According to the regression in Table 2, it cost 27.4 shillings per ton to supply Oxford with coal from the Warwickshire field and 28.7 shillings with Newcastle coal sent up the Thames from Greenwich. Places on the Grand Junction Canal could have been supplied either by shipping coal from the midlands or from Newcastle via Greenwich. In fact, the point on the canal where the two directions are equal in cost was the Apsley Lock Footbridge. This is adjacent to Hemel Hempstead, which is almost—but not quite—in London.
The obvious explanation for this pattern is that the prohibitions on sales to London lead the canal owners and the shippers to contrive to raise costs as much as possible without creating an incentive for shippers in London to send coal north of the prohibition points. The prohibitions on sales to London, in other words, led to the high costs of shipping coal on the canals that might have supplied London cheaply.Footnote 11
PRODUCTIVITY GROWTH
Canals revolutionized transportation in the midlands, and the decline in freight rates, some of them dramatic, on sea, river, and land transportation systems suggest that improvement was widespread. The question is: how much did productivity in coal haulage increase during the Industrial Revolution, and what was the contribution of the various improvements to that growth?
Answering these questions requires us to combine two types of investigation since transport efficiency increased in two ways. First, the efficiency of each mode of transport—sea, river, land—grew over time. Measurement begins with the observation that rates were falling between 1695 and 1842. They could fall either because productivity increased or because the prices of inputs used in the activity were decreasing. The standard approach is to index the input prices and see how much of the rate change they would have predicted. A change in a transportation rate beyond that implied by the changes in input prices is a measure of productivity growth.
The second source of productivity growth was the increased use of canals. We have seen that their impact was confined to the midlands and southwest England. In the main, canals substituted for wagon haulage. The effect of a change like this is best measured as the social savings of the canal. The social saving was the money saved by shipping the coal by canal rather than by wagon. We make this calculation with data for ca. 1842. This calculation is like the procedure to measure the growth of productivity over time in that it uses the fall in the cost of transport as the measure of productivity growth. No adjustment for input price changes is necessary in this case; however, since the cost is measured in a single year, input prices did not change.
Table 4 presents the information needed to measure productivity growth in each mode over time. The freight rates are shown for 1695, 1795, and 1842. The table also shows indices of the prices of inputs used in the transport sector. The choice of inputs and their weights vary from mode to mode and are intended to be roughly in line with the cost structure (see Online Appendix 2 for details). In that way, the input price indices indicate how costs would have changed had efficiency stayed the same.
TFP ESTIMATES,1695–1842

Source:
Transfer cost s./ton-km from Tables 1, 2, and 3.
Input price indices: Online Appendix 2.
Transfer cost in 1842 prices:
for sea in 1695: .0637 = .0295 * 2.16 likewise for river and road
for sea in 1795: .034 = .025 * 2.16/1.58 likewise for river and road
Total factor productivity:
for sea in 1742: 3.75 = .0637/.017 and likewise for other modes and years
Total factor productivity growth rates:
for sea in 1695–1842 .9% from annualized growth factor of 1.09 = 3.75^(1/147) and likewise for other modes and years
There are several equivalent ways of arranging the calculation to extract productivity from these data. In this case, I inflate the transport cost rates from 1695 and 1795 to the 1842 levels using the appropriate input price index for each mode. The ratio of the inflated 1695 price of road travel relative to its actual 1842 value equals the proportional increase in productivity in road transport over this period. For instance, the actual cost of road travel in 1695 was .225 shillings per ton-km according to the regression coefficient. Inflation in the cost of inputs in road travel between 1695 and 1842 was 96 percent, implying that the 1695 cost of road transport in 1842 prices was .441 = .225*1.96 shillings per ton-km. In 1842, road transport actually cost .184 shillings per ton-km. Real costs fell to 42 percent (=.184/.441) of their earlier value. That, in turn, means that productivity had increased by 140 percent since 2.40 = .441/.184. Turnpike roads and better wagons had a big pay-off. Sea, river, and road all showed big increases in efficiency.
The rates of productivity growth are comparable to those in previous studies, although there are many differences in detail. River transport has not been the focus of research to measure productivity with indices like those in Table 4. There is, however, a long tradition of measuring productivity growth in coastal shipping by deflating the London-Newcastle price gap (Ville 1986, 1987; Hausman 1987). Ville found a broad range of possibilities ranging from .1 to .8 percent per year. Hausman (1987, p. 591) computed growth rates of .1–.3 percent per year for 1691–1860, depending on what is assumed about war and peace. Most recently, Bogart et al. (2021) used a primal approach and found that productivity grew at a rate of .37 percent –.6 percent per year from 1700 to 1830, depending on whether peacetime or wartime prices were used for 1700.Footnote 12 These rates are less than my estimate of .9 percent per year from 1695–1842. So far as road transportation is concerned, Gerhold (Reference Gerhold1996, p. 494) estimated that productivity in freight carriage increased at a rate of .8 percent per year from 1693 to 1838. This is twice my estimate of .4 percent per year, but Gerhold’s indices are based on rates for much more valuable cargo than coal, so it is not clear how comparable the results are. Alvarez-Palau et al. (2017, p. 31) estimated productivity growth in all freight transport combined between 1680 and 1830 at the rate of .94 percent per year. This is more than my estimate for the coal transport system (to be established in the next section) of .7 percent per year from 1695 to 1842. The freight rates used by Alvarez-Palau et al. were the output of a network model of British transport, rather than observed data, so comparability is again an issue.
Canal Costs, Profits, and Social Savings
What of canals? We focus on 1842 and undertake a Fogel/Fishlow-style “strategic bombing” analysis (Fogel Reference Fogel1964; Fishlow Reference Fishlow1965), in which we imagine the 1842 canal system to have vanished and ask how much more it would have cost to ship what the canals had actually shipped by the next best alternative.Footnote 13 In this case, that alternative was generally wagon transport, and we proceed on this premise.
To perform the exercise, we must know how much coal was shipped by canal in 1842. There are no comprehensive statistics to answer this question. Table 5 embodies rough estimates. They are based on Flinn’s (1984, pp. 26–7) reconstruction of the regional pattern of production for 1830 and comparisons with the patterns in 1815 and 1800. A regional approach was taken since the impact of canals was confined to the midlands and to parts of England supplied by the Somerset coal field. Coal from the great Durham/ Northumberland coal field was not distributed by a canal, and that was a substantial proportion of English consumption. It was assumed that approximately half of the production in midlands counties in 1800 was already shipped by canal. The rest was carried by wagons. In 1830, it was assumed that wagon haulage had changed little, and the increase was conveyed by canal. The 1830 production and shipment structure was applied to 1842.
PRODUCTIVITY GROWTH IN COAL TRANSPORT, 1695–1842

Notes:
The shipment rates for “Northeast to Thames Valley” and “Northeast to other ports” are averages of the sea rate and the river rate reflecting the distances involved.
In 1795 and 1695, the coal that was shipped by canal in 1842 is assumed to have been shipped at the wagon rate of the day.
Source: See text.
The length of the various segments must also be specified. The lengths of sea voyages have already been ascertained. The lengths of river shipments are set to approximately half of the length of the river. All water-born coal is assumed to have been carried a further 15 kilometers, on average, to its final destination by wagon. The “land sales” of mines, that is, their local sales, are also assumed to have been carted 15 kilometers. Canal shipments are set at 24 km—the average length of a shipment in my sample of 23 canals in 1838.
The cost of conveying coal in 1842 is the sum of the cost of each shipment type detailed in Table 5. Those costs equal ton-kms shipped on the route multiplied by the corresponding rate.Footnote 14 This total came to £6.917 million (138 million shillings).
Before calculating how much this cost would have increased in the absence of canals, we must face a delicate point regarding costs and prices. The key question is how cost changed.Footnote 15 When we do the social savings calculation (and, indeed, a productivity growth calculation) and we adjust the price of the service for changes in input prices, we are implicitly assuming that the price equaled the cost. That is generally reasonable for competitive industries since competition among firms leads to that equality. Since many shippers operated on the sea, the rivers, and the roads, competition sounds like a plausible assumption for those transport modes. However, that was not necessarily the case with canals, and, indeed, we have argued that canal prices may have been set to equal wagon haulage prices rather than costs. Good evidence that prices exceeded costs is the reaction of canals to railway competition in the 1840s. The railways could move freight for as little as 1.5 pence per ton-mile (.075 shillings/t-km), which was much less than it cost to ship by canal (Bogart 2014, table 13.2). To preserve their business, canals had to cut their rates drastically. What is important is that some did so and survived. They could operate and maintain the canals for decades, while receiving less revenue. These lower rates indicate the cost of canal services rather than the inflated rates that the canal companies demanded before rail competition.
Another conceptual issue is whether operating costs or total costs (operating costs plus the cost of capital) should be used. We can think of total cost as “long run marginal cost,” and it is often the right choice, but, in this case, it is not: once a canal was built, it became part of the landscape, and the investment could not be redeployed. As long as the canal was maintained, it would last indefinitely (as many have). So I focus on operating costs, which include maintenance costs.
In 1870, Parliament published the results of a survey of the finances of canal companies at 10-year intervals from 1828 to 1868.Footnote 16 The survey includes information on invested capital, total revenues earned, total tonnage conveyed, and dividends and interest paid on the shares and debentures. Total operating costs can be computed as revenues minus dividends and interest paid. I analyze the returns for 23 major canals (Table 6).
DETAILS OF CANALS OPERATING IN 1838

Source: Return from All Inland Navigation and Canal Companies in England and Wales, UK House of Commons Paper (1870), LVI.
One important piece of information is lacking in the report: the average length of a shipment. This is necessary to put revenues and costs on a “per ton-km” basis, which we need to compute social savings. If we knew the freight rate, we could calculate the average distance shipped from the equation:
 $$\text{ total revenue = freight rate *total tonnage shipped * average distance. }$$
I estimate the freight rate from the regression coefficients in Table 2. These coefficients are “c.i.f” rates and represent the total cost paid by the purchaser of the coal. This includes the income of both the canal companies, which owned and maintained the canals, and the shipping companies that operated barges on the canals and paid tolls to the canal companies. The income of the canal companies covered the cost of operating and maintaining the canals and the dividends paid to their shareholders. The latter were often extremely large sums. On the other hand, the cost of operating barges was about half a pence per ton-mile or .025 shillings/ton-km (Jackman Reference Jackman1966, p. 440). Subtracting that sum from the regression coefficients gives the revenue per kilometer received by the canal companies. This figure gives us a basis for computing canal revenues and operating costs per ton-kilometer. Tables 6 and 7 show the results for 1838 and 1868.
DETAILS OF CANALS OPERATING IN 1868

Source: Same as Table 6.
How plausible are the calculated distances? The estimated distance averaged just over half of the length of the canal, which sounds reasonable. In three cases, however, the calculated distance was greater than the canal length by a small margin. It is significant that the canals where this occurred were short. The Droitwich Canal was 6 miles long, and it linked Droitwich to the Severn River. Its purpose was to bring coal from the Severn to the town and to take salt made in the town to the Severn. Both cargos went the full length of the canal and were shipped at the same rate (Priestley Reference Priestley1831, pp. 204–5). The computed average journey length was 6.16 miles. The situation was similar on the Stourbridge Navigation. This canal was a connector that linked the canals around Birmingham to the Staffordshire & Worcestershire Canal which connected to the Severn River. Again, most freight must have gone the full distance. The canal was 7.2 miles long, and the calculated length was 8.6 miles. Likewise, the Aberdale Canal was 6.5 km long, while the calculated distance was 7.05 miles. That the calculated distances work out close to the actual length provides some reassurance that the procedure is sound. In these cases, where the calculated distance was greater than the canal length, the latter was taken to be the average distance that the freight was conveyed.
Revenues, costs, and profits can be calculated for 23 canal companies in 1838, and 18 of those same companies in 1868 (Tables 6 and 7).Footnote 17 These were years just before and just after railway competition became intense. In 1838, all but one of the canals had revenues that were greater than operating costs. There were big differences in performance, however. Six midlands canals were profitable in both periods, and five southern canals were unprofitable throughout. The remaining canals present a mixed picture, with most being profitable in 1838, while only the two Welsh canals were still profitable in 1868. Five canals were unprofitable, and the profitability of the remaining canals is unknown since they had been purchased by railways, and separate accounts were not reported in the Return (Ward Reference Ward1974).
Railway competition had affected both revenues and costs. To meet railway competition, a canal would have to set a toll of less than .05 shillings per ton-km since adding on the shipper’s charge of .025 s/t-km gives a price to the buyer equal to the cost of shipping by rail. Only a few canals in 1838 set tolls that low. Many canals in the midlands had low enough operating costs in 1838 that they could have set tariffs low enough to compete with railways, while many of the southern canals had costs that were too high. It is notable that in 1868, most canals had cut their tolls to levels that were competitive with railways when the shipper’s charge was added to them. Most canals had also cut their operating costs. The canals that achieved high-profit rates had maintained or expanded the ton-miles of freight they carried, while those that saw big drops in ton-miles realized low returns.
The performance of the canals in 1868 has important implications for the calculation of social savings. Most canals in the south as well as the midlands had reduced their operating costs to less than .02 shillings per ton-kilometer. This made them competitive with railways, and most of the canals in the tables that reached this level are still in operation today, so it supported a substantial enough maintenance program to preserve the capital assets. Adding on the .025 shill/t-km to cover the shipper’s costs implies a cost of canal transport of .045 shillings per ton-kilometer, and that is the value to use in computing the social savings of the canals.
Setting the total canal cost at .045 shillings/t-km implies that the cost of shipping coal drops to £5.936 million (119 million shillings) in 1842 instead of £6.917 million using the price charged. To compute social savings, we must recompute the cost by pricing canal shipments at the wagon rate of .198 shillings per ton-km. This raises transport costs to £7.659 million (153 million shillings). The social savings of the canal were £1.723 million. Canals had raised the efficiency of the transport system for coal by 29 percent (1.723/5.936).
We now extend our calculations by asking how much the cost of shipping coal would have increased had the efficiency of sea, river, and road travel been reduced to their values for 1795 and 1695. We can do this by recomputing the cost of shipping coal with the rates for these services when they are expressed in 1842 prices. In these calculations, we assume that all coal shipped by canal was carried on wagons. 1795 efficiency levels raise the cost of moving coal in the 1842 pattern to £12.972 million. With 1695 efficiency, the cost rises to £16,987 million in 1842 prices. If we set the 1842 efficiency level to 1, then efficiency in 1795 was 46 percent of that level, and in 1695 it fell to 35 percent of the 1842 level. Alternatively, productivity across the coal transport system increased at an average rate of .7 percent per year from 1695 to 1842. Breaking down the real cost by transit mode indicates that 36 percent of the improvement between 1695 and 1842 was due to advances in ocean shipping, 6 percent was due to improvements on rivers, 42 percent was due to better road haulage, and 16 percent was due to the construction of the canal system.
CONCLUSION
The transport sector achieved substantial productivity growth during the Industrial Revolution, with remarkably little change in the geographical pattern of production. Productivity growth was, indeed, rapid. Between 1795 and 1842, productivity increased by 1.7 percent per year according to my figures. This greatly surpassed the economy-wide rate of growth of TFP from 1780–1860 of .5 percent, and it was almost as high as the 1.9 percent realized by the cotton textile sector, which posted the highest productivity growth rate of any industry (Allen 2014).
This is one way in which coal was central to the Industrial Revolution and in which its performance broadened the bases of the development of the British economy. This increase was achieved as the strength of the northeast coal monopoly increased and without many changes in the geographical structure of production. Throughout the Industrial Revolution coal markets were highly integrated, so price differences equaled differences in transport costs. The high price regions in 1842 were the same as the high price regions in 1695. The price gradients were remarkably similar across the Industrial Revolution. There were some changes in regional supply patterns—midland collieries displace Coalbrookdale in the Severn Valley, and Somerset expanded sales to south central England. Midlands mines continued to supply the midlands with canals displacing wagons over much of the region. Despite these changes, the maps of the regions supplied by the various mining districts are remarkably similar across the Industrial Revolution.
There were two main reasons for these patterns. The first was that all of the transport modes experienced productivity growth, so the productivity growth did not lead to substantial changes in the relative ability of mining districts to supply consumers at any point of consumption. The second was political. The British constitution affected the coal trade both positively and negatively. On the plus side, many acts were passed that authorized improvements in transportation. On the minus side, however, the Northeast coast producers had enough power in parliament to prevent midland canals from invading their Thames Valley market. The introduction of canals would have made that profitable, but it was not allowed. At the end of the day, monopoly trumped geography and technology.


 Open access

