

The natural diet of small felids is based primarily on small rodents and birds. Thus, cats have evolved to become obligate carnivores able to efficiently utilise large amounts of dietary protein. Adult cats require approximately two to three times more protein than adult omnivores, while kittens require approximately 1·5 times more protein than young non-carnivorous species(Reference Morris1). It is well documented that omnivorous species are able to conserve amino acids by reducing the activity of enzymes related to amino acid metabolism when fed low-protein diets(Reference Harper2, Reference Krebs3); however, cats are unable to reduce urea cycle enzyme activities when fed diets below the protein requirement(Reference Rogers, Morris and Freedland4), thereby allowing them to dispose of excess nitrogen when high-protein (HP) concentrations are consumed, but little ability to adjust with dietary changes.
Today's domestic cats are often fed diets containing large amounts of digestible carbohydrate. The dietary protein:carbohydrate ratio has been suggested as a contributor of obesity in many species(Reference Simpson and Raubenheimer5) and decreasing this ratio is often blamed by some for the increasing incidence of feline obesity, but without data supporting this belief. Feline diets containing protein levels well above the established metabolic requirement have been shown to increase heat production in lean cats(Reference Hoenig, Thomaseth and Waldron6), maintain insulin sensitivity of fat metabolism in obese cats(Reference Hoenig, Thomaseth and Waldron6) and maintain lean body mass during weight loss(Reference Laflamme and Hannah7). Feeding 18 % protein v. 12 % protein diets to pigs resulted in greater blood lipid concentrations and adipose and skeletal muscle expression of genes associated with fatty acid metabolism(Reference Ramsay and Mitchell8), and decreased adipose tissue accumulation(Reference Caperna, Komarek and Gavelek9).
Beyond the use of HP diets (>50 % crude protein, CP) in adult cats, their use in kittens and pregnant and lactating cats has been limited. It is well known that the maternal diet can greatly influence the offspring's metabolism later in life. For example, in rats and sheep, energy- or protein-deficient diets of the dam have been reported to lead to a greater propensity for insulin resistance in the offspring(Reference Erhuma, Salter and Sculley10, Reference Burt, Hess and Nathanialsz11). Rats prenatally exposed to HP diets have decreased physical activity levels compared with rats exposed to an adequate-protein diet prenatally(Reference Daenzer, Ortmann and Klaus12). Because Daenzer et al. (Reference Daenzer, Ortmann and Klaus12) reported decreased energy expenditure in rats exposed to a HP diet prenatally, one goal of the present study was to determine whether prenatal and postnatal HP exposure affected voluntary physical activity in cats. Although complete and balanced commercial feline diets contain the recommended protein concentrations for kittens or reproducing females as suggested by the Association of American Feed Control Officials (30 % CP, DM basis)(13), they are often lower than what a small felid would consume in the wild (rat carcass 55 % CP on DM basis)(Reference Zoran14). Furthermore, very few studies have been conducted to test the occurrence of metabolic changes in cats as it pertains to maternal nutrition.
Therefore, the objective of the present study was to measure the differences in body composition, adipose tissue gene expression, blood metabolite and hormone concentrations, and insulin sensitivity in kittens exposed to HP or high-carbohydrate (HC) nutrition in utero and through the growth period. We hypothesised that HP-fed kittens would have a greater lean body mass and decreased adipose tissue accumulation, leading to increases in gene expression and blood metabolite concentrations associated with improved insulin sensitivity as compared with HC-fed kittens.
Materials and methods
Animals
Queens. Eight domestic shorthair female cats (3·5 (sem 0·24) kg body weight (BW); 1·3 (sem 0·02) years of age) and one male domestic shorthair cat (5·8 kg; 1·3 years of age) were used to generate offspring (Liberty Research, Inc., Waverly, NY, USA). Dams were randomly allotted to two test diets, 1 month before mating and were maintained on these diets throughout gestation and lactation in a completely randomised design. The tom was fed the HP diet to maintain BW during mating. During the mating phase of the study, as many as four female cats were allowed to roam freely in a room with the male to facilitate breeding.
Kittens. Six females had litters (four cats fed HC; two cats fed HP). Of these litters, seventeen male kittens were born (ten HC kittens; seven HP kittens). All kittens fed the HP diet were utilised for further study. Of the HC-fed kittens, the eight kittens having the most similar birth weights were utilised for the study. Thus, a total of fifteen male kittens were studied over the first 9 months of life (eight kittens fed HC; seven kittens fed HP). One kitten died under anaesthesia during neutering (8 months) from the HC group. Therefore, an intravenous glucose tolerance test (IVGTT) was not performed on this kitten or utilised in statistical analyses. Kittens were allowed to consume food and water ad libitum throughout the study. Food intake was measured daily following weaning (per pen); BW were measured at birth and weekly thereafter. All kittens were neutered at 8 months of age at the same time biopsy samples were collected.
Kittens were either pair- or triple-housed after 16 week of age and throughout the study. Beginning at 4 months of age, kittens were acclimated to a daily exercise schedule to allow for evaluation of voluntary physical activity as described by Belsito et al. (Reference Belsito, Vester and Keel15). Briefly, kittens were allowed access to diet in cages (1 m × 0·76 m × 0·70 m) for 7 h/d and were group housed in a room (9 m × 7·32 m × 3·96 m) with no access to diet for 17 h/d. All animal procedures were approved by University of Illinois Institutional Animal Care and Use Committee before animal experimentation.
Dietary treatments
Two dry extruded kibble diets containing varying protein concentrations were evaluated in the present study. Dietary ingredient and chemical composition are provided in Table 1. Diets were manufactured by Natura Manufacturing, Inc. (Fremont, NE, USA). These diets were formulated to represent commercially available diets (e.g. ingredient inclusion, macronutrient profile) with varying macronutrient composition; however, dietary protein concentration constituted the greatest difference between diets.
Ingredients and chemical composition of diets fed to dams and kittens
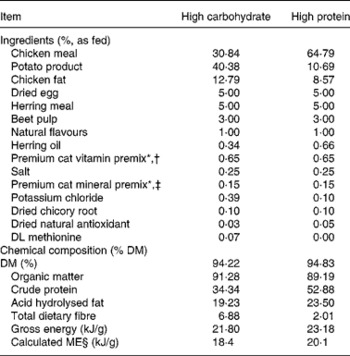
* Trouw Nutrition (Highland, IL, USA).
† Composition of mineral premix (g/kg mix): CaCO3, 360·2; ZnSO4; 208·3; OPTiMIN (Trouw Nutrition) Zn proteinate (15 % Zn; Trouw Nutrition), 166·7; FeSO4, 77·4; OPTiMIN Fe proteinate (15 % Fe), 53·3; CuSO4, 35·7; OPTiMIN Cu proteinate (10 % Cu), 3·0; MnSO4, 23·4; OPTiMIN Mn proteinate (15 % Mn), 16·7; Se, 12·0; carrier (soyabean oil), 10·0; OPTiMIN Co proteinate (2·5 % Co), 3·8; I, 1·8; CoCO3, 0·6.
‡ Composition of vitamin premix (g/kg mix): carrier (pea fibre), 728·4; CaCO3, 170·9; vitamin E 50 % adsorbate, 40·0; betaine (source of choline), 26·0; carrier (soyabean oil), 10·0; nicotinic acid, 9·6; vitamin A, 4·0; D-calcium pantothenate, 2·7; vitamin B1 thiamine mononitrate, 2·7; vitamin B2 riboflavin, 1·25; β-carotene, 1·0; vitamin B12, 1·0; vitamin D3, 0·8; biotin, 0·7; vitamin B6 pyridoxine, 0·7; folic acid, 0·2.
§ Calculated according to NRC(45), predictive equations for metabolisable energy in cat foods for prepared cat foods using total dietary fibre.
Diet samples were ground with dry ice through a 2 mm screen in a Wiley mill (model 4; Thomas Scientific, Swedesboro, NJ, USA) in preparation for chemical analyses. Diets were analysed for DM and organic matter according to Association of Official Agricultural Chemists(16). Crude protein was determined according to Association of Official Agricultural Chemists(17) using a Leco Nitrogen/Protein Determinator (model FP-2000; Leco Corporation, St Joseph, MI, USA). Fat concentrations were determined by acid hydrolysis(18) followed by diethyl ether extraction(Reference Budde19). Total dietary fibre was determined according to Prosky et al. (Reference Prosky, Asp and Schweizer20). Gross energy was determined by use of a bomb calorimeter (model 1261; Parr Instrument Co., Moline, IL, USA). All analyses were performed in duplicate. Samples with a 5 % or greater variance were re-analysed until this level of variance was achieved for all analyses.
Blood sampling
Food-restricted blood samples were collected via femoral venepuncture at 2 and 6 months of age. At 2 months of age, kittens were food-restricted for 4 h to limit the time away from the dam and minimise stress. At 6 months of age, all kittens were food-restricted for 12 h before blood collection. Samples were analysed for NEFA and TAG concentrations. Total serum ghrelin, plasma leptin and serum metabolites and hormones were analysed at 6 months of age. Blood was immediately transferred to appropriate Vacutainer tubes (Becton Dickinson, Franklin Lakes, NJ, USA) for plasma and serum sampling. All tubes were placed on ice until centrifugation. All samples were centrifuged within 30 min of collection (1100–1300 g for 15 min at 4°C). After centrifugation, supernatant was collected and stored at − 80°C until further analyses.
Serum metabolite concentrations were determined using a Hitachi 911 clinical chemistry analyser (Roche Diagnostics, Indianapolis, IN, USA). Plasma leptin concentrations were determined using a multi-species leptin radio labelled immunoassay RIA kit (LINCO Research, St Charles, MO, USA). Following a 10-fold dilution, total serum ghrelin was determined using a total ghrelin (rat, mouse) enzyme immunoassay kit (Phoenix Pharmaceuticals, Inc., Burlingame, CA, USA). The leptin and ghrelin kits were previously validated for use in our laboratory using parallel determination from increasing dilutions of plasma or serum of at least three cats(Reference Belsito, Vester and Keel15).
Body composition
Lean mass, fat mass and bone mineral mass were determined at 2 and 8 months using dual-energy X-ray absorptiometry, which was previously validated in cats(Reference Speakman, Booles and Butterwick21). Cats were placed in ventral recumbency while under sedation and body composition was analysed using a Hologic model QDR-4500 Fan Beam X-ray Bone Densitometer and software (Hologic Inc., Waltham, MA, USA). At 2 months of age, kittens were sedated using ketamine (11 mg/kg intramuscular) and diazepam (0·5 mg/kg intramuscular). At 8 months of age, dual-energy X-ray absorptiometry was conducted immediately following gonadectomy while still sedated.
Physical activity level assessment
Voluntary physical activity levels were evaluated using Actical activity collars (Mini Mitter, Bend, OR, USA), which were worn about the neck for seven consecutive days at 6 and 9 months of age, validated for use in research cats(Reference Lascelles, Hansen and Thomson22). Collars contain omnidirectional sensors capable of accurately incorporating both intensity and duration of movements. Upon removal of the collars, data were analysed, compiled and converted into arbitrary numbers referred to as ‘activity counts’ by Actical software. Average activity was presented in activity counts per epoch (epoch length = 0·25 ). Actical software allowed for the determination of average activity counts per epoch during light and dark periods without human interference. Cats were maintained on a strict exercise schedule. Cats were pair- or triple-housed in cages during the following times, 08.00–09.00, 10.00–12.00, 15.00–19.00 hours, where they had ad libitum access to food. All other times, cats were allowed to exercise together, with no food available.
Gonadectomy, adipose biopsy and catheter placement
Food was withheld for at least 8 h before gonadectomy. Kittens were given free access to water. Kittens were sedated with butorphanol (0·2 mg/kg), atropine (0·04 mg/kg) and medetomidine (0·02 mg/kg), and anaesthesia was maintained, if necessary, with isoflurane in 100 % oxygen. Immediately following gonadectomy, a 1 g biopsy of subcutaneous adipose tissue was collected along the ventral side of the body cavity. Samples were flash-frozen in liquid nitrogen and stored at − 80°C until further analyses.
Jugular catheters (19 gauge, 20·3 cm; Becton Dickinson and Company, Franklin Lakes, NJ, USA) were placed at 8 months of age, which were used to conduct the IVGTT. Once in place, the catheters were held with Zonas porous tape and secured with vet wrap to prevent displacement of the catheter. After taping, the injection cap was exposed for blood collection. Catheters were flushed once daily with heparinised saline. Catheters were removed immediately following testing, which occurred within 36 h of catheter placement.
Intravenous glucose tolerance test
An IVGTT was conducted at 8 months of age as a measure of insulin sensitivity. The IVGTT is used to identify glucose intolerance and insulin sensitivity. It is an excellent test to examine alterations in insulin secretion pattern, an early sign of β-cell dysfunction in many species, including cats(Reference Hoenig, Alexander and Holson23). A 1·5 ml blood sample was collected before and at 2, 5, 10, 15, 30, 45, 60, 90 and 120 min following intravenous administration of dextrose (0·5 g/kg BW). Blood glucose and serum insulin concentrations were determined. Glucose was measured using a Precision G Blood Glucose System (MediSense; Abbott Laboratories, Abbott Park, IL, USA). Serum insulin concentrations were determined using a commercial RIA kit (Double Antibody RIA; Diagnostic Systems Laboratories Inc., Webster, TX, USA), which was validated in cats by the manufacturer and previously in our laboratory using parallel determination(Reference Belsito, Vester and Keel15).
Adipose gene expression
Total cellular RNA was extracted from adipose tissue samples using Trizol (Invitrogen, Carlsbad, CA, USA). The concentration and purity of RNA were determined using an ND-1000 spectrophotometer (Nanodrop Technologies, Wilmington, DE, USA). Samples were treated with DNA-free, DNase treatment and removal according to manufacturer instructions (Ambion, Inc., Austin, TX, USA). Conversion of RNA to cDNA was performed using methods described by the ABI cDNA Archive kit (Applied Biosystems, Foster City, CA, USA). Isolated cDNA was amplified using real time RT-PCR on an ABI PRISM 7900HT Sequence Detection System (Applied BioSystems). Gene-specific primers were designed using Primer Express 2.0 Software (Perkin Elmer, Boston, MA, USA) or from previous publications(Reference Zini, Linscheid and Franchini24).
Genes with available mRNA sequence and having roles in lipid metabolism and transport (PPARγ isoform-1 (PPARγ1); PPARγ isoform-2 (PPARγ2); hormone-sensitive lipase (HSL); lipoprotein lipase), glucose metabolism and transport (insulin receptor, IR; GLUT1; GLUT4), inflammation (IL-1; IL-6; TNF-α; monocyte chemotactic protein 1; chemokine receptor 5, CCR5; toll-like receptor 4), and genes having various roles in adipose tissue (uncoupling protein 2, UCP2; leptin; adiponectin; vascular endothelial growth factor; oestrogen receptor 1; plasminogen activator inhibitor 1) were selected.
The PCR mixture contained 5 ng/μl of cDNA, 15 pmol of each primer and 5μl SYBR® Green. The final volume was adjusted to 10 μl using sterile deionised water. The 18S rRNA gene was used as an internal standard. Data analyses were conducted using with sequence detection system software (Applied BioSystems). All target genes were normalised to 18S before statistical analyses.
Statistical analyses
Statistical evaluation was completed using the Proc Mixed procedure of Statistical Analysis Systems (SAS, Inc., Cary, NC, USA). All outcome variables measured over multiple time points were evaluated as repeated measures. The fixed effects of time and diet were tested when appropriate, where the interaction of time and diet was explored if significant. Data analysed at only one time point was tested for the fixed effect of diet. Litter size (number of kittens in each litter) was used in the model as a covariate when analysing BW of kittens. The number of kittens per pen was utilised in the model to determine food intake of pair-, or triple-housed cats. P < 0·05 was considered significant, while P < 0·10 was considered a trend.
Results
Body weight gain and food intake
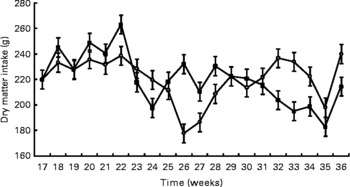
Birth weight was not different between treatments (HC: 120 g; HP: 108 g). BW was not different (P = 0·7) between treatments throughout the study, but did increase (P < 0·0001) over time (Fig. 1). Mean BW for both treatments at 9 months was 4·8 kg. DM and energy food intake did not differ due to diet (P>0·05), but increased (P < 0·01) over time to support growth (Fig. 2).
Body weights of male kittens fed a high-carbohydrate (HC) or high-protein (HP) diet. Body weight increased (P < 0·0001) over time, but did not differ (P = 0·7) due to diet. Litter size (number of kittens per litter) was used as a covariate. ![]() , HP;
, HP; ![]() , HC.
, HC.
Food intake of pair- or triple-housed male kittens fed a high-carbohydrate (HC) or high-protein (HP) diet. Food intake changed over time (P < 0·01), but did not differ (P = 0·9) due to diet. The number of kittens per pen was used as a covariate. ![]() , HP;
, HP; ![]() , HC.
, HC.
Blood metabolites and hormones
At 2 months, TAG concentrations were greater (P < 0·01) in kittens fed HP (HP: 0·8 mmol/l, HC: 0·3 mmol/l; data not shown). NEFA concentrations also tended to be higher (P < 0·10) in kittens fed HP at 2 months (HP: 0·57 mEq/l, HC: 0·27 mEq/l), and increased (P < 0·05) over time in cats fed both treatments. Serum leptin, chloride and glucose were higher (P < 0·05) in kittens fed HC compared with those fed HP at 6 months of age (Table 2). Total protein, albumin and calcium were higher (P < 0·01) in kittens fed HP at 6 months of age. Blood urea nitrogen, creatinine, phosphorus, sodium, potassium, alkaline phosphatase activity, total bilirubin, bicarbonate and cholesterol did not differ between treatments at 6 months of age.
Blood metabolites and hormones of male kittens fed a high-carbohydrate (HC) or high-protein (HP) diet at 6 months of age
BUN, blood urea nitrogen.
Physical activity
HP-fed kittens had similar activity levels during light hours, but tended (P < 0·10) to have greater activity during the dark period. Total average activity counts were numerically higher in HP-fed cats, but were not statistically different between groups due to high variance within each group. Kittens fed HP had a higher (P < 0·05) light:dark activity ratio compared with kittens fed HC (Table 3).
Physical activity levels of male kittens fed a high-carbohydrate (HC) or high-protein (HP) diet at 6 and 9 months of age*
* Activity levels defined as arbitrary units referred to as ‘activity counts.’ Data compiled by activity collars by Actical software. Activity is presented in activity counts per epoch (epoch length = 0·25 min). Values represent the mean epoch activity counts over 7 d, during the selected hours (e.g. light hours, dark hours, average throughout entire day). Cats were maintained on a strict exercise schedule. Cats were pair- or triple-housed in cages during the following times: 08.00–09.00, 10.00–12.00, 15.00–19.00 hours, at which time they had ad libitum access to food. At all other times, cats were allowed to exercise together with no food available.
Body composition
Fat mass, lean body mass and bone mineral mass increased (P < 0·05) over time, regardless of dietary treatment (Table 4). Lean body mass tended to be higher (P < 0·10) in kittens fed HP. Fat and bone mass percentages increased (P < 0·05), while lean body mass percentage decreased (P < 0·05) over time, regardless of dietary treatment. At 2 months of age, kittens fed HP had a higher (P < 0·01) fat mass percentage and lower (P < 0·01) lean body mass percentage than HC-fed kittens, but there were no differences between treatments at 8 months of age.
Body composition of male kittens fed a high-carbohydrate (HC) or high-protein (HP) diet at 2 and 8 months of age
BMC, bone mineral content.
Intravenous glucose tolerance test
Glucose concentrations were higher (P < 0·05) at 15 min in kittens fed HP (Fig. 3), but glucose and insulin data at all other time points were similar between groups. Time to 1/2 glucose, glucose disappearance rate (k), glucose area under the curve, insulin area under the curve, peak insulin time, fasting glucose and fasting insulin were not different (P>0·05; Table 5).
Intravenous glucose tolerance test of male kittens fed a high-carbohydrate (HC) or high-protein (HP) diet at 8 months of age. Blood glucose concentrations (![]() , HC glucose;
, HC glucose; ![]() , HP glucose) were greater at 15 min in HP-fed cats when compared with HC-fed cats. Blood insulin concentrations (
, HP glucose) were greater at 15 min in HP-fed cats when compared with HC-fed cats. Blood insulin concentrations (![]() , HC;
, HC; ![]() , HP) did not differ between diets. Pooled standard error of the mean (sem) for glucose = 0·67. Pooled sem for insulin = 5·25. * Difference (P < 0·05) due to diet.
, HP) did not differ between diets. Pooled standard error of the mean (sem) for glucose = 0·67. Pooled sem for insulin = 5·25. * Difference (P < 0·05) due to diet.
Intravenous glucose tolerance test indices of male kittens fed a high-carbohydrate (HC) or high-protein (HP) diet at 8 months of age
* Glucose disappearance (t 1/2) and rate of glucose disappearance calculated according to Appleton et al. (Reference Appleton, Rand and Priest32).
Adipose tissue mRNA
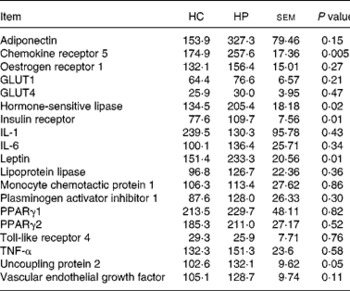
Chemokine receptor 5, HSL, UCP2, leptin and IR mRNA were greater (P < 0·05) in kittens fed HP (Table 6). Expression of the following genes did not differ (P>0·05) due to diet: adiponectin; oestrogen receptor 1; GLUT1; GLUT4; IL-1; IL-6; lipoprotein lipase; monocyte chemotactic protein 1; PAI-1; PPARγ1; PPARγ2; TNF-α; vascular endothelial growth factor. Activity counts during the dark period were not correlated (P>0·05) to UCP2 mRNA expression levels.
Relative adipose tissue mRNA abundance (arbitrary units) of male kittens fed a high-carbohydrate (HC) or high-protein (HP) diet at 8 months of age
Discussion
To our knowledge, the present study is the first to evaluate the effects of in utero and early postnatal dietary protein concentrations on body composition, physical activity and adipose mRNA abundance in felines. Diets were formulated using ingredients intended to mimic commercially available feline diets, with primary focus on dietary protein. Despite our primary interest in dietary protein concentration, we acknowledge slight differences in other dietary constituents (dietary fat and fibre concentration and/or source) that may have also influenced the outcome variables measured in the present study.
Because both diets met established nutrient requirements of weanling kittens and pregnant and lactating cats, differences in kitten birth weight were not expected. Food intake increased over time to support growth, but did not differ due to diet.
Serum TAG decreased from 2 to 6 months of age. Because blood TAG concentrations are heavily dependent on time from last meal, this change may have been due to the differences in time of food restriction at 2 months v. 6 months. To limit the time away from the dam and minimise stress, food was withdrawn from kittens for 4 h before blood collection, while at 6 months, food was withdrawn from kittens for 12 h. Blood indices associated with protein intake, total protein and albumin, were greater in kittens consuming HP. Total protein concentrations (40 g/l) were within the normal reference range for cats, but albumin was slightly above the feline reference range (27–38 g/l) in HP-fed cats(Reference Kahn25, Reference Reynolds, Boudet and Germain26). Creatinine and blood urea nitrogen concentrations were not different between groups.
At 6 and 9 months of age, kittens fed HP had consistently numerically higher physical activity levels during the dark period and total average activity levels as compared with the kittens fed HC; however, this was not statistically significant. The ratio of light:dark activity in kittens fed HP was lower (P < 0·05) than kittens fed HC. A recent rat study determined that prenatal HP exposure led to decreased total energy expenditure, with differences being attributed to HP intake related changes in thermogenesis or physical activity(Reference Daenzer, Ortmann and Klaus12). The high thermal effect of protein consumption has been documented in cats(Reference Hoenig, Thomaseth and Waldron6); however, very little research has quantitatively measured physical activity in cats fed diets containing differing macronutrient concentrations. Recent survey research suggests that decreased physical activity may be a risk factor for the development of feline diabetes(Reference Slingerland, Fazilova and Plantinga27). Because increased physical activity would be expected to have beneficial effects on overall health, further evaluation of dietary protein concentration and physical activity in cats is warranted.
Activity counts tended to be greater in HP-fed cats during the dark period. One possible explanation may be that cats were given access to food for 4 h immediately before the dark period, and the higher thermal effect of protein may have led to HP-fed cats being more active postprandially.
Increases in body fat mass and lean mass occurred over time due to the normal growth of kittens. Kittens fed HP tended to have greater lean body mass than kittens fed HC throughout the study, which was similar to Laflamme & Hannah(Reference Laflamme and Hannah7), who reported that cats fed a HP diet were able to maintain lean body mass during weight loss. At 2 months of age, it was noted that kittens fed HP had a higher proportion of BW from fat mass; however, there was no statistical difference in BW (1·16 kg (HP) v. 0·97 kg (HC)). At 2 months of age, kittens had access to the kibble diet, but were still nursing from the dam as well. The greater fat mass in HP-fed kittens may have been due to a greater intake of diet, greater intake of milk or litter size (HP: 4·0 kittens/litter; HC: 4·75 kittens/litter).
Another theory as to the greater adiposity of HP-fed kittens is the link between protein intake and insulin-like growth factor 1. Greater adipose tissue insulin-like growth factor 1 mRNA abundance(Reference Brameld, Atkinson and Saunders28) has been reported in pigs fed increasing dietary protein. Along with several adipokines, insulin-like growth factor 1 plays a role in the proliferation of adipose tissue(Reference Hausman, DiGirolamo and Bartness29). Gene expression of insulin-like growth factor 1 was not evaluated in the present study; however, this may be of interest in further studies when the feline mRNA sequence becomes available.
A study evaluating body composition in young, growing cats, reported an average of 16 % body fat mass in kittens aged 4–5 months(Reference Lauten, Cox and Baker30), which was similar to the HP kittens in the present study (16·8 % body fat). Given that the only food source until 2 months of age was the dam's milk, differences in body composition may be attributable to the effect of diet on milk production rather than the diet alone. It is possible that dams fed the HP diet were more capable of supporting milk production than those fed HC. Interestingly, there was no difference in body fat by 8 months of age, indicating that the effect at 2 months of age was more likely due to factors such as milk content of the dam, litter size, etc., than dietary protein concentration. This was not consistent with our hypothesis that HP-fed cats would have a decreased adipose tissue deposition. Body composition data at 8 months suggest that food intake has a greater influence on the body composition of cats than dietary macronutrient composition. Therefore, similar food intake between HP and HC resulted in similar body fat mass.
Low prenatal dietary protein consumption by pregnant rats has been reported to result in metabolic changes and obesity in the offspring later in life. Research in animals consuming HP diets is, however, more limited. Nine day old rat offspring from dams fed a HP (40 % CP) diet during the prenatal period had greater fat body mass and lower energy expenditure(Reference Daenzer, Ortmann and Klaus12). Further work in rats noted sex-dependent effects in offspring of dams consuming a HP diet(Reference Thone-Reineke, Kalk and Dorn31). At 22 week of age, male offspring of dams fed the HP diet had greater blood pressure; in contrast, female offspring had greater fat pad mass(Reference Thone-Reineke, Kalk and Dorn31). Conversely, a linear decrease in fat accretion with increasing dietary protein concentrations has been reported in growing pigs(Reference Caperna, Komarek and Gavelek9). It should also be noted that rats and pigs are omnivorous species, and therefore may not react similarly to obligate carnivores. The long-term effects HP diets have on offspring have yet to be elucidated fully.
Diet did not influence insulin sensitivity as measured by IVGTT in the present study, with all glucose and insulin values present within normal ranges for normal weight cats(Reference Appleton, Rand and Priest32). These results were consistent with previous studies evaluating the use of HP diets on insulin sensitivity(Reference Hoenig, Thomaseth and Waldron6, Reference Leray, Siliart and Dumon33). Insulin sensitivity was not changed due to diet in obese(Reference Hoenig, Thomaseth and Waldron6) or normal-weight cats(Reference Hoenig, Thomaseth and Waldron6, Reference Leray, Siliart and Dumon33). It has been noted that weight gain may be the main effecter of insulin sensitivity or insulin resistance(Reference Fettman, Stanton and Banks34–Reference Hoenig, Thomaseth and Brandao36).
Adipose tissue mRNA abundance revealed several changes occurring in adipose tissue, which were not evident by other physiological measurements. Gene transcripts may change rapidly in tissue and provide a snapshot of the metabolic processes occurring at that time. Interesting changes in HSL, IR and UCP2 were noted in kittens fed HP v. HC that warrant further research. Most notably, the expression of genes associated with insulin signalling and lipid catabolism tended to be greater in kittens fed HP.
Adipose adiponectin mRNA was not statistically significant (P = 0·15); however, large numerical differences were noted. Adiponectin plays a role in insulin sensitivity and has anti-inflammatory functions. Circulating adiponectin is generally decreased with obesity and increases upon weight loss, with this pattern being noted in a past feline studies(Reference Hoenig, Thomaseth and Waldron6). Furthermore, high plasma adiponectin concentrations during obesity are thought to increase insulin sensitivity. Blood adiponectin concentrations were not measured in the present study and were not affected by a HP diet in a previous study(Reference Hoenig, Thomaseth and Waldron6). Because there was no difference in IVGTT measurements and tissue adiponectin concentrations were not measured in the present study, the relevance of adipose tissue adiponectin mRNA requires further study.
Adipose tissue IR mRNA was greater in kittens consuming HP. Similar to adiponectin, decreased IR gene expression may contribute to decreased insulin sensitivity and insulin resistance. Thus, greater expression would appear to be beneficial. Given that there were no differences in glucose tolerance at 8 months of age, however, it does not appear that the IR mRNA expression levels were beneficial in HP-fed kittens. Further, research in obese v. lean cats fed HP diets may elucidate this action further.
Hormone-sensitive lipase and UCP2 mRNA was greater in kittens fed HP. Greater HSL may have occurred because HP-fed kittens consumed less digestible carbohydrate (10·8 %, 25 % of energies on ME basis). Because no differences were noted in lipoprotein lipase mRNA levels, it suggests an increase in lipid catabolism in the HP-fed kittens.
Uncoupling protein 2 is involved with increased energy expenditure and is often upregulated during excess energy intake or high-fat feeding. UCP 1 and 2 were upregulated in brown adipose tissue of rats fed a HP diet compared to those fed a medium-protein or adequate-protein diet(Reference Petzke, Friedrich and Metges37). That finding was also positively correlated with energy expenditure (VO2) during the dark period (12 h light–dark cycle)(Reference Petzke, Friedrich and Metges37). It was suggested that UCP2 plays a role in substrate oxidation and therefore the thermogenic effect of consuming protein. These metabolic changes occur rapidly, as feeding a HP diet to rats for a short period of time (4 d) resulted in more activity during the dark period(Reference Petzke, Riese and Klaus38). Adipose UCP2 mRNA expression was not measured in that study, and the short period of HP consumption did not alter adipose tissue mass.
Pigs fed a diet containing 18 % compared with 12 % CP had greater blood NEFA and TAG concentrations, and greater UCP2 expression in subcutaneous adipose tissue(Reference Ramsay and Mitchell8), similar to findings reported here. Physical activity, however, was not measured in that study. Although a significant correlation between UCP2 mRNA expression and activity counts during the dark period were not noted in the present study, it might have contributed through a thermogenic mechanism. UCP2 has also been reported to increase adipose adiponectin gene expression and circulating protein concentration in UCP2-null mice and 3T3-L1 fibroblasts, thereby indicating an influence on insulin sensitivity(Reference Chevillotte, Giralt and Miroux39).
Genes associated with inflammation have been reported previously to be greater in adipose tissue of obese animals and human subjects. During obesity, adipose tissue secretes higher inflammatory cytokines levels, leading to a low-level inflammatory state that contributes to several metabolic problems and insulin resistance. Chemokine receptors are thought to play a role in inflammatory response, immune response and leucocyte chemotaxis. CCR5 in particular plays a role in macrophage recruitment and has been reported to increase with obesity and inflammation. Its complete biological function in adipose tissue, however, is not well understood. Greater CCR5 mRNA of HP-fed kittens may have been an indicator of increased macrophage populations and potential inflammation in cats fed HP. However, there were no changes in mRNA concentrations of other inflammatory cytokines (e.g. IL-1, IL-6, TNF-α) measured in the present study. Monocyte chemoattractant protein-1, a ligand of CCR5, has been suggested to play a role in adipose tissue remodelling(Reference Bourlier, Zakaroff-Girard and Miranville40), but was unchanged in the present study. Vascular endothelial growth factor is also upregulated during tissue remodelling and was numerically greater (P = 0·11) in HP-fed cats. Because IL-1, IL-6 and TNF-α were unchanged, we hypothesise that the greater CCR5 mRNA was related to its role in tissue remodelling.
Despite observing no differences in BW or body composition at 8 months, leptin mRNA was greater in kittens fed HP; however, plasma leptin concentrations were higher in kittens fed HC. The greater leptin mRNA expression yet lower circulating leptin concentrations in HP-fed kittens may have been due to downstream differences in post-transcriptional processes (e.g. RNA editing or processing, translation, etc). A positive correlation (r 2 0·388; P < 0·0001) between adipose leptin gene expression and serum concentrations has been noted in some human subjects studies(Reference Knerr, Herzog and Rauh41), but has not been consistently reported. For example, although serum leptin concentrations decreased in women after 33 week of weight loss, adipose leptin mRNA was increased(Reference Lappalainen, Kolehmainen and Schwab42). Those authors did not provide an explanation to this discrepancy and diets consumed during this period were not defined. In the present study, greater leptin mRNA may have been a response to the low concentrations present in the blood, thereby increasing gene expression to produce more leptin protein; however, it remains unclear at this time.
Decreased circulating leptin has been suggested as an indicator of increased leptin sensitivity in animals or people consuming HP diets. For example, people with the metabolic syndrome fed a low-carbohydrate diet have been reported to have decreased blood leptin levels(Reference Hayes, Miller and Ulbrecht43). Those authors suggested that the decreased blood leptin was due to increased leptin sensitivity; however, unlike the present study in which BW was maintained or increasing, those individuals also lost body fat during that study.
The release of leptin is also believed to be modified by glucose metabolism. Mueller et al. (Reference Mueller, Gregoire and Stanhope44) noted the amount of leptin secreted is proportional to the amount of glucose metabolised by the adipose tissue. This is consistent with the results reported in the present study, with HC-fed cats having higher circulating leptin concentrations than HP-fed cats.
In conclusion, in utero and postnatal exposure to a HP diet appears to increase blood metabolite and hormone concentrations (e.g. TAG, protein, albumin) without changes in blood urea nitrogen or creatinine. Furthermore, postnatal exposure to a HP diet increased light:dark ratio of physical activity and adipose mRNA abundance of HSL, IR, leptin and UCP2. Diet- and age-induced changes in adipose tissue gene expression are of great interest in regards to obesity research. Because maternal nutritional status has been shown to cause life-long changes in metabolism in other species, further study of these cats throughout adulthood in our colony may shed light on the effects of exposure to a HP diet during early development. These results may have implications on feline diets formulated for cats during reproduction and rapid growth. Furthermore, research focused on the effects of exposing kittens to a HP diet to kittens in utero is therefore warranted.
Acknowledgements
Author K. J. L. is employed by Natura Manufacturing, Inc., the funding company. There are no other conflicts of interest. Funding for the present study was provided by Natura Manufacturing, Inc. B. M. V. was in charge of executing the experiment, analysing data, compiling results and writing the manuscript. K. J. L. was responsible for designing the experiment and reviewing the manuscript. T. L. K. was responsible for helping with executing the experiment. T. K. G. was responsible for helping execute the experiment, review of analysis and review of the manuscript. K. S. S. was responsible for monitoring the execution of the experiment and data analysis as well as manuscript writing and review.


