

As is commemorated by this special issue of PS: Political Science and Politics, empirical research on lesbian, gay, bisexual, transgender, queer, and more (LGBTQ+) issues is still a relatively new phenomenon in political science. Although here we mark the 50 years since pioneer Kenneth Sherrill presented the first empirical study on LGBTQ+ issues at the 1973 APSA annual meetings, in many ways the trajectory of scholarship on this subject in our field has been much shorter than five decades.
POLITICAL SCIENCE’S LONG “CURIOUS SILENCE” ABOUT LGBTQ+ PEOPLE AND POLITICS
The glacial pace at which political science engaged LGBTQ+ politics can be glimpsed with a search of the archives of our discipline’s flagship journal, the American Political Science Review. The first references to “homosexuals” and “homosexuality” appeared in original research articles in the journal in the 1960s, but it wasn’t until 1987 that an article mentioned the term “gay rights” (Inglehart and Flanagan Reference Inglehart and Flanagan1987); the same was true until 1995 for “gays and lesbians” (Preston Reference Preston1995). All these references are cursory, however. None even comes close to the flavor of Sherrill’s Reference Sherrill1973 APSA paper, which took as a serious object of study the political behavior of gay New Yorkers who assembled for political meetings—and not coincidentally, disco dancing—at a firehouse that was reappropriated for these purposes in the early 1970s (see Thomas Reference Thomas2023).
It wasn’t until three decades after the Stonewall riots that the APSR published work—M. Kent Jennings’s 1998 APSA presidential address—that briefly centered LGBTQ+ political behavior itself (Jennings Reference Jennings1999). In a deeply humane reflection, Jennings considered how pain and loss can spur a range of political reactions. He presented AIDS activism as one example, hypothesizing that a reason for activists’ effectiveness was that so many of them were rooted in the gay community. This lent AIDS activists unusual advantages, Jennings noted, because sexual minorities’ stigmatization by the general public was countered by their substantial political resources accrued from decades of rights-based organizing.
The paucity of this kind of thinking at the time in our discipline led Timothy E. Cook, writing a review essay in the APSR later that year, to declare the existence of a “curious silence” about the topic in political science (Cook Reference Cook1999). This silence, Cook averred, was most profound regarding precisely the kind of LGBTQ+ political behavior research Sherrill had introduced in 1973. “The relationship of sexual orientation to politics [is] not neglected,” wrote Cook, “so much as the politics of lesbians, gay men, and bisexuals themselves” (Cook Reference Cook1999, 680).
BRINGING LGBTQ+ POLITICAL BEHAVIOR INTO THE FOREGROUND
Happily, both in the APSR and beyond, political science is no longer silent on LGBTQ+ issues. But there remains a relatively sparse body of empirical literature that foregrounds the political behavior of queer people themselves, and scholars would do well to follow Ken Sherrill’s example—and to heed Tim Cook’s words—by contributing to this work. In contrast, there is a much larger scholarly literature on topics such as laws, policies, court cases, and public opinion regarding LGBTQ+ rights.Footnote 1 This literature is of course crucial to understanding the political landscape encountered by LGBTQ+ people as they strive for recognition, liberty, and equality. But by necessity, such scholarship usually casts queer people as objects: people about whom other, typically non-LGBTQ+, people make laws and policies, hold opinions, and determine fates. There is a much smaller body of research that centers LGBTQ+ people as subjects who do things like form political beliefs, vote, organize, run for office, and otherwise engage in political behavior that reflects their identities and lived experiences.Footnote 2 This gap is reflected in the APSR, where the total number of research articles ever published in the journal that feature LGBTQ+ people as political actors (including as voters, candidates, lawmakers, activists, and canvassers) can currently be counted on one hand.Footnote 3
There are at least three good reasons for political science to redouble its efforts to understand LGBTQ+ political behavior. (I focus on the United States here, but these observations hold to varying degrees around the globe; see Bosia, McEvoy, and Rahma Reference Bosia, McEvoy and Rahman2020.) First, self-identified LGBTQ+ people are a rapidly growing share of the population, with identification rates highest (exceeding 1 in 5) among the youngest generation of Americans (J. Jones Reference Jones2024). Political science has belatedly recognized that understanding the US electorate is impossible without expertise on the politics of groups like Black, Latino, and rural Americans. LGBTQ+ Americans’ numbers may soon match or even surpass these groups’ shares of the US population.
Second, LGBTQ+ people’s recent breathtaking advancements in rights, acceptance, and visibility make them a case study unfolding in real time of the political consequences of a group’s migration from the margins toward the mainstream.Footnote 4 Political scientists have explored similar trajectories undertaken by groups such as European immigrants during the New Deal era (Andersen Reference Andersen1979), women after the suffrage (Harvey Reference Harvey1998), Mormons’ incorporation into Republican conservative politics (Campbell, Green, and Monson Reference Campbell, Green and Monson2014), and Black Americans after the Great Migration (Grant Reference Grant2020). Thus far, LGBTQ+ people’s gains have not resulted in any disruptions to their steadfast Democratic Party loyalty and distinctively liberal attitudes (Hertzog Reference Hertzog1996; P. Jones Reference Jones2021). Understanding why this is the case—and detecting any future change in these patterns—will require continued scholarly focus on LGBTQ+ political behavior.
LGBTQ+ people’s recent breathtaking advancements in rights, acceptance, and visibility make them a case study unfolding in real time of the political consequences of a group’s migration from the margins toward the mainstream.
Third, the LGBTQ+ movement’s many recent victories appear to have yielded remarkably slim gains thus far in queer people’s actual well-being. The extension of marriage rights over the past decades led to some concrete improvements for same-sex couples and their children (Karney et al. Reference Karney, Zaber, Smith, Mann, AlFakhri, Coe and Ryan2024). But mental-health disparities between LGBT teens and all other youth actually widened over the exact same period (Thompson Reference Thompson2022), and on many measures of well-being the latest generation of lesbians, gays, and bisexuals is no better off than their older cohorts (Meyer et al. Reference Meyer, Russell, Hammack, Frost and Bianca2021). The extent to which policy wins are unmet by tangible improvements in LGBTQ+ people’s lives may have important implications for their political behavior and engagement, especially given that depression and other mental health challenges can be associated with a withdrawal from political participation (Landwehr and Ojeda Reference Landwehr and Ojeda2021). Sustained research on LGBTQ+ people’s political behavior is needed to explore the connections between their lived experiences and their politics.
A CHALLENGE WE HAVE OVERCOME: SURVEYING LGBTQ+ PEOPLE
One of the reasons for the relative lack of scholarship on LGBTQ+ political behavior is that critical tools for this work—high-quality political surveys of sexual and gender minorities—have only recently become readily available. This is in part due to the difficulties arising from obtaining representative samples of LGBTQ+ people. Some of the earliest studies of LGB political behavior, like Sherrill’s Reference Sherrill1973 paper, sampled people engaged in the gay rights movement. Other surveys, such as a series of well-publicized polls conducted by Newsweek in the 1990s, relied on lesbian and gay marketing lists (Fineman Reference Fineman1993). Although valuable, samples such as these almost always suffer from selection bias toward those who exhibit relatively high levels of political engagement and a strong sense of group identification.
Avoiding this selection bias requires the painstaking step of starting with a representative sample of the entire population and asking questions of every respondent about LGBTQ identity. This brings up another challenge, which is that because sexual and gender minorities make up relatively small shares of the public, quite large general population samples are needed to yield the numbers of LGBTQ+ respondents needed for meaningful research about them. For example, Gallup’s 2024 report finding that 7.6% of the US adult population identified as LGBTQ+ required first asking more than 12,000 Americans whether they identified as heterosexual, lesbian, gay, bisexual, transgender, or something else (J. Jones Reference Jones2024). Only a handful of such large-N efforts that include questions about LGBTQ+ identities are undertaken on a regular basis in the United States, and most of them focus on public health, not politics.Footnote 5
Another challenge is that for several reasons, people who bear markers of sexual and gender minority status (such as having same-sex sexual partners or undergoing gender transition) are not consistently recorded as LGBTQ+ on surveys. This discordance is not necessarily inaccurate, as some people who exhibit these markers nevertheless consider themselves heterosexual or cisgender—identity choices that can have important political implications (Egan Reference Egan2012). But in many cases, mismeasurement of LGBTQ+ identities arises from bias and error. Social desirability bias can reduce respondents’ disclosure of LGBTQ+ identities due to fear of stigmatization, particularly in survey settings that do not afford confidentiality (Villarroel et al. Reference Villarroel, Turner, Eggleston, Al-Tayyib, Rogers, Roman, Cooley and Gordek2006). The rapid evolution of sexuality and gender identity terms and how these terms differ across cultures and languages can lead to respondent confusion and thus measurement error (Morgan et al. Reference Morgan, Dragon, Daus, Holzberg, Kaplan, Menne, Smith and Spiegelman2020). Addressing this set of challenges requires careful attention to the effects of design elements such as survey mode and question wording in the measurement of LGBTQ+ identities.
Today, questions about sexual minority identities are now included in many of the survey data sets used most frequently by scholars of American political behavior. Thanks in part to Sherrill’s efforts, the American National Election Studies now includes a question about sexual orientation; the same is true for the General Social Survey. These surveys yield relatively small samples of LGBs in any given year, but many insights can now be gleaned by pooling across survey waves. In four studies conducted from 2008 through 2020, the American National Election Studies has interviewed a cumulative total of N = 993 LGB respondents; the cumulative total in the General Social Survey is N = 789 in eight studies it conducted from 2008 through 2022. The challenge is tougher when it comes to obtaining representative samples of gender minorities, including those who identify as transgender or nonbinary. These groups currently represent such small shares of the population that the sample size of a typical national survey will yield only a handful of gender-minority respondents. As an illustration, in the three survey waves since 2018 in which the General Social Survey has asked about gender identity, just 26 people out of 8,856 respondents have identified as transgender.Footnote 6
Without question, the publicly available political survey that currently best overcomes the challenges discussed here is the Cooperative Election Study (Schaffner, Ansolabehere, and Shih Reference Schaffner, Ansolabehere and Shih2023). Conducted annually online by the YouGov survey firm, the CES employs a sample matching and weighting methodology that yields estimates approximating those obtained from nationally representative probability samples of US adults. The CES has included separate questions about respondents’ sexuality and gender identity since 2016 and added nonbinary as a response choice to its gender question in 2021. The survey interviews tens of thousands of respondents each year. This means that the CES is currently political scientists’ most comprehensive source of large, representative samples of sexual and gender minorities in the United States. All told, between 2016 and 2022 the CES interviewed a total of 618 nonbinary respondents, 4,749 people who identified as transgender, and an astounding 27,424 Americans who consider their sexuality to be lesbian, gay, bisexual, or “other.”
No survey is perfect, and the CES has some drawbacks. Although its sophisticated sampling and weighting strategy is designed to achieve representativeness (and is validated by the close correspondence of CES vote-choice estimates across the 50 states with actual election results), its sample is nevertheless an opt-in, nonprobability sample. The CES’s online survey mode provides confidentiality that reduces social desirability bias, but online surveys are more vulnerable to inattentive respondents and thus measurement error than are surveys conducted by live interviewers. Benchmarking CES estimates—or those of any survey—against “ground truth” measures of the LGBTQ population is impossible given that gold-standard sources of demographic data collected by the government (including the decennial US Census and the American Community Survey) do not ask about sexual orientation or gender identity. Despite these shortcomings, political scientists are beginning to take advantage of the obvious strengths of the CES for studying LGBTQ+ political behavior (e.g., P. Jones Reference Jones2021, Reference Jones2023; Strode and Flores Reference Strode and Flores2021; Strolovitch, Wong, and Proctor Reference Strolovitch, Wong and Proctor2017). Below I further illustrate the kinds of analyses made possible by the breadth of the CES.
ENGAGING IN “LUMPING” AS WELL AS “SPLITTING”
To the exhortation that we expand the body of political science scholarship documenting and explaining the political behavior of LGBTQ+ people, let me add another: in this work, we would do well to pursue “lumping” as well as “splitting.” The distinction between these two research perspectives has been noted in political science (Christensen and Laitin Reference Christensen and Laitin2019) as well as other fields including history (Hexter Reference Hexter1975) and biology (Diamond Reference Diamond1994). As sociologist Richard Scott (Reference Scott1991, 40) writes, lumpers “seek to construct categories that exhibit uniformity within and reveal distinctions between.” In contrast, splitters “focus on the exceptions. They see as much diversity within as between categories, and emphasize the variety and cacophony of human efforts.” Another way to put it: splitters tend to document the uniqueness of one case at a time, whereas lumpers compare cases to see how similar and different they are.
Both approaches are needed for understanding political phenomena. But thus far, the thrust of scholarship regarding LGBTQ+ political behavior has been largely to “split” queer people off as an isolated focus of research rather than to “lump” them in comparison with other political groups. This is completely understandable: with the tools and data finally in our hands, political scientists have been eager to give LGBTQ+ people the spotlight in our scholarly research. In doing so, splitters are bringing forth many vital and important insights about queer political behavior. But unless this splitting is complemented by some lumping, our findings can miss important aspects of the political landscape faced by LGBTQ+ people. Recent lumping research has helped put LGBTQ+ political distinctiveness in context by making explicit comparisons with groups defined by race and ethnicity, religion, class, and other relevant political attributes. These comparisons have included voting behavior (Strolovitch, Wong, and Proctor Reference Strolovitch, Wong and Proctor2017), the malleability of identities to political affiliations (Egan Reference Egan2020), and how political awareness moderates the links between group identification and political attitudes (P. Jones Reference Jones2023).
ILLUSTRATING THE POSSIBILITIES
The time is ripe for scholarship on LGBTQ+ political behavior that takes advantage of newly available large-N survey data, is attentive to LGBTQ+ people’s lived experiences in the wake of substantial advancements in policies and attitudes, and that lumps together as well as splits off LGBTQ+ people in comparison with other identity groups. Here I provide a glimpse of the insights that these approaches can reveal. The following analysis employs the 2022 CES, conducted during that year’s US midterm election campaign (Schaffner, Ansolabehere, and Shih Reference Schaffner, Ansolabehere and Shih2023). The CES’s 2022 Common Content data set includes 60,000 US adults, 45,240 of whom provided complete responses to all questions employed in this analysis.Footnote 7 The CES includes three survey items relevant to identifying LGBTQ+ people. First, the CES sexuality question asks respondents how they describe their sexuality, with choices of straight, lesbian or gay, bisexual, other, and prefer not to say. Second, the transgender item asks respondents if they identify as transgender, with choices of yes, no, and prefer not to say. Third, the CES’s gender question provides respondents with the choices man, woman, nonbinary, or other.
The time is ripe for scholarship on LGBTQ+ political behavior that takes advantage of newly available large-N survey data, is attentive to LGBTQ+ people’s lived experiences in the wake of substantial advancements in policies and attitudes, and that lumps together as well as splits off LGBTQ+ people in comparison with other identity groups.
According to their answers to these three items, a total of N = 5,213 respondents (comprising 11.5% of the weighted sample) were sexual or gender minorities in the 2022 CES. That is, as shown in Table 1, they identified their sexuality as lesbian, gay, bisexual, or other; specified that they were transgender; or said that they were nonbinary. (Many chose more than one of these identities; see Online Appendix Table A1 for details.) The breadth of these identity choices represents an advance in measurement, as there is very little work on LGBTQ+ political behavior that incorporates those choosing “other” when specifying their sexuality or those identifying as nonbinary (although see Albaugh et al. 2024). These two groups turn out to account for substantial shares of the LGBTQ+ population (at 13.3% and 4.9%, respectively).
Identities among the LGBTQ+ Population in the 2022 CES

Note: Respondents could choose more than one of these categories and thus the percentages total to greater than 100%. See Online Appendix Table A1 for details.
To develop a comprehensive portrait of these groups, I employ items drawn from the CES’s wide range of questions about politics, well-being, and lived experience, constructing five indices from these survey questions using principal components analysis. The first two measures reflect topics—political attitudes and political participation—of long-standing interest to scholars of political behavior. First, I developed an index of political conservatism from responses to the large number—55 in total—of policy preference questions on the 2022 CES. Second, I constructed a political engagement index from respondents’ factual knowledge about US politics, their self-reported interest in politics, whether they were validated as registered to vote and validated as having voted in the 2022 primary and general elections, and their participation in extra-electoral activities such as volunteering for a campaign or attending political protests or meetings. The remaining three indices have to do with measures of well-being and lived experience that bear on political behavior. Given the importance of religion in American politics, I constructed an index of religiosity from responses to questions about the personal importance of religion and frequency of religious practices. Fourth, a measure of health was developed from a pair of items asking respondents to assess their physical and mental health. Finally, a measure of socioeconomic status (SES) was constructed using respondents’ educational attainment, their household income, and their answers to questions about how they would cover an emergency expense. Each of the five indices was converted into percentiles based upon the distribution of their values in the entire US adult population. See the Online Appendix for details.
Splitting
I calculated the mean percentile scores for all sexual and gender minorities as a group on each of these five indices. I then engaged in the splitting exercise of repeating these calculations across each of seven LGBTQ+ groups.
Figure 1 displays these calculations (with red markers denoting the overall means for the entire LGBTQ+ population).Footnote 8 It shows a fair amount of variation among the seven sexual and gender minority groups, reflecting the diversity that previous work has found in studying the politics of the LGBTQ+ coalition (e.g., P. Jones Reference Jones2021; Strolovitch, Wong, and Proctor Reference Strolovitch, Wong and Proctor2017). Nonbinary people are particularly distinctive as the most liberal, least religious, lowest SES, and in the poorest health of all groups in the coalition. In line with the observations made 25 years ago by Jennings in his APSA presidential address, gay men are the most politically engaged and have the highest SES of all LGBTQ+ groups. They are also the group reporting the highest levels of overall physical and mental health, which represents a dramatic shift from the days of the AIDS epidemic.
Nonbinary people are particularly distinctive as the most liberal, least religious, lowest SES, and in the poorest health of all groups in the coalition.
Characteristics of Groups Making Up the LGBTQ+ Population, 2022
Source: 2022 Cooperative Election Study.
Note: Displayed are the mean values of the characteristics of each group expressed as national percentiles. Survey conducted only in English.

The figure demonstrates the merits of splitting sexual and gender minority groups off as a focus for isolated analysis. It shows, for example, substantial intergroup differences on the two political dimensions, and that gay men and lesbians are set off from other members of the LGBTQ+ coalition on several of the indices. The data are just a first cut at what can be learned about the LGBTQ+ coalition with a large-N survey like the CES. More detailed, intersectional analyses—for example, examining the differences and similarities of LGBTQ+ groups by race and ethnicity or by generational cohort—would be feasible by pooling surveys across multiple years, given that as noted above the CES has to date interviewed more than 30,000 sexual and gender minority respondents since 2016.
Lumping
A glance at figure 1 hints that sexual and gender minorities may be distinctive from other Americans on a number of political and social dimensions, but it is impossible to know this for sure unless these measures are compared with other groups. I therefore turn to the lumping exercise of putting the numbers for LGBTQ+ people in context, following in a long political science tradition—one at least as old as academic political survey research itself—that draws comparisons among politically relevant blocs (e.g. Berelson, Lazarsfeld, and McPhee Reference Berelson, Lazarsfeld and McPhee1954; Campbell et al. Reference Campbell, Converse, Miller and Stokes1960). I calculate the means of the five index scores for each of the nation’s largest racial and ethnic groups (those identifying as non-Hispanic white, Black, Hispanic, Asian, Native American, Multiracial, and other) and largest religious groups (those identifying as Protestant, Roman Catholic, Mormon, Jewish, Muslim, agnostic or atheist, and—in a separate survey question—born-again Christian). Some of the findings should be taken with a grain of salt because the 2022 CES was conducted only in English, likely curtailing the representativeness of the samples of some of these groups—particularly Asians, Hispanics/Latinos, and Muslims—in the survey. I plot each group’s mean scores alongside the means for the entire LGBTQ+ population in figure 2.
Characteristics of the LGBTQ+ Population Compared with Racial, Ethnic, and Religious Groups, 2022
Source: 2022 Cooperative Election Study.
Note: Displayed are the mean values of the scores of each group expressed as national percentiles. Survey conducted only in English.

The figure confirms that LGBTQ+ people are indeed marked by striking distinctiveness on several key dimensions. The average policy preference score among LGBTQ+ people falls just above the 30th percentile of conservatism, placing this population as more liberal than all other groups except agnostics and atheists. LGBTQ+ people are less religious on average than all other groups except (again) agnostics and atheists. The self-reported physical and mental health of sexual and gender minorities puts them at the very bottom of the national distribution by a substantial margin relative to all other groups. Belying many stereotypes, the mean political engagement scores and SES for LGBTQ+ people are not much different from the national medians on these two dimensions. The political engagement finding comes as some surprise, given that previous work has found LGBTQ+ people exhibiting higher levels of participation than the rest of the population (e.g. Egan, Edelman, and Sherrill Reference Egan, Edelman and Sherrill2008; Moreau, Nuño-Pérez, and Sanchez Reference Moreau, Nuño-Pérez and Sanchez2019; Swank Reference Swank2019). The discrepancy may be in part because past studies have emphasized extra-electoral participation, such as attending meetings or protests, rather than measures of more conventional types of engagement included here, such as voter turnout and political knowledge.
In their distinctiveness, LGBTQ+ people present some fascinating contradictions. They hold dramatically progressive political views, but they do not evince particularly high levels of political engagement. They suffer from worse health and are more likely to reject religion than most other Americans while achieving socioeconomic status that is remarkably near the median. Awareness of these contradictions—which may surprise even the most seasoned LGBTQ+ activists and organizers—is made possible only by the lumping exercise of intergroup comparisons.
In their distinctiveness, LGBTQ+ people present some fascinating contradictions. They hold dramatically progressive political views, but they do not evince particularly high levels of political engagement. They suffer from worse health and are more likely to reject religion than most other Americans while achieving socioeconomic status that is remarkably near the median.
Placing LGBTQ+ People on the US Political Map
Spatial representations have long been a staple of how political scientists depict and understand political systems. In his own APSA presidential address, Henry E. Brady praised these models for their utility in helping to “identify political factions, represent potential political cleavages, and suggest political dynamics and political realignments” (Brady Reference Brady2011: 312). Here I follow Brady’s example and as a final demonstration of what we can learn by studying queer political behavior, I employ data-reduction techniques to place LGBTQ+ people along with all the other groups on a two-dimensional map of American politics.
I conducted an exploratory factor analysis of all CES respondents’ scores on the five indices, which yielded rotated factor loadings on two dimensions.Footnote 9 Although the data-reduction process was inductive rather than theory-driven, it produced two intuitive, readily interpretable dimensions.Footnote 10 Unsurprisingly, a first factor derived chiefly from the religiosity and conservatism indices corresponded closely to the left–right dimension that is the signature feature of the highly polarized US political system. The second factor reflected the fact that SES, political engagement, and to a lesser extent health outcomes are all positively correlated in the American public, and that they are currently only weakly related to where people lie on the liberal–conservative axis. Thus, whereas the first dimension tells us how groups differ regarding ideology, the second tells us how they differ with respect to another politically relevant factor: economic and social resources, and engagement with the political system that tends to accompany these resources.
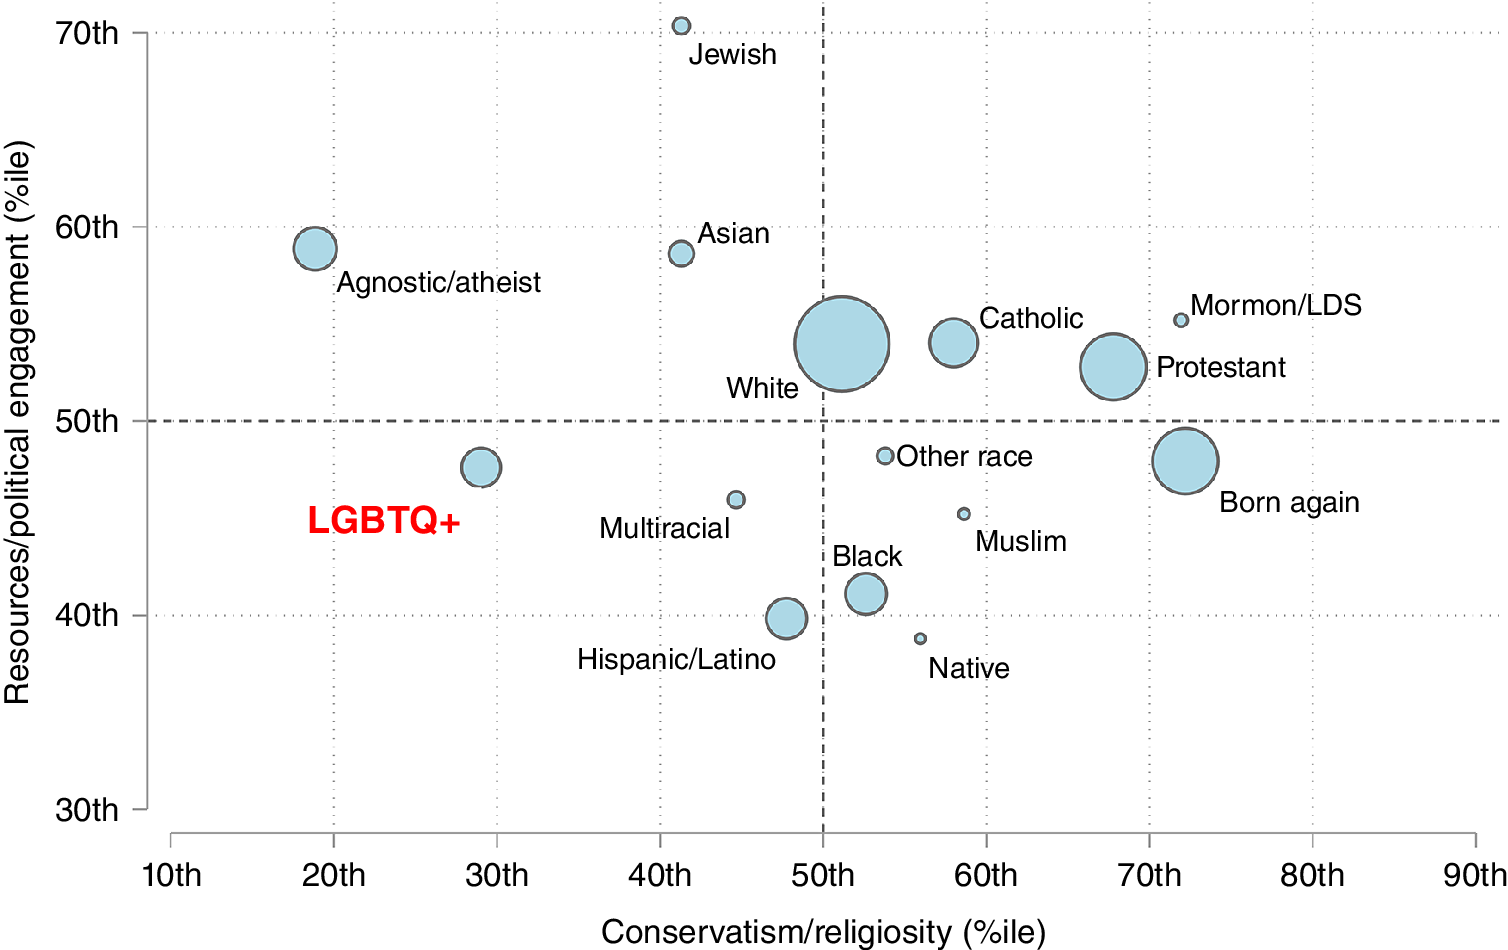
Figure 3 plots each group’s mean score on these two dimensions, denoted respectively as “conservatism/religiosity” on the horizontal axis and “resources/political engagement” on the vertical axis. As before, scores are expressed in terms of national percentiles. Markers on the map are scaled to the groups’ relative population sizes.
Placing the LGBTQ+ Population on the Spatial Map of US Politics
Source: 2022 Cooperative Election Study.
Note: Displayed are the mean values of the characteristics of each group on the two dimensions expressed as national percentiles. Markers are scaled to relative size of groups in the national population. Survey conducted only in English.

Figure 3 places the LGBTQ+ coalition in a rather isolated spot on the political map. LGBTQ+ people are far to the left on the conservatism-religiosity dimension. But unlike other secular, left-leaning groups such as agnostics and atheists, Jews, and Asians, the LGBTQ+ population falls below the median in terms of resources and political engagement. An intuitive feature of the map is that groups proximate to one another on the diagram can reasonably be expected to be likely to share similar interests. In this respect, the wider dispersion on the map of groups in the Democratic Party’s coalition relative to that of those in the Republican Party confirms the notion that the Democrats manage a much more variegated set of identity groups than the Republicans (Grossman and Hopkins Reference Grossman and Hopkins2016). This may be unwelcome news for LGBTQ+ people, as their remote location on the map suggests they do not have natural coalition partners and travel farther than most in finding common cause with other groups. This includes important Democratic Party allies, such as Black, Hispanic/Latino, and other voters of color, who the map indicates are substantially more culturally conservative than LGBTQ+ people.
CONCLUSION
Due to a lack of interest and lack of data, empirical political science was woefully slow in devoting attention to LGBTQ+ issues. Ken Sherrill’s Reference Sherrill1973 APSA paper opened the metaphorical closet door on these topics by just a crack; five decades later, that door is wide open today. The range of possibilities now available to scholars of LGBTQ+ politics regarding which topics to address, which methods to employ, and which data to analyze would be the envy of any of the small band of political scientists joining Sherrill on the research frontier in the 1970s. Of the many choices scholars can make, the decision to conduct research that focuses on the political behavior of LGBTQ+ people themselves is now more feasible than ever, and it remains just as important as ever. With the analyses here, I gesture at the kinds of findings that are possible when we harness the power of big-N representative sample surveys that make it feasible to conduct detailed, comprehensive studies of LGBTQ+ people’s political behavior and place it in context of that of other politically relevant groups.
Ken Sherrill himself often marveled at, and reveled in, the empirical advances that transpired over the course of his career—advances, of course, that he himself helped bring to fruition with his indefatigable efforts (see Tronto Reference Tronto2024). I can think of no better way for our discipline to honor Ken’s legacy than to persevere in our efforts to unearth new discoveries and insights that center LGBTQ+ people and political behavior.
SUPPLEMENTARY MATERIAL
To view supplementary material for this article, please visit http://doi.org/10.1017/S1049096524001288.
ACKNOWLEDGMENTS
I thank special issue editor Scott Siegel and two anonymous reviewers for their helpful feedback. I fondly acknowledge my friend, coauthor, and mentor Kenneth Sherrill (1942–2023), with whom I enjoyed years of rich and lively conversations and collaborations on the topics discussed here.
DATA AVAILABILITY STATEMENT
Research documentation and data that support the findings of this study (Egan Reference Egan2024) are openly available at the PS: Political Science and Politics Harvard Dataverse at https://doi.org/10.7910/DVN/69MTYM
CONFLICTS OF INTEREST
The author declares no ethical issues or conflicts of interest in this research.




 Open access

