


1. INTRODUCTION
Armies have frequently intervened in politics. Ranging from the prominent political role played by several European and Latin American armies in the 19th century to the most recent military coups that have taken place throughout the developing world, armed forces have affected the fate of many governments and political regimes worldwide. The available information on coups d’état in developing countries clearly shows the political importance of the army. According to Decalo (Reference Decalo1989), only twelve African states (20 per cent of the countries in the region) kept a civilian government in power without being disrupted by a military takeover for more than 25 years after independence. Nordlinger (Reference Nordlinger1977) considered that Costa Rica and Mexico were the only Latin American countries free from «praetorian» soldiers from 1945 to the late 1970s, whereas half of the eighteen Asian states suffered successful coups in the same period. Analysing the whole world, Powell and Thyne (Reference Powell and Thyne2011) register 457 coup attempts in ninety-four states from 1950 to 2010 (227 of them successful), whereas Bove and Nisticò (Reference Bove and Nisticò2014) report fourteen additional coup attempts (five of them successful) from 2010 to 2014.
Military uprisings also plagued Spanish politics during much of the 19th century, with a total of twenty-nine (successful or failed) coups or pronunciamientos registered between 1833 and 1874. This was not surprising in a country characterised by a semi-democratic political system with low levels of social legitimacy and widespread poverty and illiteracy. All these factors, according to the political science literature, are conducive to a high likelihood and frequency of coups d’état (e.g. Finer Reference Finer1961; Nordlinger Reference Nordlinger1977; Luttwak Reference Luttwak1979; Londregan and Poole Reference Londregan and Poole1990; Belkin and Schofer Reference Belkin and Schofer2003; Powell Reference Powell2012; Piplani and Talmadge Reference Piplani and Talmadge2016). However, somewhat surprisingly, the frequency of coups decreased dramatically after 1874. The Bourbon Restoration (1874-1923), despite not bringing with it any significant improvement in the country's level of economic development or democracy (at least not until the 1890 suffrage reform) coincided with the virtual eradication of coups d’état from the country.
Most historians consider that the disappearance of military uprisings was the result of the new political system designed by Cánovas del Castillo, the main political leader of the Restoration (e.g. Headrick Reference Headrick1981; Busquets Reference Busquets1982; Seco Serrano Reference Seco Serrano1984; Fernández Bastarreche Reference Fernández Bastarreche2006). Unlike what had happened in earlier periods, when electoral fraud blocked any possible change in the parliamentary majority and the opposition relied on military officers to be raised to power, from the mid-1870s onwards the main parties agreed to share power in what was called the turno pacífico (pacific turn). Thus, the bulk of the former political opposition lost the incentives to «drag the military into politics», and this would have substantially reduced the risk of coups.
This, however, explains only half of the picture. It clarifies why politicians wanted the military in politics before the Restoration and not afterwards, but not the decline in the army's willingness to act. Actually, during the Bourbon Restoration there were also minority parties (such as the Republicans) that were systematically excluded from the turno pacífico and also depended on the military to achieve power. However, after 1874 most generals did not respond to these parties' petitions, and the Republicans were only able to promote four failed coup attempts during the 1880s. Thus, a complete explanation of the sudden reduction in the frequency of coups would require an analysis not only of modifications in the operation of the political system, but also of potential changes in the Spanish army's motives to intervene in politics.
According to the political science literature, armies' incentives to revolt against governments would be largely associated with the defence of its corporate interests, from the safeguard of its autonomy and corporate status to the redistribution of public resources in its favour (e.g. Finer Reference Finer1961; Nordlinger Reference Nordlinger1977; Acemoglu et al. Reference Acemoglu, Vindigni and Ticchi2010; Powell Reference Powell2012). Thus, in order to reduce the frequency of coups, governments should develop coup-proofing strategies. These might be directed either at overcoming the motives for military intervention through «spoiling» (i.e. increasing resources, promotion policies, etc.), or at harming the army's capacity to organise coups by establishing security forces under direct civilian control, dividing the military into rivalling organisations, reducing the size of the army, engaging in diversionary interstate conflict, rotating command positions or purging officersFootnote 1.
Some previous research has suggested that the lack of successful military coups in Spain after the 1874 Restoration was precisely associated with a coup-proofing strategy based on higher wages and promotions. Headrick (Reference Headrick1981), for instance, indicated that the Restoration governments improved the material conditions of officers to gain their acquiescence. However, other authors, such as Fernández Bastarreche (Reference Fernández Bastarreche2006), suggest instead that the Restoration's containment policy on military spending had a negative impact on the wages and social consideration of the military during the last quarter of the 19th century. Nonetheless, so far, a rigorous analysis of the role played by military expenditure as a coup-proofing strategy in the Spanish Restoration has been prevented by insufficient data on military wages.
In this paper, we provide new quantitative data on officers' remunerations, which suggest that military spending was used by the Restoration governments to improve officers' wellbeing and to overcome some of the grievances that had brought the military into politics in previous decades. We also provide new qualitative evidence (based on parliamentary debates and the military press) showing that both Spanish politicians and the military admitted a close connection between the military's loyalty and their wellbeing. On the basis of these pieces of complementary evidence, we suggest that the reduction in coup risk might have been at least partially associated with a conscious budget policy, aimed not at increasing total military expenditure (which actually stagnated during most of the Restoration period), but at the steady improvement of payments to officers. Even if the concentration of military spending on officers' remunerations was probably detrimental to the Spanish army's military capacity abroad, we argue that it might have been part of a coup-proofing strategy. Accompanied by other government concessions to the army in military policy, such as an increase in the army's control of its own affairs, it might have contributed to the prevention of successful new pronunciamientos for almost half a century.
Besley and Robinson (Reference Besley and Robinson2010) argue that governments must choose between two main competing options to avoid coups: accept all military demands by creating a powerful army (which could be dangerous in case of a conflict with the civilian authorities) or disdain their claims and create a tin pot army (i.e. a rather unimportant army, which is not powerful enough to threaten the government, but is not very useful in the case of international warfare). In the same vein, Talmadge (Reference Talmadge2015) considers that the most efficient coup prevention measures are those that are more detrimental to military organisational strength, whereas other authors, such as Acemoglu et al. (Reference Acemoglu, Vindigni and Ticchi2010), Wang (Reference Wang1998) or Feaver (Reference Feaver1999), acknowledge the risk that strong armies pose to civilian authorities. Restoration Spain might represent another variation of this dilemma: governments agreed to favour officers (who had been the main threat to previous governments), but without creating a powerful army. Thus, by concentrating scarce resources in officers' compensations, Spanish governments would have favoured political stability while sacrificing the country's military capacity abroad. This was probably a rational choice in a context of low fiscal resources and the rather unambitious foreign policy of a country which, by 1874, had given up any intention to play a relevant role in the international arena.
Although for a different period, our results are consistent with recent research by La Parra-Pérez (Reference La Parra-Pérez2020) on the Spanish Civil War, who observes that the officers who gained from military reforms and those with greater promotions were those least likely to support the 1936 Spanish coup d’état that led to the war. Thus, the case of Spain in the late 19th and early 20th centuries partially runs against the literature's claim that there is a positive relationship between devoting resources to the army and the risk of a coup. They show instead that a fiscal effort addressed to officers' welfare (rather than military power) might contribute to the prevention of new coups without strengthening the military apparatus.
The paper is structured as follows. The next section describes the history of Spanish coups, whereas section 3 reviews some qualitative evidence linking the risk of coups during the Restoration with government policies regarding the military's welfare. To support this link, section 4 provides new data on payments to army officers. Based on these data, section 5 provides a global review of the coup-proofing strategies of the Restoration regime and tests the relationship between the remuneration of officers and the frequency of coups in a regression setup. Section 6 concludes.
2. SPANISH COUPS D’ÉTAT FROM 1833 TO 1923
After King Fernando VII's death in 1833, Spain became a constitutional monarchy. Isabel II's reign (1833-1868) was the first long-lasting parliamentary regime in the country, after two short-lived liberal attempts undertaken during the Independence War against Napoleon (1808-1814) and the so-called Liberal Triennium (1820-1823). The 1834 Royal Statute (Estatuto Real) established that sovereignty would be shared by the parliament (Las Cortes) and the Crown, whereas the 1837 Constitution included the first systematic bill of rights in Spanish history. The lower chamber of the parliament (Congreso de los Diputados) acquired the legal authority to pass laws, even though the king kept important prerogatives, such as the right to veto, the right to dissolve parliament and the right to designate and remove ministers. In line with other European constitutions at the time, political participation was severely restricted to property owners and the wealthy.
The Spanish liberal regime had been troubled since the beginning by recurrent political and social instability. Its first 7 years were thrown into turmoil by a civil war against the Carlists, absolutist supporters of the self-proclaimed Carlos V, Fernando VII's brother. Even though the war ended in 1839-1840 with the defeat of Carlism and an agreement between both contenders (Convenio de Vergara), the Carlists revolted again in 1847-1849 and 1872-1876. In this context of internal instability, the Spanish army was mainly devoted to containing domestic turmoil during the first decades of the liberal regime. Despite the creation of two paramilitary corps devoted to guarding the coasts and borders (Carabineros) and the protection of rural roads and properties (Guardia Civil), the army kept broad prerogatives concerning public orderFootnote 2. In this regard, as early as 1835, the parliament established the first state of siege regulation, later extended to the state of war, according to which the military would become the legal authority in times of major domestic turmoil.
This contrasts with the low international activity of the Spanish army. Despite joining the so-called Quadruple Alliance in 1834 with Great Britain, France and Portugal, Spain remained neutral in most international conflicts (such as the Belgian and Greek independence wars, the Crimean War, the Italian and German unification wars, etc.). It was not until the late 1850s when the Spanish army engaged in several military interventions, such as those in Conchinchina (1858-1862), Mexico (1861-1862), Morocco (1859-1860), Santo Domingo (1863-1865) and the so-called Naval War (1865-1866). However, the army only obtained a significant territorial gain in Morocco, even though it hardly compensated for the 10,000 casualties and 3,000 million reales the conflict cost (Vilar Reference Vilar and Pereira2003). Later interventions abroad were aimed at fighting colonial revolts in Latin America and Northern Africa, such as the Ten Years War in Cuba (1868-1878), the Small War in Cuba (1879-1880), the Melilla Insurrection (1893) and the Cuban War of Independence (1895-1898). The only war fought against another western country was the Spanish-American War against the United States in 1898, which ended in a few months with a resounding defeat (Torre del Río Reference Torre Del Río and Pereira2003; Puell de la Villa Reference Puell de la Villa2006; Vilar Reference Vilar and Pereira2003).
The combination of weak democracy, low social legitimacy and an army focused on domestic objectives, together with the absence of successful international military operations, created a propitious context for military interventions in politics. Figure 1 shows the attempted and successful coups d’état in Spain from 1831 to 1920 in 5-year periods. Coup attempts refer to military actions of insubordination explicitly aimed at overthrowing the government in favour of a new executive or designed to threaten the government in order to force a policy change. Successful coups are those that succeeded in expelling the government or in forcing the desired policy change. As could be expected, Spain was severely hit by military interventions during most of this period. The 1830s and the first half of the 1840s saw almost one coup attempt per year, with a success ratio above 40 per cent. In the next four quinquennia the regime reduced its exposure to military uprisings to 0.4 coups per year, whereas in the second half of the 1860s and the first half of the 1870s the military returned to former levels of intervention.
COUPS D'ÉTAT IN SPAIN (1831-1920).
Source: Linz et al. (Reference Linz, Montero, Ruiz, Carreras and Tafunell2005).

By contrast, military coups almost disappeared after the mid-1870s. From 1874 to 1922 there were only four failed coup attempts, all of them in the 1880s, and it was not until 1923 when the military intervened again with General Miguel Primo de Rivera's coup d’état, which was the starting point of a military dictatorship of 7 years (1923-1930).
According to most scholars, this evolution can be explained by changes in the institutional design of the Spanish political system (Headrick Reference Headrick1981; Busquets Reference Busquets1982; Seco Serrano Reference Seco Serrano1984; Fernández Bastarreche Reference Fernández Bastarreche2006). During Isabel II's reign (1833-1868) elections were based on a very restricted census suffrage. Except for the 1836 election, in which the queen was forced to accept an extension of voting rights, all subsequent elections until 1868 were characterised by a very small electorate and widespread fraud. The liberal left-wing opposition (initially organised under the Progressive Party, and since 1849 under the more leftist Democratic Party) could not obtain power under the established political rules, because electoral fraud blocked any possible change in the parliamentary majority. To overcome this blockade, the opposition relied on military officers to help them gain power: the progressive governments established in 1836, 1840 and 1854 began with coups d’état led by military officers (the last two by General Baldomero Espartero, who even became regent of the kingdom from 1840 to 1843).
Similarly, the right-wing liberals (organised around the Moderate Party) put an end to these progressive episodes (that generally involved expanding voting rights to the middle classes) by resorting to the army. The long periods of moderate government initiated in 1843 and 1856 started with military interventions under the leadership of Generals Ramón María Narváez and Leopoldo O'Donnell respectivelyFootnote 3. All these coups have been called pronunciamientos, in which a group of generals (and in some occasions other lower-grade military officers) organised a plot to overthrow the government on behalf of an opposing political faction. In none of these cases did the plotters aim to implement a military dictatorship. They behaved instead as «spokespeople and military branches of political groups, and invariably after being required by them» (Seco Serrano Reference Seco Serrano1984, p. 81). According to Puell de la Villa (Reference Puell de la Villa2006), the plotters expected to accomplish their objectives without fighting; they aimed to obtain the tacit or explicit support of the rest of the army during the hours following the beginning of the coup. If several military units (particularly those based in the capital, Madrid) openly confronted the coup, the plotters generally gave up their plans and tried to go into exile.
The 1868 Glorious Revolution started a period of extended democracy but high social and political instability. The mobilisation of the progressive liberal opposition, once again led by a group of generals (among them, General Juan Prim y Prats, later president of the government), ended Isabel II's reign and established a new liberal monarchy under Amadeo I of Savoy. After 2 years of political turmoil, Amadeo resigned and an equally short-lived Republican regime was established (1873-1874). Suffrage was extended to all adult men (see Figure 2) and civil rights were significantly expanded. Nevertheless, monarchical and conservative factions conspired to overthrow the new political regime: as can be seen in Figure 1, coup attempts increased dramatically during this period. The pronunciamientos of Generals Manuel Pavía and Carlos Martínez Campos in 1874 ended the First Republic and restored the Bourbon monarchy.
POLITICAL PARTICIPATION IN SPAIN (1831-1920).
Notes and sources: Number of electors as a share of total population (left axis, continuous line) and Vanhanen's index of democracy (right axis, dotted line). The percentages of electors are estimates based on Linz et al. (Reference Linz, Montero, Ruiz, Carreras and Tafunell2005). The Vanhanen's democracy index, which is based on a combination of political participation and competition, can be found at https://www.prio.org/Data/. According to Vanhanen, an indicative threshold value for democracy would be 5 (even though it also requires minimum values of each of its components).

According to most authors, the new Restoration regime (1874-1923), designed by the conservative politician Antonio Cánovas del Castillo, removed the former political conditions that had favoured pronunciamientos (Headrick Reference Headrick1981; Busquets Reference Busquets1982; Seco Serrano Reference Seco Serrano1984; Fernández Bastarreche Reference Fernández Bastarreche2006). Two hegemonic political parties (conservative and liberal) agreed to alternate in power in what was called the turno pacífico. Fraudulent elections were organised in order to ensure this turn-taking in government, which excluded the leftist parties (such as the Republicans) and the more traditionalist factions (such as the Carlists). As indicated above, a consequence of the turno pacífico was that the majority of the former political opposition lost the incentives to resort to the military to access power. Although political participation was extended to all adult men in 1890, the voting system continued to be manipulated through bribery and fraud (see Figure 2).
Nevertheless, although this narrative describes a political context particularly favourable to coups d’état before 1874 (but not thereafter), it does not identify the incentives that the military had to intervene in politics. In this regard, historians have often suggested that Spanish officers revolted largely due to their ideology. In the wake of the Independence War against Napoleon in 1808-1814, the Spanish army had become a heterogeneous social institution. The officer corps no longer consisted exclusively of the sons of aristocratic families, but also included promoted soldiers and guerrilla members who had fought in the war (Busquets Reference Busquets1982; Seco Serrano Reference Seco Serrano1984; Cepeda Gómez Reference Cepeda Gómez1999). Despite Fernando VII's efforts to isolate these new officers and return to an Old Regime army, non-aristocratic officers became increasingly abundant in the military forcesFootnote 4. These new military actors, generally belonging to families of small landowners and professionals, gave their support to the liberal factions during absolutism, and later, during Isabel II's reign, they divided their loyalty between the Moderate and Progressive parties.
The experience of the revolutionary period (1868-1873), whose governments also received the initial support of well-known officers, would have gradually changed the military's inclination to engage in political disputes. According to some authors, promises to abolish military conscription during the First Republic (1873-1874) ended up in revolts and mutinies, at a time when military discipline was relaxed and the troops (mainly composed of recruits) could not be easily commanded. Several laws and legislative projects, such as the creation of the so-called Volunteers for Liberty (Voluntarios de la Libertad)—a popular militia—, or the (failed) announcement of the dissolution of the army made by Barcelona's provincial government (Diputación de Barcelona), frightened the officers. Once the monarchy had been restored in 1874, most rejected the prospect of another democratic republic, and the army's hierarchy started to appreciate the stability of the Restoration system (Headrick Reference Headrick1981; Seco Serrano Reference Seco Serrano1984; Puell de la Villa Reference Puell de la Villa, Tusell and Portero1998).
Nevertheless, ideology does not seem to exhaust the military's reasons to revolt. Some scholars have also pointed out the importance of the army's corporative interests to understand the dynamics of the pronunciamientos, and there is abundant evidence linking the military's welfare and their propensity to political intervention. In this regard, and despite the political changes introduced by the Restoration regime, the army might have remained a permanent threat to political stability, and avoiding pronunciamientos would have required successive governments to apply specific coup-proofing measures. In the next sections, we analyse the available literature on this issue and some qualitative and quantitative evidence that would be consistent with the link between the military's welfare and their inclination to get involved in coups d’état.
3. COUP RISK IN RESTORATION SPAIN: SOME QUALITATIVE EVIDENCE
The army's corporatist motivations might be related to general grievances felt by the military as an institution or to individual officers' self-interest. In the case of 19th-century Spain, historians have often stressed the importance of the plotters' self-interest over the army's general institutional claims. Actually, the army as such played a relatively modest role in Spanish coups, since these were usually organised and executed by a small group of generals or officers on their own initiative (Puell de la Villa Reference Puell de la Villa2006). Moreover, even if there were some common problems affecting the whole Spanish army, each military branch and stratum had its own interests, often contradictory with others. For instance, recruits were generally willing to see themselves discharged from the burden of military service, whereas officers wanted more soldiers to accomplish their missions. Similarly, the faculty corps (artillery and engineers) defended their own promotion systems, based strictly on length of service, against attempts to expand the infantry's system (which was based, in theory, on merit and, in practice, on political criteria) to the whole army.
In the case of officers, claims related to opportunities of promotion were especially relevant. By 1814, after the war against Napoleon, the Spanish army had an overcrowded officer corps. A new generation of wartime officers disproportionally inflated the hierarchy relative to the remaining number of troops. The First Carlist War (1833-1840) worsened the situation, as the number of officers increased dramatically due to the government's commitment to hire those who had fought in the Carlist faction and wanted to remain part of the Spanish army. Headrick (Reference Headrick1981) estimates the ratio of soldiers to officers in 19th-century Spain as 6 to 10 in peacetime, whereas at the end of the 1880s it was 24 in Germany, 20 in France and 18 in Italy. As a consequence, promotions in peacetime periods became very unusual by the mid-19th century, and those members of the armed forces who wanted to develop their professional career were severely frustrated (Headrick Reference Headrick1981; Puell de la Villa Reference Puell de la Villa2006).
The excessive number of officers not only discouraged the professional ambitions of the staff but also kept individual remunerations low, even in those years when the total military budget was relatively high (Puell de la Villa Reference Puell de la Villa2000; Sabaté Reference Sabaté2016). According to Headrick (Reference Headrick1981), officers received a very low salary that forced them to search for complementary sources of income, including begging in some extreme cases. Puell de la Villa (Reference Puell de la Villa2006) also points out that most officers received lower salaries than civil servants of equivalent level. In this context, pronunciamientos became a way to improve the plotters' wellbeing. Given that successful coups systematically ended up with promotions and awards for those officers that took active roles in the uprisings, coups d’état were seen as one of the main mechanisms to move up the chain of command in peacetime (Headrick Reference Headrick1981).
In this regard, Headrick (Reference Headrick1981) suggested that the lack of successful military coups after the 1874 Restoration was related to a coup-proofing strategy based on higher wages and promotions. He indicates that the Restoration governments, aware of the importance of ending the long-lasting tradition of military intervention in politics, decided to improve the material conditions of officers to buy their loyalty to the new regime. Thus, Alfonso XII's proclamation in 1875 was followed by general promotions, whereas officers' wages were increased during the 1870s and the 1880sFootnote 5.
However, not all historians agree with this interpretation. Fernández Bastarreche (Reference Fernández Bastarreche2006) suggests instead that the Restoration's containment policy in military spending had a negative impact on the wages and social consideration of the military during the last quarter of the 19th century. According to him, this helps to explain the military's increasing hostility towards the civilian governments, which ended up in Primo de Rivera's coup in 1923 and the subsequent dictatorship. Even though he recognises some nominal wage increases at the beginning of the Restoration regime, these were not large enough to avoid a relative decline of military salaries, compared with civilian wages. Similarly, in his analysis of the Spanish army during the first decades of the 20th century, Cachinero (Reference Cachinero1988) also argues that low salaries and scarce opportunities of promotion (together with other claims related to the fighting capacity of the army) remained as the main grievances of the military institution.
Historians therefore do not agree on whether wage increases were used as a coup-proofing strategy during the Bourbon Restoration. In order to disentangle this puzzle, we proceed in two steps. First, in this section we provide new qualitative evidence showing, on the one hand, that the political leaders of the new regime were well aware of the need to find preventive solutions to military coups and, on the other hand, that the military made a close association between their welfare and their loyalty to the regime, and that they therefore never stopped representing a potential threat to government stability. Second, the next section provides new quantitative data on payments to military officers, to check whether wage increases could have acted as a containment policy for that threat during the Restoration period.
Indeed, political leaders clearly acknowledged the importance of finding preventive solutions to military coups in order to consolidate the Restoration regime. The speech pronounced in parliament by Prime Minister Cánovas del Castillo on the 2nd of July of 1877 provides an early example of such awareness. In his answer to MP (and General) Salamanca y Negrete about disciplinary measures taken against several generals, Cánovas posed this rhetorical question to his audience in parliament:
«Is there any experienced man, any conscientious man that believes that it is possible to constantly maintain the discipline in the army without using preventive measures? Is there anyone who believes that it is possible to keep the discipline without knowing the spirit and the condition of the armed forces, using only criminal and judicial measures to prevent seditions? No; (…) the industry of conspiracies has advanced too much in Spain to believe that it is possible to know and to impede seditions by only using judicial procedures»Footnote 6.
In the same speech, Cánovas emphasised some specific coup-proofing measures. Thus, he indicated that the military prerogatives given to the king in the 1876 Constitution were the result of a careful decision, aimed at ensuring that no official would intervene in politics against the king's will. In accordance with this, Cánovas also reaffirmed the conviction that, to avoid military discontent, the parliament should stay away from those issues that were the army's competence, which should be left under military (and, eventually, the king's) control:
«(…) the present Constitution gives more military authority to the king than former Constitutions. This is not an accidental outcome; it has been thoroughly considered by the constitutional commission; it has been the result of the commission's conviction (…); in the same way that no country discusses the negotiations about diplomatic measures if the government does not declare that these measures can be discussed, the decisions regarding the command, the government and the discipline of the army cannot be constantly discussed by the legislature without a great threat for the discipline and without nullifying the constitutional article that gives the prerogative of the supreme command to the king»Footnote 7.
Although references to the risk of pronunciamientos were consciously avoided in parliamentary discussions, politicians were fully aware of the danger that a state of discontent among the military meant for the Restoration regime. Thus, military reform was seen by the government as a political need, rather than as a military oneFootnote 8. Emilio Castelar, former president of the short-lived First Spanish Republic, clearly stated that the objective of military reform was:
«to improve the conditions of the military in Spain (a country that needs to finish for ever with the pronunciamientos)»Footnote 9.
In the same vein, in 1887 General López Domínguez, former war minister and participant in several coups before 1874, stated that:
«(…) is not each individual free to think, given the examples registered in this country's sad history, that bringing discontent, day after day, to the classes of the army, may lead them to justify those sad memories (…)?»Footnote 10.
The military press, on the other hand, allows an insight into the army's state of mind and reactions to the government's strategies. El Correo Militar (The Military Post), a military newspaper created in 1869 by a Republican military writer and turned into a conservative newspaper during the Restoration, reviewed with surprising frankness the government's military policy and the end of the pronunciamientos in its article «The Army and politics» published on the 8th of April of 1893:
«In the most recent times there had been attempts to isolate the army from politics (…). It was, then, a clever policy to avoid having discontented generals in the army, trying that all of them, or at least a vast majority, served in destinies that were in accordance with their category; the consequent combination of moral and material satisfaction made it difficult for them to think about asking politicians what the military organization was already giving to them».
Similarly, La Correspondencia Militar (The Military Correspondence), in its edition of 27th of July of 1898, praised the military promotions (even if this recognition was used to criticise the situation of the Carabineros, the coast guard corps):
«The chains of command of the general military corps, due to several orders, have improved notably; those of the auxiliary corps have done it extremely well and, at last, those of the Guardia Civil, so far neglected, have experienced an important advance; only those of the Carabineros suffer all the pain that falls upon their personnel, killing their spirit and inner satisfaction, and keeping constantly among them these elements of displeasure and complaint and anxiety».
This military newspaper linked fairly explicitly pronunciamientos and military staff's wellbeing in numerous occasions. In its issue of 12 January 1901, it clearly indicated that it was «natural» that successful pronunciamientos had as one of their consequences an improvement in the situation of all classes of the army. On 23 June 1900, after the military repression of some social turmoil in Madrid, it published the following statement:
«We will repeat one and a thousand times, we will say it forever; to rule is to repress; this is why today one has repressed and the triumph of our Fatherland cheers many death hearts up (…) But it is possible to repress in such a definitive and conclusive way only when the armies stay side by side with the governments, because the governments take care of the armies; when the bayonets, like nowadays, are side by side with those who order the compliance of the laws (…)».
These quotes, however, might suggest a placidness in civilian–military relations that was far from real. The military's claims for better conditions were bitterly present throughout the period. La Correspondencia Militar voiced the military's corporative grievances during the Restoration regime and reflected the conservative turn that the army experienced throughout the period: established in 1877 by a Republican major (who even participated in one of the republican coup attempts of the 1880s), the newspaper got progressively closer to the Conservative Party and ended up supporting the 1923 military coup. In its edition of 24 November 1898, it called for higher wages for the lowest grades of the officer corps, such as captains and lieutenants. Entitled «Act of Justice», the article said:
«We have been repeating for many years that the salary assigned to military officers in Spain is miserable and prevents them from covering their necessities with comfort; but no government has worried about it, not even to study it (…) No more delays and postponements, kill the harmful laziness and undertake the required measures to solve this issue that affects the dignity of the armed corps (…)».
Similarly, El Correo Militar published on 10 May 1886 a threatening article that related the alleged low salaries of officers in the 1880s (and also the low total military spending) with the past tradition of military coups:
«With our miserable army, with an officer corps to whom every privilege has been denied, that lives in misery, to whom every mean of welfare and decorum has been skimped, we can only expect ruin, disturbance, pronunciamiento, internal disputes, the standstill of trade and industry (…)»Footnote 11.
Another anonymous article published in El Correo Militar in 21 April 1893, stated that:
«If one entrusts his life, honour and properties to […] a weapon, he must keep it always in good condition, because otherwise he may be in danger that, when required, it will not work, or even exploit in the hands of its owner, who will pay in this way his neglect or greed».
Some years earlier, an article by José Cotarelo directly linked the end of pronunciamientos to any measures addressed at improving soldiers' conditions, and blamed the governments for the absence of progress in this directionFootnote 12. In another issue, El Correo Militar considered a «modest but safe future for the military» as one of the main ways to bring an end to military «unrest and sedition»Footnote 13.
These quotes reflect the state of mind that prevailed in conservative military circles. The military press welcomed any efforts made by the government to improve officers' wellbeing and recognised the connection between the latter and pronunciamientos, but it also maintained a belligerent attitude against the government throughout the period, as if the army were in a permanent bargaining process with the regime. To what extent, then, did the government improve the military's wellbeing during the Restoration period, when pronunciamientos were almost absent? The next section provides new quantitative evidence to answer this question.
4. THE EVOLUTION OF COMPENSATIONS TO THE MILITARY (1850-1915)
This section provides new data on Spanish officers' remunerations between the mid-19th century and 1915, and analyses whether the virtual disappearance of pronunciamientos after 1874 coincided with an improvement in the military's welfare. As previously mentioned, some Spanish historians such as Fernández Bastarreche (Reference Fernández Bastarreche2006) have stressed that the stagnation of military spending during the Restoration might explain the military's growing hostility towards the regime. Indeed, total military spending was stagnant during the period. Figure 3 presents the evolution of total military spending, both as a percentage of GDP and divided by the number of officers (in constant pesetas of 1850). Both series are rather flat until the early 20th century, which could induce us to discard the possibility of a coup-proofing strategy based on public spending during the Restoration regimeFootnote 14.
MILITARY SPENDING IN SPAIN (1850-1915).
Sources: Number of officers from Spanish public budgets (Presupuestos Generales del Estado); military spending from Sabaté (Reference Sabaté2016).

Moving to officers' compensation, Figure 4 shows the evolution of the real yearly base wages of a set of infantry officers' categories (colonel, lieutenant-colonel, major, captain and lieutenant) from 1850 to 1915 in several benchmark years, expressed in pesetas of 1850. All wages in Figure 4 were assigned to infantry officers who commanded troops in a line regimentFootnote 15. These wage series would be consistent with the stagnation of total military spending during the Restoration, as shown in Figure 3. The figure shows only two periods of increasing real wages: the 1860s and the 1890s, both of them due to increases in nominal wages (particularly the early 1860s and the early 1890s) and to relatively low inflation (the 1860s) or deflation (the first half of the 1890s). The latter, however, was followed by a rapid wage decrease in the last few years of the century, due to the reversion of inflation trends. In contrast, during the early years of the Restoration regime there were no significant changes, apart from a modest increase in the lieutenant categoryFootnote 16.
REAL YEARLY BASE SALARY FOR SEVERAL CATEGORIES OF OFFICERS (1850-1915).
Notes: Yearly base salary for infantry officers with command of troops in constant pesetas of 1850.
Sources: Salaries from Spanish public budgets (Presupuestos Generales del Estado) and GDP deflator from Prados de la Escosura (Reference Prados de la Escosura2003).

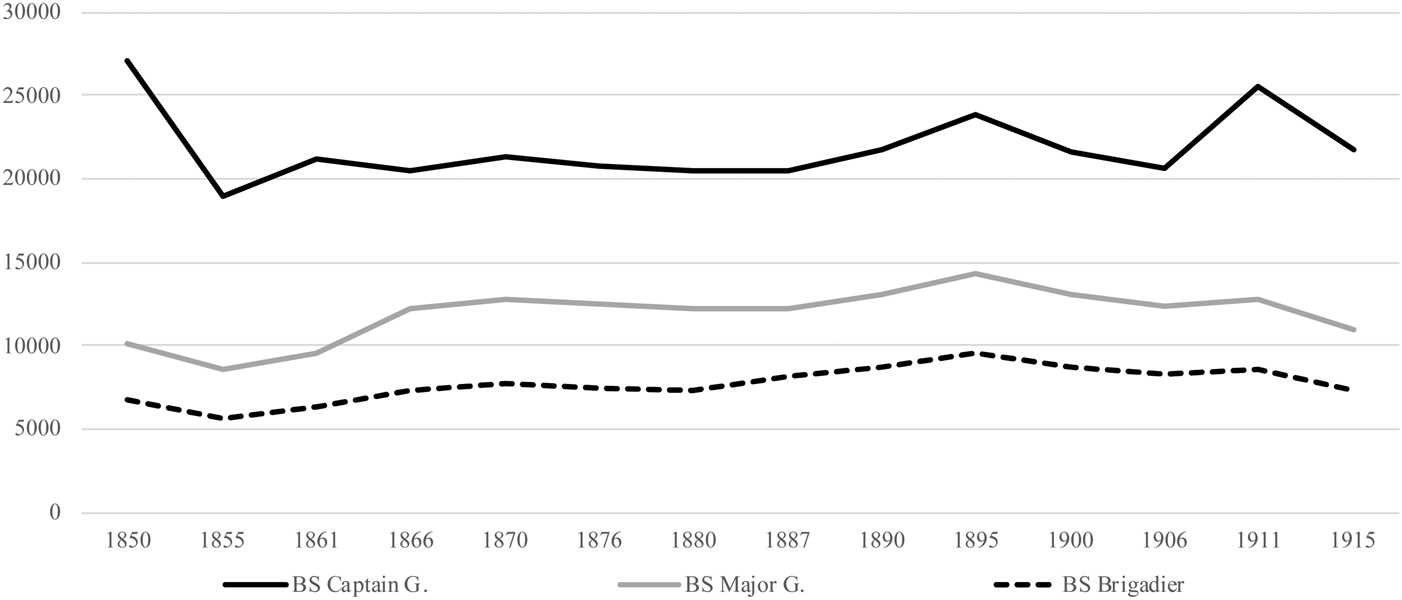
A similar picture is found when looking at the highest grades. Figure 5 shows the evolution of the yearly base salary for captain-generals, major-generals and brigadiers. Once again, there were significant salary increases across the board in the early 1860s and early 1890s, and a reversion of this trend in the late 1890sFootnote 17. Additionally, for the highest category (captain-generals), salaries experienced a very sharp increase in 1911 due to the growth of their nominal wages from 25,000 to 30,000 pesetas per yearFootnote 18. Data on total military spending and on real base salaries, therefore, do not support the idea that the end of pronunciamientos in the Restoration regime was associated with systematic and substantial salary increases.
REAL YEARLY BASE SALARY FOR SEVERAL CATEGORIES OF GENERALS (1850-1915).
Notes and Sources: See Figure 4.
Nevertheless, these figures may not capture the evolution of officers' welfare correctly, for two reasons. Firstly, they do not reflect the whole remuneration received by each category of officers. As already pointed out by Fernández Bastarreche (Reference Fernández Bastarreche1978), the base salaries received by the army were complemented by additional remunerations that varied according to professional categories and other specific conditions. The Report on the Organisation and State of the Army on 1 January 1860 provides detailed information on the vast variety of these military gratificationsFootnote 19. For instance, a colonel serving in an infantry regiment with two battalions earned 333.33 reales per month as a gratification for commanding troops (almost 15 per cent of his base monthly salary), while the same colonel in an infantry regiment with three battalions earned 500 reales (21 per cent). By contrast, in the case of the cavalry, a colonel's gratification for command was about 400 reales (17 per cent). There was even more diversity in the so-called «pluses», which were gratifications given in wartime or in extraordinary circumstances. Since the importance of these complementary earnings seems to have increased during the late 19th and early 20th centuries, the base salary would not be an adequate reflection of the actual officers' earnings. However, the diversity of these gratifications makes it very difficult to provide a long-term homogeneous series for every category.
The second way in which governments could increase officers' welfare without increasing base salaries was through the systematic use of promotions. A gradual increase in the share of the higher officers' ranks within the total as a result of widespread promotions would result in an increase in the average remuneration of each individual officer, regardless of the evolution of the base salary of each rank.
In this context, an alternative way to measure the evolution of the average welfare of Spanish officers is provided by the Spanish Public Budgets, which indicate the overall military spending devoted to officers' and general corps' remunerations. We have divided this amount by the total number of officers reported in the national budgets in order to estimate their average individual earningsFootnote 20. Even if this measure only provides an average for all officer grades, it allows us to explore the extent to which the Restoration governments improved their wellbeing. Figure 6 shows the average officers' remunerations from 1850 to 1915 in constant pesetas of 1850 in several benchmark years. We only take into account the remuneration of officers with effective command of troops and exclude those officers who were in the reserve and received only part of their salary. In contrast to the stagnation of base salaries (Figures 4 and 5), the complete payments to officers increased substantially between 1850 and 1915. The growth of payments was particularly intense from the 1870s onwards, suggesting a policy change in that period, aimed at improving the wellbeing of the military officer corpsFootnote 21.
AVERAGE TOTAL REMUNERATION OF COMMANDING OFFICERS (1850-1915) (CONSTANT PESETAS OF 1850).
Sources: See Figure 4.

As has been indicated, this increase might be the joint result of higher additional remunerations and an increasing share of better paid officers in relation to lower hierarchical grades through widespread promotions. Figure 7 illustrates the latter by showing an index of the relative presence of each category of officers within the largest army corps (infantry, cavalry and artillery). We calculate the index by multiplying each category's ranks by a decreasing factor (from 6 for colonels to 1 for alférez). As in the case of Figure 6, this index also suggests a change of policy in the first decades of the Restoration. Before the 1870s the index tended to decrease over time, except for some sudden jumps that coincided with successful coups (1854 and 1868). By contrast, the index started to grow in the 1880s suggesting that, unlike what had happened in previous periods, the Restoration governments soon started to resort to widespread promotions as an instrument to improve the average officers' remuneration. Thus, in line with Headrick (Reference Headrick1981), Figures 6 and 7 would be consistent with a political strategy aimed at overcoming the grievances that could drive officers to organise coups.
INDEX OF THE RELATIVE PRESENCE OF EACH CATEGORY OF OFFICERS IN THE LARGEST ARMY CORPS (1850-1915).
Sources and notes: Before 1892, data come from: Escalafón General de Infantería, Escalafón General de los Señores Jefes y Oficiales del Arma de Caballería, and Escalafón General del Cuerpo de Artillería. Since 1892, Anuario Militar de España. The index is calculated by multiplying the number of each category of officers by a decreasing factor (6 for colonels, 5 for lieutenant-colonels, 4 for majors, 3 for captains, 2 for lieutenants and 1 for alféreces) and dividing the result by the total number of officers. For years with no complete data we present interpolations based on the evolution of the index in those corps with information. Due to insufficiently disaggregated data for some years, the index includes officers in the reserve; the evolution of the index without the reserve, though, is very similar to the reported series for those years for which the information is available.

In the next two figures we compare the evolution of the average officers' remuneration with other Spanish wage series, in order to find out whether the evolution reported for the former was shared by other occupations or was particular to the military ranks. Unfortunately, there is no general wage index available for Spain during the period under study, but in Figure 8 we compare the evolution of the officers' average remuneration with the weighted mean salary of one of the largest Spanish industrial companies at the time (La España Industrial S.A.). In this case, we express all series in nominal terms, to allow the comparison of periods of nominal wage increases. The average wage of La España Industrial clearly grew faster than military payments from 1861 to 1876 but its growth slowed down thereafter, when military salaries started growing much faster. These figures would suggest an effort, starting in the 1870s, to improve the wage payments to officers above the general trend of market wages in the private sector.
EVOLUTION OF COMMANDING OFFICERS' REMUNERATIONS AND INDUSTRIAL WAGES, 1850-1915 (1876 = 100).
Sources: Nominal wages of La España Industrial S.A. (EI) come from Maluquer de Motes and Llonch (Reference Maluquer de Motes, Llonch, Carreras and Tafunell2005). Officers' remuneration data estimated from Spanish Public Budgets (Presupuestos Generales del Estado).

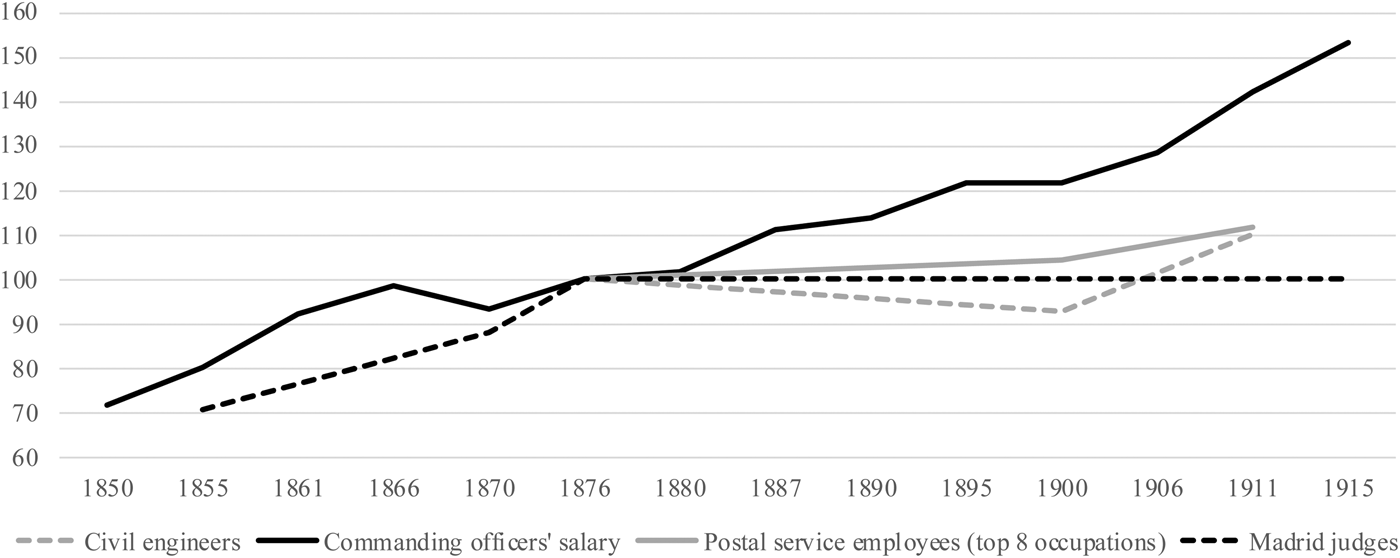
In Figure 9 we focus the comparison on other skilled high-level government occupations: Madrid judges, civil engineers and the eight highest-paid occupations in the Postal ServiceFootnote 22. As the figure shows, after 1875 the remunerations of officers increased more rapidly than other high-wage government jobs, suggesting therefore that the improvement in military officers' remunerations did not reflect a general increase in the wages of highly paid workers. A similar conclusion may be drawn from information on the highest-paid jobs of the railway sector which, according to exhaustive research by Juez Gonzalo (Reference Juez Gonzalo1991, pp. 188-189) remained virtually stagnant during the whole second half of the 19th century. To sum up, and in line with Headrick (Reference Headrick1981) and also with recent research on Spanish top incomes in the late 19th and early 20th century (Artola Blanco Reference Artola Blanco2019), we detect a significant increase, both in absolute terms and relative to other highly paid jobs, in the average officers' compensation during the period.
EVOLUTION OF WAGES OF HIGH-LEVEL GOVERNMENT JOBS AND COMMANDING OFFICERS' REMUNERATIONS, 1850-1915 (1876 = 100).
Sources: Villacorta Baños (Reference Villacorta Baños1989), except for officers' and judges' remuneration data, which come from the Spanish Public Budgets (Presupuestos Generales del Estado).
The increase in the average officers' payment was not compensated by a decrease in the number of officers. Quite the contrary, their ranks were significantly larger during the Restoration regime than in earlier periods. This is illustrated in Figure 10, which shows the evolution of the total number of officers in the Spanish armyFootnote 23. The total number of officers increased substantially from 1870 to 1876 and remained high until the end of the period under study. Increases in the number of active officers and the number of commanding officers in the first half of the 1870s were similar, which suggests that the army incorporated into its active chain of command some of the new officers who had fought in the Third Carlist War (1872-1876). It is true, though, that the number of active officers decreased substantially in the second half of the 1870s, to the benefit of the number of officers in the reserve. Thus, even if the early Restoration governments preferred to consolidate war-related promotions rather than cutting the number of officers to return to previous levels, some of these new positions were transferred to the reserve. All in all, however, the number of active officers was always higher during the Restoration than before 1870.
NUMBER OF OFFICERS IN THE SPANISH ARMY (1850-1915).
Notes: The number of commanding officers accounts for those officers who were commanding troops in any branch of the land forces; the total number of officers includes the former group plus those officers in the reserve and surplus officers (without effective command of troops and half—or part of—the usual salary) and those officers—or civil servants working for the Ministry of War with equivalent grade—in charge of non-fighting services (military health, military justice, administration, etc.); the active officers accounts for the total number of officers minus the officers in the reserve.
Sources: Spanish Public Budget (Presupuestos Generales del Estado).

The number of officers in the reserve also increased significantly in the late 1860s and late 1890s, reflecting the end of both the colonial campaigns of the 1860s and independence processes in Cuba and the Philippines. These increases suggest again that governments preferred to keep officers in the army even if there were no specific tasks for them. More specifically, the increase in the late 1890s was mainly led by the so-called «surplus officers» and «officers to be replaced» who came from the colonies. Although these officers were to be partially expelled from the corps in the following years (as can be seen by the subsequent sharp decrease in the reserve and surplus officers), their reduction was partially compensated by an increase in the number of active officers and the number of officers with command of troops after 1900. Once again, this seems to reflect governments' willingness to avoid conflicts with officers even if this implied an inflated officer corps that, together with the increase in their remunerations, had a negative effect on fiscal sustainability while reducing military efficiency. In this regard, as can be seen in Figure 11, the number of troops per officer during the Restoration remained significantly lower than in earlier periods (even though the decrease had already started in the 1860s). The ratio only rose again in the early 20th century, mostly due to the Moroccan War that started in 1909, when the number of troops increased more than the number of commanding officers.

5. COUP-PROOFING STRATEGIES IN THE SPANISH RESTORATION
The increase in officers' payment or the acceptance of an inflated officer corps were not the only coup-proofing measures applied by the Restoration governments to end the secular tradition of pronunciamientos and counteract the threat of political intervention by the military. In this regard, and in line with the speech quoted above by Prime Minister Cánovas del Castillo, some authors have suggested the existence of a tacit pact between the government and the military: the latter would accept to remain out of politics as long as the former did not contravene the army's priorities in military affairs (Cardona Reference Cardona1983; Seco Serrano Reference Seco Serrano1984; Puell de la Villa Reference Puell de la Villa2000; Fernández Bastarreche Reference Fernández Bastarreche2006). Such an implicit pact would be reflected in the fact that military budgets were generally passed without much debate, and those reforms that displeased the army were generally dismissed (Headrick Reference Headrick1981). At the same time, the 1878 Constitutive Law of the Army clearly specified that soldiers could not participate in political meetings (except for military ministries, deputies, senators and officers in the reserve)Footnote 24. This arrangement ensured that officers could manage military affairs on their own and would have no reasons to confront the government.
This would have been complemented by other coup-proofing strategies. For instance, some authors suggest that the willingness to prevent coups was the main reason why Cánovas del Castillo favoured the figure of the «king-soldier» (see above), according to which kings Alfonso XII (1874-1885) and Alfonso XIII (1886-1931) were appointed as supreme commands of the army. As mentioned before, this aimed at ensuring that no official would intervene in politics against the king's willFootnote 25. Moreover, the Restoration's governments blockaded the career of those generals who intervened in politics in the wake of the 1868 revolution, while promoting those involved in the 1874 coups (Headrick Reference Headrick1981; Fernández Bastarreche Reference Fernández Bastarreche2006).
By contrast, the Restoration governments did not apply other coup-proofing measures often mentioned in the political science literature. For instance, the regime did not develop any strategies to counterbalance the power of the army. This could be related to the unsuccessful and counter-productive previous experiences, such as the creation of a large National Militia during the so-called progressive biennium (1854-1856) under the leadership of General Espartero, which did not help to defeat the 1856 pronunciamiento Footnote 26. The establishment of a rural paramilitary corps (Guardia Civil) in 1844, during the Moderate Party's government, which could also have been used as a counterweight against progressive military uprisings, did not perform that role due to its organic dependency upon the Ministry of War (its chief command was a military officer and the corps was considered a regular branch of the army in the Constitutive Law of the Army of 1878)Footnote 27.
The available evidence also suggests that Restoration governments did not use diversionary international warfare as a way to keep the army occupied and hinder the organisation of coups, at least before the 20th century. According to most historians, Cánovas del Castillo, the architect of the Restoration regime, was well aware of Spain's military weakness, which prevented the country from playing any significant role in the international arena. Hence, the army's main international missions were aimed at maintaining the colonial status quo and protecting Spanish national integrity (Elizalde Reference Elizalde, Tusell and Portero1998)Footnote 28. Moreover, the Carlist movement, urban Republicanism and the labour movement were seen as the main threats to the regime; thus, the Restoration governments prioritised the army's domestic orientation (Puell de la Villa Reference Puell de la Villa, Tusell and Portero1998).
In this regard, Figure 12 shows the number of days per year that the country was in a state of war or siege (locally or nationally declared) from 1875 to 1922. As has been indicated, states of war were declared in times of domestic turmoil, in order to transfer the public order responsibility directly to the army, whereas states of siege allowed the government to suspend constitutional guarantees. The figure suggests that the army took command of public order particularly during wartimes, but states of war were also frequent during the early years of the Restoration, which reflects the confidence that the governments placed in the army to protect the new institutional order.
DAYS OF STATES OF WAR AND STATES OF SIEGE IN SPAIN (1874-1923).
Notes: Calculated with data from González Calleja (Reference González Calleja1998). The figure also highlights in grey the most important war periods (with more than 1,000 battle deaths according to Sarkees et al. Reference Sarkees, Wayman and Singer2003): Ten Years' War in Cuba (1868-78), Third Carlist War (1872-76), Melilla War (1893-94), Cuban Independence War (1895-98), Philippine Revolution (1896-98), Second Spanish-Moroccan War (1909-10) and Rif Rebellion (1921-26).

As a final step of the analysis, in Table 1 we examine the relationship between officers' remunerations and coups d’état in Spain in a regression setup. The results, however, should be interpreted with caution because of the small number of observations. Our dependent variables are the presence of coups d’état (in the form of a dummy variable that takes value 1 if at least one coup took place in a given year, and 0 otherwise) and the number of coups per year. Our main independent variable of interest is the average remuneration of commanding officers as a share of civil wages (measured both in nominal and real terms), which we expect to be negatively associated with the frequency of pronunciamientos Footnote 29.
MILITARY SALARIES AND COUP-PROOFING STRATEGIES IN SPAIN, 1850-1915

Notes and sources: Standard errors in parentheses, ***P < 0.01, **P < 0.05, *P < 0.1. The estimates are based on logistic regression in Models 1 and 2, negative binomial regression (NBR) in Models 3 and 4, and ordinary least squares (OLS) regression in Models 5 and 6. The dependent variable in Models 1 and 2 is a dummy that equals 1 if at least one coup took place in a given year, and 0 otherwise. In Models 3–6 the dependent variable is measured by the number of coups per year. For sources, see text.
We include a set of control variables that are either common to the literature on coups d’état or have been associated with the decreasing frequency of coups during the Restoration. Firstly, we incorporate the extent of suffrage to account for the political legitimacy of the regime, and the number of changes of ministers per year to capture the degree of political instabilityFootnote 30. The effect of the turno pacífico and its subsequent erosion during the Restoration period is measured by a variable that takes value 0 before 1876 (when the turno was established) and a value equal to the percentage of members of parliament supporting the government from 1876 onwards (to account for the degree to which the turno was being respected)Footnote 31. We additionally include other variables common to the previous literature, such as GDP per capita, economic growth, military expenditure, a war dummy (that takes value 1 if the country was at war, and 0 otherwise) and previous coups (measured by the number of coups in the preceding 5-year period)Footnote 32. Finally, we include the total number of commanding officers to capture the expansion of the officer corps.
The results confirm our hypothesis on the coup-proofing role of the growth in officers' remunerations. The ratio of military (officers') to civilian wages is negatively and significantly correlated with the frequency of coups, both when measured as the presence of coups d’état (Models 1 and 2) or as the number of coups per year (Models 3–6). Only in Model 1 does the coefficient fall short of the 10 per cent significance level. The impact also seems sizeable. According to Model 2, for example, the probability of a coup decreases from 0.8 to 0.001 when the ratio of military remunerations as a share of civil wages increases from its minimum level (0.96) in 1873 to its maximum (1.46) in 1915. The results are robust to the inclusion of the total number of commanding officers, which suggests that military salaries contributed to the declining rate of coups even when controlling for the enlargement of the officer corps through promotions. Models 5 and 6 also indicate that the number of officers had a negative impact on the frequency of coups, but these results are not robust to all model specifications.
Most of the other variables also have the expected sign and level of significance. For instance, our proxy for the turno pacífico has a negative and significant coefficient, which suggests that the weakening or absence of the turno was associated with a higher frequency of coups d’état. In line with the previous literature, the extent of suffrage was also negatively related to the frequency of coups, whereas a recent history of coups d’état increased the likelihood of new military interventions in the future (see the positive coefficient for «previous coups»). The growth of GDP per capita also had a negative effect (albeit only significant in two models). The level of GDP per capita, however, had a positive impact on coups (the opposite of what we expected), perhaps reflecting that the early stages of economic modernisation were associated with political instability. Interestingly, military spending remains insignificant in all our models, suggesting that officers' remuneration rather than total military expenditure was used to prevent military uprisingsFootnote 33. Wars are also insignificant across the board (and with positive coefficients), suggesting that military campaigns were hardly effective in diverting the attention of the army towards external threats.
To sum up, as mentioned in the Introduction, the Spanish coup-proofing strategy is not a good match with either of the two alternatives suggested by Besley and Robinson (Reference Besley and Robinson2010): that is, the investment of public resources in the development of a powerful army, efficient in foreign intervention, or the insufficient endowment of the military and the reduction of the army to a weak institution, unable to threaten political stability. In the case of Spain, the governments of the Restoration period decided to devote resources to increasing the welfare of officers, but without creating a powerful army. This equilibrium would be well adapted to countries like Spain, with relatively low fiscal capacity and an absence of international ambitions, where political stability was bought at the price of lower military capacity abroad.
6. CONCLUDING REMARKS: MILITARY SPENDING AND INSTITUTIONAL STABILITY
The Spanish liberal regime initiated with Isabel II's reign (1833-1868) was troubled from the beginning by the army's recurrent interventions in politics. Between 1833 and 1874 there were twenty-nine coup attempts, or 0.7 coups per year. In contrast, during the Bourbon Restoration (1874-1923) the country remained almost free from pronunciamientos for almost half a century.
This political stability was achieved thanks to the new political design implemented by Cánovas del Castillo, as well as to several coup-proofing strategies devised to make the preparation of coups difficult. In this paper, we argue that military spending, in particular, was used to overcome some of the grievances that had brought the military into politics in previous decades. As our new data show, Spanish Restoration governments did not increase total military expenditure, but improved officers' remunerations in both absolute and relative terms. Even if the professional perspectives of the lower military ranks continued to be a source of profound discontent, this policy played its part in a comprehensive strategy to keep officers' loyalty to the regime and to reduce the frequency of coups. Instead of creating a powerful army (devoting a large amount of resources to military spending) or weakening the military, the Restoration governments opted for a third way. Coup-proofing strategies aimed at increasing officers' remunerations, rather than total military expenditure; a policy that was consistent with Spain's unambitious foreign policy.
The Restoration governments, moreover, combined their strategy of increasing remunerations with other coup-proofing measures, such as the incorporation in the regular army of those officers who had fought in the Third Carlist War (1872-1876) and the Cuba and Philippines independence wars (1895-1898), or an institutional design that reduced the intervention of the legislative on military issues. Therefore, even if the military remained a permanent threat to the regime's political stability, such a threat could be kept under control for several decades. Given the previous prolific history of pronunciamientos, this was a remarkable historical shift as, unlike what had happened in previous decades, the military no longer intervened systematically in politics to remove governments or force policy changes.
The Restoration regime would eventually come to an end in 1923 due to a coup d’état led by General Primo de Rivera. Thus, even if higher remunerations might have contributed to gaining the acquiescence of the army, other factors gradually weakened the regime's social legitimacy and reinforced the military's incentives to intervene in politics again. The defeat in the Spanish-American War in 1898 and the consequent loss of Cuba and the Philippines were critical to put pressure on the military–civilian relations and to weaken the stability of the system (Cardona Reference Cardona1983; Seco Serrano Reference Seco Serrano1984; Fernández Bastarreche Reference Fernández Bastarreche2006). Similarly, the so-called turno pacífico, which had been a source of political equilibrium, started to break down when minority parties increased their parliamentary representation—particularly following the approval of male suffrage in 1890 (Curto et al. Reference Curto-Grau, Herranz-Loncán and Solé-Ollé2012). Also, Puell de la Villa (Reference Puell de la Villa, Tusell and Portero1998) suggests that the military policies undertaken by Cánovas del Castillo (i.e. the binomial king-army and the tacit pact between the government and the army) gradually gave way to an emerging militarist ideology. The situation was made worse by the inflationary process of World War I, which reduced the purchasing power of military wages in line with what happened with average Spanish labour incomes. In this context, and in line with McLauchlin (Reference Mclauchlin2010), once the institutional credibility of the Restoration regime had been eroded and the expectations of regime continuity diminished, the government's capacity to prevent new military uprisings substantially decreased.
ACKNOWLEDGEMENTS
We thank financial support from the Catalan International Institute for Peace and the Catalan Department of Economy and Knowledge, as well as the Research Projects ECO2015-65049-C2-2-P and PGC2018-095821-B-I00 (MINECO/FEDER, UE). Oriol Sabaté has also received funding from the European Union's Horizon 2020 research and innovation programme under the Marie Sklodowska-Curie grant agreement no. 752163. The paper has also benefited from the comments received by two anonymous referees, as well as participants in the Max Weber Multidisciplinary Workshop «State-building in Non-democratic Societies» (European University Institute), the Conflict Research Society Annual Conference 2017, and seminars at the Universities of Lund, Leicester and El Colegio de México. We also thank the staff of the library of the Spanish Ministry of Finance for their valuable assistance.
SOURCES AND OFFICIAL PUBLICATIONS
-
Anuario Militar de España, 1892-1915
-
Diario de Sesiones del Congreso de los Diputados (DSC), 1887
-
El Correo Militar, 1883-1901
-
Escalafón General de Infantería, 1851-1889
-
Escalafón General de los Señores Jefes y Oficiales del Arma de Caballería, 1850-1891
-
Escalafón General del Cuerpo de Artillería, 1858-1891
-
Gaceta de Madrid, 1878
-
La Correspondencia Militar, 1897-1915
-
Presupuestos Generales del Estado, 1850-1915
-
Sección de Historia del Depósito de la Guerra (1860): Memoria sobre la organización y estado del ejército en 1° de enero de 1860. Madrid: Depósito de la Guerra.


 Open access