






1. Introduction
The possibility of improving wind farm efficiency without physical changes to the turbines has driven the interest in wind farm control strategies. The goal is to find a control strategy for the turbines that maximises the total power production, minimises the loads on the turbine, or both. The approaches can be cast into two categories: wake steering and axial induction control.
Wake-steering approaches seek to redirect the wake of upstream turbines such that they do not overlap with the downstream rotors. This is often achieved through yaw misalignment, that is, turning the turbine in such a way that the normal of the rotor plane is at an angle relative to the mean inflow direction. Many studies have shown the potential of this method to increase total power production, for example Adaramola & Krogstad (Reference Adaramola and Krogstad2011) or Gebraad et al. (Reference Gebraad, Teeuwisse, van Wingerden, Fleming, Ruben, Marden and Pao2016). Yaw misalignment not only increases power production but also leads to a distinctive kidney-shaped wake velocity deficit, which is often referred to as a curled wake and not captured by regular wake models. The counter-rotating vortex pair responsible for the curled wake was first observed in Howland et al. (Reference Howland, Bossuyt, Martínez-Tossas, Meyers and Meneveau2016) and the mechanism for its formation was explained in Bastankhah & Porté-Agel (Reference Bastankhah and Porté-Agel2016). An aerodynamic model based on modelling the turbine as a lifting surface is developed in Shapiro, Gayme & Meneveau (Reference Shapiro, Gayme and Meneveau2018), while Martínez-Tossas et al. (Reference Martínez-Tossas, Annoni, Fleming and Churchfield2019) presented a simplified wake model that incorporates the curled wake.
Axial induction control reduces the induction of upstream turbines, such that downstream turbines can produce more power; see, for example, Nilsson et al. (Reference Nilsson, Ivanell, Hansen, Mikkelsen, Sørensen, Breton and Henningson2015). Some studies also combine these two strategies (Bossanyi Reference Bossanyi2018). A large number of studies, both experimental and numerical, has been conducted testing different optimisation strategies for both axial induction control and yaw misalignment. A recent review of methodologies for control optimisation can be found in Andersson et al. (Reference Andersson, Anaya-Lara, Tande, Merz and Imsland2021). Kheirabadi & Nagamune (Reference Kheirabadi and Nagamune2019) provided an overview of gains through power-maximising control strategies. The authors concluded that wake steering yields more consistent efficiency gains, while axial induction control has a higher potential for reducing loads. Furthermore, the authors stress that the fidelity used to determine wind farm efficiency is of particular importance, especially in studies concerning axial induction control. They found that gains seen with low- to medium-fidelity models can often not be reproduced in experiments or high-fidelity simulations. While most investigations focus on the search for optimal set-points in steady-state conditions for individual turbine controllers, an increasing number of studies consider dynamic inflow conditions, such as Hulsman, Andersen & Göçmen (Reference Hulsman, Andersen and Göçmen2020) and Doekemeijer, van der Hoek & van Wingerden (Reference Doekemeijer, van der Hoek and van Wingerden2020). However, these studies still consider optimal set-points given a steady state. Another recent development is the search for control strategies based on a dynamic variation of set-points, such as Howland et al. (Reference Howland, Ghate, Lele and Dabiri2020) or Ciri et al. (Reference Ciri, Rotea, Santoni and Leonardi2017).
Goit & Meyers (Reference Goit and Meyers2015) introduced a framework to find optimal dynamic control through a receding-horizon adjoint gradient optimisation based on large-eddy simulations (LES). The approach was first applied to axial induction control which was expanded upon by Munters & Meyers (Reference Munters and Meyers2017) and later extended to yaw control in Munters & Meyers (Reference Munters and Meyers2018a). However, despite notable performance gains, the approach is not feasible for real-world applications due to the very high computational cost. Instead, the results of the study were used by Munters & Meyers (Reference Munters and Meyers2018b) to identify explicit control strategies. The authors identified the shedding of vortex rings by the turbines as a crucial feature of the optimised flow. A sinusoidal variation of the thrust of upstream turbines was then applied to replicate this effect with an explicit control strategy. A further development of this approach was presented by Frederik et al. (Reference Frederik, Doekemeijer, Mulders and van Wingerden2020), introducing the helix approach. The helix approach exerts a rotating radial moment and force onto the wake, deflecting the wake in the shape of a helix, hence its name. This deflection is achieved by a sinusoidal pitching of the individual blades. The pitching frequency is governed by the rotational speed of the turbine and an arbitrarily chosen frequency of rotation of the helix, typically parameterised by a Strouhal number based on inflow velocity and turbine diameter. In their paper, Frederik et al. found an increase in the power produced by a downstream turbine of almost 40 % at an optimal Strouhal number of  $0.25$. In this case, the second turbine operated at its static optimum. The effect of the helix approach when applied to a floating wind turbine was investigated by van den Berg, de Tavernier & van Wingerden (Reference van den Berg, de Tavernier and van Wingerden2022). They observed that the helix incites significant yawing of the turbine, further aiding the wake recovery process. Muscari et al. (Reference Muscari, Schito, Viré, Zasso, van der Hoek and van Wingerden2022) conducted a dynamic mode decomposition of a wake of a turbine with the helix approach and find that helicoidal shapes at the frequency of the excitation and its harmonics are the dominant modes of the wake. Furthermore, the authors report, in contrast to Frederik et al. (Reference Frederik, Doekemeijer, Mulders and van Wingerden2020), an optimal Strouhal number for the helix approach is $0.4$. In Korb et al. (Reference Korb, Asmuth, Stender and Ivanell2021), we applied reinforcement learning to optimise this control strategy for a row of three turbines. Although not the main focus of the study, it was found that the application of the helix approach to multiple turbines requires a closer understanding of the processes within the helical wake. Namely, it is not yet understood what influence the helix has on the transition from near to far wake, how it affects the wake recovery, to what extent the wake is deflected and whether the deflection plays a noticeable role in the improved efficiency. Here, we distinguish between meandering, deflection and deformation of the wake: we understand meandering as the fluctuation of the wake centre around a mean position, whereas deflection is a translation of the mean wake centre position due to forces exerted by the turbine. A deformation of the wake is a change of the wake shape without a change of the wake centre position. To facilitate the analysis of the helix, we extend the definition of a deflection from a static frame of reference to a frame of reference that rotates with the angular speed of the helix. Furthermore, the interaction of multiple turbines, each operating in helix mode, has not been investigated. However, our earlier research indicates that this is an important aspect for the extension of the helix approach to a wind farm.
In this paper, we seek to address the aforementioned questions. To this end, we discuss several theoretical aspects of the characteristics of helically deflected wind turbine wakes. Furthermore, a suite of LES is conducted to confirm the analytical deductions. First, a description of the conducted simulations is given, followed by a theoretical and numerical analysis of the helical wake of a single turbine with a focus on the effects of the rotating force. Thereafter, the interaction of multiple helical wakes is first described analytically and finally analysed using the results of simulations with multiple turbines. We conclude with a recapitulation of the findings and an outlook into possible future works.
2. Simulation set-up
A total of 16 LES cases are investigated in order to confirm the analytical derivations in §§ 3 and 5 and examine the influence of turbulence intensity, turbulence length scale and tip-speed ratio. We conduct two highly resolved simulations of the wake of a single turbine to analyse the deformation of the tip vortices in § 3.2 and eight medium-resolution simulations of single wakes to study further characteristics such as deflection, entrainment and wake shape, and recovery with different inflow conditions. Furthermore, we examine the interaction of multiple helical wakes and their relative phase difference. Therefore, another set of five simulations with three turbines at medium resolution is performed. Finally, we conducted one simulation of an empty domain to generate reference spectra for § 3.4.
All LES are conducted with the lattice Boltzmann method (LBM) framework elbe. For a detailed description of the solver, see Janßen et al. (Reference Janßen, Mierke, Überrück, Gralher and Rung2015). The wind turbines are modelled using the actuator line method (ALM), closely resembling the original formulation by Sørensen & Shen (Reference Sørensen and Shen2002). The overall set-up is similar to previous studies and has been validated extensively in Asmuth, Olivares-Espinosa & Ivanell (Reference Asmuth, Olivares-Espinosa and Ivanell2020b); Asmuth et al. (Reference Asmuth, Navarro Diaz, Madsen, Branlard, Meyer Forsting, Nilsson, Jonkman and Ivanell2021). It uses the parameterised cumulant LBM as described in Geier, Pasquali & Schönherr (Reference Geier, Pasquali and Schönherr2017a) and Geier, Pasquali & Schönherr (Reference Geier, Pasquali and Schönherr2017b). The cumulant LBM recovers the weakly compressible Navier–Stokes equations with second-order accuracy in time and advection and fourth-order accuracy in diffusion (Geier et al. Reference Geier, Schönherr, Pasquali and Krafczyk2015, Reference Geier, Pasquali and Schönherr2017a). The subgrid-scale stresses are modelled explicitly via the anisotropic minimum dissipation subgrid-scale model with the model constant set to  $1/12$ (Rozema et al. Reference Rozema, Bae, Moin and Verstappen2015). Due to the use of the subgrid-scale model, the stabilising limiter of the parameterised cumulant LBM is unnecessary and effectively turned off. The Mach number is set to $0.1$ (see Asmuth et al. (Reference Asmuth, Janßen, Olivares-Espinosa, Nilsson and Ivanell2020a) for a discussion of associated compressibility effects). The mean density and dynamic viscosity are set to $1.225\,{\rm kg}\,{\rm m}^{-3}$ and $1.7841 \times 10^{-4}\,{\rm m}^2\,{\rm s}^{-1}$, respectively.
In all cases, we simulate the NREL 5MW reference turbine as defined in Jonkman et al. (Reference Jonkman, Butterfield, Musial and Scott2009), with a rotor diameter of  $D=126\,{\rm m}$. The first turbine is placed $3D$ downstream of the inlet and all turbines are placed in the centre of the cross-stream plane to minimise the effects of the boundaries. In the three-turbine cases, the turbine spacing in the streamwise direction is $S_{x} = 5D$. In the ALM the blades are discretised by 32 blade nodes. The smearing width is set to approximately one cell width of the highest resolution, $\Delta x$, except for the cases with a high resolution, where the smearing width is set to approximately $1.5 \Delta x$ of the highest resolution. The global reference frame $x$,
$x$,  $y$ and $z$ is defined along the streamwise, spanwise and vertical direction, respectively. The velocity vector is $\boldsymbol {u}=\{u,v,w\}$. Mean and fluctuations of any quantity $a$ are denoted by $\bar {a}$ and $a'$, respectively.
The key parameters of the simulations, such as the mean inflow velocity  $V_{0}$, the inflow turbulence intensity $Ti = \sqrt {(u'^2+v'^2+w'^2)/3}/V_{0}$, the integral length scale of the turbulence $L$ and the tip-speed ratio $\lambda = \omega R / V_{0}$ can be found in table 1 for the simulations of a single turbine and in table 2 for the simulations of three turbines. The tables also include the names by which the simulations will be referred to later on. The name consists of a letter signifying the applied control strategy, the number of turbines, a letter indicating which quantity deviates from the base scenario and the value of that quantity. Thus, a case with greedy control (G), one turbine (1) and a turbulence length of 120 m will have the name G1L120.
Simulation parameters of the single turbine cases.

Simulation parameters of the three turbine cases.

The high-resolution cases are equal to G1V $9$ and H1V $9$ of the single-turbine cases, but with a reduced turbulence intensity of 2.5 %. Simulations with a single turbine vary in mean inflow velocity $V_0$, turbulence intensity $Ti$ and the integral length scale of the synthetic turbulence. Each simulation is conducted with and without the helix approach. The simulations are conducted in a domain of size $L_x \times L_y \times L_z = 15D \times 8D \times 8D$, with a refined zone around the turbine and the wake of $13D \times 6D \times 6D$. The LBM is limited to cubic cells and the grid refinement approach is based on Geier, Greiner & Korvink (Reference Geier, Greiner and Korvink2009). The outer domain has a grid spacing of $\Delta x = D/16$, while the refined zone has a grid spacing of $\Delta x = D/32$. The resulting blockage ratio is 1.2 %, which is well below the 5 % found by Sarlak et al. (Reference Sarlak, Nishino, Martínez-Tossas, Meneveau and Sørensen2016) to be the threshold for the onset of blockage effects.
The high-resolution cases only differ in that the streamwise length of the first refinement layer is shortened to  $8D$ and an additional refinement layer of dimensions $5D \times 3D \times 3D$ is added with a resolution of $\Delta x = D/64$. The simulations with three turbines have a domain of size $18D \times 8D \times 8D$ and a refined zone of size $16D \times 6D \times 6D$, the cell sizes are the same as for the single-turbine cases. The layout of the three-turbine cases is schematically shown in figure 1. To isolate the effects of the helix from interactions with boundary layer effects, all simulations are run without shear. At the sides, a slip boundary condition is implemented via a bounce-forward method (Krüger et al. Reference Krüger, Kusumaatmaja, Kuzmin, Shardt, Silva and Viggen2017). At the inlet, a constant velocity is superimposed with fluctuations from a precomputed synthetic turbulence field based on the method by Mann (Reference Mann1998). Previous studies using the same set-up showed very little degradation in turbulence intensity throughout the domain (see Asmuth et al. Reference Asmuth, Olivares-Espinosa and Ivanell2020b). The inflow velocity is either $V_0=9\,{\rm m}\,{\rm s}^{-1}$ or $V_0=13\,{\rm m}\,{\rm s}^{-1}$. The first velocity is chosen to be in Region 2 of the controller where the turbine operates at an optimal tip-speed ratio. The second inflow velocity is within Region 3, where the controller reduces the tip-speed ratio. The turbulence intensity of the inflow is either $Ti = 5\,\%$ or $Ti = 10\,\%$ and a characteristic length-scale is either 40 m or 120 m. Higher levels of turbulence intensity are known to increase turbulent mixing whereas larger turbulent length scales amplify the meandering of the wake (Porté-Agel, Bastankhah & Shamsoddin Reference Porté-Agel, Bastankhah and Shamsoddin2020). The velocity is imposed by injection of momentum in a simple bounce-back boundary condition (Bouzidi, Firdaouss & Lallemand Reference Bouzidi, Firdaouss and Lallemand2001).
Schematic of the domain of the three turbine cases. Grey discs represent the rotor-swept area.

The simulations serving as baseline cases are conducted without the helix approach. The turbines have a constant rotor speed, which was determined in a cascading manner: Initially, the first turbine is operated with a standard greedy controller, i.e. the turbine extracts as much power as possible, for one flow-through time  $T_{ft} = L_{x}/V_{0}$. To this end, we implemented the reference controller given in the definition of the NREL 5MW turbine by Jonkman et al. (Reference Jonkman, Butterfield, Musial and Scott2009). The average rotor speed of that period is then set as the constant rotor speed. After one flow-through time, this procedure is repeated with the second turbine downstream and so on. In the cases with the helix approach, the constant rotor speeds are determined in a similar manner. After the first turbine's rotor speed has been determined, we begin to apply the helix approach on that turbine, while the others still operate in greedy mode. After one flow-through time, we average the rotor speed of the second turbine. The same procedure is repeated with the third turbine. A schematic of the optimisation routine is provided in figure 2. This methodology ensures that the turbines operate close to their optimal tip-speed ratio while avoiding interactions of the helix approach with a varying rotor speed due to the greedy controller.
Timeline of the routine to determine the angular velocity and pitch. Solid line marks operation according to greedy control, whereas a dashed line signifies the turbine operating with constant angular velocity but with application of the helix approach. Averaging is done for one flow-through time under greedy operation.

The simulations are run for  $65T_{ft}$ after the startup time. The Strouhal number of the pitch variations, see (3.3), is set to 0.25 in all cases, based on the recommendation by Frederik et al. (Reference Frederik, Doekemeijer, Mulders and van Wingerden2020). In § 4 we examine multiple turbines operating in helix mode. We study the influence of the phase difference of the individual helices. To that end, we apply a phase shift $\varPhi$ to the helices, which is determined a priori based on the results of the single turbine cases, see § 3.7 for the details on determining the phase shift. The desired phase shift is then applied by setting the angle of the helix at the turbine to
 \begin{equation} \beta'_1(t) = \omega_e t-\left(2 {\rm \pi}{St} \frac{S_{x}}{D} \frac{V_{0}}{\bar{u}_{helix}}+\varPhi\right), \end{equation}
where  $\bar {u}_{helix}$ is an average transport velocity of the helix. We use $\bar {u}_{helix}/V_0=0.7$ based on the results in § 3.7. The same procedure is used for the third turbine, i.e.
 \begin{equation} \beta'_2(t) = \omega_e t-2\left(2 {\rm \pi}{St} \frac{S_{x}}{D} \frac{V_{0}}{\bar{u}_{helix}}+\varPhi\right). \end{equation}
3. The helical wake of a single turbine
Applying the helix approach to a turbine improves the wake recovery, as shown by Frederik et al. (Reference Frederik, Doekemeijer, Mulders and van Wingerden2020). Yet, it is not clear what causes this improved recovery. Frederik et al. argue that this is due to an increased mixing, but do not discuss any effects of a deflection of the wake or further details of the flow in general. Furthermore, how exactly the helical wake comes to be is also not very clear.
3.1. Angles and forces
The idea of the helix approach is to define a pitch angle  $\boldsymbol {\varTheta }$ in the global reference frame, also referred to as the global pitch, and letting the direction of that pitch rotate. We define the global pitch as
 \begin{equation} \boldsymbol{\varTheta} = \begin{bmatrix} \varTheta_0 \\ \varTheta_{tilt} \\ \varTheta_{yaw} \end{bmatrix} = A \begin{bmatrix} 0 \\ \sin\left(\beta\right) \\ \cos\left(\beta\right) \end{bmatrix}, \end{equation}
where  $A$ is the magnitude of the pitch and $\beta$ is the angle between the direction of the pitch and the $z$-axis. The multiblade coordinate transformation transforms coordinates from the rotating reference frame of the blade to the global reference frame (Bir Reference Bir2008). Frederik et al. (Reference Frederik, Doekemeijer, Mulders and van Wingerden2020) showed that applying the inverse transformation to (3.1), i.e. from the static global reference frame onto the rotating reference of each blade $b$ yields
 \begin{equation} \varTheta_b = A \sin\left(\varPsi_b +\beta\right) = A \sin\left(\varPsi_b +\omega_{e} t\right) , \end{equation}
where  $\varTheta _b$ and $\varPsi _b$ are the pitch and azimuth of blade $b$, respectively. Switching the sign of $\omega _{e}$ will lead to a clockwise rotation. However, note that this case will not be discussed any further in this paper, since Frederik et al. (Reference Frederik, Doekemeijer, Mulders and van Wingerden2020) found that a counter-clockwise rotation yields higher power gains. The change in pitch angle results in a varying angle of attack $\alpha$ and therefore differences in lift within one rotation of the rotor. The differences in lift result in a radial force and moment.
There are two parameters that control the pitch angle: the amplitude  $A$ and the excitation frequency $\omega _{e}$. The relation of the excitation frequency to the velocity of the flow and the turbine length scale is expressed by the Strouhal number
 \begin{equation} {St} = f_{e}D/V_{0}, \end{equation}
where by convention the frequency  $f_{e}$ is used instead of the angular frequency $\omega _{e}$. Alternatively, the Strouhal number can be expressed by means of the rotor speed $\omega$ and the tip speed ratio as
 \begin{equation} St = \frac{2f_{e}\lambda}{\omega}. \end{equation}
This relation makes it possible to define the excitation frequency based on the rotor speed if Strouhal number and tip-speed ratio are known. The optimal tip-speed ratio is usually dictated by the design of the turbine (see, for example, Jonkman et al. (Reference Jonkman, Butterfield, Musial and Scott2009)) and Frederik et al. (Reference Frederik, Doekemeijer, Mulders and van Wingerden2020) found a value of  ${St} = 0.25$ to yield the highest power gains. Thus, $f_{e}$ can be determined without any knowledge of the flow, as it only depends on the rotational speed of the turbine which is set by the controller. A further discussion of the Strouhal number in the case of multiple turbines can be found in § 4.
Later in this section, we examine the phase of the helix. To do so we must know in which direction the wake is deflected. We assume that the deflection is dominated by the radial force due to the helix approach. Thus, the direction of the deflection is the same as the direction of the force exerted onto the flow. We note that  $\omega _e \ll \omega$ due to (3.4), hence the pitch angle varies much slower than the turbine rotates. Therefore, we assume that we can examine the blade forces in a quasi-steady state. Furthermore, we neglect any influence of the drag and only consider the lift of the airfoil, and assume that the angle of attack $\alpha$ is below the onset of stall. Finally, we ignore any changes in induced velocities and only consider changes in forces.
The normal and tangential forces acting on the fluid are proportional to  $F_n \propto -C_L(\alpha )\cos \left (\phi \right )$ and $F_t \propto -C_L(\alpha )\sin \left (\phi \right )$, where $\phi$ is the angle between the relative velocity $V_{rel}$ and the plane of rotation. A diagram of the angles and forces is shown in figure 3(a). A Taylor expansion of $C_L$ around $\alpha _0=\phi$ and the geometric relationship $\alpha =\phi -\varTheta _b$ yields
 \begin{equation} C_L(\alpha) = C_L(\alpha_0) + (\alpha-\alpha_0)\left.\frac{\partial C_L}{\partial \alpha}\right|_{\alpha_0} = C_L(\phi) - \varTheta_b\left.\frac{\partial C_L}{\partial \alpha}\right|_{\phi}. \end{equation}
The forces  $\boldsymbol {F}$ exerted on the flow by all blades in the global frame of reference are then proportional to
 \begin{equation} \boldsymbol{F} \propto \sum_{b=0}^{N_b-1}\begin{bmatrix} -C_L(\alpha) \cos\left(\phi\right) \\ C_L(\alpha) \sin\left(\phi\right)\cos\left(\varPsi_b\right) \\ C_L(\alpha) \sin\left(\phi\right)\sin\left(\varPsi_b\right) \end{bmatrix}.\end{equation}
By inserting (3.2) and (3.5) and after some manipulation, the total force can be shown to be
 \begin{equation} \boldsymbol{F} \propto{-}N_b\begin{bmatrix} \cos\left(\phi\right)C_L(\alpha_0) \\ C_1\sin\left(\omega_et\right)\\ C_1\cos\left(\omega_et\right) \end{bmatrix}, \end{equation}
where  $C_1 = A({\partial C_L}/{\partial \alpha })({\sin \left (\phi \right )}/{2})$. Thus, the radial component, i.e. the force in the rotor plane, has a magnitude proportional to $N_bC_1$ and points in the opposite direction of the global pitch $\boldsymbol {\varTheta }$. The conservation of momentum dictates that the flow is accelerated in the direction of the force. We define the angle of the direction as $\varphi$. To keep the definition of $\varphi$ in line with the definition of the azimuth angle $\varPsi$, we define $\varphi$ to be zero when the wake is deflected in positive $z$-direction, i.e. upwards and $\varphi$ to increase counterclockwise. Therefore, $\beta$ and $\varphi$ are related as
 \begin{equation} \varphi = {\rm \pi}-\beta = {\rm \pi}- \omega_et. \end{equation}
The relation of force, moment, global pitch and their respective angles are shown in figure 3(b,c). A more detailed derivation of the forces can be found in Appendix A. There, we also derive the radial component of the moment induced by the helix approach. As stated previously, we will not consider the effect of the moment in the remainder of this paper. We assume that the force causes the wake deflection and that the moment only affects the wake mixing.
Schematics of angles, velocities, forces and moments acting on the flow. (a) Top view of a cross-section of a blade at azimuth  $\varPsi =0$, showing the local angles and forces. (b) View of the rotor looking downstream, showing azimuth and global pitch as well as force and moment due to the helix approach. (c) Top view of the rotor showing the total moment and force on the flow. Gray shaded area illustrates the deformed wake.

3.2. Tip vortices
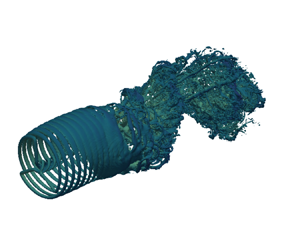
An important aspect of the wake recovery is the breakdown of the tip vortices. The tip vortices shield the wake from the ambient turbulence. Only after the breakdown of the tip vortices does the wake recovery begin, as discussed, for example, in Lignarolo et al. (Reference Lignarolo, Ragni, Scarano, Simão Ferreira and van Bussel2015). Therefore, it is of great importance to the process of wake recovery, when the breakdown occurs. The vorticity contours of a snapshot of the flow field of the high-resolution case with greedy and helix operation are shown in figure 4. Recall that the high-resolution case has a resolution of  $\Delta x=D/64$, in order to resolve the tip vortices. The resolution corresponds, e.g. , to the coarse resolution used by Ivanell et al. (Reference Ivanell, Mikkelsen, Sørensen and Henningson2010), where tip vortex instabilities were studied. Compared with the tip vortices in greedy operation, the tip vortices of a turbine in helix operation exhibit some important differences. Due to the changing pitch of the blade, the vorticity generated by the blade changes with time. This is also visible in the tip vortices. Furthermore, the deformation of the wake stretches and squishes the vortices. This also changes the distance between the vortices and thus the strength of their interaction see, e.g. , Ivanell et al. (Reference Ivanell, Mikkelsen, Sørensen and Henningson2010). Both aspects lead to an earlier breakdown, as can be seen in figure 4. In the helix wake, the vortices are merged where the blades were pitched to stall and thinned where the blades were pitched to feather. Furthermore, the deformation of the wake is clearly visible. While the classical pairing and leapfrogging of vortices, as reported, for example, by Tophøj & Aref (Reference Tophøj and Aref2013) or Sarmast et al. (Reference Sarmast, Dadfar, Mikkelsen, Schlatter, Ivanell, Sørensen and Henningson2014), and the following breakdown is apparent in the greedy case, the breakdown of the helical wake is not as orderly. A pairing of vortices is barely visible since the vortices have already begun to merge. The deformation also leads to changing distances between the vortices. In summary, we found that the tip vortices of the helix approach vary in thickness due to the varying pitch angle, which, in turn, leads to the merging of vortices. Furthermore, the helix approach leads to a clear helical deformation of the wake. Finally, we could not observe the leap-frogging of vortex pairs, which is a typical feature of tip vortices in regular operation. A more thorough investigation of the interplay of deformation and vortices is omitted here for the sake of brevity.
Vorticity contour of a single turbine in (a) greedy and (b) helix operation.

3.3. Wake deflection
The helix approach leads to a rotating radial force exerted onto the flow as shown in § 3.1. This force must also lead to an acceleration of the fluid in the radial direction, causing the helical shape of the wake illustrated in figure 4. However, we show that this radial force not only deforms but also deflects the wake. Recall, that we define deflection as an imposed translation of the mean wake centre due to the forces exerted by the turbine, whereas meandering is the stochastic fluctuation of the wake centre position due to the ambient turbulence, and deformation is a change in wake shape without translation of the mean wake centre position. The differentiation between deformation and deflection is of high relevance since deflection potentially reduces the overlap of the wake and the downstream turbine, while deformation may lead to increased wake mixing but does not necessarily reduce overlap. In established yaw-based wake-steering approaches, the force exerted onto the wake is stationary and so is the deflection of the wake. However, in the helix approach, the radial force rotates, thus the deflection also rotates. Therefore, we have to extend the concept of deflection to a rotating frame of reference, in order to analyse the rotating wake of the helix. Thus, we describe deflection as a mean translation of the wake centre in coordinates rotating with the frequency of rotation of the helix  $f_e$. We want to point out that the distance between the wake centre and the cross-stream position of the turbine is the same in the static and rotating frames of reference and is therefore easily computed from the static frame of reference, which is why we will focus our analysis on this quantity. To quantify the deflection, we compute the wake centres from the instantaneous streamwise velocity in cross-stream planes downstream of the turbine, by fitting a two-dimensional Gaussian velocity deficit with the width of the rotor (Quon, Doubrawa & Debnath Reference Quon, Doubrawa and Debnath2020). For the latter, we employ the samwich toolbox (https://ewquon.github.io/waketracking). The wake centre distance $d$ is then defined as the distance of the wake centre to the centre of the rotor plane.
The distribution of  $d$ at $3D$,
$3D$,  $5D$ and $7D$ downstream of the turbine for all single-turbine cases is shown in figure 5. Without the helix, the median of the wake centre distance increases downstream due to the naturally occurring wake meandering, which is in line with other experimental and numerical studies (Kang, Yang & Sotiropoulos Reference Kang, Yang and Sotiropoulos2014; Howard et al. Reference Howard, Singh, Sotiropoulos and Guala2015; Bastankhah & Porté-Agel Reference Bastankhah and Porté-Agel2017). The distribution is heavily skewed to the right. We find a slight increase in spread with a higher inflow velocity (i.e. lower tip-speed ratio), in (a), but that finding does not persist further downstream. If the helix approach is applied, the mode of the distribution is shifted to the right and the distribution has a higher variance. In the case with a lower tip-speed ratio, the shift to the right is less pronounced, indicating that the helix approach does not deflect the wake as much as when the turbine is operated at the optimal tip-speed ratio. In figure 5(d–f) we can examine the influence of increased turbulence intensity on the wake centre distance. We see that mode of the distribution of G1I $10$ is shifted to the right and that the distribution has a much longer tail compared with G1I $5$. For case H1I $10$, the mode is similar to that of G1I $5$, yet the density of occurrences in the range of $0.2D$ to $0.4D$ is larger in the first plane. However, in the planes further downstream the mode is increased if the helix is applied. Overall, we observe that the influence of the helix approach is stronger at lower turbulence intensities. This is in line with other studies, which have found a reduced effect of wake-steering approaches at high turbulence intensities (Kheirabadi & Nagamune Reference Kheirabadi and Nagamune2019). Wake meandering is dominated by ambient turbulent structures larger than the rotor diameter (Larsen et al. Reference Larsen, Madsen, Thomsen and Larsen2008; España et al. Reference España, Aubrun, Loyer and Devinant2011). Therefore, the wake meandering, that is, the spread of the distribution, should increase with an increase in turbulence length scale, shown in figure 5(g–i). Indeed we find that the distribution has a significantly higher spread in all three planes, with and without the helix approach. Nevertheless, the helix approach shifts the mode of the distribution to the right. Thus, the density of samples with a low wake centre distance is decreased. Therefore, we can deduce that the helix approach is still able to deflect the wake centre effectively. It should be noted that with stronger turbulence intensity, the identification of the wake centre tends to become more difficult (Doubrawa et al. Reference Doubrawa2020). Yet, since the results of the cases without the helix match the expectations, we take our findings to be of reasonable quality.
Distributions of wake centre distance at cross-stream planes  $3D$ (a,d,g), $5D$ (b,e,h) and $7D$ (c,f,i) downstream of the turbine. Panels (a–c), (d–f) and (g–i) show different tips speed ratios, turbulence intensities and turbulent length scales, respectively.

Due to meandering, the position of the wake centre is a symmetric bivariate normal random variable. If deflection is present, the wake centre will not be zero in the mean, if we take the mean in the rotating frame of reference. Therefore, the wake centre distance  $d$ should be distributed according to a Rice distribution:
 \begin{equation} f(d\mid\nu,\sigma) = \frac{d}{\sigma^2}\exp\left(\frac{-(d^2+\nu^2)} {2\sigma^2}\right){\rm I}_0\left(\frac{d\nu}{\sigma^2}\right), \end{equation}
where  $f$ is the probability density function with two parameters $\nu$ an $\sigma$ and ${\rm I}_0$ denotes the modified Bessel function of the first kind of order zero (Rice Reference Rice1944, Reference Rice1945). The magnitude of the meandering is characterised by $\sigma$ whereas the deflection determines $\nu$. In the case without the helix, there is no deflection, thus $\nu =0$, in which case the Rice distribution becomes a Rayleigh distribution. If the ratio of deflection to meandering is high, the Rice distribution approximates a normal distribution, which explains the results observed for the helix cases in figure 5.
It is also possible to estimate the parameters  $\sigma$ and $\nu$ from the computed wake centre distances. The results of such an estimation, performed according to Koay & Basser (Reference Koay and Basser2006), are shown in figure 6. Note that this method for estimating parameters has much higher accuracy than general methods for estimating parameters of distributions, but does not always converge. The method is prone to failure for very small values of $\nu$. First, we show the meandering parameter $\sigma$ in figure 6(a–c). In all these cases, $\sigma$ grows with downstream distance. Overall, the cases with and without helix behave somewhat similarly, while the meandering without helix is slightly lower. The comparison of the deflection parameter $\nu$, however, shows a clear distinction between the helix and non-helix cases. The non-helix cases have low values for $\nu$ throughout the wake whereas the deflection in the helix cases increases with downstream distance. Finally, figure 6(g–i) compares deflection with meandering. If the helix is applied, the ratio of $\nu /\sigma$ is almost constant after $3D$ downstream at a value around 2. Without the helix, the ratio is significantly lower and a slight decrease with distance is observable. As pointed out before, in theory, without the helix $\nu =0$, which is not the case in our results. We attribute this offset to the difficulty of determining the wake centre correctly and the low sensitivity of the Rice distribution to changes in $\nu$ if $\nu$ is close to zero. Therefore, we have included complementary computations of the meandering parameter based on a Rayleigh distribution, that is, assuming that $\nu =0$. It is shown in figure 6(a–c). If $\nu =0$ is enforced, the meandering parameter of the wake is estimated to be very similar between helix and non-helix cases and only slightly higher if the helix is applied.
Estimated parameters of the Rice distribution of the wake centre distances. Missing data are due to the lack of convergence of the method to estimate the parameters, which is the case for low ratios of  $\nu /\sigma$. Dotted lines represent estimations of $\sigma$ based on a Rayleigh distribution.

In conclusion, we find that the helix approach induces a significant deflection of the wake centre, which reduces the overlap of the wake with potential downstream turbines and consequently increases the kinetic energy available to the downstream turbines. We also find that the helix increases meandering in the far wake, although this effect is not very pronounced.
3.4. Spectra
In figure 7 we show the premultiplied spectra in streamwise, azimuthal and radial direction at three locations in the wake for cases G1V9 and H1V9. For the other cases, the results yield no substantial differences. The spectra are obtained at four locations in each plane, half a rotor diameter away from the centre of the plane along the  $y$- and $z$-axis in positive and negative direction. The signals are transformed using Welch's method, with 50 segments and an overlap ratio of 0.4 (Welch Reference Welch1967). All resulting spectra from a plane are then averaged. We find that the presence of the turbine increases energy in the fluctuations across the spectrum, especially in the streamwise direction. Furthermore, we observe that the presence of the turbine leads to higher energy contained in azimuthal fluctuations at frequencies at ${St}\approx 0.7$. Other studies, such as Howard et al. (Reference Howard, Singh, Sotiropoulos and Guala2015) and Heisel, Hong & Guala (Reference Heisel, Hong and Guala2018), have found the meandering of the root vortex to fall into this frequency range. The effect is strongest in the near wake and decays further downstream. Finally, if the helix approach is used, a notable peak can be found near the helix frequency of $St=0.25$. In almost all cases it contains the most energy of all frequencies. However, in case G1V9, we can also observe a maximum of energy at that frequency in the streamwise fluctuations at $x=5D$, although not as distinct as that of case H1V9. A variety of studies such as Okulov et al. (Reference Okulov, Naumov, Mikkelsen, Kabardin and Sørensen2014) and Howard et al. (Reference Howard, Singh, Sotiropoulos and Guala2015) have found a frequency in that range to be the naturally occurring frequency of wake meandering. Thus, we conjecture that the helix approach is most efficient if applied with the same frequency since it amplifies the naturally occurring instability of the wake and thus leading to a more rapid breakdown. This agrees with the observation in figure 6, where we observed slightly higher meandering if the helix is applied. The other frequencies show a slight decrease in energy. This is due to the position of the probes used to measure the spectrum. Due to the deflection of the wake, the probes are outside of the wake, thus reducing the turbulence intensity and leading to a decrease in the energy contained in the fluctuations.
Premultiplied spectra of velocity fluctuations in planes  $1D$,
$1D$,  $3D$ and $5D$ downstream of the turbine. Spectra are measured at 4 points, 1 radius up, down, left and right from the centre in the plane, and then averaged. The grey dashed line marks the frequency of the helix.

3.5. Wake mitigation
Although § 3.3 showed that the helix approach also leads to wake steering, Frederik et al. (Reference Frederik, Doekemeijer, Mulders and van Wingerden2020) stressed the improvement in wake mixing, which is also suggested by the earlier tip-vortex breakdown observed in § 3.2. In this section, we examine the effect of wake mixing and wake steering on the mitigation of wake effects. Wake effects include a reduction in kinetic energy in the flow and increased turbulence intensity. Wake mixing leads to entrainment of kinetic energy into the wake from the surrounding flow, while wake steering reduces the overlap of the wake with a potential downstream turbine. To distinguish the effect of reduced overlap and wake mixing, we utilise a meandering frame of reference. The meandering frame of reference follows the wake. The mean flow is obtained by translating the cross-stream planes so that the wake centre determined in § 3.3 is in the centre of the plane. The resulting flow field is then averaged. Since this frame of reference can only be established a posteriori, we are limited to first-order statistics, i.e. averages.
To distinguish between the energy available due to wake mixing and due to wake deflection and meandering, we show the kinetic energy in the rotor area,  $\bar {E}_{K,R}$, both in the static frame of reference and the meandering frame of reference in figure 8. By comparing G1V $9$ and H1V $9$, we find that the application of the helix leads to a faster increase in kinetic energy downstream of the turbine in both frames of reference. In the static frame of reference, the flow has regained approximately 60 % of the kinetic energy of the undisturbed flow at $x=5D$ if the helix is applied, whereas we observe only little above $40\,\%$ in case G1V $9$. A comparison of the kinetic energy between the two reference frames shows that a large amount of the additional kinetic energy present in the static frame of reference in case H1V $9$ is due to the reduced overlap due to wake meandering and deflection. In contrast, the difference between the two frames of reference is much smaller in case G1V $9$. The comparison with the cases with lower tip-speed ratio shows that the turbines extract significantly less energy from the flow, as to be expected. Interestingly, the helix approach leads to a higher extraction of energy compared with G1V $13$. Yet, due to increased entrainment of energy, the rotor disk contains more energy at $x=3D$, if the helix is applied. We can also see that the increased mixing does not have so much of an effect in the region up to $x=5D$. Since the difference between the two frames of reference is negligible in case G1V $13$, we conclude that the reduced overlap has little to no effect in the case without the helix. However, in H1V $13$ we consistently find a difference between the two frames of reference. Since we know from figure 6, that the meandering is virtually the same in G1V $13$ and H1V $13$, this difference in the cases must stem from the deflection of the wake. In figure 8(b) we observe stronger increases in kinetic energy in the region $2D$ to $4D$ downstream of the turbine in cases G1I $10$ and H1I $10$ compared with the respective baseline cases. In addition, the helix approach leads to more kinetic energy due to the reduced overlap in the static frame of reference. However, with higher ambient turbulence, the wake is not deflected as much. Therefore, the flow in case H1I $5$ contains more kinetic energy in the rotor area far downstream. The two effects balance each other at around $x=6D$. Finally, we examine the influence of the length scale of turbulence in figure 8(c). We can also observe more available kinetic energy in the region between $x=2D$ and $x=5D$. However, in comparison with H1I $10$, the helix approach is able to deflect the wake better, as was also shown in figure 6, and thus increases the amount of kinetic energy in the rotor area in the static frame of reference even more than in case H1L $40$.
$40$.
Kinetic energy of the mean flow in the rotor area at cross-stream planes with a distance of  $1D$. Lines marked with crosses indicate averaging in the meandering frame of reference while the lines marked with a plus sign represent energy averaged in the static frame of reference.

To gain a more thorough understanding of the wake recovery process the energy transport is analysed in the following. Based on the Reynolds-averaged momentum equation of an inviscid fluid (see, e.g., Stull Reference Stull1988, p. 90),
 \begin{equation} \bar{u}_j\frac{\partial{\bar{u}_i}}{\partial{x_j}} ={-}\frac{1}{\rho}\frac{\partial{\bar{p}}}{\partial{x_i}} - \frac{\partial{}}{\partial{x_j}}\overline{u_i' u_j'}, \end{equation}
a transport equation for the kinetic energy of the mean flow,  $\overline {E_K} = \tfrac {1}{2}\bar {u}_i^2$ can be derived by multiplying each component with the respective mean velocity and summing over all three equations, as used in Hamilton et al. (Reference Hamilton, Suk Kang, Meneveau and Bayoán Cal2012) and Lignarolo et al. (Reference Lignarolo, Ragni, Ferreira and van Bussel2014):
 \begin{equation} \bar{u}_j\frac{\partial{\overline{E_K}}}{\partial{x_j}} ={-}\frac{\partial{\bar{p} \,\bar{u}_i}}{\partial{x_i}}-\left(-\overline{u'_i u_j'}\right)\frac{\partial{\bar{u}_i}}{\partial{x_j}}-\frac{\partial{}}{\partial{x_j}}\left[\bar{u}_i\overline{u_i'u_j'}\right]. \end{equation}
The first term of the right-hand side corresponds to a source or sink of  $\overline {E_K}$ due to a pressure gradient, the second term corresponds to the conversion of kinetic energy to turbulent kinetic energy and the last term corresponds to the turbulent flux of kinetic energy. Since the problem is axisymmetric, a cylindrical coordinate system can offer some simplifications. In a cylindrical coordinate system, the kinetic energy is transported towards the wake centre by the term $-({\partial }/{\partial r})[\bar {u}_i\overline {u_i'u_r'}]$. Among others, Cal et al. (Reference Cal, Lebrón, Castillo, Kang and Meneveau2010) showed that this transport dominates the wake recovery, which was confirmed in preliminary examinations conducted for this study. The total transport of kinetic energy to the wake via radial turbulent transport, $\varepsilon (x)$, is given by
 \begin{equation} \varepsilon(x) ={-}\int_{x_0}^x\iint_{A_{R}} \frac{\partial{}}{\partial{r}}\left[\bar{u}_i\overline{u_i'u_r'}\right] \,\mathrm{d}A \,\mathrm{d}\kern0.7pt x, \end{equation}
where the rotor-swept area  $A_{R}={\rm \pi} D^2/4$. The effect of the helix approach on $\varepsilon (x)$ is shown in figure 9. The entrainment is calculated in a vertical plane in the centre of the rotor plane. The results are normalised with the mean kinetic energy per rotor area of the undisturbed flow, $E_{K,u}=1/2\,V_{0}^2 A_{R}$ multiplied with the inflow velocity. In the case G1V $9$ we find that little to no energy is entrained in the area of the near wake, as was to be expected due to the presence of the tip vortices. However, with the onset of the transition and more pronounced wake meandering more energy is entrained. The figure also shows clearly that the total transport increases earlier and faster if the helix approach is applied. The cases G1V13 and H1V13 show much lower entrainment compared with the baseline cases. However, as before, the application of the helix approach leads to an increase in $\varepsilon$. In figure 9(b) we can observe the influence of an increase in turbulence intensity. Generally, the entrainment is notably higher. Yet, the relative increase in entrainment due to the helix approach is smaller when compared with the lower ambient turbulence intensity. A similar observation can be made in figure 9(c), which shows the influence of the turbulence length scale. Entrainment increases even more compared with G1L $40$. However, the helix approach also improves entrainment more than in case H1I $10$. Similarly to H1I $10$, the helix approach mostly improves entrainment in the region of $1D$ to $6D$. Thus, we conclude that the helix approach generally increases entrainment. Even in cases of high turbulence intensity, which naturally have a higher entrainment due to the ambient turbulence, the earlier transition leads to an increase in the crucial section of the wake where a downstream turbine would be placed in a farm.
Total kinetic energy entrainment into wake in a vertical plane in the centre of the rotor. Entrainment normalised with the streamwise transport of kinetic energy in the undisturbed flow.

The effect of wake mitigation is a reduction in the velocity deficit. In figure 10, the cross-stream velocity profiles at  $1D$,
$1D$,  $3D$ and $5D$ are shown. The transition from the near-wake region to the far-wake region, where the wake recovers, is indicated by the typical switch from a double-Gaussian to a single-Gaussian profile (Sørensen et al. Reference Sørensen, Mikkelsen, Henningson, Ivanell, Sarmast and Andersen2015; Porté-Agel et al. Reference Porté-Agel, Bastankhah and Shamsoddin2020). The profile of G1V $9$ exhibits the usual features, i.e. a double-Gaussian profile at $1D$, followed by the transition and reaching a single-Gaussian profile at $5D$. Furthermore, the entrainment of momentum leads to an expansion of the wake. The reduced tip-speed ratio and, thus, lower thrust in case G1V $13$ leads to a noticeably smaller velocity deficit, while the transition shows a similar progression. The application of the helix approach only has little to no effect at the first plane. In the second plane shown we observe an earlier transition in case H1V $9$ in comparison with G1V $9$, indicated by a lack of a local maximum of mean velocity at the centre of the wake. In the case with a lower tip-speed ratio the velocity deficit profile has the same shape with and without the helix, however, the deficit is reduced if the helix is applied. At $x=5D$ all wakes shown in figure 10(c) have transitioned, but the helix leads to a visible reduction in velocity deficit, regardless of tip-speed ratio. The increase in turbulence intensity from 5 % to 10 % leads to a faster transition and faster recovery, indicated by the lack of a local maximum at the centre of the profile already at $x=3D$ visible in figure 10(e). However, at $x=5D$, the cases H1I5 and H1I10 exhibit little difference, whereas we find a significant reduction in velocity deficit from G1I5 to G1I10. This indicates that the helix approach increases wake mixing more effectively at lower turbulence intensities. The effect of increasing the turbulence length scale is shown in figure 10(g–i). At $x=1D$, the difference between the cases is small, only the local minima are increased at higher $L$, and the application of the helix has a negligible effect. The larger turbulence length scale accelerates the transition to a single-Gaussian profile, and the application of the helix approach leads to a reduced velocity deficit, similar to the effect of the higher turbulence intensity. Further downstream, at $x=5D$, the larger turbulence length scale leads to an even faster recovery than the increased turbulence intensity. Furthermore, the helix approach leads to an additional reduction in the velocity deficit. Thus, we conclude that the helix approach enhances the wake recovery most effectively in weak ambient turbulence. As we found in the previous section, it also deflects the wake most effectively at weak turbulence. This indicates that the approach might be most suitable in conditions of low turbulence and that, if applied to a wind farm, its effectiveness will decrease further downstream in the farm as turbulence levels increase.
Mean velocity profiles in the vertical line through the centre of cross-stream planes at (a)  $1D$, (b) $3D$ and (c) $5D$ downstream of the turbine.

Since we have found a strong dependence of the helix approach on ambient turbulence, we also want to examine its effect on the wake turbulence levels. Therefore, we show the turbulence intensity at  $x=1D$, $x=3D$ and $x=5D$ in figure 11. Note that the turbulence intensity is computed in a static frame of reference and therefore also includes contributions due to the helical deflection of the wake. As mentioned in § 3.4, the deflection of the wake leads to an apparent velocity fluctuation due to the translation of the wake and a translation of the turbulent region of the wake. Strictly speaking, the first effect should not be qualified as turbulence intensity. However, a separation of these effects is not possible here. Furthermore, the effect on potential downstream turbines would also be similar to that of large turbulent structures. To use familiar terminology, we continue to call the measured quantity turbulence intensity. In figure 11(a–c) we display the comparison of the two tip-speed ratios. In the vicinity of the rotor, the turbulence levels are very high near the root and the tips of the blades, as could be expected. The application of the helix approach leads to even higher turbulence intensities in these areas. Without the helix, the root and tip areas of high $Ti$ appear to be separated by a local minimum with a magnitude close to the ambient $Ti$, which is significantly weakened or does not exist if the helix is applied. Further downstream we only find a local minimum of turbulence intensity at the centre of the plane, which is significantly larger without the helix. Due to our previous observation that the transition happens earlier if the helix is applied, it is also reasonable to assume that the turbulence intensity profile transitions earlier. In the last plane shown, $Ti$ still has a local minimum without the helix, however, the application of the helix approach leads to a single maximum of turbulence intensity at the centre of the plane. The cases with lower tip-speed ratio, i.e. G1V $13$ and H1V $13$, exhibit much lower levels of turbulence at the root and tip vortices and consequently in all planes downstream as well. Furthermore, at $x=3D$, G1V $13$ still exhibits separate peaks at the tip and the root, indicating a slower transition process. This finding is supported by figure 11(c), which shows a local minimum even if the helix is applied. The maximum value quickly decreases downstream and the maximum values in cases G1I10 and H1I10 are very similar to G1I5 and H1I5, however, the local minima at the centre of the plane are significantly higher. This can be attributed to a combination of faster wake decay as well as increased meandering. The results presented in figure 11(g–i) show the effect of the turbulence length scale. The larger turbulence length scale leads to a slight increase in ambient turbulence levels. As with cases G1I10 and H1I10, we observe an increase in the overall turbulence level. At $x=3D$, the local minimum of turbulence intensity in the centre of the profile is reduced compared with the respective case with a lower turbulent length scale. We observe that the helix approach leads to an even further reduction in the local minimum, although the effect is not as strong compared with the effect it had at lower turbulent length scales. At $x=5D$, H1L120 overlaps with G1L120, showing again that the effectiveness of the helix approach is reduced at larger turbulent length scales. Overall, we find that the helix approach leads to even higher turbulence intensity in the root and tip vortices, however, the effect is stronger at low turbulence intensities and length scales, a trend that has also been observed in all previous sections.
Turbulence intensity profiles in the vertical line through the centre of cross-stream planes at  $1D$ (a,d,g), $3D$ (b,e,h) and $5D$ (c,f,i) downstream of the turbine.

In conclusion, we have shown that both increased wake mixing, as well as reduction of wake overlap, contribute to the increase in kinetic energy in the rotor area downstream of the turbine. The reduction of overlap is most effective at low turbulence intensities when we can also observe a strong deflection of the wake. A larger length scale of the ambient turbulence seems to amplify the effect of the helix approach.
3.6. Wake shape
The previous subsection showed that the helix approach exhibits properties of wake-steering approaches since it significantly deflects the wake. A feature consistently found in studies examining yaw misalignment is the curled shape of the wake. We want to determine what effect the helix approach has on the wake shape. We show the velocity contours averaged in the meandering frame of reference at the cross-stream planes downstream of the turbine in figure 12 as well as the vector field of the cross-stream velocity components. The average velocity is computed by first translating the wake centre to the centre of the plane. In the case of the helix approach, the velocity field is also rotated with the helix frequency to obtain a ‘frozen’ helix. The mean is then computed by averaging the shifted and, if necessary, rotated velocity fields. The wake of the greedy case exhibits the expected rotational symmetry. In contrast, the helical wake has a shape similar to that of the curled wake found for yawed turbines and reported, for example, in Howland et al. (Reference Howland, Bossuyt, Martínez-Tossas, Meyers and Meneveau2016) or Hulsman et al. (Reference Hulsman, Wosnik, Petrović, Hölling and Kühn2022). Furthermore, we can observe the counter-rotating vortex pair observed in curled wakes. The topic of wake deformation is theoretically analysed in Zong & Porté-Agel (Reference Zong and Porté-Agel2020). They conclude that the asymmetric kidney shape originates from an uneven distribution of cross-stream velocity, leading to transport and shear of the wake, in turn causing deflection and deformation, respectively. There are three main differences between the deformation of the helical wake and the wake of a yawed turbine. First, due to the helical shape of the wake, the velocity deficit rotates, as can be clearly seen in figure 12. Second, the shapes of the helical and yawed wake have different chiralities. A tentative explanation could be found in the direction of rotation of the helix, which is clockwise. Thus, a negative vorticity is added, possibly having the opposite effect of the positive vorticity due to the hub vortex, which was shown in Zong & Porté-Agel (Reference Zong and Porté-Agel2020) to be the cause for the asymmetric shape. Finally, the vortices greatly differ in strength, the vortex with the same rotational direction as the wake is stronger than the vortex in the opposite direction. Still, the similarity to the curled wake of a yawed turbine could be a starting point for the development of engineering wake models for the helix approach.
Mean velocity contours in the cross-stream plane at  $4D$,
$4D$,  $5D$ and $6D$ downstream of the wake of cases G1V $9$ (a–c) and H1V $9$ (d–f) in the meandering frame of reference. In (d–f) the velocity fields are also rotated with the helix. Arrows show the direction of the cross-stream velocity field and are colored according to the velocity deficit. Line of sight is downstream.

3.7. Kinematics of a helical wake
To understand how the helical wake behaves and how it will interact with downstream turbines, the wake first has to be described in more detail. In particular, the phase of the helix when it reaches the turbine downstream will be of interest, which will be referred to as the helix angle later on. For the following discussion, we assume that all fluid particles in a cross-stream slice of the wake are advected by the same velocity, a common assumption for dynamic wake meandering models (Larsen et al. Reference Larsen, Madsen, Thomsen and Larsen2008). Furthermore, we assume that the force exerted due to the pitching is the primary cause of deflection, thus ignoring the effects of naturally occurring wake meandering and the radial moment due to the helix approach, as mentioned at the beginning of § 3. Based on the remarks at the beginning of this section, we define an average transport velocity,
 \begin{equation} \bar{u}_{helix}(x) = \frac{x-x_{0}}{t-t_{0}}, \end{equation}
where  $t_{0}$ is the point in time the fluid particle passed the rotor-swept area of the turbine at $x_{0}$. Given the assumption of a wake that is passively advected by the mean flow, the direction of deflection at point $x$ and time $t$ is the same as when the fluid particle passed the rotor disc at $x_{0}$ and $t_0$. Hence, (3.13) can be rearranged for $t_{0}$. After inserting (3.8) and (3.3), the angle of deflection at an arbitrary position $x$ downstream of the turbine, $\varphi (x,t)$, can be described as
 \begin{align} \varphi(x,t) &= \varphi\left(t-\frac{x-x_{0}}{\bar{u}_{helix}}\right) = {\rm \pi}- \omega_e\left(t-\frac{x-x_{0}}{\bar{u}_{helix}}\right) \nonumber\\ &= 2{\rm \pi} {St}\frac{x-x_{0}}{D}\frac{V_{0}}{\bar{u}_{helix}}+\varphi(x_0,t). \end{align}
We can eliminate the time dependency by looking at the difference between the angle of deflection at the turbine and the angle in the wake, the phase shift of the helix:
 \begin{equation} \varphi(x,t)-\varphi(x_{0},t) = 2{\rm \pi}{St}\frac{x-x_{0}}{D}\frac{V_{0}}{\bar{u}_{helix}} = \Delta \varphi(x). \end{equation}
From (3.15) we can see that the helix turns clockwise when looking downstream. This is also shown in figure 13. In addition, (3.15) shows that the phase shift scales with the size of the turbine and that it only depends on the ratio of the free-stream velocity to the helix transport velocity for a given turbine. To assess, whether this relationship holds in a simulated wake, the phase difference of the helical wake is shown in figure 14. We compute  $\Delta \varphi$ by rotating the position of the wake centre, which was determined in § 3.3, by $-\varphi (x_0)$. Via (3.8), $\varphi (x_0)$ is calculated for which $\beta$ was recorded during the simulation. The angle of the averaged wake centre is then computed and unwrapped, i.e. $2{\rm \pi}$ is added whenever the angle jumps more than ${\rm \pi}$ between two consecutive planes. Since the maximum increase in $\Delta \varphi$ between two planes is ${\rm \pi} /2$, this procedure yields the correct angle. From these angles the local mean helix transport, $\bar {u}_{helix}$ is computed by rearranging (3.15), to compare the results to the assumption of a constant transport velocity.
Schematics of a helical wake including a representation of deflection  $d$ and helix angle $\phi$. The dotted line represents the centre of the wake.

Angle of deflection and mean helix transport velocity downstream of a single turbine in helix operation.

The examination of figure 14(a,d) reveals that the transport velocity increases with downstream distance. The shape is reminiscent of the centre line velocity deficit in a wake. We also observe that the transport velocity is significantly higher in case H1V $13$. The helix transport velocity is linked to the velocity in the wake, which is higher in H1V $13$ compared with the baseline case, see figure 8. The effect is also visible as a decrease in $\Delta \varphi$. The influence of turbulence intensity, shown in figure 14(b,e), is negligible. Again, this observation is closely in line with figure 8(b), though the differences in $\bar {u}_{helix}$ are even smaller. In figure 14(c,f), where the dependency on turbulence length scale is shown, we find a slightly higher $\bar {u}_{helix}$ throughout the wake in the case with higher turbulence length scale. Again, this matches the earlier findings in the examination of the kinetic energy. Overall, the helix transport velocity is not constant throughout the wake. Instead, the helix accelerates, like the fluid in the wake. Comparing all cases, we see that the change in ambient turbulence leads to negligible differences in the helix angle. However, the change in tip-speed ratio and consequently thrust coefficient and velocity deficit results in a large difference.
4. Theoretical considerations on the interaction of two helices
If the helix approach is applied, the wake of a turbine in helix operation will interact with the turbines and their wakes downstream. As we found in Korb et al. (Reference Korb, Asmuth, Stender and Ivanell2021), the interaction is not straightforward and needs to be understood more thoroughly to extend the application of the helix approach to a whole wind farm. An important aspect of the interaction is the relation of the respective angles,  $\varphi$, of the different helices. In this section, we show some theoretical considerations of the angle between two helices and the implications for the angle of attack of a downstream turbine. These considerations are compared with numerical investigations in the next section.
4.1. The phase difference between two helices
According to (3.15), the helix of the first turbine has an angle  $\varphi _0$ at the location of the second turbine, $x_1 = x_0+S_x$, of
 \begin{equation} \varphi_0(x_1,t) = \Delta \varphi_0 (S_x) + \varphi_0(x_0,t) = {\rm \pi}+ 2{\rm \pi} {St}\left(\frac{S_x}{D}\frac{V_0}{\bar{u}_{helix,0}}-\frac{V_0t}{D}\right). \end{equation}
We have added the index 0 to the helix transport velocity to indicate that it is the helical wake of the first turbine that is being transported with that velocity. There are two ways of applying the helix approach at the second turbine, depending on whether the Strouhal number is based on the free stream or local inflow velocity. If the Strouhal number is based on the local inflow velocity  $V_1$, the angle of the helix of the second turbine is given by
 \begin{equation} \varphi_1(x,t) = {\rm \pi}+ 2{\rm \pi} {St}\left(\frac{x-x_1}{D}\frac{V_1}{\bar{u}_{{helix},1}}-\frac{V_1t}{D}\right). \end{equation}
This implies that the phase difference between the helix of the first and the second turbine is described by
 \begin{equation} \varphi_1(x_1,t)-\varphi_0(x_1,t) = 2 {\rm \pi}{St}\frac{(V_0-V_1)t}{D} - \Delta \varphi_0(S_x). \end{equation}
Therefore, the phase difference between the two helices changes with time and can not be set to a constant value determined by controllable parameters. However, based on the preliminary findings in Korb et al. (Reference Korb, Asmuth, Stender and Ivanell2021), we know that the phase difference is very important for the power production of the downstream turbines. Thus, a definition of the Strouhal number based on the local inflow velocity does not allow for an analysis of the influence of the phase difference and is therefore disregarded for the rest of this study. Instead, we choose a definition based on the free-stream velocity. With that definition, the phase of the second helix is described by
 \begin{equation} \varphi_1(x,t) = \varphi_0(x_0,t) + \Delta \varphi_1(x-x_1) = 2{\rm \pi} {St}\frac{x-x_1}{D}\frac{V_0}{\bar{u}_{{helix},1}} + \varphi_0(x_0,t). \end{equation}
By evaluating (4.4) and (4.1) at the location of the second turbine,  $x_1=x_0+S_x$, the phase difference between the helices can be found to be
 \begin{equation} \varphi_1(x_1,t)-\varphi_0(x_1,t) ={-}\Delta\varphi_0(S_x) , \end{equation}
which is constant in time. By replacing  $\beta$ with
 \begin{equation} \beta' = \beta - (\varPhi_1 + \Delta\varphi_0(S_x)), \end{equation}
in (3.2) at the second turbine, the effective phase difference can be set to a value of choice  $\varPhi _1$:
 \begin{equation} \varphi'_1(x_1,t) - \varphi_0(x_1,t) = \varphi_0(x_0,t) + \varPhi_1 + \Delta\varphi_0(S_x) - (\varphi_0(x_0,t)+\Delta\varphi_0(S_x))) = \varPhi_1. \end{equation}
Thus, adding a constant shift to the sinusoidal variation of the pitch allows for the exact control of the phase difference. The phase difference between the helices exerted by the two turbines will influence the interaction and affect the total efficiency of the park. Thus, it is of interest how to choose  $\varPhi _1$.
4.2. The angle of attack
As discussed previously, the force exerted on the wake will deflect the wake in the direction of said force. Therefore, while ignoring any dissipative processes, the fluid will have a velocity component  $v_{helix}$ in the direction of the deflection, $\varphi _0(x,t)$. This velocity vector at the second turbine has the form
 \begin{equation} \begin{bmatrix} u_{helix} \\ -v_{helix} \sin\left(\varphi_0(S_x,t)\right) \\ v_{helix} \cos\left(\varphi_0(S_x,t)\right) \end{bmatrix}. \end{equation}
By examining the velocities at the blade and including the varying pitch angle of the downstream turbine we can find an expression for the angle of attack at the blade. To minimise the deviation of the angle of attack, the pitch angle has to be in phase with the variation of the angle of the relative velocity. In Appendix B we show that this is the case when  $\varPhi _1=0$. However, a closer examination of the equations also shows that the influence is strongest near the root of the blade and becomes negligible near the tip. Thus, from a theoretical point of view, the change in the angle of attack likely has only little influence on the performance.
5. Results of applying the helix approach to three turbines
In this section, we want to test the theoretical predictions made in § 4. We, therefore, analyse the results from the simulations of multiple turbines, called H3PS0, H3PS90, H3PS180 and H3PS270. We focus on the influence of the phase difference between the helices of the turbines,  $\varPhi _1$, which is zero when the helices are aligned, corresponding to case H3PS0. To determine the phase shift, we assumed a transport velocity $\bar {u}_{helix}/V_0=0.7$, based on the results in § 3.7. This simple assumption does not account for induction by downstream turbines. A more complex model might be able to improve the prediction by incorporating a wake and an induction model. However, these additional models would also have to be tuned for the helical approach. Instead, we prefer to quantify our error.
5.1. The influence of induction
The induction of a downstream turbine slows down the flow upstream of the turbine. Therefore, we must expect  $\bar {u}_{helix}$ to be lower compared with the value we measured in § 3.7. Here we want to quantify this influence. To this end, we recorded a set of cross-stream planes at $D$,
$D$,  $3D/4$, $D/2$ and $D/4$ upstream of the second turbine and determined the helix transport velocity with the same procedure as figure 14. The results are shown in figure 15. We can see that the induction leads to a decrease in transport velocity in the wake, as anticipated. We also observe that the phase shift influences the transport velocity close to the turbine. Thus, the phase shift and the transport velocity are coupled. Setting the actual phase shift would require iteratively adapting the phase shift to the measured transport velocity. Consequently, our phase shifts determined a priori are also not accurate. We can compute a correction factor based on the measured phase shift at $x=4.75D$. We define the actual transport velocity to be $\tilde {u}_{helix}$. After replacing $\bar {u}_{helix}$ with $\tilde {u}_{helix}$ in (4.1) and some rearranging we find that the actual phase of the helix of the first turbine, $\Delta \tilde {\varphi }_0(x)$, at $x=S_x$ is
 \begin{equation} \Delta \tilde{\varphi}_0(S_x) = 2 {\rm \pi}{St} \frac{S_x}{D} \frac{V_0}{\bar{u}_{helix}} \left(1+\frac{\bar{u}_{helix}-\tilde{u}_{helix}}{\tilde{u}_{helix}}\right) =\Delta \varphi_0(S_x) + 2 {\rm \pi}{St} \frac{S_x}{D} \frac{V_0}{\bar{u}_{helix}} \frac{\bar{u}_{helix}-\tilde{u}_{helix}}{\tilde{u}_{helix}}. \end{equation}
Thus, we define a correction factor
 \begin{equation} \hat{\varPhi}_1 = 2 {\rm \pi}{St} \frac{S_x}{D}\frac{V_0}{\bar{u}_{helix}} \frac{\bar{u}_{helix}-\tilde{u}_{helix}}{\tilde{u}_{helix}}. \end{equation}
By using (5.1) in (4.5), we find that the actual phase shift between the helices is
 \begin{equation} \tilde{\varPhi}_1 = \varphi_1(S_x, t)-\varphi_0(S_x, t) = \varPhi_1-\hat{\varPhi}_1. \end{equation}
We list the correction factors and corrected phase shifts in table 3. As we can see, the correction factor varies between  $19^\circ$ and $36^\circ$.
Detailed measurement of  $\bar {u}_{helix}$ in the wake of the first turbine at $1D$,
$1D$,  $0.75D$, $0.5D$ and $0.25D$ upstream of the second turbine.

Phase shift correction values and corrected phase shifts for the three turbine cases.

5.2. Angle of attack
To test the previous hypotheses, the results from the simulations with three turbines are analysed in the following section. First, the distribution of the angle of attack at the nodes of the actuator line is shown in figure 16. In comparison with case G3,  $\alpha$ varies more if the helix is applied. This is generally expected given the varying pitch angle. However, significant differences can be observed between the various cases. In § 4.2, we predicted the lowest variations to occur when $\varPhi _1=0$, the case closest to that is H3PS $0$. Indeed, we find the lowest variations in case H3PS0, followed by H3PS90. The widest spread of angles of attack is found in case H3PS370. We also noted that our preliminary model predicted little influence towards the tip of the blade. However, we observe a dependency of the distribution of the angle of attack in all cases over the entire length of the blade. To fully explain the behaviour a more complex model is needed, which possibly also takes into account wake shape and the deflection. However, we abstain from constructing such a model at this point, since we deem that outside the aim of this study.
Histogram of the angle of attack along the blades of the second turbine of cases (a) G, (b) H3PS0, (c) H3PS90, (d) H3PS180 and (e) H3PS270.

5.3. Wake centre distribution
Analogously to the analysis of the wake of a single turbine, we want to examine the distribution of the wake centre distance  $d$. The distribution at six cross-stream planes is shown in figure 17. The top row shows planes in the wake of the first turbine while the bottom row shows the planes at the same distances downstream from the second turbine. The distributions in the wake of the first turbine are essentially the same across all cases with the helix. As was shown previously, the mean wake centre distance increases with downstream distance and the distribution of $d$ is close to a normal distribution. The results for $d$ of case G3 again follow a Rayleigh distribution. On the other hand, in the wake of the second turbine, the phase angle has a large effect. The wake centres in case H3PS90 are clearly closest to the centre of the plane and their distributions are actually very close to the distribution of the baseline case. Case H3PS270 exhibits the largest mean wake centre distance, which is even higher than the mean at the corresponding distance downstream of the first turbine. The results obtained from cases H3PS0 and H3PS180 are similar and lie in between those of H3PS90 and H3PS270. In § 5.2 we found that the optimal angle of attack was obtained in case H3PS0, however, this does not correspond to a large deflection of the wake centre. In the wake of H3PS90, we observe virtually no wake deflection, therefore, we assume that the wake of the second turbine no longer has a helical structure.
Distribution of wake centres  $2D$,
$2D$,  $3D$ and $4D$ downstream of the first (a–c) and second turbine (d–f), respectively.

5.4. Kinetic energy
To show the effect of varying the phase shift on the kinetic energy, the kinetic energy of the mean flow across the rotor area in the static frame of reference is shown in figure 18. Most importantly, the flow starts to recover earlier compared with the baseline case, as can be seen by the marked local minimum. It also recovers faster due to the increased entrainment discussed earlier. As was suggested by figure 17, the recovery of mean-flow kinetic energy is identical in the wake of the first turbine in all four cases.
Mean kinetic energy in rotor area. Markers highlight the local minima and dotted black lines the location of the turbines.

The wake of the second turbine is different for all cases. We see that the wake of the second turbine recovers the earliest and fastest in case H3PS270, which is also the case where the wake centre distances were most pronounced. The maximum of kinetic energy in the wake of the second turbine is even higher than the maximum in the first wake. This implies that more energy is entrained in the wake than was extracted by the second turbine. Cases H3PS90 and H3PS180 have very similar locations of the local minimum, while the kinetic energy in case H3PS0 is somewhat higher. In case H3PS90, the recovery begins last and distinctly less energy is being entrained. The local minimum is located even further downstream than that of the case without the helix and the kinetic energy in the wake is only slightly higher than in the reference case. Based thereupon we can conclude that the continued deflection of the wake is crucial to continued enhanced wake recovery. In the worst case, the helix approach leads to negligible increases in the wake of the second turbine.
A simple superimposition of the helical wakes would suggest that case H3PS0 is the optimal case. However, that does not match our observations. Therefore, we have to look for other explanations. We suggest that the reason is a combination of a higher angle of attack, leading to a stronger radial force and the direction that this force has. In case H3PS0 the force is weaker since the angle of attack, especially at the blade tip is lower than in case H3PS270. In case H3PS180 the angle of attack is distributed similarly, however the force of the second turbine counteracts the helix of the first wake, effectively destroying the helix structure.
5.5. Radial force
We can compute the radial force from the tangential force at the blades. The tangential force can be split into a component in the direction of  $\varphi _0$ and an orthogonal component. Note, $\varphi _0$ is the direction of the helix due to the first turbine. Thus, the radial force can be expressed as
 \begin{equation} \boldsymbol{F}_r = \sum_{b=0}^{N_b-1} F_t \begin{bmatrix} \cos\left(\varPsi_b-\varphi_0\right) \\ \sin\left(\varPsi_b-\varphi_0\right) \end{bmatrix}. \end{equation}
The mean values of the aligned and orthogonal force components are shown in figure 19. To draw a comparison to the baseline case, the values for case G3 are also given. In case G3, the forces are averaged in a static frame of reference.
Radial force exerted by the second turbine onto the flow. (a) Mean force in the direction of deflection. (b) Mean force in the direction orthogonal to deflection.

As expected, we find that the mean force in the static frame of reference in case G3 is small in both directions. In cases H3PS0 and H3PS270, the turbine exerts a force in the direction of the helix, with the force in case H3PS270 being approximately twice as large as in case H3PS0. In cases H3PS180 and H3PS90 we find that the force is exerted in the opposing direction. However, in case H3PS180 the turbine also exerts a large force in the orthogonal direction, causing the deflection observed in figure 17. In cases H3PS270 and H3PS90, smaller amounts of force are exerted in the orthogonal direction, while the force is negligible in case H3PS0. The total radial force is significantly smaller in case H3PS0, compared with the other cases, while the largest force is found in case H3PS180. This corresponds to the distribution of the angle of attack observed in figure 16.
In summary, we find that the amount of radial force corresponds to the distribution of the angle of attack. However, the radial force only leads to larger deflection and higher available kinetic energy if it is also directed in the same direction as the impinging helix.
5.6. Power and thrust
Finally, we want to examine the effect of the helical wake on the mechanical power production and thrust of the turbines. The mean power production and thrust force are shown in figure 20.
Mean (a) power and (b) thrust of the simulations with three turbines. Vertical lines represent 2 standard deviations. Numbers in bars are, in per cent, the mechanical power relative to mean power of the undisturbed flow and the thrust relative to mean force on the rotor disc in the undisturbed flow, respectively.

In normal operation, the first turbine has a power coefficient of 0.56. The power coefficient is reduced by 2 percentage points in all cases due to applying the helix, which is in line with the findings of Frederik et al. (Reference Frederik, Doekemeijer, Mulders and van Wingerden2020). The mean thrust force remains virtually unchanged. We note that the actuator line method is known to over-predict the tangential forces near the blade root and tip and thus predicts higher mechanical power values compared to blade element momentum theory. See Meyer Forsting, Pirrung & Ramos-García (Reference Meyer Forsting, Pirrung and Ramos-García2019) for a detailed discussion.
The power generation of the second turbine is increased significantly due to the application of the helix approach. In cases H3PS0, H3PS90 and H3PS180, the power is improved by 5 percentage points, and in case H3PS270, even 6 percentage points compared with the greedy case. The increase in power production is in line with the larger available kinetic energy discussed in § 5.4.
The power production of the third turbine highlights the importance of sustaining the helical wake. Here, the power improvement over the baseline case has increased to 7 percentage points in case H3PS270, while cases H3PS180 and H3PS0 show a lower improvement of 3 and 4 percentage points, respectively. The second turbine shows no improvement compared with the baseline in case H3PS90. Due to the higher inflow velocity, the thrust at the second turbine is significantly higher in all cases. The aforementioned differences in the mean flow kinetic energy lead to significant differences in the thrust at the last turbine, with the highest values observed again in case H3PS270, with an 11 percentage point increase compared with the baseline case.
In summary, we can conclude that the increase in power production can be sustained over multiple turbines if the helices have an angle of approximately  $270^\circ$ due to a combination of increased radial force and optimal direction of the wake deflection. A maximum increase of 12 percentage points overall is observed for the considered inflow case. Nevertheless, even in the worst case examined (H3PS90), the total improvement amounts to 4 percentage points. It is very well possible that higher power gains could be achieved by further optimising the phase difference between the helices. Furthermore, the phase difference of the helices of the second and third turbine have not been explored here in great detail. Here, further optimisation is also promising. As we observed at the beginning of this section, the phase shift cannot be computed accurately a priori. Therefore, we propose that an optimisation procedure should be employed to find the true optimal phase difference. Any optimisation process would have to be carried out in a similar cascading manner as the determination of the rotor speed in this work. Since the transport velocity appears to be largely independent of ambient turbulence, the optimisation would only have to be carried out once, as long as the turbines keep the same tip-speed ratio.
6. Conclusion
We have examined various aspects of helical wakes including the process of wake mixing, the importance of wake deflection and the application of the helix approach to multiple turbines. To that end, we have conducted numerical simulations of one and three turbines, as well as supporting analytical investigations. Overall, we find that the helix approach leads to a significant wake deflection in addition to increased mixing. When applying the helix approach to multiple turbines, a phase difference of  $270^\circ$ between the helices was found to be optimal. If the helix is sustained throughout multiple wakes, we observe a significant power increase of 12 % for a small wind farm of three aligned wind turbines.
We have conducted a total of 15 simulations, eight simulations with a single NREL 5MW turbine and five simulations with three turbines of the same kind. Furthermore, we conducted two simulations of a single turbine at a higher resolution but with low ambient turbulence. The single-turbine simulations were conducted with four different inflow conditions and once with and without the helix approach. Of the multiturbine simulations, one was conducted without the helix approach, while the other four multiturbine cases varied in the phase difference between the individual helices.
The investigation of a single helical wake shows that the changing pitch angle of the helix approach leads to a varying thickness of the tip vortices, which causes the vortices to merge and thus preempts the typical leap-frogging of vortex pairs. We also note an earlier break-up of vortices and a strong displacement of the vortex rings further downstream in the helical wake. By analysing the distance of the wake centre to the centre of the rotor plane, we demonstrate that the helix approach steers the wake out of the plane centre and that this deflection increases with downstream distance. The deflection is weaker under higher ambient turbulence intensity, but insensitive to the turbulence length scale.
The helix approach not only deflects the wake but also triggers an earlier transition of the wake. This is accompanied by a faster wake recovery, which is due to a stronger entrainment of kinetic energy into the rotor area. If the helix is applied, entrainment can be observed further upstream in the wake and the increase is generally stronger in all investigated cases, however, the benefit is larger at low ambient turbulence intensities. In the near wake, the overall increase in kinetic energy is mainly due to an increased mixing. Further downstream, the larger available kinetic energy is increasingly due to the deflection steering the velocity deficit away from the rotor area of downstream turbines. Moreover, we find that the wake shape has similarities to that of a curled wake due to yaw misalignment, but has the opposite chirality. A further investigation of the similarities and to what extent descriptions of curled wakes can be applied to helical wakes can be an interesting aspect for future studies.
By developing a simple model for the angle of the displacement of the wake, we predict that the angle depends on the ratio of the inflow velocity to the transport velocity of the wake. We demonstrate that the angle of the helix and the ratio of inflow velocity to the helix transport velocity are virtually independent of the ambient turbulence. To this end, we examine the wakes of the single-turbine cases by analysing the angle of the displacement in the numerical simulations. Reducing the tip-speed ratio led to a faster acceleration of helix transport.
For a better understanding of the effects of the helix approach within a wind farm, we examine the impact of the helical motion of the wake on the angle of attack at the blades of the downstream turbine analytically. We first note, that in order to examine the influence of the phase difference, the phase difference has to be constant. This is only the case if the excitation of all helices is based on the same Strouhal number definition. In addition, we derive an expression to explicitly set the phase difference between two helices, based on the ratio of transport to inflow velocity and Strouhal number. By examining the effect of the phase difference on the angle of attack at the blade of the second turbine, we find that a phase difference of  $0$ is the optimal setting to minimise deviations from the optimal angle of attack. Yet, the equation also predicts a decreasing effect of the helix on the angle of attack towards the tip of the blade. We examine the effect of induction by downstream turbines on the helix transport velocity and observe that the induction leads to a reduction of the transport velocity but also depends on the phase difference. Therefore, transport velocity and phase difference are coupled. We analyse the angle of attack at the second turbine in the simulations of three turbines and confirm that the phase difference of $0$ leads to the smallest variations. We also observe large variations along the whole blade, likely due to the wake deflection, which we had not considered in the theoretical analysis.
Through further examination of the multiturbine cases, we find that the deflection observed in the wake of the first turbine can be repeated in the wake of the second turbine if the helices have an angle of  $270^\circ$. By comparing the radial force exerted by the second turbine we find that the case with a phase difference of $270^\circ$ exerts the highest force in the direction of the deflection of the impinging helix. We conjecture that a balance between an alignment of the helices and a large radial force leads to a pronounced helix in the second wake. Since we had observed that the deflection of the wake is a significant contributor to the increasing kinetic energy in the wake, sustaining deflection over multiple turbines is crucial to the application of the helix over multiple turbines. An angle of helices of $270^\circ$ also leads to significantly more kinetic energy in the wake of all turbines. We even find that the local maximum of kinetic energy in the wake of the second turbine exceeds the local maximum in the wake of the first turbine in that case. Finally, we observe that the power production of the turbines increases in all investigated scenarios if the helix is applied. However, when the helices have a phase difference of $270^\circ$, we see a total gain in the power production of 12 %, compared with just 4 % in the case of a phase difference of $90^\circ$. While the application of the helix approach improves the production of the second turbine by more than 22 % in all cases, the gains of the third turbine differ between 30 % and negligible improvements, depending on the alignment. Thus, we conclude, that the optimal angle, which we suggest is a combination of an increased angle of attack and alignment of the helices, is crucial to a successful application of the helix approach to multiple turbines. Lastly, we show that the thrust at the second and third turbines increases due to increased inflow velocity in all cases. However, the increase is largest for the cases with a phase difference of $270^\circ$ due to an increased inflow velocity.
The presented study discusses multiple aspects of the helix approach and its effect on the wake of a single turbine and the wakes of multiple turbines. The helix approach triggers an earlier transition and consequently more effective wake mixing, which had been reported in previous studies as the primary reason for power gains. In addition, it deflects the wake centre in a rotating motion, which reduces the overlap with potential downstream turbines. Both these aspects lead to more kinetic energy available to downstream turbines. The biggest impact of the helix approach is found at low ambient turbulence intensity, larger ambient turbulent structures on the other hand do not reduce its effectiveness. When applying the helix approach to multiple turbines the helices of the turbines have to have a relative phase difference of  $270^\circ$ to harvest the highest power gains. To facilitate the analysis, some simplifications in the theoretical considerations and the simulations were made. For one, we did not examine the effect of the moment exerted by the turbine. Future studies could investigate the moment's effect on wake mixing and whether there is an effect on wake deflection. Another such simplification was the use of shear-free inflow. Future studies should examine the interaction of shear and entrainment as well as the effect on the wake shape. Furthermore, the loads on the turbines were not considered here. To increase the lifetime production of a turbine, an increase in power production has to be balanced with an increase in fatigue load due to the frequent pitching of the blade and the additional radially rotating force and moment. Nevertheless, the application of the helix approach showed great promise to be able to improve wind farm efficiency without any physical changes to the turbines.
Acknowledgements
The authors want to thank their colleagues at the wind energy group for the fruitful discussion.
Funding
The research was funded by Uppsala University.
Declaration of interests
The authors report no conflict of interest.
Appendix A. Force and moments of the helix approach
Here we present the computation of forces and moments exerted by the rotor onto the flow due to the helix approach. We first make note of a couple of relationships that come up in the computation. Applying Lagrange's trigonometric identities to evenly distributed angles, such as the azimuth angles of the blades, always yields
 \begin{gather} \sum_{b=0}^{N_b-1}\sin\left(b\frac{2{\rm \pi}}{N_b}\right) = 0, \end{gather}
 \begin{gather}\sum_{b=0}^{N_b-1}\cos\left(b\frac{2{\rm \pi}}{N_b}\right) = 0. \end{gather}
This also holds true if a constant offset is added:
 \begin{gather} \sum_{b=0}^{N_b-1}\sin\left(\varPsi+b\frac{2{\rm \pi}}{N_b}\right) = \sin\left(\varPsi\right)\sum_{b=0}^{N_b-1}\cos\left(b\frac{2{\rm \pi}}{N_b}\right)+\cos\left(\varPsi\right)\sum_{b=0}^{N_b-1}\sin\left(b\frac{2{\rm \pi}}{N_b}\right) = 0, \end{gather}
 \begin{gather}\sum_{b=0}^{N_b-1}\cos\left(\varPsi+b\frac{2{\rm \pi}}{N_b}\right) = \sin\left(\varPsi\right)\sum_{b=0}^{N_b-1}\sin\left(b\frac{2{\rm \pi}}{N_b}\right)-\cos\left(\varPsi\right)\sum_{b=0}^{N_b-1}\cos\left(b\frac{2{\rm \pi}}{N_b}\right) = 0. \end{gather}
We also derive the sum of the second powers of sine and cosine as well as the product of sine and cosine, by using the power reduction formula and Lagrange's trigonometric identities again:
 \begin{gather} \sum_{b=0}^{N_b-1}\sin^2\left(\varPsi+b\frac{2{\rm \pi}}{N_b}\right) =\frac{1}{2}\sum_{b=0}^{N_b-1}1-\cos\left(2\left(\varPsi+b\frac{2{\rm \pi}}{N_b}\right)\right) = \frac{N_b}{2}, \end{gather}
 \begin{gather}\sum_{b=0}^{N_b-1}\cos^2\left(\varPsi+b\frac{2{\rm \pi}}{N_b}\right) =\frac{1}{2}\sum_{b=0}^{N_b-1}\cos\left(2\left(\varPsi+b\frac{2{\rm \pi}}{N_b}\right)\right)+1 = \frac{N_b}{2}, \end{gather}
 \begin{gather}\sum_{b=0}^{N_b-1}\sin\left(\varPsi+b\frac{2{\rm \pi}}{N_b}\right)\cos\left(\varPsi+b\frac{2{\rm \pi}}{N_b}\right) =\frac{1}{2}\sum_{b=0}^{N_b-1}\sin\left(2\left(\varPsi+b\frac{2{\rm \pi}}{N_b}\right)\right) = 0. \end{gather}
Beginning from (3.6), we insert (3.2) and (3.5), and obtain
 \begin{equation} \boldsymbol{F}\propto
\sum_{b=0}^{N_b-1}\begin{bmatrix}
-\cos\left(\phi\right)\left(C_L(\phi)-A\displaystyle\frac{\partial{C_L}}{\partial{\alpha}}\sin\left(\varPsi_b+\omega_et\right)\right)\\
\sin\left(\phi\right)\left(C_L(\phi)-A\displaystyle\frac{\partial{C_L}}{\partial{\alpha}}\sin\left(\omega_et+\varPsi_b\right)\right)\cos\left(\varPsi_b\right)
\\
\sin\left(\phi\right)\left(C_L(\phi)-A\displaystyle\frac{\partial{C_L}}{\partial{\alpha}}\sin\left(\omega_et+\varPsi_b\right)\right)\sin\left(\varPsi_b\right)
\end{bmatrix}.
\end{equation}
\begin{equation} \boldsymbol{F}\propto
\sum_{b=0}^{N_b-1}\begin{bmatrix}
-\cos\left(\phi\right)\left(C_L(\phi)-A\displaystyle\frac{\partial{C_L}}{\partial{\alpha}}\sin\left(\varPsi_b+\omega_et\right)\right)\\
\sin\left(\phi\right)\left(C_L(\phi)-A\displaystyle\frac{\partial{C_L}}{\partial{\alpha}}\sin\left(\omega_et+\varPsi_b\right)\right)\cos\left(\varPsi_b\right)
\\
\sin\left(\phi\right)\left(C_L(\phi)-A\displaystyle\frac{\partial{C_L}}{\partial{\alpha}}\sin\left(\omega_et+\varPsi_b\right)\right)\sin\left(\varPsi_b\right)
\end{bmatrix}.
\end{equation}
Beginning with  $F_x$, using (A3) yields
 \begin{align} F_x &\propto{-}\cos\left(\phi\right) \left(N_bC_L(\phi)-A\frac{\partial{C_L}}{\partial{\alpha}}\sum_{b=0}^{N_b-1}\sin\left(\varPsi_b+\omega_et\right)\right) \nonumber\\ &={-}\cos\left(\phi\right)N_bC_L(\phi). \end{align}
The thrust is thus constant in time. To determine  $F_y$, we first expand all terms:
 \begin{equation} F_y \propto \sin\left(\phi\right) \left(C_L(\phi)\sum_{b=0}^{N_b-1} \cos\left(\varPsi_b\right) -A\frac{\partial{C_L}}{\partial{\alpha}}\sum_{b=0}^{N_b-1}\sin\left(\varPsi_b+\omega_et\right)\cos\left(\varPsi_b\right) \right). \end{equation}
The first sum evaluates to 0 due to (A4). The expansion of the second sum and the subsequent application of (A6) and (A7) yields
 \begin{align} F_y &\propto{-}\sin\left(\phi\right) A\frac{\partial{C_L}}{\partial{\alpha}} \left(\cos\left(\omega_et\right)\sum_{b=0}^{N_b-1}\sin\left(\varPsi_b\right)\cos\left(\varPsi_b\right)+\sin\left(\omega_et\right)\sum_{b=0}^{N_b-1}\cos^2\left(\varPsi_b\right)\right) \nonumber\\ &={-}\sin\left(\phi\right) A\frac{\partial{C_L}}{\partial{\alpha}}\sin\left(\omega_et\right)\frac{N_b}{2} . \end{align}
To obtain  $F_z$, we follow a similar procedure. Expansion of all terms yields
 \begin{equation} F_z \propto \sin\left(\phi\right) \left(C_L(\phi)\sum_{b=0}^{N_b-1} \sin\left(\varPsi_b\right) -A\frac{\partial{C_L}}{\partial{\alpha}}\sum_{b=0}^{N_b-1}\sin\left(\varPsi_b+\omega_et\right)\sin\left(\varPsi_b\right) \right). \end{equation}
The first sum is again 0, leaving
 \begin{align} F_z &\propto{-}\sin\left(\phi\right) A\frac{\partial{C_L}}{\partial{\alpha}} \left(\sin\left(\omega_et\right)\sum_{b=0}^{N_b-1}\sin\left(\varPsi_b\right)\cos\left(\varPsi_b\right)+\cos\left(\omega_et\right)\sum_{b=0}^{N_b-1}\sin^2\left(\varPsi_b\right)\right)\nonumber\\ &={-}\sin\left(\phi\right) A\frac{\partial{C_L}}{\partial{\alpha}}\cos\left(\omega_et\right)\frac{N_b}{2}. \end{align}
Thus, we arrive at (3.7):
 \begin{equation} \boldsymbol{F}
\propto{-} N_b\begin{bmatrix}
\cos\left(\phi\right)C_L(\phi) \\
\dfrac{1}{2}\sin\left(\phi\right)
A\displaystyle\frac{\partial{C_L}}{\partial{\alpha}}
\sin\left(\omega_et\right)\\
\dfrac{1}{2}\sin\left(\phi\right)
A\displaystyle\frac{\partial{C_L}}{\partial{\alpha}}
\cos\left(\omega_et\right) \end{bmatrix} ={-}
N_b\begin{bmatrix} \cos\left(\phi\right)C_L(\phi) \\ C_1
\sin\left(\omega_et\right)\\ C_1 \cos\left(\omega_et\right)
\end{bmatrix}.
\end{equation}
\begin{equation} \boldsymbol{F}
\propto{-} N_b\begin{bmatrix}
\cos\left(\phi\right)C_L(\phi) \\
\dfrac{1}{2}\sin\left(\phi\right)
A\displaystyle\frac{\partial{C_L}}{\partial{\alpha}}
\sin\left(\omega_et\right)\\
\dfrac{1}{2}\sin\left(\phi\right)
A\displaystyle\frac{\partial{C_L}}{\partial{\alpha}}
\cos\left(\omega_et\right) \end{bmatrix} ={-}
N_b\begin{bmatrix} \cos\left(\phi\right)C_L(\phi) \\ C_1
\sin\left(\omega_et\right)\\ C_1 \cos\left(\omega_et\right)
\end{bmatrix}.
\end{equation}
For the sake of completeness, we also derive the moment exerted by the blades at an arbitrary radius  $r$. The global coordinates of the point $\boldsymbol {x}_b$ on the blade $b$ are $\boldsymbol {x}_b=\begin {bmatrix} 0, -r \, \sin \left (\varPsi _b\right ), r\, \cos \left (\varPsi _b\right ) \end {bmatrix}^{\rm T}$. Thus, the moment $\boldsymbol {M}$ is
 \begin{equation} \boldsymbol{M} \propto
\sum_{b=0}^{N_b-1} \boldsymbol{x}_b \times \boldsymbol{F}_b
= r\sum_{b=0}^{N_b-1}\begin{bmatrix}
\left(\sin^2\left(\varPsi_b\right)+
\cos^2\left(\varPsi_b\right)\right)F_t \\
-\cos\left(\varPsi_b\right)F_n \\
-\sin\left(\varPsi_b\right)F_n \end{bmatrix}.
\end{equation}
\begin{equation} \boldsymbol{M} \propto
\sum_{b=0}^{N_b-1} \boldsymbol{x}_b \times \boldsymbol{F}_b
= r\sum_{b=0}^{N_b-1}\begin{bmatrix}
\left(\sin^2\left(\varPsi_b\right)+
\cos^2\left(\varPsi_b\right)\right)F_t \\
-\cos\left(\varPsi_b\right)F_n \\
-\sin\left(\varPsi_b\right)F_n \end{bmatrix}.
\end{equation}
Here  $M_x$ is easily shown to be
 \begin{equation} M_x ={-}rN_b\sin\left(\phi\right)C_L(\alpha_0). \end{equation}
By expanding  $M_y$, we obtain
 \begin{equation} M_y \propto{-}r \cos\left(\phi\right)\left(C_L(\phi)\sum_{b=0}^{N_b-1}\cos\left(\varPsi_b\right)-A\frac{\partial{C_L}}{\partial{\alpha}}\sum_{b=0}^{N_b-1}\sin\left(\varPsi_b+\omega_et\right)\cos\left(\varPsi_b\right)\right). \end{equation}
By noting that the first sum vanishes and expanding the second sum we arrive at
 \begin{equation} M_y \propto r \cos\left(\phi\right)\frac{N_b}{2}\frac{\partial{C_L}}{\partial{\alpha}}\sin\left(\omega_et\right). \end{equation}
By applying the same steps to  $M_z$, we obtain
 \begin{equation} M_z \propto r \cos\left(\phi\right)\frac{N_b}{2}\frac{\partial{C_L}}{\partial{\alpha}}\cos\left(\omega_et\right). \end{equation}
Therefore,  $\boldsymbol {M}$ has the form
 \begin{equation} \boldsymbol{M} \propto
rN_b \begin{bmatrix} -\sin\left(\phi\right)C_L(\alpha_0) \\
C_2\sin\left(\omega_et\right) \\
C_2\cos\left(\omega_et\right) \end{bmatrix},
\end{equation}
\begin{equation} \boldsymbol{M} \propto
rN_b \begin{bmatrix} -\sin\left(\phi\right)C_L(\alpha_0) \\
C_2\sin\left(\omega_et\right) \\
C_2\cos\left(\omega_et\right) \end{bmatrix},
\end{equation}
where  $C_2 = A({N_b}/{2})({\partial C_L}/{\partial \alpha })\cos \left (\phi \right )$.
Appendix B. The angle of attack at a downstream turbine
To derive the angle of attack at a downstream turbine we begin with the local velocity at the blade in the global reference frame as described in § 4.2:
 \begin{equation} \boldsymbol{u} =
\begin{bmatrix} u_{helix} \\
v_{helix}\sin\left(\varphi_0(S_x,t)-\varPsi_b\right) \\
v_{helix}\cos\left(\varphi_0(S_x,t)-\varPsi_b\right)
\end{bmatrix}.
\end{equation}
\begin{equation} \boldsymbol{u} =
\begin{bmatrix} u_{helix} \\
v_{helix}\sin\left(\varphi_0(S_x,t)-\varPsi_b\right) \\
v_{helix}\cos\left(\varphi_0(S_x,t)-\varPsi_b\right)
\end{bmatrix}.
\end{equation}
The transformation to the local reference system of blade  $b$ yields
 \begin{gather} \begin{bmatrix} 1 & 0 &
0 \\ 0 & \cos\left(\varPsi_b\right) &
\sin\left(\varPsi_b\right) \\ 0 &
-\sin\left(\varPsi_b\right) & \cos\left(\varPsi_b\right)
\end{bmatrix} \boldsymbol{\cdot} \begin{bmatrix} u_{helix} \\
-v_{helix} \sin\left(\varphi_0(S_x,t)\right) \\ v_{helix}
\cos\left(\varphi_0(S_x,t)\right) \end{bmatrix} \!=\!
\begin{bmatrix} u_{helix} \\
v_{helix}\sin\left(\varphi_0(S_x,t)-\varPsi_b\right) \\
v_{helix}\cos\left(\varphi_0(S_x,t)-\varPsi_b\right)
\end{bmatrix}.
\end{gather}
\begin{gather} \begin{bmatrix} 1 & 0 &
0 \\ 0 & \cos\left(\varPsi_b\right) &
\sin\left(\varPsi_b\right) \\ 0 &
-\sin\left(\varPsi_b\right) & \cos\left(\varPsi_b\right)
\end{bmatrix} \boldsymbol{\cdot} \begin{bmatrix} u_{helix} \\
-v_{helix} \sin\left(\varphi_0(S_x,t)\right) \\ v_{helix}
\cos\left(\varphi_0(S_x,t)\right) \end{bmatrix} \!=\!
\begin{bmatrix} u_{helix} \\
v_{helix}\sin\left(\varphi_0(S_x,t)-\varPsi_b\right) \\
v_{helix}\cos\left(\varphi_0(S_x,t)-\varPsi_b\right)
\end{bmatrix}.
\end{gather}
An examination of the local cross-sectional plane of the airfoil of the blade leads to the following expression for the angle of attack  $\alpha$:
 \begin{align} \alpha &= \arctan \frac{u}{\omega r-v\sin\left(\varphi_0(S_x,t)-\varPsi_b\right)} -A\sin\left(\varPsi_b+\beta'\right) \nonumber\\ &= {\rm \pi}/2 - \left(\arctan\left(\lambda \frac{r}{R}-\frac{v}{u}\sin\left(\varphi_0(S_x,t)-\varPsi_b)\right)\right) +A\sin\left(\varPsi_b+\beta'\right) \right), \end{align}
where the subscript  ${helix}$ was omitted for clarity. Since the regular angle of attack is ${\rm \pi} /2-\arctan (r\lambda /R)$, the deviation from the regular angle of attack is
 \begin{align} \Delta \alpha &=\arctan\left(\lambda \frac{r}{R} \right) - \arctan\left(\lambda \frac{r}{R}-\frac{v}{u}\sin\left(\varphi_0(S_x,t)-\varPsi_b\right)\right) -A\sin\left(\varPsi_b+\beta'\right) \nonumber\\ &= \arctan\frac{-\dfrac{v}{u}\sin\left(\varPsi_b-\varphi_0(S_x,t)\right)}{1+\lambda \dfrac{r}{R}\left(\lambda \dfrac{r}{R}-\dfrac{v}{u}\sin\left(\varphi_0(S_x,t)-\varPsi_b\right)\right)} - A\sin\left(\varPsi_b+\beta'\right) . \end{align}
We suppose that the design value of  $\alpha$ is optimal, thus we seek to minimise $\Vert \Delta \alpha \Vert$. The right-hand side is minimal if both terms of (B4) are equal in phase and magnitude. To determine when the two terms are in phase, we only need to consider the numerator of the argument of the $\arctan$, which yields
 \begin{equation} \left. \begin{gathered} -\sin\left(\varPsi_b-\varphi_0(S_x,t)\right) = \sin\left(\varPsi_b-\varphi_0(S_x,t)+{\rm \pi}\right) = \sin\left(\varPsi_b+\beta'\right)\\ \varPsi_b-(\varphi_0(0,t)+\Delta\varphi(S_x)) + {\rm \pi}= \varPsi_b+\beta-(\Delta\varphi(S_x)+\varPhi_1). \end{gathered} \right\} \end{equation}
By replacing  $\varphi _0(0,t)$ on the left with (3.8), and eliminating equal terms on both sides we find that
 \begin{equation} \varPhi_1 = 0 \end{equation}
yields the lowest deviation from the optimal angle of attack. However, (B4) also indicates that the deviation of the optimal angle of attack is stronger near the root of the blade and probably negligible near the tip, since the tip-speed ratio is usually larger than one, whereas  ${v}/{u}\ll 1$.


 Open access

