

Dietary fats are implicated in the development of several metabolic diseases including obesity, diabetes and CVD( 1 ). Over-consumption of energy-dense foods, which is typically associated with a high fat (HF) content in foods, is a main contributor to positive energy balance( Reference Swinburn, Caterson and Seidell 2 ). In recent years, research has suggested that the dietary fatty acid (FA) composition of a HF diet may act differentially on energy usage and storage, affecting weight gain and loss( Reference Krishnan and Cooper 3 , Reference Raatz, Conrad and Johnson 4 ).
Decreased fat oxidation has been associated with an increase in body fat( Reference Westerterp, Smeets and Lejeune 5 ). Therefore, it may be important to identify foods and diets that increase fat oxidation for weight management. Early animal and human studies have consistently revealed greater oxidation of unsaturated FA compared with SFA( Reference Jones and Schoeller 6 – Reference Piers, Walker and Stoney 8 ), possibly contributing to recommendations centred around increasing unsaturated fat consumption and limiting SFA intake( 1 ). Differences between rates of fat oxidation among various unsaturated FA also exist. Early human studies using isotope labelling techniques indicate differences in oxidation between MUFA and PUFA( Reference Jones, Pencharz and Clandinin 9 , Reference DeLany, Windhauser and Champagne 10 ). Jones et al.( Reference Jones, Pencharz and Clandinin 9 ) found that MUFA were more highly oxidised than n-6 PUFA in normal-weight men. Delany et al. ( Reference DeLany, Windhauser and Champagne 10 ) found that again MUFA were more highly oxidised than n-6 PUFA; however, n-3 PUFA were the most highly oxidised FA compared with both MUFA and n-6 PUFA. More recent research using indirect calorimetry to measure total fat oxidation rates after acute meal challenges have found no differences between these unsaturated fats( Reference Jones, Jew and AbuMweis 11 – Reference Clevenger, Kozimor and Paton 13 ).
Diet-induced thermogenesis (DIT) is important in the regulation of energy balance( Reference Westerterp, Smeets and Lejeune 5 ), and, similar to fat oxidation, reduced activity of thermogenesis has been associated with obesity( Reference Bray 14 , Reference Tappy 15 ). Studies to date have consistently reported greater DIT after consumption of unsaturated fats compared with saturated fats( Reference Piers, Walker and Stoney 8 , Reference Casas-Agustench, Lopez-Uriarte and Bullo 12 , Reference Clevenger, Kozimor and Paton 13 , Reference Soares, Cummings and Mamo 16 ). Only three studies to date have compared acute meal challenges rich in MUFA v. PUFA with mixed findings( Reference Jones, Jew and AbuMweis 11 – Reference Clevenger, Kozimor and Paton 13 ). Studies have yet to observe the longer-term effects of consuming a diet rich in MUFA v. PUFA on DIT or energy expenditure (EE).
It is important to note that the studies mentioned thus far have all been acute or single-meal challenge studies. This may be limiting because postprandial oxidation rates following an acute meal may differ based on historical dietary fat consumption and prior body fat composition. A longer-term diet intervention that can influence metabolic changes or adaptations may more accurately define the differential effects of altering dietary FA composition( Reference Krishnan and Cooper 3 ). Some longer-term diet studies comparing HF diets rich in MUFA v. SFA( Reference Kien, Bunn and Ugrasbul 17 – Reference Piers, Walker and Stoney 19 ) and PUFA v. SFA( Reference Jones and Schoeller 6 , Reference van Marken Lichtenbelt, Mensink and Westerterp 20 , Reference Jones, Ridgen and Phang 21 ) have been conducted with significant metabolic differences. However, research exploring the effects of longer-term HF diets rich in PUFA v. MUFA on metabolism is lacking. In our laboratory, we have recently shown that a diet high in PUFA resulted in greater fat oxidation after a SFA-rich meal compared with a control diet high in MUFA( Reference Stevenson, Miller and Skillman 22 ).
Because of the inconsistent results of previous studies and the lack of research on longer-term ingestion of different types of unsaturated FA-rich diets, the purpose of this study was to compare the effect of a HF diet rich in MUFA v. PUFA on metabolism in normal-weight men. The primary outcome was to determine the effect of a 5-d diet intervention on fasting and postprandial substrate oxidation and DIT in our PUFA-rich v. MUFA-rich diets. On the basis of studies previously performed in our laboratory( Reference Clevenger, Kozimor and Paton 13 , Reference Stevenson, Miller and Skillman 22 ), we hypothesised that the HF, PUFA-rich diet would lead to greater fasting and postprandial fat oxidation and DIT compared with the HF, MUFA-rich diet. Our secondary outcome was to evaluate the acute meal response, before the diet intervention, of consuming a HF meal rich in MUFA v. PUFA on metabolism. On the basis of previous findings, we hypothesised that there would be no differences in total fat oxidation and DIT following acute consumption of the PUFA-rich v. MUFA-rich HF meals.
Methods
Study design
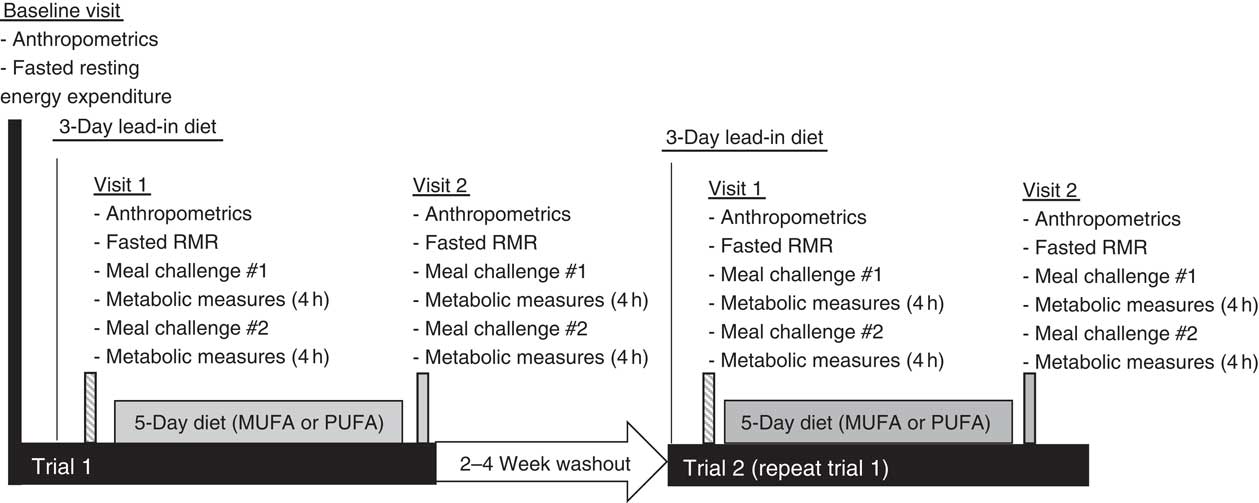
This study was a single-blind, randomised cross-over design consisting of two different feeding trials. The study protocol included a baseline visit (RMR measured), followed by two outpatient feeding trials, and is outlined in Fig. 1. The feeding trials consisted of a 3-d lead-in diet, a pre-diet testing visit (visit 1), a 5-d feeding protocol (rich in either MUFA or PUFA) and a post-diet testing visit (visit 2). Before all visits, participants fasted for 8–12 h and avoided any vigorous exercise for 12 h. After the first trial, there was a 2- to 4-week washout period. Participants then completed trial 2. The only difference between the trials was the type of unsaturated fat provided in the HF diet during the 5-d feeding period. The HF diets were rich in either MUFA or PUFA. Participants were randomised to either receive the HF, PUFA-rich diet first or the HF, MUFA-rich diet first following their baseline visit using Research Randomizer (www.randomizor.org). This study was single-blinded, so the participants were not aware of which diet they were receiving first or second.
Time course of study visits and measurements taken at each visit.
Participants
A total of fifteen healthy, normal-weight, sedentary adult men were recruited for the study. Inclusion criteria were men between the ages of 18 and 45 years, performing <3 h of structured exercise per week and normal-weight status based on a BMI between 18 and 24·9 kg/m2 or body composition analysis using dual X-ray absorptiometry (DXA™, Discovery A; Hologic Inc.), with a body fat percentage less than 24 % to qualify. The exclusion criteria included the following: weight loss or gain exceeding 5 % of body weight in the past 3 months; regular exercise>3 h/week; plans to lose weight or begin a weight-loss programme between initiation of the study and final testing; anyone who was vegan or vegetarian; medication use; chronic or metabolic disease, gastrointestinal disorder or history of medical or surgical events that could affect digestion or swallowing; any supplement use other than a daily multivitamin; blood or plasma donation within 20 d before initiation of study; or tobacco use. Subjects were recruited through flyers, campus emails and word of mouth. This study was conducted according to the guidelines laid down in the Declaration of Helsinki, and all procedures involving human subjects were approved by the Western Institutional Review Board and written informed consent was obtained before beginning study procedures.
Procedures
Baseline visit
Participants reported to the Human Nutrition Laboratory after an overnight fast (no food or drink except water for 8–12 h). Anthropometric measurements (height, weight and body composition) were taken, followed by RMR measurement with the ParvoMedics TrueOne® 2400 Canopy System (Parvomedics) for 30 min using standardised conditions. Briefly, subjects were asked to stay awake and motionless in a supine position while a plastic hood was placed over their head to measure oxygen consumption and carbon dioxide production. Respiratory gases were used to calculate RMR using the Weir equation( Reference Weir 23 ). Participants’ estimated total daily energy needs for the 3-d lead-in diet, 5-d diet and meal challenges at visits 1 and 2 were based on their calculated RMR multiplied by an average US physical activity value of 1·65( Reference Trumbo, Schlicker and Yates 24 ).
Lead-in diet
For 3 d before visit 1, participants were provided with a lead-in diet that was representative of the standard American diet (50 % carbohydrate, 35 % fat and 15 % protein, Table 1). Participants were instructed to consume all foods provided, and no additional foods or beverages besides water were allowed. Total energy content was based on the participant’s estimated energy needs calculated from the RMR measurement at the ‘Baseline visit’ section described above.
Nutrient content for each high-fat (HF) diet
Pre-diet testing visit (visit 1)
Following the 3-d lead-in diet, participants arrived at the laboratory the next morning at 06.45 hours in a fasted state (8–12 h fast) and 12 h without exercise. Height, weight, blood pressure, waist and hip circumference and body fat percentage using DXA were measured. Indirect calorimetry was used to measure RMR and fasting substrate oxidation (RER and fat and carbohydrate oxidation) for 30 min, as described above. Following indirect calorimetry measurement, participants ingested a HF liquid meal rich in either MUFA or PUFA (Table 2). The nutrient content of the meal was designed to provide 35 % of the participant’s estimated total daily energy needs (determined from RMR at ‘Baseline visit’ section). The liquid meals contained 1 % milk, whey chocolate protein, chocolate syrup and added oil. The oil, either olive oil (OO) or cottonseed oil (CSO), depended on the treatment condition (OO for MUFA or CSO for PUFA). We analysed the FA composition of each of the oils used in this study. The OO consisted of 19·3 % SFA, 67·1 % MUFA and 13·6 % PUFA. The CSO consisted of 22·7 % SFA, 19·9 % MUFA and 57·4 % PUFA. Participants consumed this liquid meal at breakfast (08.00 hours) and another identical meal again 4 h later for lunch (12.00 hours).
Nutrient content for each high-fat (HF) test meal
After breakfast meal ingestion, respiratory gases were once again measured to determine EE and fuel utilisation. Measurements were obtained for a total of 8 h postprandially (4 h post breakfast and 4 h post lunch). Specifically, data were collected for a 20-min period followed by a 10-min break. During the 20 min of data collection, participants remained awake but were instructed not to move. During the 10-min break, participants remained seated with minimal movement. Participants were also given 4 oz of water in each hour.
Dietary intervention
Following visit 1, participants began the 5-d, HF feeding trial rich in either MUFA or PUFA (Table 1). The order of the feeding trials was randomised. On days 1–5, participants reported to the laboratory between 07.00 and 10.00 hours to receive their breakfast, which was given as a shake. After the meal, participants were then given the rest of their food and beverages for the day and instructed to consume all the food provided and abstain from any other food or drink aside from water. All food items were weighed and prepared by research personnel. The 5-d diet consisted of 50 % of total energy from fat, 35 % from carbohydrates and 15 % from protein. For the HF portion, diets were prepared using either CSO (for the PUFA treatment) or OO (for the MUFA treatment). For the PUFA treatment, 50 % of total fat content was derived from PUFA. For the MUFA treatment, 59 % of total fat content was derived from MUFA, with differences reflecting the FA composition of those oils. The total energy intake was prescribed to equal each participant’s total estimated daily energy needs (determined from RMR at ‘Baseline visit’ section).
Post-diet testing visit (visit 2)
The day after the 5th day of the feeding period, participants reported to the laboratory under fasted (8–12 h) and unexercised (12 h) conditions. All procedures that took place during visit 1 were repeated. This included consumption of the same HF meals, and metabolic and anthropometric measurements.
The duration of the lead-in diet through visit 2 represented trial 1. The participant then underwent 2–4 weeks of washout, during which time they returned to their normal dietary patterns. After the washout period, the participants underwent trial 2 (including lead-in diet, visit 1 test-day, a 5-d high PUFA or MUFA dietary intervention and visit 2 test-day). The only difference between the trials was the foods for each 5-d trial and corresponding HF meal challenges during the testing visits (MUFA v. PUFA).
Calculations
Respiratory gases were used to calculate EE using the Weir equation( Reference Weir 23 ) and macronutrient oxidation using the following equations developed by Frayn( Reference Frayn 25 ): fat (g/min)=(1·67×VO2 (litres/min))–(1·67×VCO2 (litres/min)); and carbohydrate (g/min)=(4·56×VCO2 (litres/min))–(3·21×VO2 (litres/min)). VO2 and VCO2 represent O2 consumption and CO2 production, respectively, in litres/min. RER was calculated as the ratio of VCO2:VO2. For these calculations, the first 5 min of each 20-min segment were discarded to allow participants to enter into a steady state. The DIT was calculated from postprandial EE subtracted by baseline EE.
In addition, the metabolic cart was calibrated against methanol burns throughout the duration of the study( Reference Schoffelen, Westerterp and Saris 26 ). The percentage recoveries from each burn were used as correction factors for the corresponding metabolic data for each testing day. The average correction factors were 99·15 and 98·57 % for O2 and CO2, respectively.
Statistical analysis
To determine whether our sample size was appropriate, a within-subject, repeated-measure ANOVA was used to assess trial effects. With an effect size of 0·67 (determined from the mean postprandial change between PUFA v. MUFA for RER from this study), we would require a total sample size of 8 subjects, assuming 80 % power (β) and an α of 0·05. The number of subjects required was determined using G*Power 3.1.9.2. SAS version 9.4 statistical package (SAS Institute Inc.) was used for all statistical analyses. To address our primary outcome of the effect of the 5-d intervention diet, change from visit 1 (before diet) to visit 2 (after diet) was calculated and a within-subjects repeated-measures ANOVA was used to detect main effects (time, treatment) and interaction effects. A secondary analysis was performed to determine differences in acute meal response at visit 1, before the intervention diet between MUFA and PUFA using a within-subject repeated-measures ANOVA. If significance was found, post hoc analyses were performed using Tukey’s test. Data are presented as means with their standard errors. Statistical significance was set at P≤0·05.
Results
Subjects
A total of fifteen normal-weight male participants completed both feeding trials. Physical characteristics of the participants are shown in Table 3. Participants were between 18 and 45 years of age and were of normal weight based on BMI (18–24·9 kg/m2) or DXA body fat percentage (14–24 %). All participants were also free from any known metabolic or chronic disease and were not taking any medications.
Participant characteristics (Mean values and standard deviations; n 15)
Acute metabolic responses
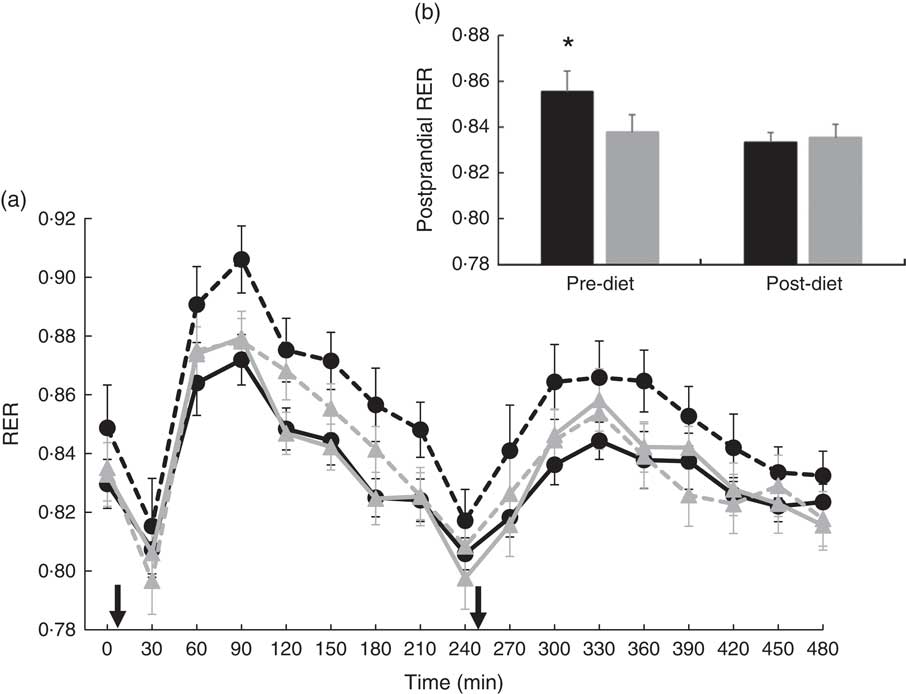
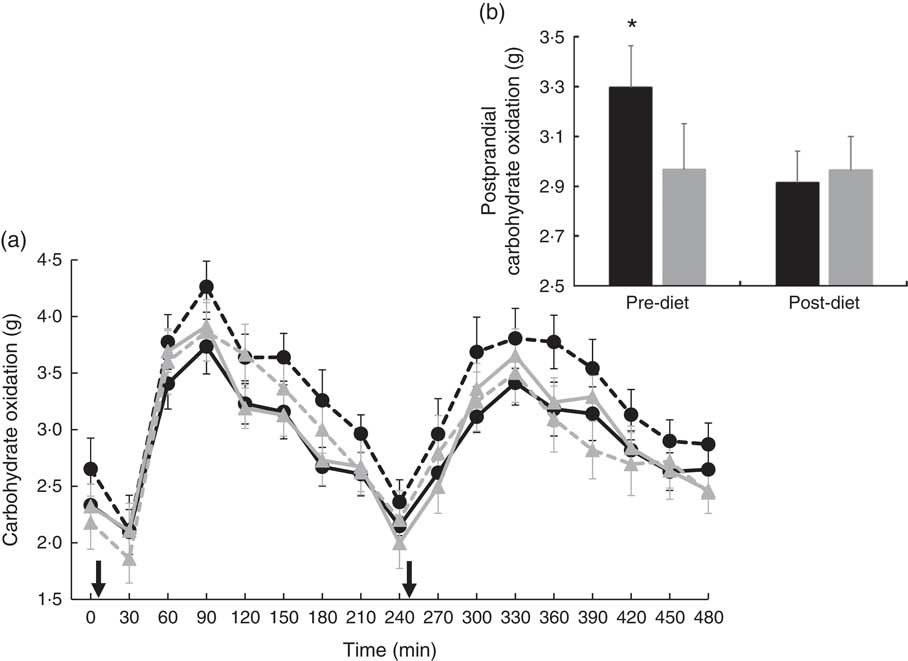
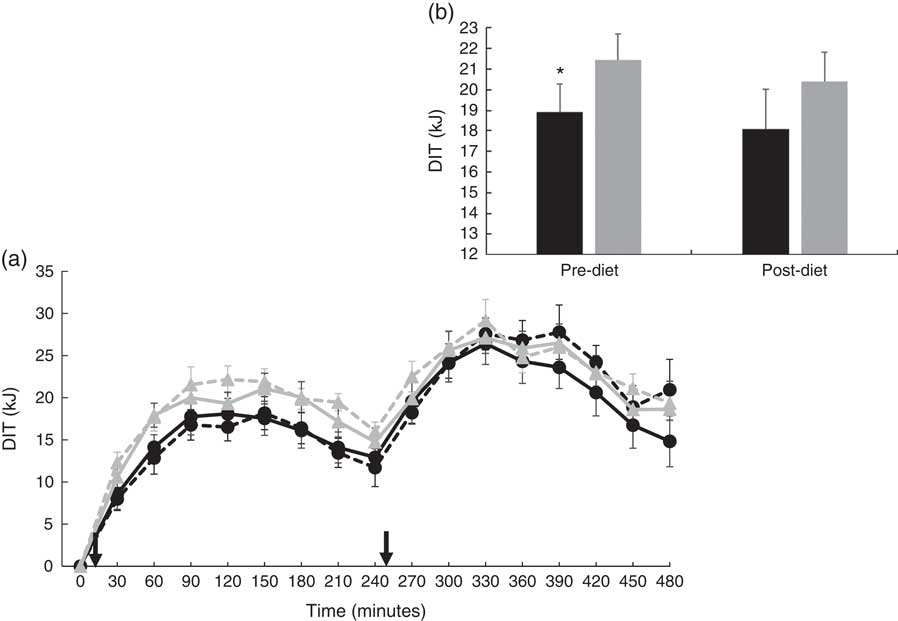
There were no significant differences at fasting/baseline for the pre-diet visit (visit 1) between MUFA and PUFA for any outcome variable (RER, fat and carbohydrate oxidation and EE) (Table 4). When examining the time-course meal responses, as expected, there was a significant time effect for all substrate oxidation (RER, fat and carbohydrate oxidation) and EE data (DIT) (P<0·001). There were no treatment by time interactions; however, several treatment effects were found. For RER, there was a significant treatment effect (Fig. 2(a)), with a significantly higher RER for the PUFA pre-diet visit compared with the MUFA pre-diet visit (postprandial average of 0·86 (sem 0·01) v. 0·84 (sem 0·01), P<0·05, Fig. 2(b)). For fat oxidation, there also was a significant treatment effect (Fig. 3(a)), with lower fat oxidation for the PUFA pre-diet v. MUFA pre-diet visits (postprandial average of 1·20 (sem 0·12) v. 1·33 (sem 0·09) g, P<0·05, Fig. 3(b)). For carbohydrate oxidation, there was a significant treatment effect (Fig. 4(a)), with higher carbohydrate oxidation for the PUFA pre-diet v. MUFA pre-diet visit (postprandial average of 3·30 (sem 0·17) v. 2·97 (sem 0·18) g, P<0·05, Fig. 4(b)). For DIT, there was a significant treatment effect (Fig. 5(a)), with lower DIT for the PUFA pre-diet visit v. MUFA pre-diet visit (postprandial averages of 18·91 (SEM 0·46) v. 21·46 (sem 1·34) kJ, P<0·05, Fig. 5(b)).
(a) Fasting and postprandial RER for each of the diets, pre- and post-diet intervention. Subjects consumed the high-fat (HF) meal immediately after time 0 and time 240 (![]() ). (b) Average postprandial RER for pre- and post-diet interventions. Values are means with their standard errors. a:
). (b) Average postprandial RER for pre- and post-diet interventions. Values are means with their standard errors. a: ![]() , PUFA pre-diet;
, PUFA pre-diet; ![]() , PUFA post-diet;
, PUFA post-diet; ![]() , MUFA pre-diet;
, MUFA pre-diet; ![]() , MUFA post-diet; b:
, MUFA post-diet; b: ![]() , PUFA;
, PUFA; ![]() , MUFA. * Significantly different RER values between PUFA pre-diet and MUFA pre-diet visits (P<0·05).
, MUFA. * Significantly different RER values between PUFA pre-diet and MUFA pre-diet visits (P<0·05).
(a) Fasting and postprandial fat oxidation for each of the diets, pre- and post-diet intervention. Subjects consumed the high-fat (HF) meal immediately after time 0 and time 240 (![]() ). (b) Average postprandial fat oxidation for pre- and post-diet interventions. Values are means with their standard errors. a:
). (b) Average postprandial fat oxidation for pre- and post-diet interventions. Values are means with their standard errors. a: ![]() , PUFA pre-diet;
, PUFA pre-diet; ![]() , PUFA post-diet;
, PUFA post-diet; ![]() , MUFA pre-diet;
, MUFA pre-diet; ![]() , MUFA post-diet; b:
, MUFA post-diet; b: ![]() , PUFA;
, PUFA; ![]() , MUFA. * Significantly different fat oxidation values between PUFA pre-diet and MUFA pre-diet visits (P<0·05).
, MUFA. * Significantly different fat oxidation values between PUFA pre-diet and MUFA pre-diet visits (P<0·05).

(a) Fasting and postprandial carbohydrate oxidation for each of the diets, pre- and post-diet intervention. Subjects consumed the high-fat (HF) meal immediately after time 0 and time 240 (![]() ). (b) Average postprandial carbohydrate oxidation for pre- and post-diet interventions. Values are means with their standard errors. a:
). (b) Average postprandial carbohydrate oxidation for pre- and post-diet interventions. Values are means with their standard errors. a: ![]() , PUFA pre-diet;
, PUFA pre-diet; ![]() , PUFA post-diet;
, PUFA post-diet; ![]() , MUFA pre-diet;
, MUFA pre-diet; ![]() , MUFA post-diet; b:
, MUFA post-diet; b: ![]() , PUFA;
, PUFA; ![]() , MUFA. * Significantly different carbohydrate oxidation values between PUFA pre-diet and MUFA pre-diet visits (P<0·05).
, MUFA. * Significantly different carbohydrate oxidation values between PUFA pre-diet and MUFA pre-diet visits (P<0·05).
(a) Diet-induced thermogenesis (DIT) for each of the diets, pre- and post-diet intervention. Subjects consumed the high-fat (HF) meal immediately after time 0 and time 240 (![]() ). (b) Average DIT for pre- and post-diet interventions. Values are means with their standard errors. a:
). (b) Average DIT for pre- and post-diet interventions. Values are means with their standard errors. a: ![]() , PUFA pre-diet;
, PUFA pre-diet; ![]() , PUFA post-diet;
, PUFA post-diet; ![]() , MUFA pre-diet;
, MUFA pre-diet; ![]() , MUFA post-diet; b:
, MUFA post-diet; b: ![]() , PUFA;
, PUFA; ![]() , MUFA. * Significantly different DIT values between PUFA pre-diet and MUFA pre-diet visits.
, MUFA. * Significantly different DIT values between PUFA pre-diet and MUFA pre-diet visits.
Fasting metabolic measurementsFootnote * (Mean values with their standard errors)
HF, high fat.
* No significant differences before and after diet or between diets.
Metabolic responses to 5-d high-fat diets
There were no significant differences in fasting values before and after the diet in any outcome variable (RER, fat and carbohydrate oxidation and EE) (Table 4). When examining the change in time-course meal responses, as expected, there was a significant time effect for all substrate oxidation (RER, fat and carbohydrate oxidation) and EE data (DIT) (P<0·001). There were no treatment by time interactions; however, there were several treatment effects for substrate oxidation. For change in RER, there was a significant treatment effect, with the decrease in RER from pre- to post-PUFA diet being significantly different from MUFA (postprandial average change of −0·02 (sem 0·01) v. 0·00 (sem 0·01), P<0·05, Fig. 6(a)).
(a) Pre- to post-diet change in RER for each diet. (b) Pre- to post-diet change in fat oxidation for each diet. (c) Pre- to post-diet change in carbohydrate oxidation for each diet. (d) Pre- to post-diet change in diet-induced thermogenesis (DIT) for each diet. Values are means with their standard errors. ![]() , PUFA;
, PUFA; ![]() , MUFA. * Significantly different between PUFA and MUFA diets (P<0·05).
, MUFA. * Significantly different between PUFA and MUFA diets (P<0·05).
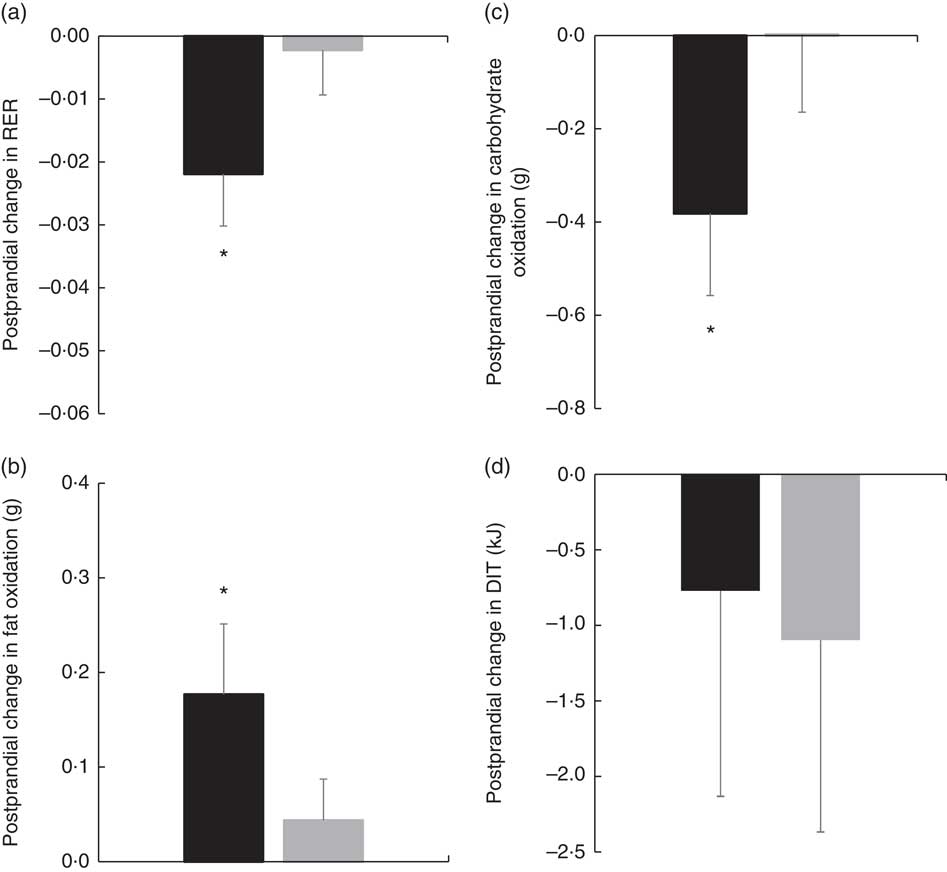
Similar to RER, there was a significant treatment effect for change in total fat oxidation before and after the diet. The increase in the change in fat oxidation was significantly different from the change in MUFA (postprandial average change of 0·18 (sem 0·07) v. 0·04 (sem 0·06) g, P<0·05, Fig. 6(b)). For change in carbohydrate oxidation, there was also a significant treatment effect. The decrease in carbohydrate oxidation from pre- to post-PUFA diet intervention was significantly different from the change in MUFA (postprandial average change of −0·38 (sem 0·18) v. 0·00 (sem 0·17) g, P<0·05, Fig. 6(c)). Finally, to look at the meal response EE, we calculated DIT and compared the change in DIT for PUFA v. MUFA. Unlike substrate oxidation, there were no significant treatment effects for change in DIT (Fig. 6(d)).
Discussion
In this study, we found differences in the metabolic response to acute HF meal challenges compared with longer-term HF diet responses rich in PUFA or MUFA. In regard to acute meal consumption, our results indicate that intake of a HF meal rich in MUFA leads to greater fat oxidation and lower carbohydrate oxidation compared with a HF meal rich in PUFA. CSO, which was our PUFA treatment oil, is rich in n-6 FA, especially linoleic acid. A prior stable isotope study by Jones et al.( Reference Jones, Pencharz and Clandinin 9 ) also found that a meal high in oleic acid (MUFA) resulted in higher fat oxidation than a meal high in linoleic acid (n-6 PUFA). Further, Delany et al.( Reference DeLany, Windhauser and Champagne 10 ) also showed that with labelled isotopes a meal high in oleic acid (MUFA) resulted in higher fat oxidation than a meal high in linoleic acid (PUFA). More recent studies have not detected a metabolic difference between acute PUFA- v. MUFA-rich meals using indirect calorimetry, and this may be owing to PUFA-rich meals having mixed contents of n-3 and n-6 PUFA( Reference Casas-Agustench, Lopez-Uriarte and Bullo 12 , Reference Clevenger, Kozimor and Paton 13 ). Delany et al.( Reference DeLany, Windhauser and Champagne 10 ) also demonstrated that a meal high in α-linolenic acid (n-3 PUFA) resulted in the greatest amount of fat oxidation compared with both oleic and linoleic acid, indicating that the type of PUFA may be important. Our study used an oil that was specifically high in linoleic acid with little α-linolenic acid, which could have affected our significant findings compared with the null findings between MUFA and PUFA of other studies that used HF meals with significant amounts of n-3 PUFA( Reference Casas-Agustench, Lopez-Uriarte and Bullo 12 , Reference Clevenger, Kozimor and Paton 13 ).
The mechanisms behind greater fat oxidation acutely following a MUFA-rich, HF meal compared with a PUFA-rich, HF meal are largely unknown. McCloy et al.( Reference McCloy, Ryan and Pencharz 27 ) demonstrated that, acutely, linoleate is preferentially esterified to plasma phospholipids and cholesteryl esters compared with oleate and α-linolenate, which would lead to preferential retention and sequestration of linoleate rather than oxidation. However, whether this decreased oxidation of linoleate is due to a greater preference for glycerolipid synthesis, a reduced preference for β-oxidation or perhaps a combination thereof is not known. Hodson et al.( Reference Hodson, McQuaid and Karpe 28 ) also demonstrated preferential incorporation of linoleate into plasma phospholipids and cholesteryl esters compared with oleate following a HF meal. This again could imply that more oleate is available for oxidation, and may explain our results of greater fat oxidation following a single MUFA-rich HF meal compared with a PUFA-rich HF meal.
Our findings also suggest that a more chronic or longer-term effect on metabolism from either PUFA or MUFA consumption is different from that of the acute meal effect. After the 5-d HF diet period, significant changes in substrate oxidation only occurred following the HF PUFA-rich diet, which led to substrate oxidation being similar between our PUFA and MUFA groups post-diet. This finding is important because it shows the adaptability of the PUFA-rich, HF diet after just 5 d. Acutely, MUFA may have more metabolically favourable outcomes with higher fat oxidation than PUFA; however, after 5 d of either a HF MUFA- or PUFA-rich diet, both result in favourable metabolic measures (higher fat oxidation and lower carbohydrate oxidation). This adaptability of our PUFA-rich diet may be due to a limited capacity to sequester linoleic acid into phospholipids and thus be diverted to oxidation once this pool is full, which would be detectable with a longer-term diet( Reference Hodson, McQuaid and Karpe 28 ). Acutely, the partitioning of linoleic acid may result in preferential incorporation of these dietary fats into phospholipids, hence lower oxidation after a single meal( Reference McCloy, Ryan and Pencharz 27 , Reference Hodson, McQuaid and Karpe 28 ). However, longer-term consumption of a diet rich in linoleic acid, such as our PUFA diet, is able to reveal changes and adaptations over a few days. PUFA are also potent regulators of lipogenic gene expression, and diets rich in linoleic acid result in down-regulation of genes encoding enzymes of lipid synthesis( Reference Sampath and Ntambi 29 ), thus affirming our findings of increased fat oxidation after a 5-d, PUFA-rich diet. Finally, the CSO used to enrich the PUFA diet in this study may contain a unique component that could be contributing to the increase in oxidation seen after our 5-d diet. CSO contains cyclopropenoid FA, specifically dihydrosterculic acid (DHSA)( Reference Paton, Vaughan and Selen Alpergin 30 ). DHSA may play an important role in reducing stearoyl-CoA desaturase-1 activity( Reference Paton, Vaughan and Selen Alpergin 30 , Reference Gomez, Bauman and Ntambi 31 ), therefore reducing overall TAG formation and channelling free FA into β-oxidation( Reference Paton and Ntambi 32 ). This illustrates a unique component that may be present in CSO. Taken together, the significant increase in fat oxidation from pre- to post-PUFA-rich HF diet may have been owing to the FA content, as well as a unique component in the CSO used in the diet.
Other longer-term studies have investigated the metabolic effects of PUFA v. SFA( Reference Jones and Schoeller 6 , Reference van Marken Lichtenbelt, Mensink and Westerterp 20 , Reference Jones, Ridgen and Phang 21 ) and MUFA v. SFA( Reference Kien, Bunn and Ugrasbul 17 – Reference Piers, Walker and Stoney 19 ). In addition, our laboratory previously showed that a 7-d, PUFA-rich diet resulted in higher fat oxidation following a SFA-rich meal compared with a control diet (containing a higher percentage of fat from MUFA)( Reference Stevenson, Miller and Skillman 22 ). In contrast, we did not see differences between our MUFA- and PUFA-rich diets after 5 d, leading us to reject our hypothesis that a PUFA-rich HF diet would lead to greater fat oxidation than a MUFA-rich HF diet. This could be owing to the relatively HF content of our diets, which could mask the FA effect that was detectable in our previous study, with a lower percentage of energy in the diet being fat( Reference Stevenson, Miller and Skillman 22 ). Our previous PUFA-rich, 7-d diet intervention also had a higher percentage of PUFA coming from n-3 fats, which may have also contributed to differences between the two study outcomes( Reference Stevenson, Miller and Skillman 22 ).
Our acute results for DIT showed that a HF, MUFA-rich meal resulted in greater DIT compared with a HF, PUFA-rich meal. In agreement with these results, Jones et al.( Reference Jones, Jew and AbuMweis 11 ) found that a HF meal enriched in MUFA induced greater DIT compared with a HF meal enriched in PUFA. However, in contrast to our findings, Clevenger et al.( Reference Clevenger, Kozimor and Paton 13 ) found that a HF meal rich in PUFA increases postprandial thermogenesis compared with a MUFA-rich meal in females. Potential metabolic differences between males and females may contribute to the contradicting results of the current study. Other previous studies have not detected differences in DIT between MUFA and PUFA( Reference Casas-Agustench, Lopez-Uriarte and Bullo 12 , Reference Flint, Helt and Raben 33 ). It is also important to note that while the change in DIT was not different between MUFA and PUFA for the 5-d diet period, DIT was similar between PUFA and MUFA after the 5-d diet intervention period.
Limitations of the current study include self-reported meal compliance during the study, which could affect the outcomes measured. Our participants were free-living, making it possible for them to consume other foods and beverages throughout the day. However, participants came into the laboratory every morning to consume breakfast and were reminded each day to only eat and drink the food that was provided to them. Another limitation of the study is that we used oils high in either PUFA or MUFA to enrich each diet type, and such oils may contain other beneficial nutrients or components in them that could be attributable to the metabolic differences. For example, OO contains polyphenols that may inhibit lipogenesis, therefore possibly contributing to its effect in greater fat oxidation( Reference Rigacci and Stefani 34 ). However, because the study design was matched except for differences in oils used, we can narrow differences down to the specific food source (CSO or OO). Future studies are needed to determine whether these differences are specific to the FA in the oils used, owing to other nutrients within the oils, or a combination of a synergistic effect of the nutrients and types of FA in the oil as a whole. Another limitation is that the percentage of fat from our FA of interest (MUFA for OO, PUFA for CSO) differed because of the composition of the oils (67·1 % MUFA in OO, 57·3 % PUFA in CSO). However, one of the strengths of the current study is that we used a whole foods approach, mimicking real-life eating patterns. As we do not eat FA, matching the percentage of total energy from a specific FA group is not always feasible. Our study also contained diets that were above the upper limits of dietary recommendations for total fat and PUFA content, which was by design to establish proof of principle. This may, however, limit clinical application of the diets used, and future studies are needed to explore the metabolic responses to lower fat diets. Last, the study sample included apparently healthy men with normal body fat percentages, and thus these results may not be extrapolated to other populations.
In conclusion, the present findings indicate that an acute HF meal rich in MUFA from OO results in greater acute total fat oxidation and lower total carbohydrate oxidation and RER compared with a HF meal rich in PUFA from CSO. However, consumption of a 5-d HF diet rich in PUFA leads to increases in total fat oxidation and decreases in total carbohydrate oxidation and RER, making substrate oxidation after 5-d HF diets rich in these different fats equal. Because greater fat oxidation has been associated with lower body fat mass, rates of fat oxidation can have implications for weight management. Our results indicate that after a 5-d period both sources of unsaturated FA may have a similar metabolic impact on weight management as fat oxidation rates were similar between the diets. Finally, DIT followed the same trend as seen with substrate oxidation, being higher after the acute MUFA-rich meal compared with PUFA. Although the change over the 5-d HF diet intervention was not significantly different between treatments, DIT was similar between the treatments after adaptation occurred with the PUFA-rich diet. Future studies are needed to investigate the mechanisms behind differences seen acutely between PUFA and MUFA, and whether further differences would be seen with chronic consumption of these two diets.
Acknowledgements
This research project was funded by Cotton Incorporated. Research was also supported by the AU/UGA Medical Partnership and UGA Clinical and Translational Research Unit.
J. A. C. and C. M. P. contributed to the conception and design of the project, as well as interpretation and providing important intellectual content and review of the preparation of the manuscript. R. V., M. J., M. K. M. and K. R. P. contributed to data acquisition. M. K. M. and K. R. P. contributed to analysis and K. R. P. also contributed to interpretation, manuscript preparation and writing of the final manuscript.
None of the authors has any conflicts of interest to declare.


