





Policy Significance Statement
This research provides insights into how AI technology interacts with users in personal health management and the content and types of data involved to clarify the focus and gaps of data policy governance for AI applications in different legal jurisdictions. Specifically, data governance policies need to be improved in response to the increasingly rich data types, content, quantity, and the uncertainty of real-time interactions. Governance practices, risks, and response measures are examined, which helps to provide a reference for policymakers to improve data and AI governance policies and systems regarding risks in personal health management. There is a great need for increased attention to data governance and on enhancing AI literacy, professional competence, and the trust of data governance subjects.
1. Introduction
Personal health management applications provide personal health monitoring, evaluation, and intervention services to fulfil individual self-care and health promotion needs (Chen et al., Reference Chen, Qi and Wang2021). Personal health management is gaining global importance amid the rise of chronic diseases, ageing populations, and a shift toward preventive, personalised care (Lu et al., Reference Lu, He and Zhang2025; Muthineni et al., Reference Muthineni, Ghadi, Obeidy, Vitee and Mahmoud2025). Enabled by mobile apps, wearables, and AI, individuals increasingly manage their health outside of clinical settings (Ghadi et al., Reference Ghadi, Alhasan, Aggarwal and Alotaibi2025; Lee et al., Reference Lee, Yeung, Kurniawati, Chou and Ntoa2025). This shift raises urgent concerns around data risks and governance (Topol, Reference Topol2019; WHO, 2021). Personal health management applications integrate a new generation of AI, Internet of Things, communication, bioinformatics, and other technologies to provide personal health monitoring, evaluation, and intervention services to fulfil individual self-care and health promotion needs (Chen et al., Reference Chen, Qi and Wang2021). AI tools for self-care, including chatbots, health monitoring, and risk prediction tools and systems designed for people with disabilities (WHO, 2021), have been projected to increase.
These applications all involve interaction between humans (the users) and AI tailored to health and wellness management (Jiang et al., Reference Jiang, Sun, Fu and Lv2024). Human–AI interaction is a specific form of human–computer interaction that focuses on how users interact with AI systems. These systems incorporate algorithms designed to replicate human capabilities such as creativity, autonomous learning, and communicative behaviour. They may also enable machines to perform tasks or processes based on computational models of intelligent behaviour (Wienrich and Latoschik, Reference Wienrich and Latoschik2021). Applying human–AI interaction functions generates multiple sensitive data, including physical activity behaviour data (Thomas Craig et al., Reference Thomas Craig, Morgan, Chen, Michie, Fusco, Snowdon, Scheufele, Gagliardi and Sill2021), daily life, face and voice data, motor symptoms (Ogawa et al., Reference Ogawa, Oyama, Morito, Kobayashi, Yamada, Shinkawa, Kamo, Hatano and Hattori2022), and personal digital footprints (Hwang et al., Reference Hwang, Adler, Friedenberg and Yang2024). The data generated need to be scientifically governed. Unlike traditional clinical data collected by professionals (e.g., diagnoses, lab tests), data from non-clinical health apps are user-generated, continuous, and captured in daily life. This includes behaviour, mood, and AI interaction logs, often termed patient-generated health data (PGHD), which pose distinct governance challenges due to their unstructured nature and blurred regulatory boundaries (Brückner et al., Reference Brückner, Sadare, Fesl, Scheibe, Lang and Gilbert2025). The governance process faces serious risks such as poor data quality, data over-collection, data misuse, data privacy infringement, lack of data security, and difficulties in data access (WHO, 2021).
Various entities regulate data governance through both legal frameworks and non-binding ethical or policy frameworks, with growing efforts toward international and regional standardisation. For example, the European Union (EU) issued the Oviedo Convention on Human Rights and Biomedicine, which is a legally binding treaty. The Council of Europe released Guidelines on Artificial Intelligence and Data Protection, which serve as a non-binding reference for member states. The United States General Services Administration issued a Draft Data Ethics Framework, which is advisory in nature. In China, the government has issued several binding regulations, including the Measures for Security Assessment of Data Exit and the Provisions on the Management of Automotive Data Security, reflecting a strong emphasis on enforceable data governance.
Recent research on AI-enabled personal health management has examined three main areas: service functions, potential risks, and governance strategies. First, existing studies describe a broad range of AI-driven service functions, including chronic condition management, personalised coaching, mobile health monitoring, digital diagnostic or self-assessment tools, rehabilitation support, and intelligent care robots (Sqalli and Al-Thani, Reference Sqalli and Al-Thani2020; Islam et al., Reference Islam, Khan and Islam2021; Nazar et al., Reference Nazar, Alam, Yafi and Su’ud2021; Al Kuwaiti et al., Reference Al Kuwaiti, Nazer and Al-Reedy2023; Capel et al., Reference Capel, Ploderer, Bircanin, Vallgårda, Jönsson, Fritsch, Alaoui and Le Dantec2024). These reviews primarily outline the roles, platforms, and disease types associated with such applications (Zhang et al., Reference Zhang, Yu and Xu2022; Jiang et al., Reference Jiang, Shen and Wang2023). Second, research has identified various risks arising from these functions, with particular attention to data privacy, confidentiality, and security challenges in distributed data transmission, sharing, and storage (Michala et al., Reference Michala, Attar and Vourganas2022; Othman et al., Reference Othman, Almalki, Sakli, Chakraborty and Khosravi2022; Vijay et al., Reference Vijay, Kumar, Gomathi, Chakraborty and Khosravi2022; Chang, Reference Chang2023). Third, a growing body of work proposes ethical guidelines, governance frameworks, and standards to safeguard AI applications in health contexts, addressing issues such as AI trustworthiness, human–AI role division, value alignment, and system robustness (Ruehle, Reference Ruehle2020; Albahri et al., Reference Albahri, Duhaim, Fadhel, Alnoor, Baqer, Alzubaidi, Albahri, Alamoodi, Bai, Salhi, Santamaría, Ouyang, Gupta, Gu and Deveci2023; Rezwana, Reference Rezwana2023).
Overall, while this literature provides valuable insights into how AI systems function, what risks they pose, and how they might be governed, several limitations remain. Existing studies mainly offer high-level descriptions of service functions without examining the concrete ways in which AI systems interact with users in everyday health management. Most research focuses on general privacy concerns but does not analyse the specific data types and interaction-generated data flows involved. Moreover, current work tends to approach risks from an AI governance perspective and lacks a comprehensive, data-governance-oriented analysis of the risks and countermeasures relevant to human–AI interaction in consumer health applications.
As a result, data risks in personal health management apps have received greater attention. However, current research tends to focus either on the technical design of AI systems or on clinical applications in formal healthcare settings (Chen & Decary, Reference Chen and Decary2020). There remains a lack of in-depth analysis of data governance risks associated with human–AI interaction in health applications—particularly in commercial, consumer-facing platforms, as opposed to those designed for medical professionals (Hassan et al., Reference Hassan, Borycki and Kushniruk2025). Moreover, few studies systematically examine how data flows generated through such interactions are governed, especially in the context of fragmented regulatory frameworks. This reveals a critical need for governance models that can address the real-time, interactive, and sensitive nature of data in human–AI health systems. To address this gap, this study examines data governance practices and risks in AI-enabled personal health management applications. It focuses on the types of data generated, the challenges these pose for governance, and the adequacy of current risk response mechanisms. Accordingly, this paper addresses three research questions:
Question 1: How is human–AI interaction integrated into personal health management apps and what kinds of data are being generated during interactions?
Question 2: What data governance practices currently exist in personal health management?
Question 3: What data governance challenges and potential risks do these technologies pose for personal health management and what response measures exist to manage these risks?
2. Research design
Preferred Reporting Items for Systematic Reviews and Meta-Analyses (PRISMA) systematic literature review guidelines were used to provide a comprehensive collection and selection of literature and cases. The PRISMA guidelines provide a transparent and replicable process for identifying, screening, and including literature (Page et al., Reference Page, McKenzie, Bossuyt, Boutron, Hoffmann, Mulrow, Shamseer, Tetzlaff, Akl, Brennan, Chou, Glanville, Grimshaw, Hróbjartsson, Lalu, Li, Loder, Mayo-Wilson, McDonald, McGuinness, Stewart, Thomas, Tricco, Welch, Whiting and Moher2021). Following PRISMA’s structured approach allowed us to minimise selection bias and ensure reproducibility across each stage of the review. The policies were obtained through the official websites of government agencies. Second, thematic analysis was used to analyse the literature and policies to explore the current state of human–AI interaction applications in personal health management, the data types involved, data governance practices, and potential risks. Third, the case study approach was used to validate findings from the literature and policy analysis and summarise response measures to data governance risks. The case studies served two complementary purposes. First, they were used to validate and contextualise the themes derived from the literature by examining whether the data governance practices and risks are reflected in actual AI-enabled health applications. Second, the cases provided empirical detail on the implementation gaps, jurisdictional differences, and practical constraints that could not be inferred solely from academic publications. This combined approach strengthens the robustness of the findings and ensures that the analytical framework reflects both conceptual patterns and real-world governance practices.
2.1. Data collection
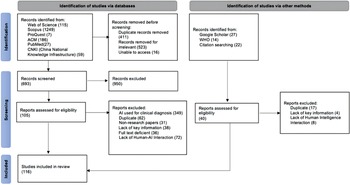
This research adopted the PRISMA guideline to conduct the systematic literature review. The PRISMA statement was designed to help systematic reviewers transparently report why the review was done, the authors’ process, and the results (Rethlefsen and Page, Reference Rethlefsen and Page2022). Figure 1 shows the procedure of literature collection, which refer to the Page et al. (Reference Page, McKenzie, Bossuyt, Boutron, Hoffmann, Mulrow, Shamseer, Tetzlaff, Akl, Brennan, Chou, Glanville, Grimshaw, Hróbjartsson, Lalu, Li, Loder, Mayo-Wilson, McDonald, McGuinness, Stewart, Thomas, Tricco, Welch, Whiting and Moher2021) flow diagram. Authors searched a range of scholarly databases (ProQuest, Web of Science, Scopus) and forward and backwards citations for studies published before November 7, 2024. This study focuses on non-clinical personal health management apps with embedded AI technology. Search terms include “AI and health management,” “intelligent health management or smart health management,” and “human–AI interaction and health.” Following the PRISMA guidelines, this study applied explicit inclusion and exclusion criteria during the literature screening process. Studies were included if they met all of the following conditions: (1) the research examined personal health management applications or tools featuring human–AI interaction; (2) the study addressed data risks arising from such interactions and the governance measures applied to manage these risks; (3) the publication appeared in a peer-reviewed journal; and (4) the full text was accessible for review. Studies that were duplicates, inaccessible, focused exclusively on clinical or hospital-based applications, were not research articles, did not involve AI, or lacked relevance to governance were excluded.1643 records were initially retrieved, of which 693 were screened, and 116 articles were finally selected for analysis (Figure 1).
Literature collection process.
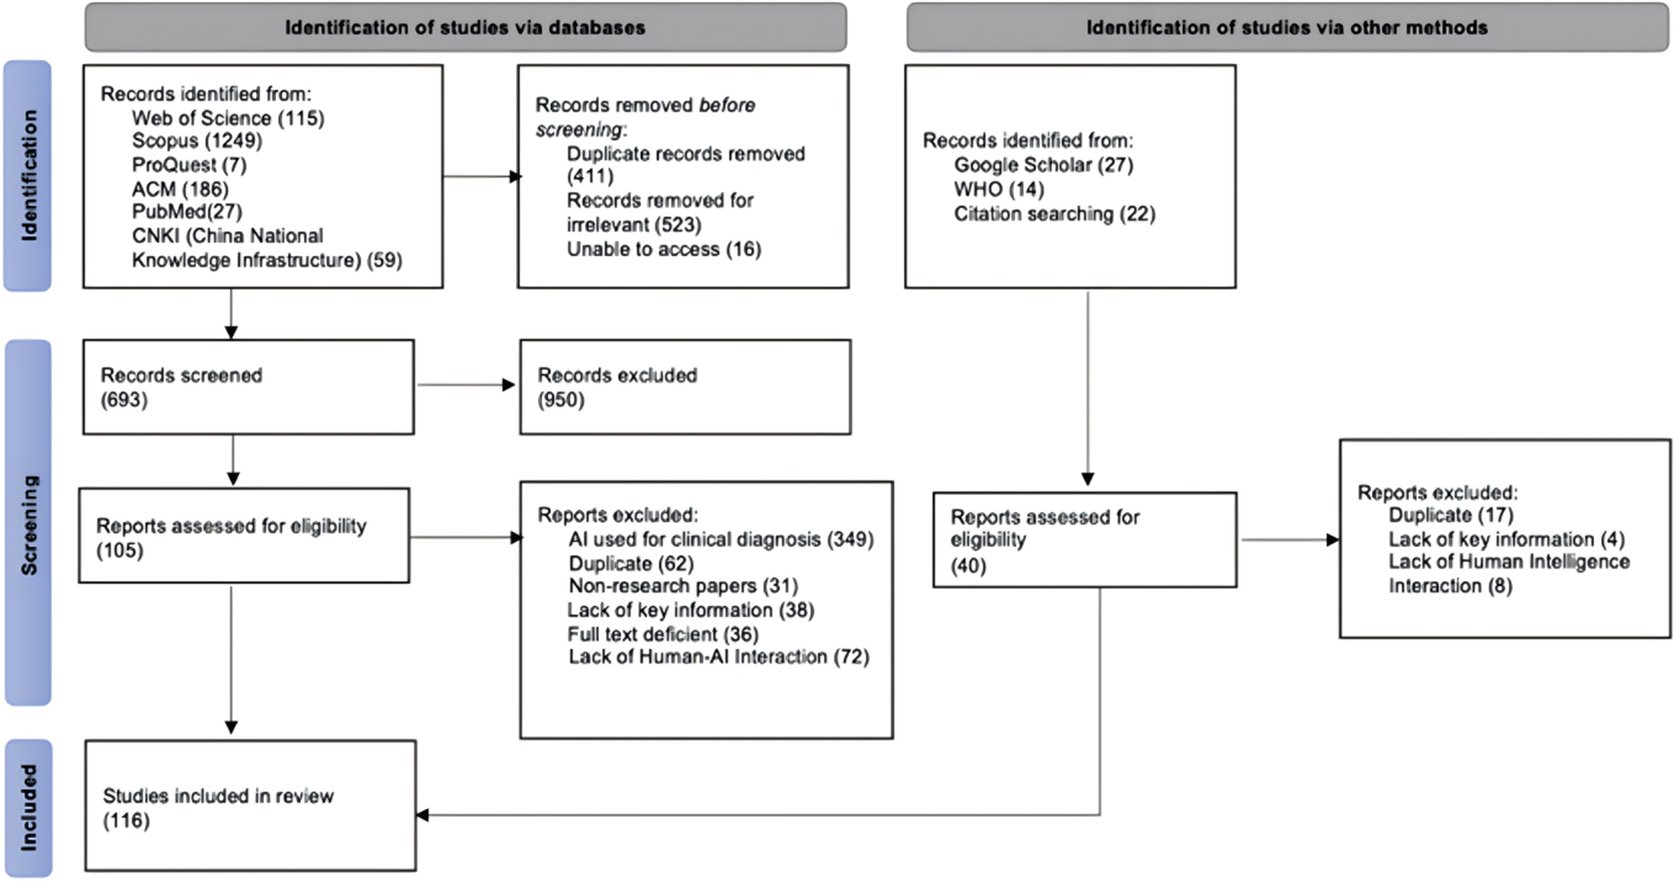
Figure 1. Long description
The flowchart is divided into three vertical stages.
1. Identification Phase.
Left side: Records identified from databases including Web of Science 115, Scopus 1249, ProQuest 7, A C M 186, PubMed 27, and C N K I China National Knowledge Infrastructure 59. An arrow points to a box for records removed before screening: Duplicate records removed 411, Records removed for irrelevant 523, and Unable to access 16.
Right side: Records identified from other methods including Google Scholar 27, W H O 14, and Citation searching 22.
2. Screening Phase.
Left side: Records screened 693 leads to Records excluded 950. Below this, Reports assessed for eligibility 105 leads to Reports excluded: A I used for clinical diagnosis 349, Duplicate 62, Non-research papers 31, Lack of key information 38, Full text deficient 36, and Lack of Human-A I Interaction 72.
Right side: Reports assessed for eligibility 40 leads to Reports excluded: Duplicate 17, Lack of key information 4, and Lack of Human Intelligence Interaction 8.
3. Included Phase.
Arrows from both the left and right screening paths converge at the bottom box: Studies included in review 116.
Of these, 92 were published in English and represent research conducted across a broad range of countries and regions, while 24 were published in Chinese and focus primarily on developments within the Chinese context. The publication years range from 2018 to 2024, and 86% of the included studies were published after 2020, reflecting the rapid adoption of AI-enabled health management technologies. Geographically, the included studies cover work conducted in North America, Europe, and Asia, with a concentration in the United States (US), China, and EU member states, which corresponding to the major jurisdictions examined in this review. The sample also includes studies that span multiple methodological approaches, including empirical analyses, system or application design studies, conceptual frameworks, and review papers. The diversity in language, region, and study type ensures that the dataset is representative of global research trends in human–AI interaction and data governance in personal health management.
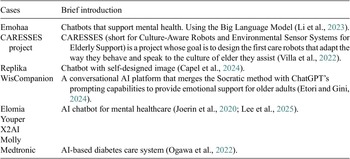
During the literature review process, a total of nine specific cases were extracted for theoretical saturation test and analysis of risk response measures (shown in Table 1). These cases include chatbots or conversational agents embedded with AI technology for mental health services, chronic disease management, and elderly care. The 81 related policies were accessed from the official websites of government agencies in China, the US, and the EU. These three governance entities (China, the US, and the EU) were selected based on the following considerations: (i) their strategic position and influence in the development of AI technology (Castro and McLaughlin, Reference Castro and McLaughlin2021); (ii) their greater use and regulation of health apps than other jurisdictions (Essén et al., Reference Essén, Stern, Haase, Car, Greaves, Paparova, Vandeput, Wehrens and Bates2022); and (iii) these entities also represent different mainstream governance styles (Bal and Gill Reference Bal and Gill2019). China is often characterised by a government-led national system (National People’s Congress, 2021; He, Reference He2023). The US is often characterised by its market-oriented governance system (DOJ, 2025). The EU implements multi-level governance to foster integration among member states (European Commission, 2022a; , 2022b; OECD, 2023). The laws, policies, and standards from these jurisdictions are selected for analysis. Policies were collected based on the following features: (i) the content can be obtained and accessed; (ii) the subject areas are related to “smart” healthcare, AI governance, human–AI interaction, data governance, digital health services; and (iii) the policy was formulated during the validity period. There are 26 Chinese policies, 27 policies from EU, and 28 policies from the US. All policies can be accessed online.
Cases and introductions
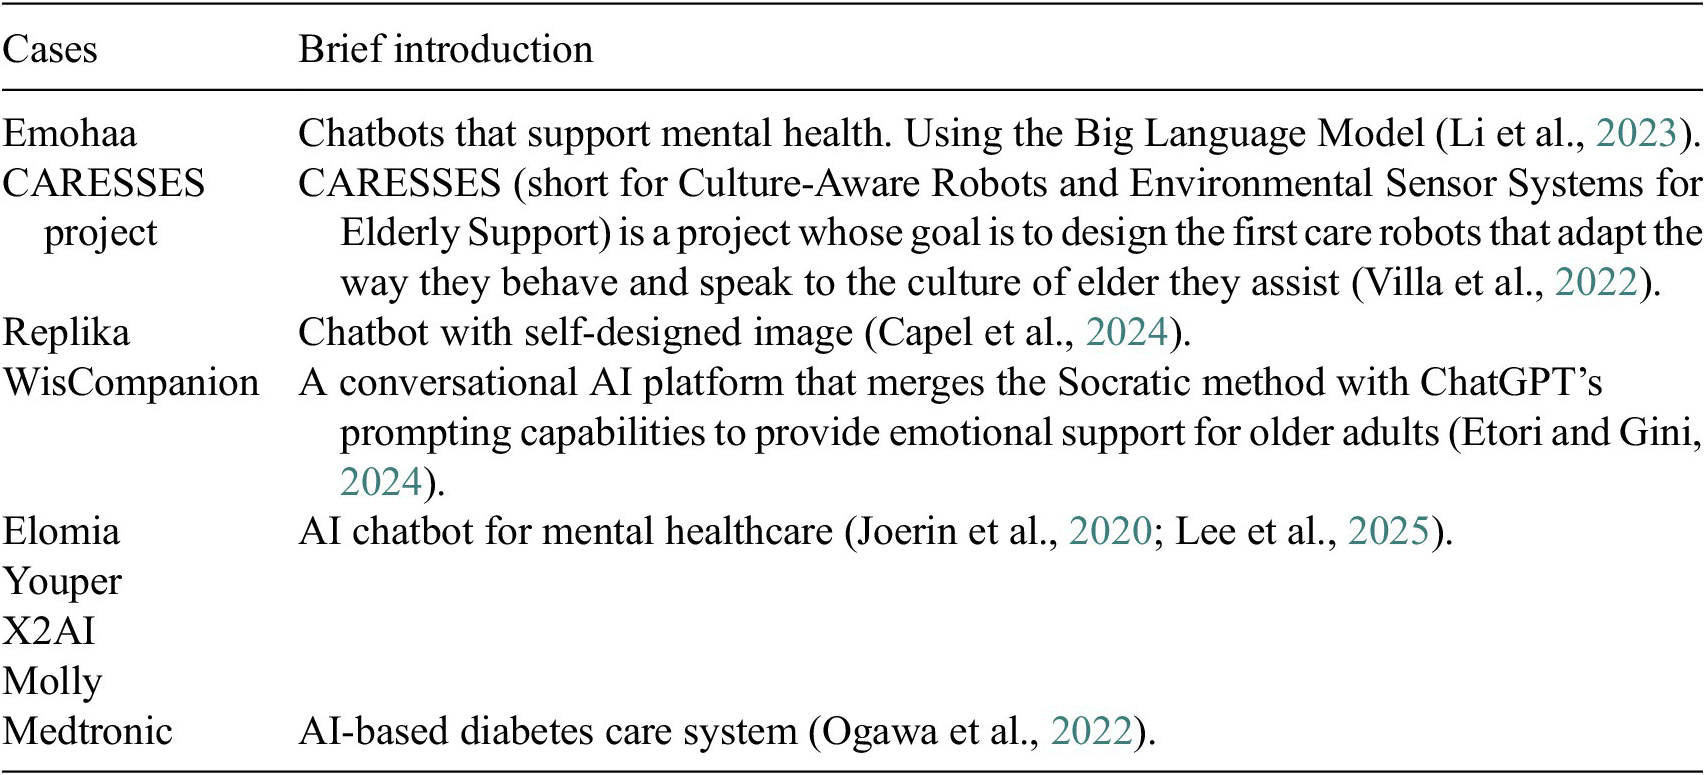
Table 1. Long description
The table consists of two columns: Cases on the left and Brief introduction on the right.
* Emohaa: Chatbots that support mental health using the Big Language Model.
* C A R E S S E S project: Culture-Aware Robots and Environmental Sensor Systems for Elderly Support, designed to adapt behavior and speech to the culture of the elderly.
* Replika: Chatbot with self-designed image.
* WisCompanion: A conversational A I platform merging the Socratic method with Chat G P T prompting for emotional support for older adults.
* Elomia, Youper, X 2 A I, and Molly: All grouped under the description of A I chatbot for mental healthcare.
* Medtronic: A I-based diabetes care system.
2.2. Data analysis
2.2.1. Thematic analysis
Thematic analysis is used to identify and interpret patterns or themes in a dataset; it often leads to new insights and understanding (Boyatzis, Reference Boyatzis1998; Elliott, Reference Elliott2018). The thematic analysis followed the six-step approach proposed by Naeem et al. (Reference Naeem, Ozuem, Howell and Ranfagni2023). Steps include the selection of quotations, keywords, coding, themes, conceptualisation, and conceptual model development (Naeem et al., Reference Naeem, Ozuem, Howell and Ranfagni2023). Microsoft Excel was used as the tool for thematic analytical recording and statistical analysis.
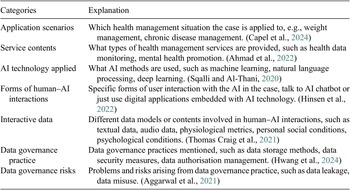
First step is the selection of quotations, keywords, and each sentence in the literature and policy texts was carefully reviewed and coded according to predefined analytical categories. Table 2 illustrates how relevant quotations and keywords were extracted and aligned with these categories. The meaning of each category is further elaborated through the “explanation” box. These categories correspond to the research questions and can reflect the current state of human–AI interaction and data involved, data governance practices and risks in personal health management. These categories guided what types of information were collected—for example, descriptions of application scenarios, service contents, data governance practices, and so on.
Text analysis categories
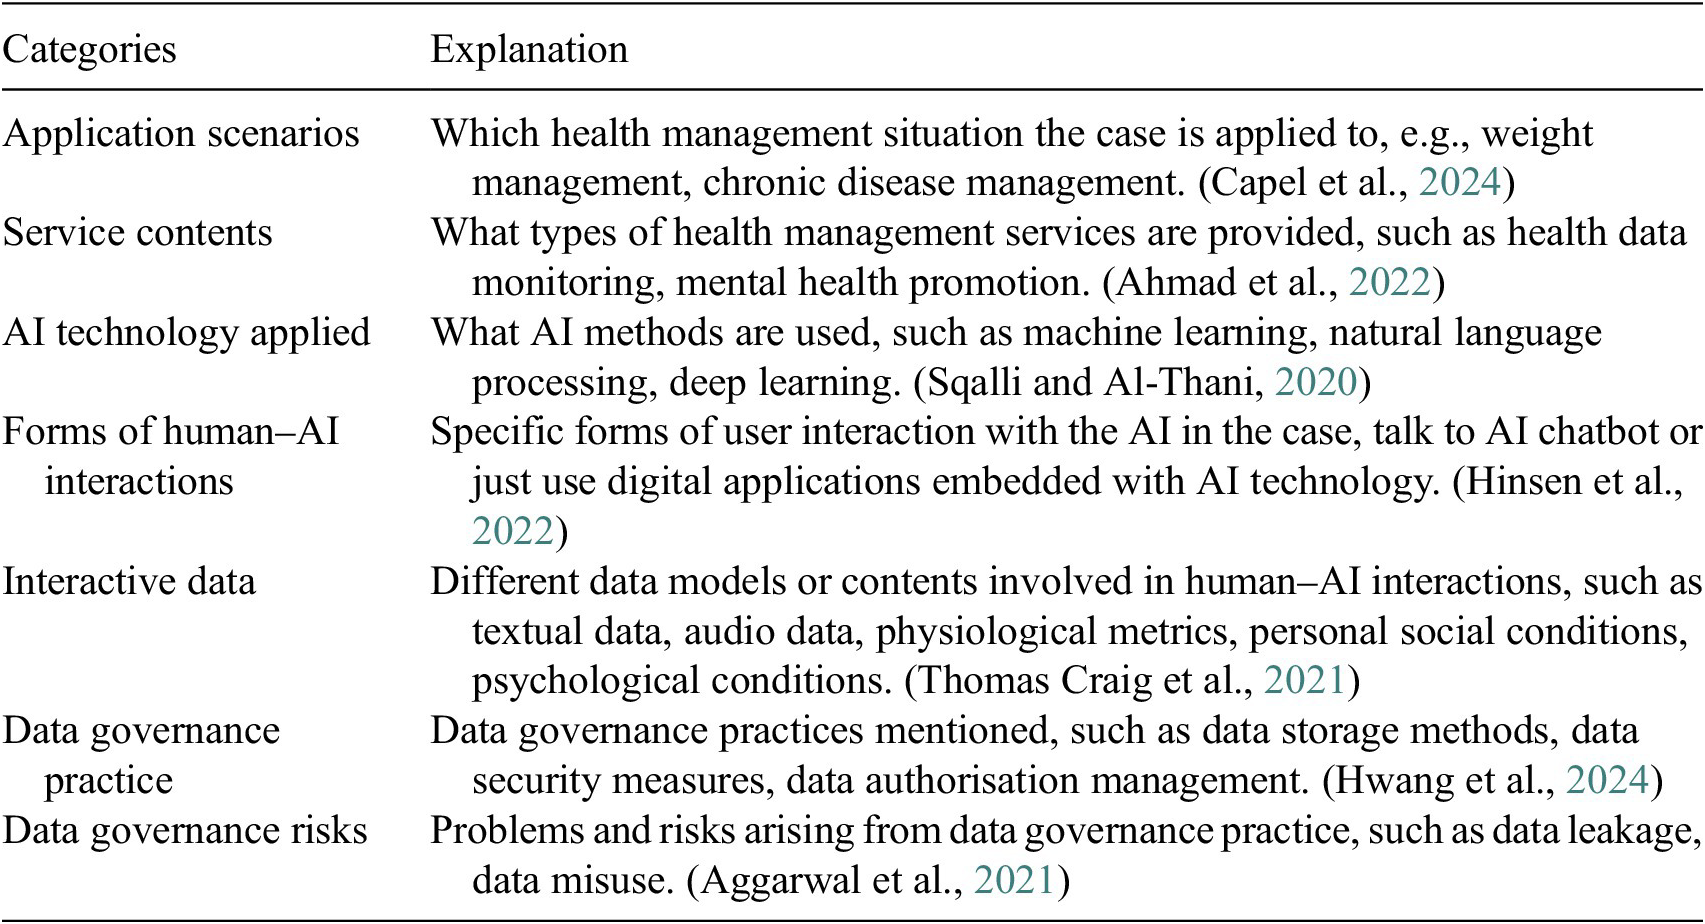
Table 2. Long description
The table consists of two columns titled Categories and Explanation.
* Row 1: Application scenarios. Explanation: Which health management situation the case is applied to, e.g., weight management, chronic disease management.
* Row 2: Service contents. Explanation: What types of health management services are provided, such as health data monitoring, mental health promotion.
* Row 3: A I technology applied. Explanation: What A I methods are used, such as machine learning, natural language processing, deep learning.
* Row 4: Forms of human–A I interactions. Explanation: Specific forms of user interaction with the A I in the case, talk to A I chatbot or just use digital applications embedded with A I technology.
* Row 5: Interactive data. Explanation: Different data models or contents involved in human–A I interactions, such as textual data, audio data, physiological metrics, personal social conditions, psychological conditions.
* Row 6: Data governance practice. Explanation: Data governance practices mentioned, such as data storage methods, data security measures, data authorisation management.
* Row 7: Data governance risks. Explanation: Problems and risks arising from data governance practice, such as data leakage, data misuse.
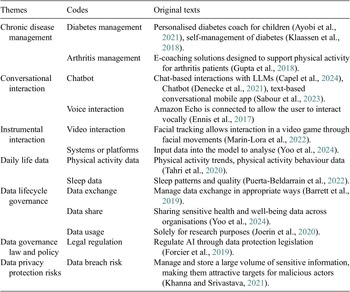
The second step is coding and themes development. Based on the extracted quotations from each category in Table 2, core messages, significance, and underlying meanings of the texts were systematically identified. Authors assigned initial codes based on the original texts in Table 2. The codes were then further synthesised into broader themes, which represented recurrent patterns across the dataset and aligned with the objectives of this study. Through constant comparison and iterative refinement, these codes were organised into conceptually coherent themes to identify patterns and relationships across the data. This thematic structure enables a deeper understanding of the relationships among governance elements and offers insights into the research questions. Table 3 shows the themes and associated codes, along with examples of the original quotations from which they were derived.
Examples of coding and themes
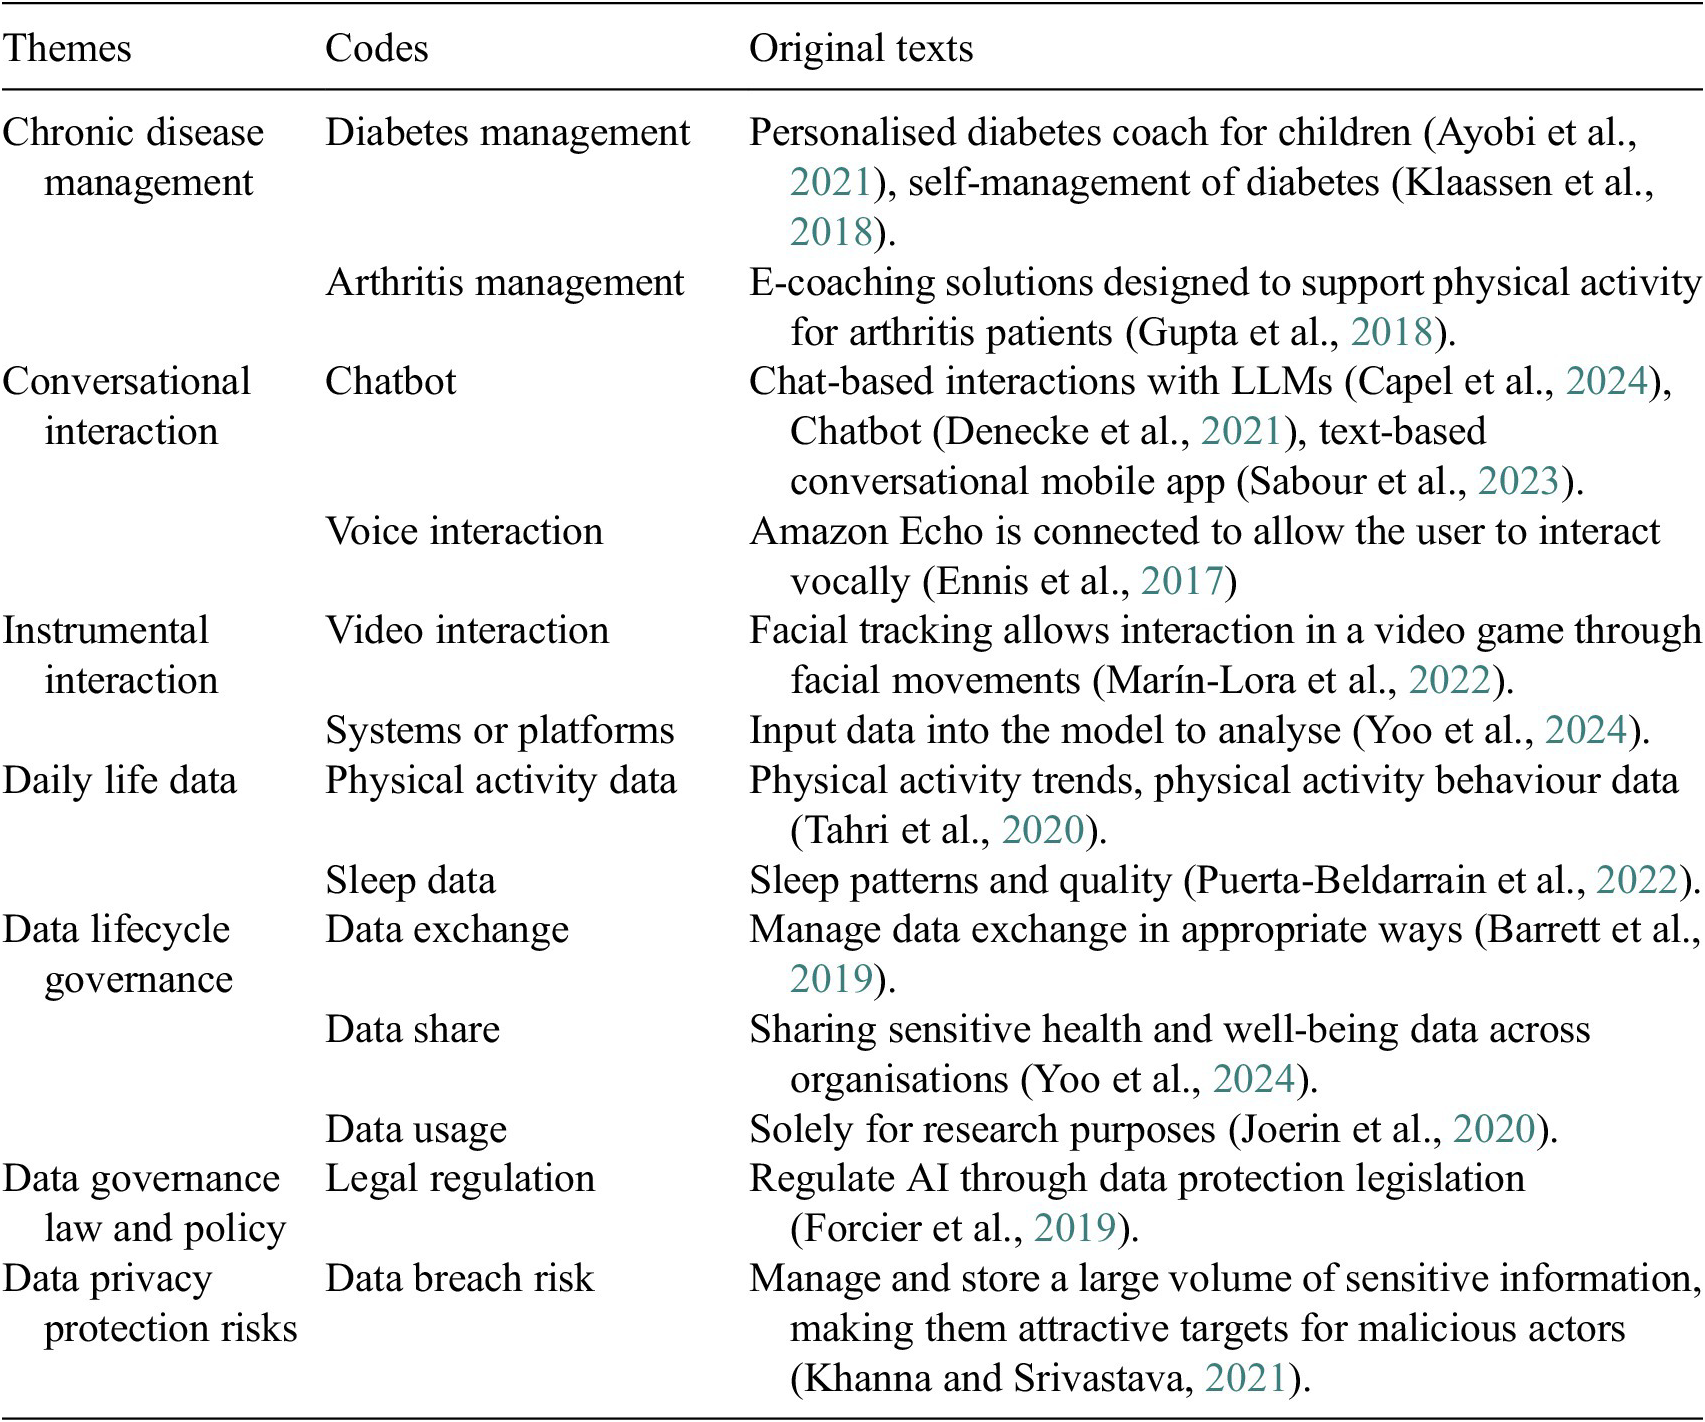
Table 3. Long description
The table consists of three columns: Themes, Codes, and Original texts.
1. Theme: Chronic disease management.
- Code: Diabetes management. Text: Personalised diabetes coach for children (Ayobi et al., 2021), self-management of diabetes (Klaassen et al., 2018).
- Code: Arthritis management. Text: E-coaching solutions designed to support physical activity for arthritis patients (Gupta et al., 2018).
2. Theme: Conversational interaction.
- Code: Chatbot. Text: Chat-based interactions with L L M s (Capel et al., 2024), Chatbot (Denecke et al., 2021), text-based conversational mobile app (Sabour et al., Reference Sabour, Zhang, Xiao, Zhang, Zheng, Wen, Zhao and Huang2023).
- Code: Voice interaction. Text: Amazon Echo is connected to allow the user to interact vocally (Ennis et al., 2017).
3. Theme: Instrumental interaction.
- Code: Video interaction. Text: Facial tracking allows interaction in a video game through facial movements (Marín-Lora et al., 2022).
- Code: Systems or platforms. Text: Input data into the model to analyse (Yoo et al., 2024).
4. Theme: Daily life data.
- Code: Physical activity data. Text: Physical activity trends, physical activity behaviour data (Tahri et al., Reference Tahri Sqalli and Al-Thani2020).
- Code: Sleep data. Text: Sleep patterns and quality (Puerta-Beldarrain et al., 2022).
5. Theme: Data lifecycle governance.
- Code: Data exchange. Text: Manage data exchange in appropriate ways (Barrett et al., 2019).
- Code: Data share. Text: Sharing sensitive health and well-being data across organisations (Yoo et al., 2024).
- Code: Data usage. Text: Solely for research purposes (Joerin et al., 2020).
6. Theme: Data governance law and policy.
- Code: Legal regulation. Text: Regulate A I through data protection legislation (Forcier et al., 2019).
7. Theme: Data privacy protection risks.
- Code: Data breach risk. Text: Manage and store a large volume of sensitive information, making them attractive targets for malicious actors (Khanna and Srivastava, Reference Khanna and Srivastava2021).
The last step is conceptualisation and model development. The authors refined concepts and themes emerging from the codes. Based on this analysis, a risk framework was constructed (Figure 5).
2.2.2. Case study
The case studies method analyses use cases extracted from the literature. All samples can be seen in Table 1. First, the case is used to verify the completeness of the themes, coding, and theoretical framework in the thematic analysis findings. Second, the response measures to the data governance risks based on the case were analysed. The results are shown in Table 5.
3. Results
3.1 Current state of human–AI interaction in the personal health management field
3.1.1 Overview of human–AI interaction features
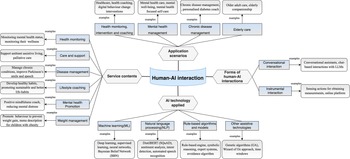
The features of human–AI interaction include application scenarios, service contents, and forms of human–AI interactions. Figure 2 shows the specific themes and examples.
Human–AI interaction features.
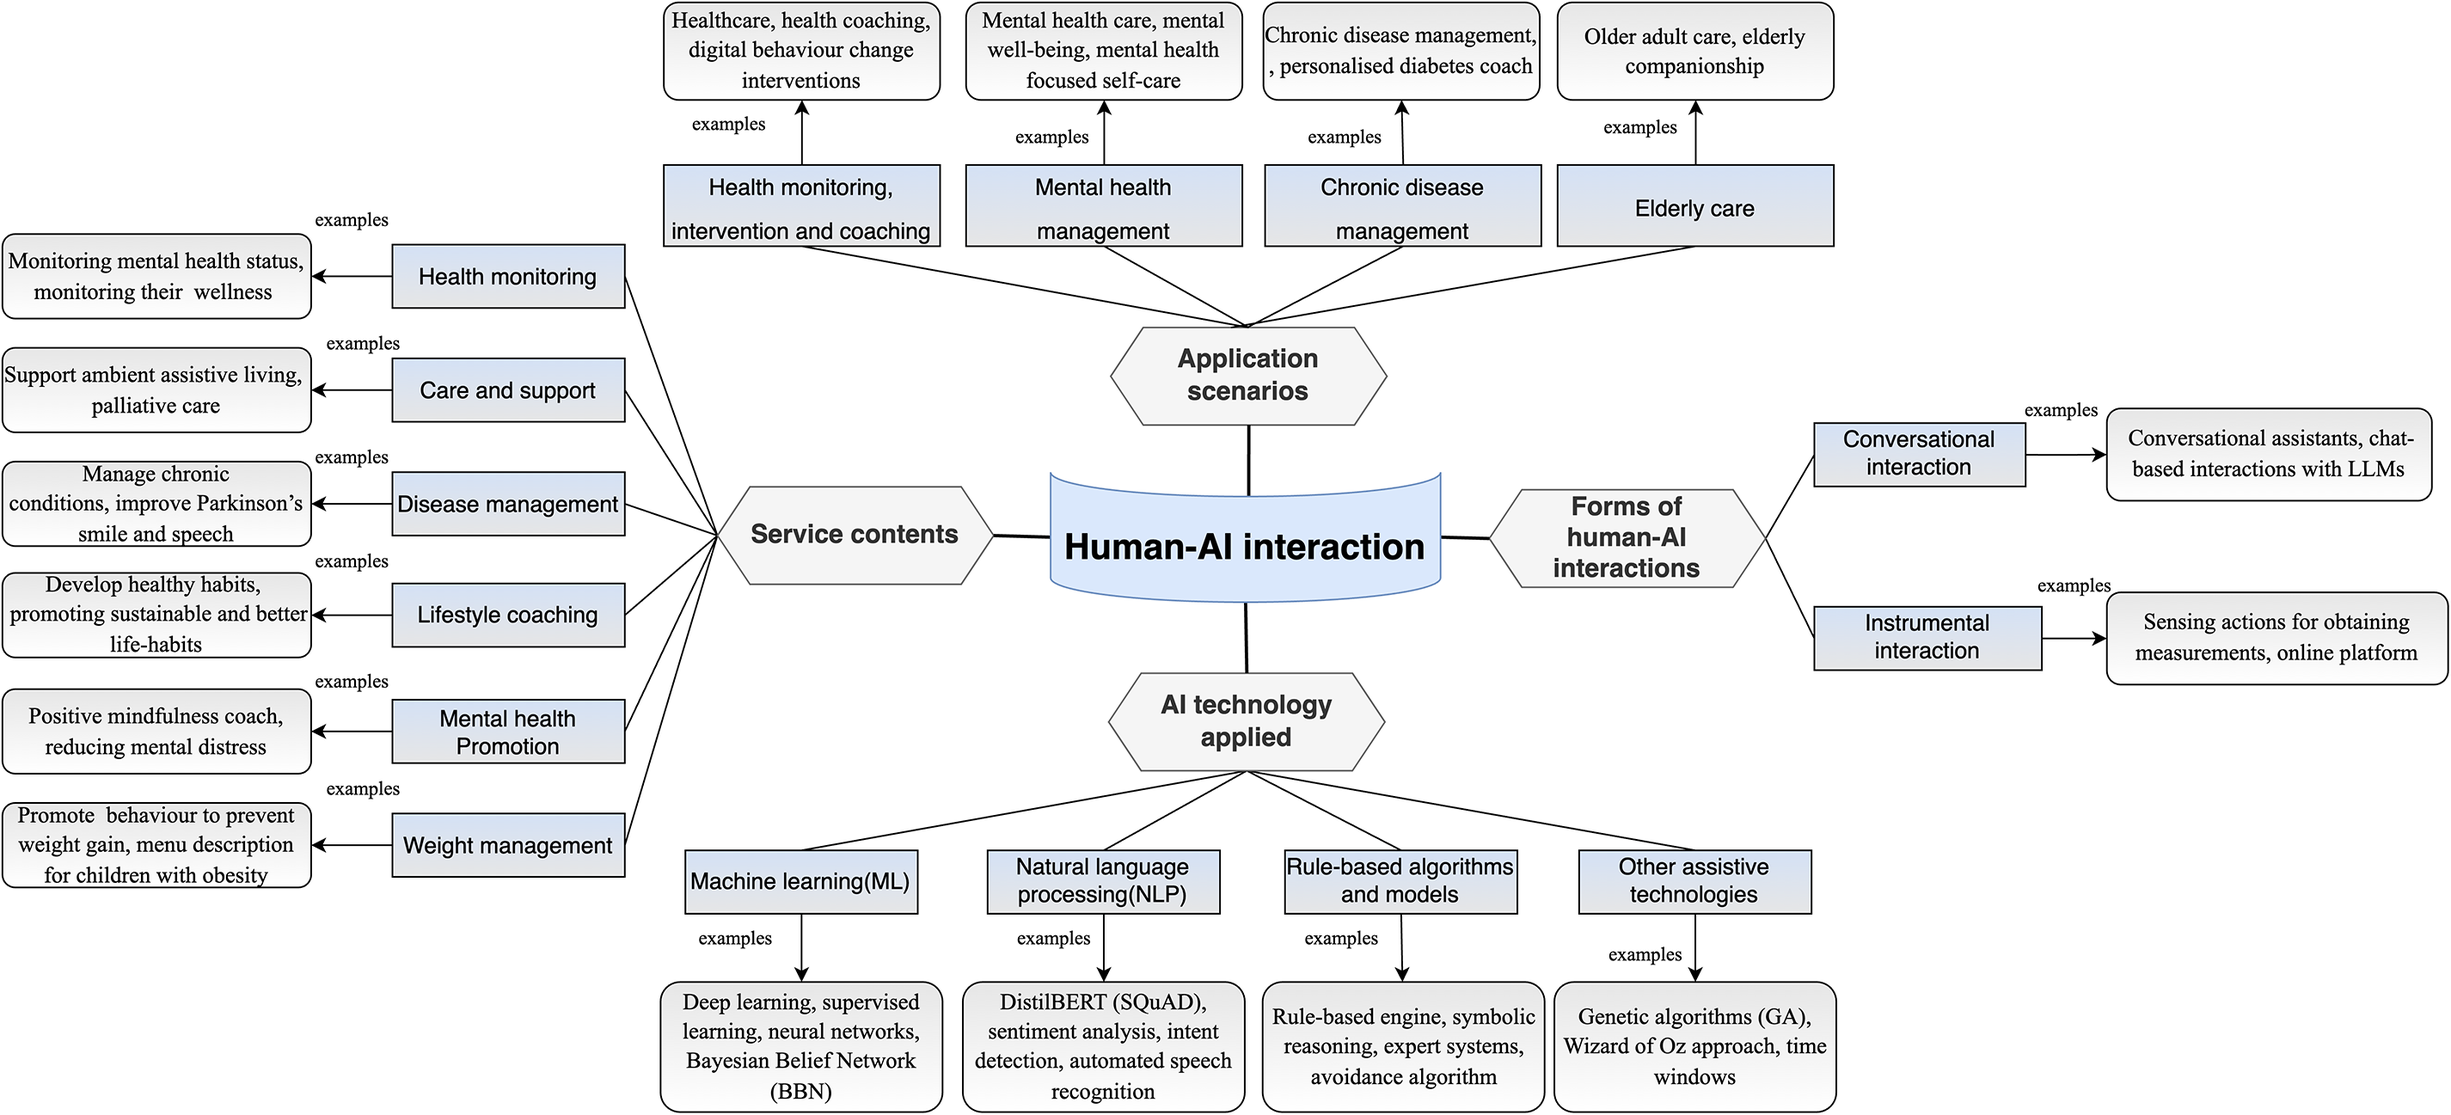
Figure 2. Long description
At the center of the diagram is a blue banner labeled Human A I interaction. Four hexagonal nodes branch out from this center.
1. Application scenarios at the top branches into four blue boxes. Health monitoring, intervention and coaching leads to healthcare and digital behavior change. Mental health management leads to mental health care and self-care. Chronic disease management leads to personalized diabetes coaching. Elderly care leads to older adult care and companionship.
2. Forms of human A I interactions on the right branches into two blue boxes. Conversational interaction leads to conversational assistants and L L M s. Instrumental interaction leads to sensing actions and online platforms.
3. A I technology applied at the bottom branches into four blue boxes. Machine learning M L leads to deep learning and Bayesian Belief Network B B N. Natural language processing N L P leads to DistilBERT S Q u A D and speech recognition. Rule-based algorithms and models leads to symbolic reasoning and expert systems. Other assistive technologies leads to Genetic algorithms G A and Wizard of Oz approach.
4. Service contents on the left branches into six blue boxes. Health monitoring leads to wellness monitoring. Care and support leads to ambient assistive living. Disease management leads to Parkinson’s care. Lifestyle coaching leads to healthy habit development. Mental health Promotion leads to mindfulness coaching. Weight management leads to obesity prevention.
The application scenarios refer to the broader health-related contexts or use cases where AI-enabled personal health management is applied. Scenarios include health monitoring, intervention and coaching (Capel et al., Reference Capel, Ploderer, Bircanin, Vallgårda, Jönsson, Fritsch, Alaoui and Le Dantec2024), mental health management (Spors et al., Reference Spors, Wagner and Flintham2021), chronic disease management (Ogawa et al., Reference Ogawa, Oyama, Morito, Kobayashi, Yamada, Shinkawa, Kamo, Hatano and Hattori2022), and elderly care (Etori and Gini, Reference Etori and Gini2024) (4 themes). The service contents describe the specific functions or services provided within those scenarios, which cover health monitoring (Sqalli et al., Reference Sqalli, Aslonov, Gafurov and Nurmatov2023), care and support (Papadopoulos et al., Reference Papadopoulos, Castro, Nigath, Davidson, Faulkes, Menicatti, Khaliq, Recchiuto, Battistuzzi, Randhawa, Merton, Kanoria, Chong, Kamide, Hewson and Sgorbissa2022), disease management (Aggarwal et al., Reference Aggarwal, Gingras and Deber2021), lifestyle coaching (Wiebelitz et al., Reference Wiebelitz, Schmid and Maier2022), mental health promotion (Hwang et al., Reference Hwang, Adler, Friedenberg and Yang2024), and weight management (Polo-Rodriguez et al., Reference Polo-Rodriguez, Ariza and Rivas2023) (6 themes). The forms of human–AI interaction include conversational and instrumental. The conversational interaction appears in the form of chats and dialogues with the AI (Kilic et al., Reference Kilic, Weck, Kampik and Lindgren2023). The instrumental interaction appears in the form of using AI as a tool to collect and analyse health data (Gutierrez et al., Reference Gutierrez, Castro and Banos2022). AI technology applied in this area includes machine learning (ML), natural language processing (NLP), rule-based algorithms and models, and other assistive technologies (4 themes). ML enables systems to learn from user data and make personalised predictions (Yang et al., Reference Yang, Lv and Liu2022). NLP supports conversational interfaces and language-based interaction (Esmaeilzadeh et al., Reference Esmaeilzadeh, Mirzaei and Dharanikota2021). Rule-based algorithms and models are often used in decision trees or logic-driven workflows for structured tasks (Jermutus, Reference Jermutus2021). Assistive technologies, such as speech recognition, GA, or knowledge graphs, enhance multimodal engagement and contextual understanding (Lima et al., Reference Lima, Teixeira and Pereira2023).
3.1.2 Data types in human–AI interaction
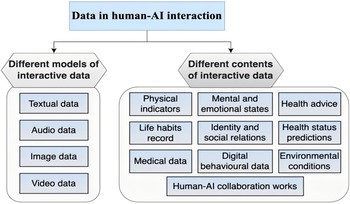
Different data types can be categorised according to their data model and content (see Figure 3). Interactive data models include text (Pablos-Sarabia et al., Reference Pablos-Sarabia, Griol and Callejas2022), image (Du et al., Reference Du, An, Leung, Li, Chapman and Zhao2023), audio (Comai et al., Reference Comai, Mundstock Freitas, Xu, Conte, Colombo and Pöyhönen2023), and video (Ogawa et al., Reference Ogawa, Oyama, Morito, Kobayashi, Yamada, Shinkawa, Kamo, Hatano and Hattori2022). Interactive data contents relate to physical (Sqalli and Al-Thani, Reference Sqalli and Al-Thani2020), life habits (Polo-Rodriguez et al., Reference Polo-Rodriguez, Ariza and Rivas2023), personal identity and social relations (Sqalli et al., Reference Sqalli, Al-Thani, Qaraqe, Fernandez-Luque, Househ, Borycki and Kushniruk2021), digital behaviour (Alotaibi and Sas, Reference Alotaibi and Sas2023), health advice (Sengupta et al., Reference Sengupta, Sarcar, Pradhan, McNaney, Sayago, Chattopadhyay and Joshi2020), health status predictions (Qaraqe et al., Reference Qaraqe, Erraguntla, Dave, Househ, Borycki and Kushniruk2021), medical data (Stephens et al., Reference Stephens, Joerin, Rauws and Werk2019), environmental conditions (Zubatiy et al., Reference Zubatiy, Vickers, Mathur and Mynatt2021), and human–AI collaboration works. In particular, human–AI collaborative works are artistic drawings made by a human and an AI that can be used to treat psychological problems (Du et al., Reference Du, An, Leung, Li, Chapman and Zhao2023).
Different data involved in human–AI interaction.
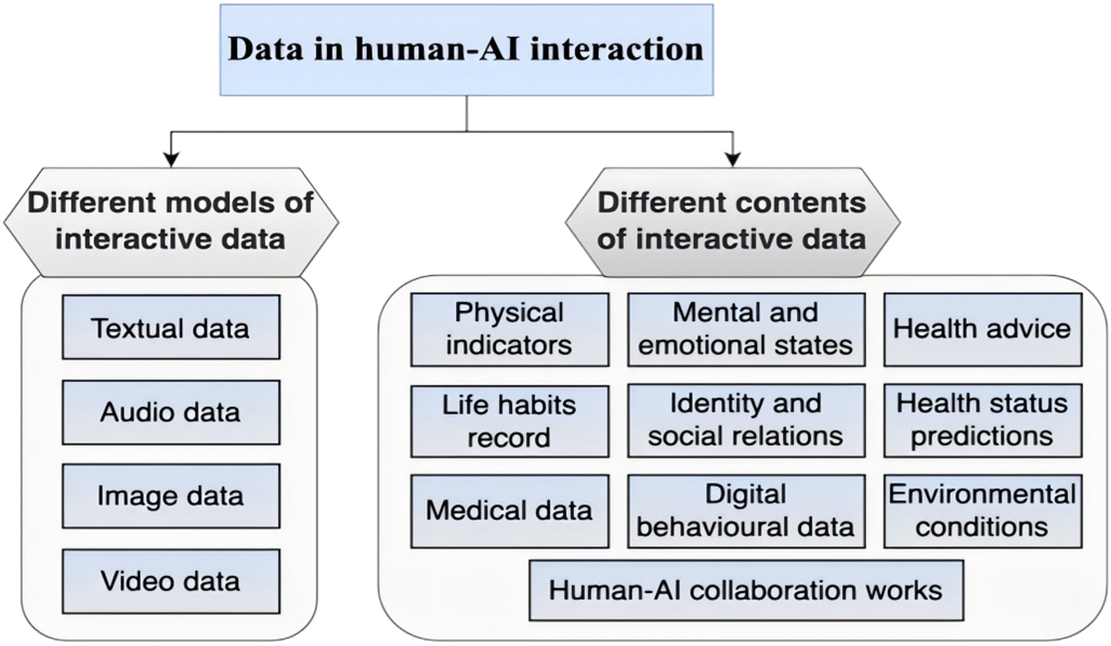
Figure 3. Long description
A top-level blue rectangular box titled Data in human-A I interaction branches downward into two hexagonal headers.
On the left, the header Different models of interactive data contains a vertical list of four blue boxes:
- Textual data
- Audio data
- Image data
- Video data
On the right, the header Different contents of interactive data contains a larger rounded container with three columns of blue boxes.
- The first column includes: Physical indicators, Life habits record, and Medical data.
- The second column includes: Mental and emotional states, Identity and social relations, and Digital behavioural data.
- The third column includes: Health advice, Health status predictions, and Environmental conditions.
- Centered at the bottom of these three columns is a final box titled Human-A I collaboration works.
3.1.3 Landscape of human–AI interaction in personal health management
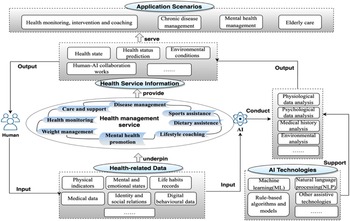
Figure 4 indicates the overview of human–AI Interaction in personal health management. Specifically, human–AI interaction is applied in health monitoring (Capel et al., Reference Capel, Ploderer, Bircanin, Vallgårda, Jönsson, Fritsch, Alaoui and Le Dantec2024), care and support (Papadopoulos et al., Reference Papadopoulos, Castro, Nigath, Davidson, Faulkes, Menicatti, Khaliq, Recchiuto, Battistuzzi, Randhawa, Merton, Kanoria, Chong, Kamide, Hewson and Sgorbissa2022), and disease management (Ogawa et al., Reference Ogawa, Oyama, Morito, Kobayashi, Yamada, Shinkawa, Kamo, Hatano and Hattori2022). Human users input different kinds of personal health-related data for AI systems to integrate and analyse. AI technologies like ML (Yang et al., Reference Yang, Lv and Liu2022), NLP (Esmaeilzadeh et al., Reference Esmaeilzadeh, Mirzaei and Dharanikota2021), rule-based algorithms (Jermutus, Reference Jermutus2021), and models (Lima et al., Reference Lima, Teixeira and Pereira2023) support data analysis and interpretation. Then AI systems provide health service information for users, which serves in multiple scenarios like health monitoring, intervention, and coaching (Capel et al., Reference Capel, Ploderer, Bircanin, Vallgårda, Jönsson, Fritsch, Alaoui and Le Dantec2024).
Overview of human–AI interaction in personal health management.
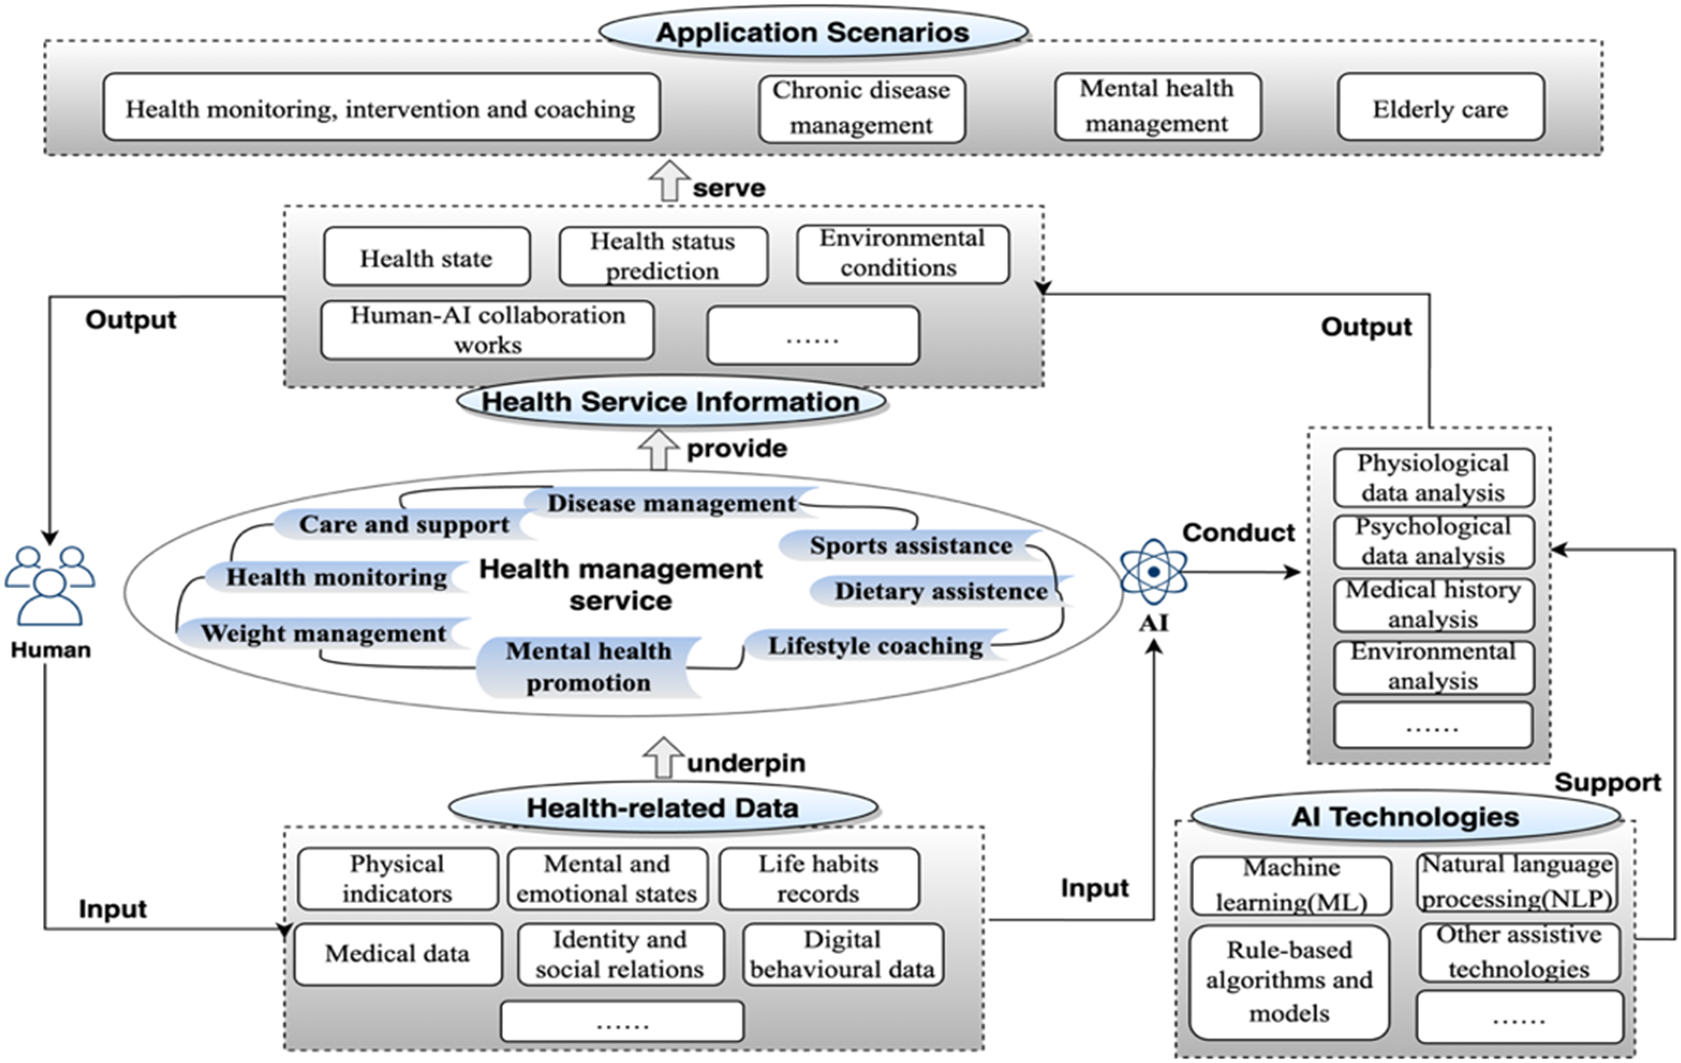
Figure 4. Long description
The flowchart is organized into a vertical stack of four primary functional layers connected by upward arrows.
1. Bottom Layer: Health-related Data. This layer serves as the foundation and includes categories for Physical indicators, Mental and emotional states, Life habits records, Medical data, Identity and social relations, and Digital behavioural data. An arrow labeled underpin points to the next layer.
2. Second Layer: Health management service. This is depicted as a central oval containing various service types: Care and support, Disease management, Sports assistance, Dietary assistance, Lifestyle coaching, Mental health promotion, Weight management, and Health monitoring. An arrow labeled provide points upward.
3. Third Layer: Health Service Information. This layer contains processed information including Health state, Health status prediction, Environmental conditions, and Human-A I collaboration works. An arrow labeled serve points to the top layer.
4. Top Layer: Application Scenarios. This final output layer includes Health monitoring, intervention and coaching; Chronic disease management; Mental health management; and Elderly care.
External Feedback Loop:
On the left, a Human icon receives Output from the top layers and provides Input to the bottom Health-related Data layer.
On the right, an A I icon labeled Conduct interacts with a vertical list of analysis tasks: Physiological data analysis, Psychological data analysis, Medical history analysis, and Environmental analysis. Below this, an A I Technologies box containing Machine learning M L, Natural language processing N L P, and Rule-based algorithms and models provides Support to the analysis tasks and receives Input from the Health-related Data layer.
3.2 Data governance practices and risks
3.2.1 Data governance practices
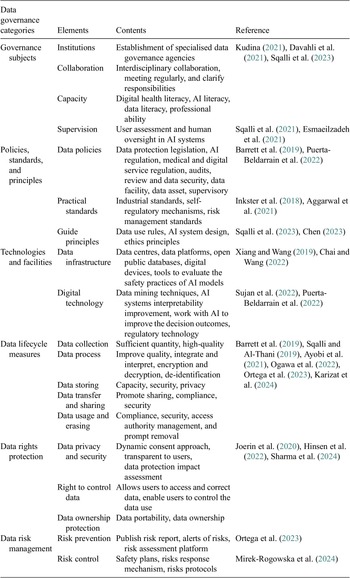
The data governance practice consists of six categories: governance subjects, policies, standards and principles, technologies and facilities, lifecycle measures, and data rights protection and risk management. The specific elements under each category are shown in Table 4.
Data governance practice categories and contents from the literature
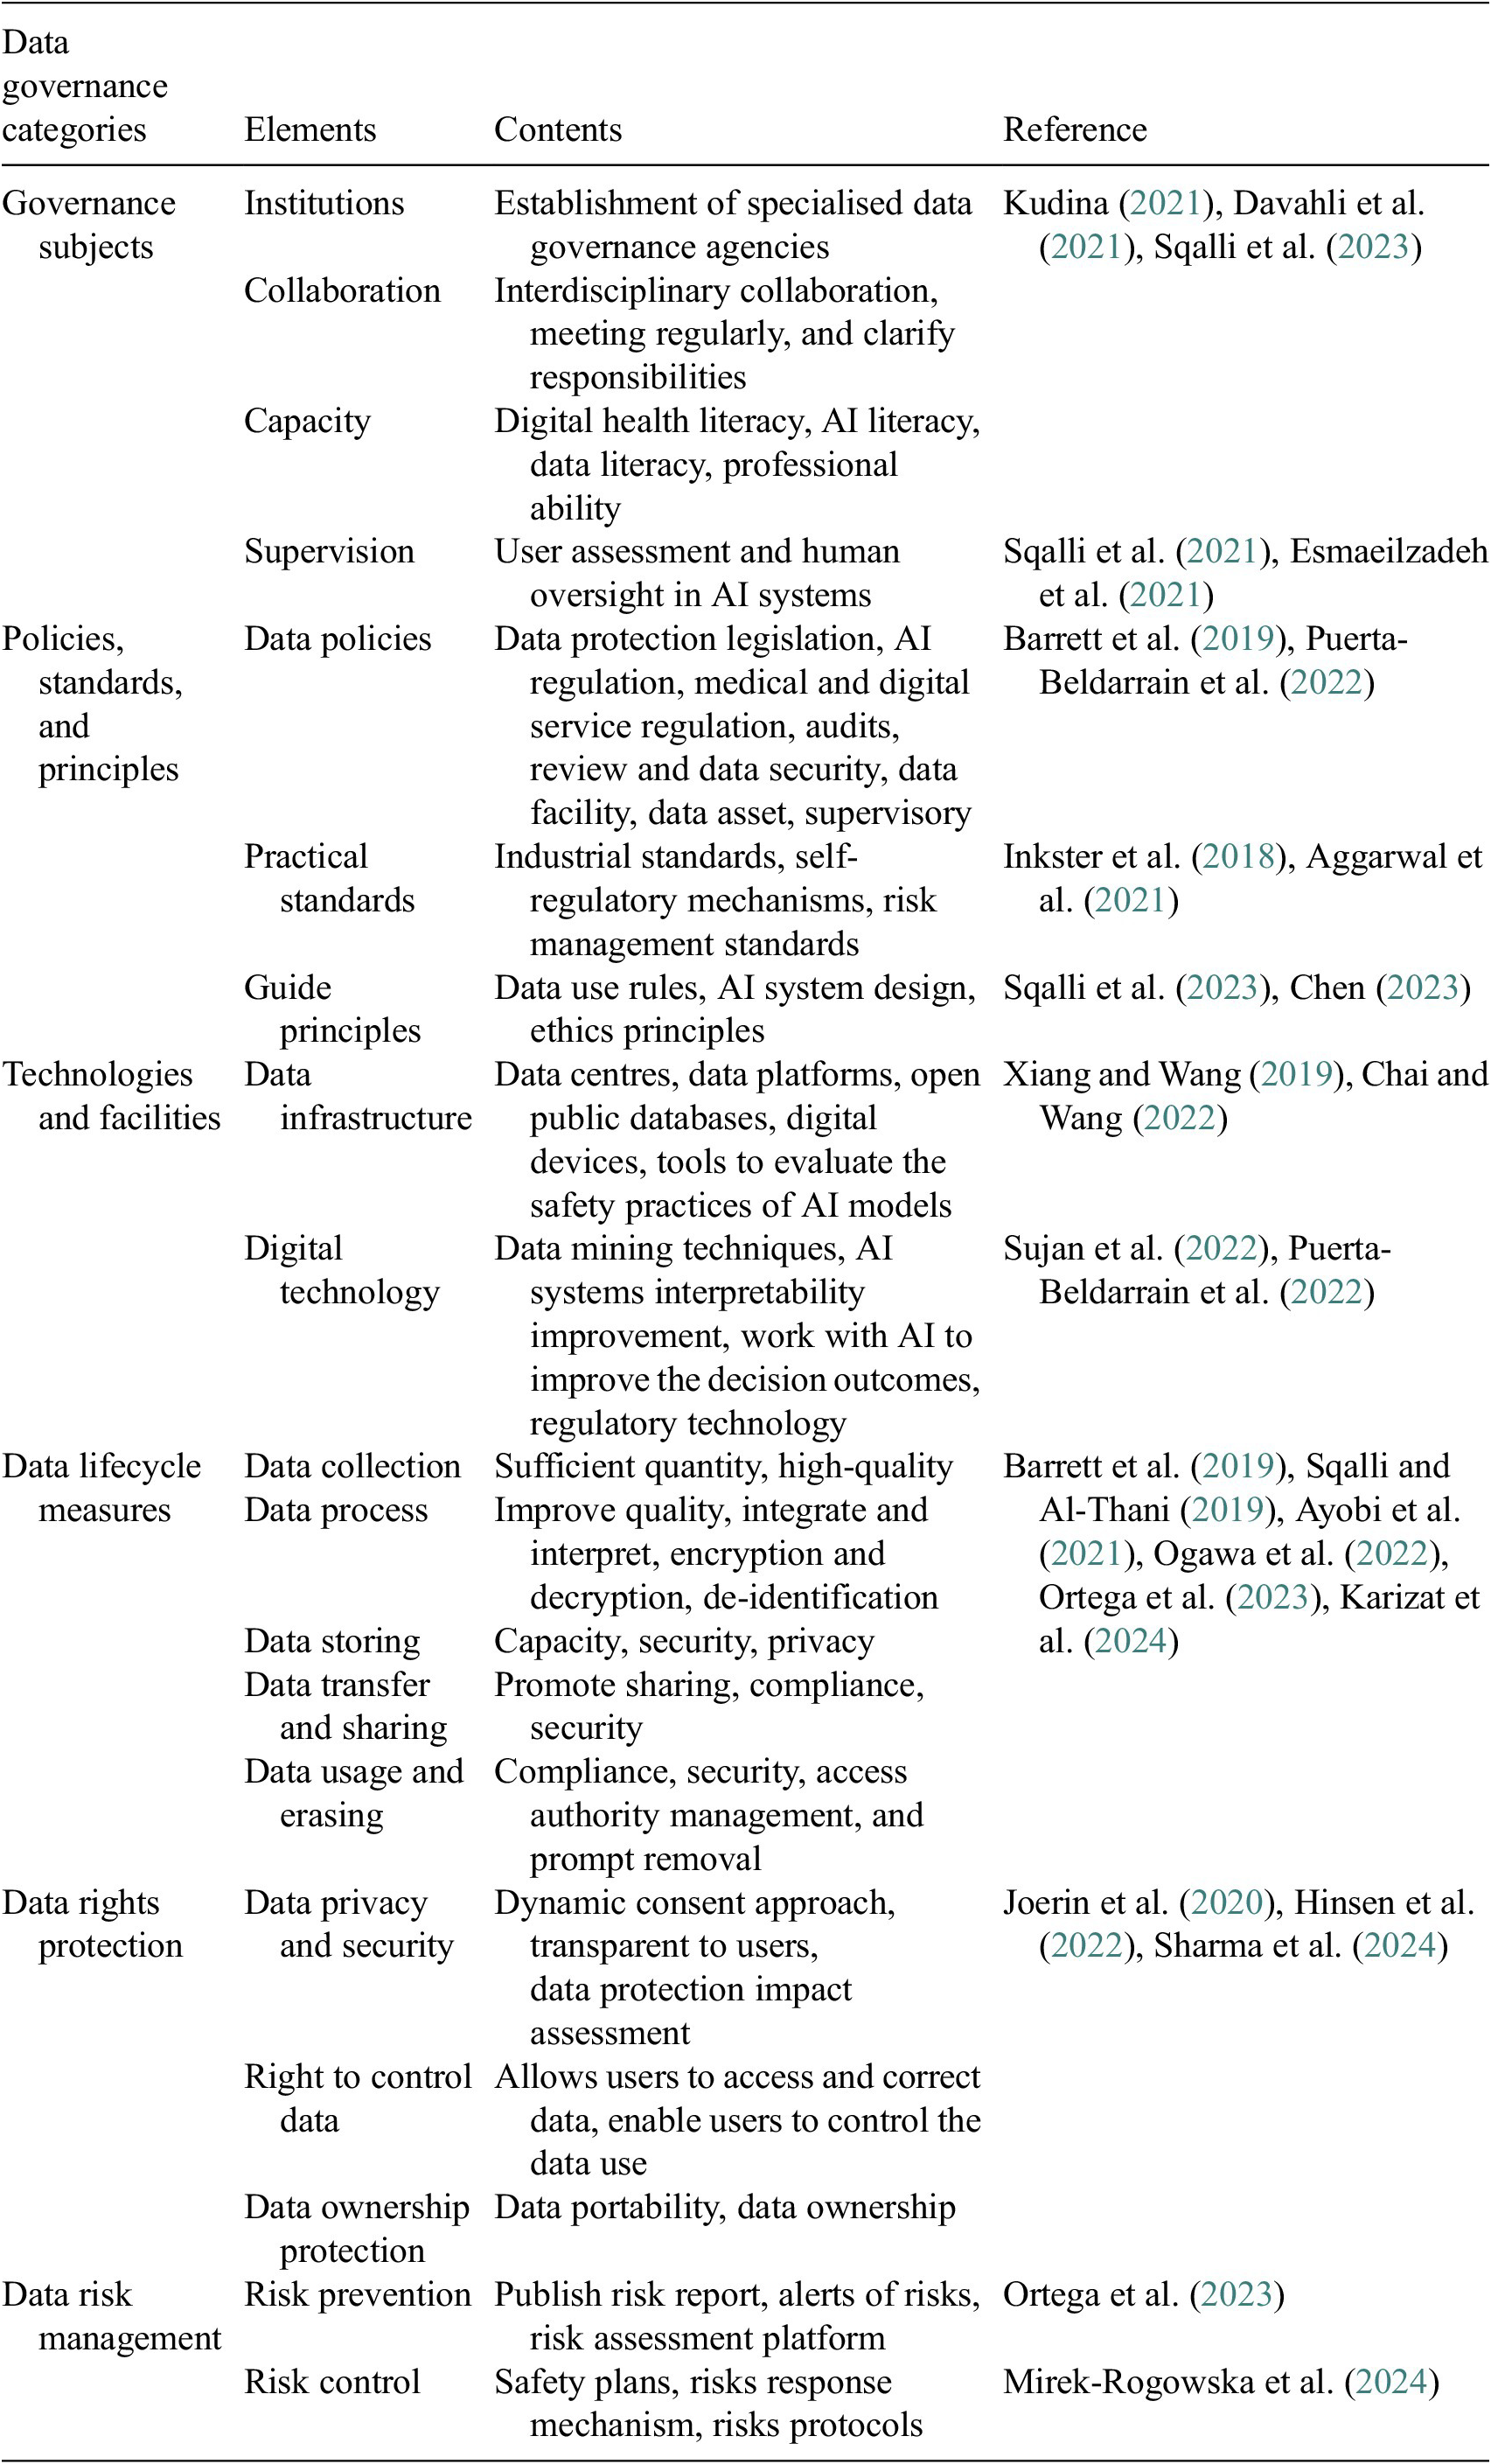
Table 4. Long description
The table consists of four columns: Data governance categories, Elements, Contents, and Reference.
1. Governance subjects:
- Institutions: Establishment of specialised data governance agencies.
- Collaboration: Interdisciplinary collaboration and clarified responsibilities.
- Capacity: Digital health, A I, and data literacy.
- Supervision: User assessment and human oversight in A I systems.
2. Policies, standards, and principles:
- Data policies: Legislation, A I regulation, and audits.
- Practical standards: Industrial and risk management standards.
- Guide principles: Data use rules and ethics principles.
3. Technologies and facilities:
- Data infrastructure: Data centres, platforms, and public databases.
- Digital technology: Data mining and A I systems interpretability.
4. Data lifecycle measures:
- Data collection: High-quality and sufficient quantity.
- Data process: Encryption, decryption, and de-identification.
- Data storing: Capacity, security, and privacy.
- Data transfer and sharing: Compliance and security.
- Data usage and erasing: Access authority management and prompt removal.
5. Data rights protection:
- Data privacy and security: Dynamic consent and impact assessments.
- Right to control data: User access and correction.
- Data ownership protection: Data portability.
6. Data risk management:
- Risk prevention: Risk reports and assessment platforms.
- Risk control: Safety plans and response mechanisms.
China, the EU and the US emphasise different dimensions of these categories. Overall, China’s policy focuses on data security, data infrastructure developments, and data-processing regulation (Chinese Government, 2024). EU policy focuses on data privacy, data rights protection, and AI regulation (European Union, 2024). US policy focuses on data and AI technology development, capacity development, and industry data autonomy (NIST, 2024).
In the governance subjects category, the Chinese government (Government of the People’s Republic of China, 2023) and the European Commission (2020) emphasise the importance of regulating and standardising enterprises’ data practices in the deployment and operation of human–AI interactions. The US government (2020), on the other hand, places more importance on regulating and standardising data governance practices through industry autonomy. In the policies, standards, and principles category, the Chinese government (2024) promotes data security, AI regulation, and industry-standard system. The EU promotes the establishment of a system of personal data rights, AI ethics and health data standards (EIT, 2024). The US government emphasises regulating AI technology standards, data opening, and sharing norms (NIST, 2024).
In the technologies and facilities category, China, the EU, and the US attach importance to the construction of AI data arithmetic facilities, data centres, and data platforms (European Commission, 2022a; 2022b), and the research and development of data security storage and mining analysis technologies (NIH, 2023).
In the data lifecycle measures category, data storage security, compliant sharing, transmission, and use are given more attention in the policy content. China pays more attention to data storage security to prevent data leakage (Standing Committee of the National People’s Congress, 2021). The EU focuses more on data privacy and data autonomy to prevent personal data breaches and misuse (European Parliament and Council of the European Union, 2024). The US attaches more importance to data opening and sharing rules and promotes data resource utilisation (NIH, 2023).
In the data rights protection category, China emphasises safeguarding data rights and property rights and achieving data secure and compliant use (Chinese Government, 2023a, 2023b). EU policy places the greatest emphasis on personal data rights protection and strictly regulates the data use and sharing by enterprises (European Commission, 2025). The US focuses on promoting flexible data rights management to facilitate industrial data value development and full utilisation (GAO, 2021).
In the data risk management category, data security and privacy risks receive the most attention in all policies. Risk management has been strengthened through measures such as critical infrastructure development, data security technologies strengthening, and data localisation (Chinese Government, 2021; The White House, 2021; European Parliament and Council of the European Union, 2025).
3.2.2 Risks in data governance practices
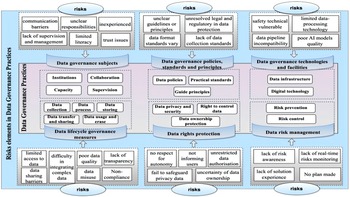
Based on these codes and themes extracted in the literature, the authors constructed a framework for risks in six categories of data governance practices derived from the literature (see Figure 5). The content in the middle box is data governance practices. The peripheral boxes are risks in the governance practices of these six components.
Human–AI interaction data governance practices and risks framework.
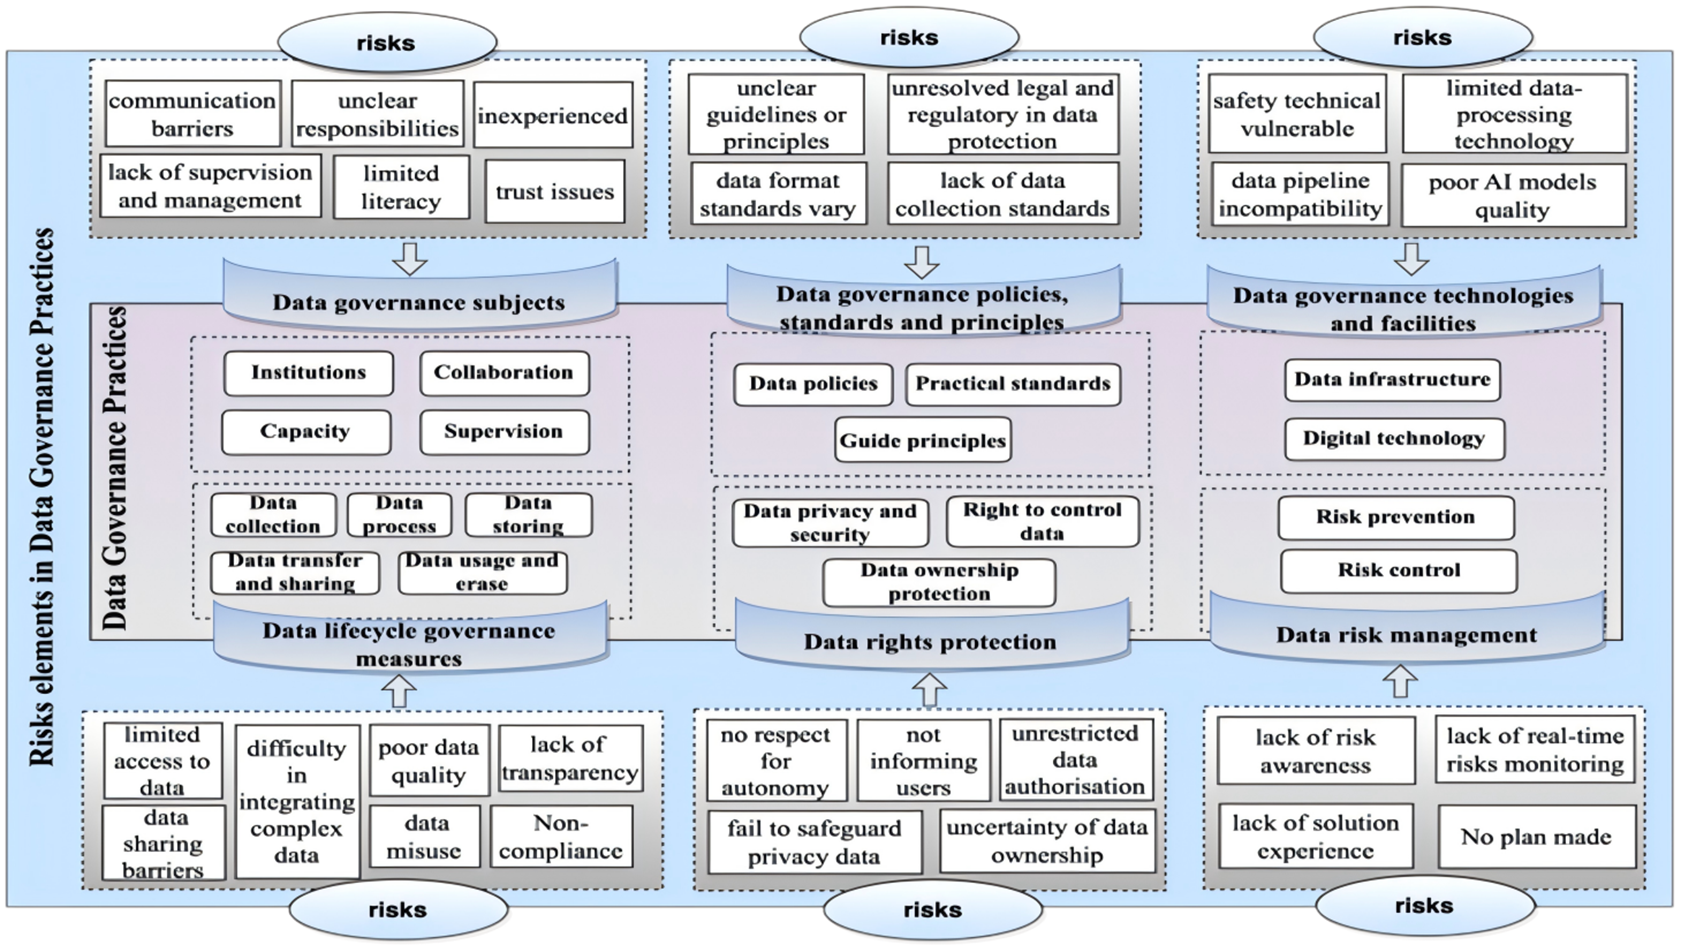
Figure 5. Long description
The flowchart is divided into three main vertical columns.
Left Column: Data Governance Subjects and Lifecycle.
Top risks include communication barriers, unclear responsibilities, inexperienced staff, lack of supervision and management, limited literacy, and trust issues. These point down to Data governance subjects including Institutions, Collaboration, Capacity, and Supervision. Below this, Data lifecycle governance measures include Data collection, Data process, Data storing, Data transfer and sharing, and Data usage and erase. Bottom risks pointing up include limited access to data, data sharing barriers, difficulty in integrating complex data, poor data quality, data misuse, lack of transparency, and non-compliance.
Middle Column: Data Governance Policies, Standards, Principles, and Rights.
Top risks include unclear guidelines or principles, unresolved legal and regulatory in data protection, data format standards vary, and lack of data collection standards. These point down to Data governance policies, standards and principles including Data policies, Practical standards, and Guide principles. Below this, Data rights protection includes Data privacy and security, Right to control data, and Data ownership protection. Bottom risks pointing up include no respect for autonomy, not informing users, unrestricted data authorisation, fail to safeguard privacy data, and uncertainty of data ownership.
Right Column: Data Governance Technologies, Facilities, and Risk Management.
Top risks include safety technical vulnerable, limited data-processing technology, data pipeline incompatibility, and poor A I models quality. These point down to Data governance technologies and facilities including Data infrastructure and Digital technology. Below this, Data risk management includes Risk prevention and Risk control. Bottom risks pointing up include lack of risk awareness, lack of real-time risks monitoring, lack of solution experience, and No plan made.
As for the governance subjects category, risks like communication barriers, lack of accountability (Esmaeilzadeh et al., Reference Esmaeilzadeh, Mirzaei and Dharanikota2021), experience (Ahmad et al., Reference Ahmad, Siemon, Gnewuch and Robra-Bissantz2022), supervision (Li et al., Reference Li, Xin, Lei, Zhou and Zhu2019), and management (Yin et al., Reference Yin, Wang, Yang and Zhao2021), poor literacy (Kudina, Reference Kudina2021), and trust issues (Esmaeilzadeh et al., Reference Esmaeilzadeh, Mirzaei and Dharanikota2021) between users and applications are mentioned. In the policies, standards, and principles category, risks like unclear data collection guidelines and ethics principles, lack of data protection regulations, varying data format standards, and lack of data collection standards are discussed more.
In the technologies and facilities category, the main risks consist of vulnerable safety technical (Barrett et al., Reference Barrett, Boyne, Brandts, Brunner-La Rocca, De Maesschalck and De Wit2019), limited technology to interpret complex data (Sqalli et al., Reference Sqalli, Al-Thani, Qaraqe, Fernandez-Luque, Househ, Borycki and Kushniruk2021), data pipeline incompatibility (Hwang et al., Reference Hwang, Adler, Friedenberg and Yang2024), and lacking data to train AI models (Davahli et al., Reference Davahli, Karwowski, Fiok, Wan and Parsaei2021). In the data lifecycle categories, risks like limited access to collect data (Ayobi et al., Reference Ayobi, Morrison, Spillman and Wright2021), difficulty in interpreting data (Denecke et al., Reference Denecke, Abd-Alrazaq and Househ2021), poor data quality (Hwang et al., Reference Hwang, Adler, Friedenberg and Yang2024), lack of transparency in data processing (Thomas Craig et al., Reference Thomas Craig, Morgan, Chen, Michie, Fusco, Snowdon, Scheufele, Gagliardi and Sill2021), data sharing barriers (Ayobi et al., Reference Ayobi, Morrison, Spillman and Wright2021), incomplete data (Davahli et al., Reference Davahli, Karwowski, Fiok, Wan and Parsaei2021), data misuse, and non-compliance in data collection and sharing (Barrett et al., Reference Barrett, Boyne, Brandts, Brunner-La Rocca, De Maesschalck and De Wit2019). In data rights protection, risks including no respect for autonomy, no informing users (Hinsen et al., Reference Hinsen, Hofmann, Jöhnk and Urbach2022), and unrestricted data authorisation (Chen, Reference Chen2023) are emphasised. In data risks management, risks consist of lacking risk awareness (Yin et al., Reference Yin, Wang, Yang and Zhao2021), real-time risk monitoring (Khanna and Srivastava, Reference Khanna and Srivastava2021), solution experience, and plans (Barrett et al., Reference Barrett, Boyne, Brandts, Brunner-La Rocca, De Maesschalck and De Wit2019).
3.3 Response measures to data governance risks based on cases and policies
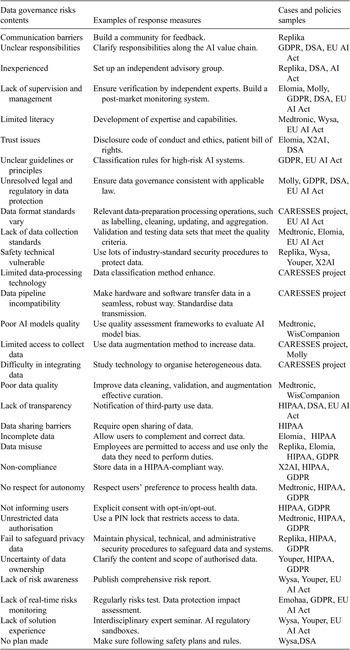
The response measures were analysed based on the cases and policies; part of them is shown in Table 5 (the whole content of the table can be accessed online). Facing the 31 kinds of risks, response measures focus on compliance with data policies, promotion of AI rules, formulation of privacy policies, and optimisation of algorithms/models/methods. For instance, ensure data governance is consistent with applicable law, classification rules for high-risk AI systems, and data classification methods are enhanced. The examples in Table 5 come from the sample of cases and policies collected.
Examples of responses to risks in different data governance categories
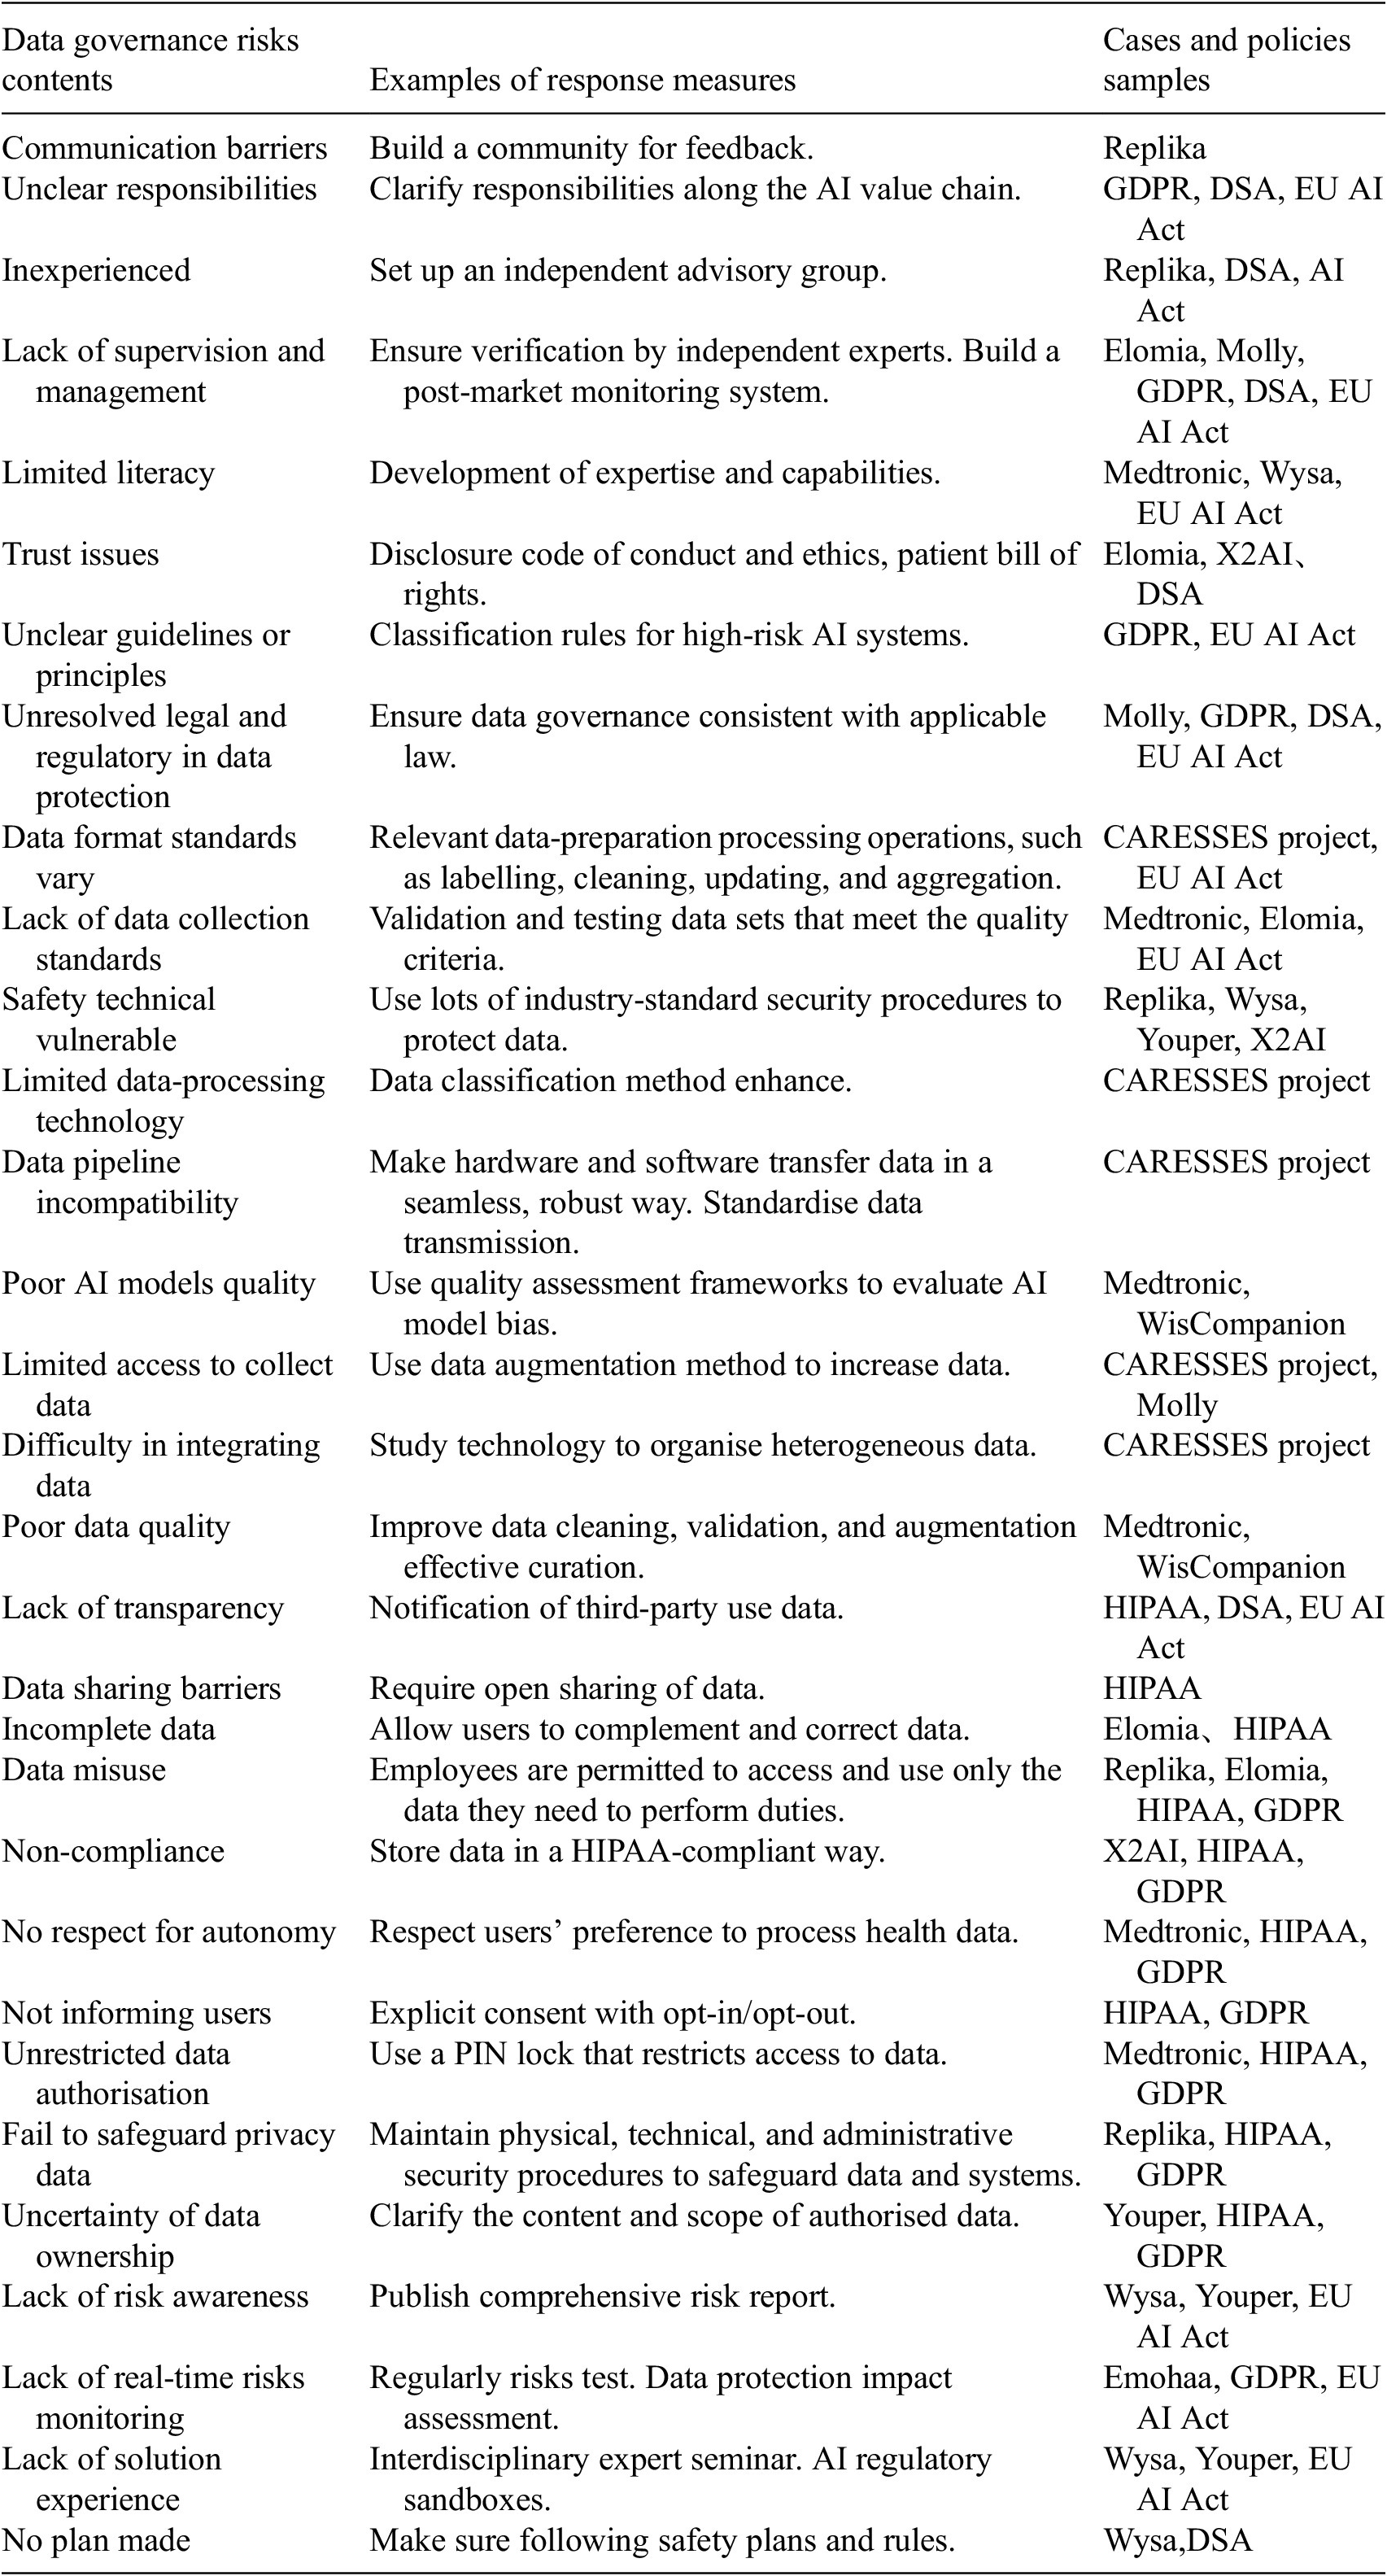
Table 5. Long description
The table consists of three columns.
* Communication barriers: Build a community for feedback. Cases: Replika.
* Unclear responsibilities: Clarify responsibilities along the A I value chain. Policies: G D P R, D S A, E U A I Act.
* Inexperienced: Set up an independent advisory group. Cases: Replika, D S A, A I Act.
* Lack of supervision and management: Ensure verification by independent experts and build post-market monitoring. Cases: Elomia, Molly, G D P R, D S A, E U A I Act.
* Limited literacy: Development of expertise and capabilities. Cases: Medtronic, Wysa, E U A I Act.
* Trust issues: Disclosure code of conduct and ethics, patient bill of rights. Cases: Elomia, X 2 A I, D S A.
* Unclear guidelines or principles: Classification rules for high-risk A I systems. Policies: G D P R, E U A I Act.
* Unresolved legal and regulatory in data protection: Ensure data governance consistent with applicable law. Cases: Molly, G D P R, D S A, E U A I Act.
* Data format standards vary: Data-preparation processing like labelling, cleaning, and aggregation. Cases: C A R E S S E S project, E U A I Act.
* Lack of data collection standards: Validation and testing data sets meeting quality criteria. Cases: Medtronic, Elomia, E U A I Act.
* Safety technical vulnerable: Use industry-standard security procedures. Cases: Replika, Wysa, Youper, X 2 A I.
* Limited data-processing technology: Data classification method enhance. Cases: C A R E S S E S project.
* Data pipeline incompatibility: Standardise data transmission for seamless hardware/software transfer. Cases: C A R E S S E S project.
* Poor A I models quality: Use quality assessment frameworks to evaluate bias. Cases: Medtronic, WisCompanion.
* Limited access to collect data: Use data augmentation methods. Cases: C A R E S S E S project, Molly.
* Difficulty in integrating data: Study technology to organise heterogeneous data. Cases: C A R E S S E S project.
* Poor data quality: Improve cleaning, validation, and curation. Cases: Medtronic, WisCompanion.
* Lack of transparency: Notification of third-party use data. Policies: H I P A A, D S A, E U A I Act.
* Data sharing barriers: Require open sharing of data. Policies: H I P A A.
* Incomplete data: Allow users to complement and correct data. Cases: Elomia, H I P A A.
* Data misuse: Limit employee access to necessary duties. Cases: Replika, Elomia, H I P A A, G D P R.
* Non-compliance: Store data in a H I P A A-compliant way. Cases: X 2 A I, H I P A A, G D P R.
* No respect for autonomy: Respect users preference to process health data. Cases: Medtronic, H I P A A, G D P R.
* Not informing users: Explicit consent with opt-in or opt-out. Policies: H I P A A, G D P R.
* Unrestricted data authorisation: Use a P I N lock to restrict access. Cases: Medtronic, H I P A A, G D P R.
* Fail to safeguard privacy data: Maintain physical, technical, and administrative security. Cases: Replika, H I P A A, G D P R.
* Uncertainty of data ownership: Clarify content and scope of authorised data. Cases: Youper, H I P A A, G D P R.
* Lack of risk awareness: Publish comprehensive risk report. Cases: Wysa, Youper, E U A I Act.
* Lack of real-time risks monitoring: Regular risks test and data protection impact assessment. Cases: Emohaa, G D P R, E U A I Act.
* Lack of solution experience: Interdisciplinary expert seminars and A I regulatory sandboxes. Cases: Wysa, Youper, E U A I Act.
* No plan made: Ensure following safety plans and rules. Cases: Wysa, D S A.
4. Discussion
This study provides a comprehensive overview of human–AI interaction in personal health management, exploring its various application forms, data types, governance practices, risks, and corresponding measures. The findings contribute to a deeper understanding of how AI is integrated into health management services, what kinds of data are generated, how these data are governed, what challenges arise in practice, and how to address them.
Results show that human–AI interaction is widely embedded in personal health apps through conversational tools, sensor-based monitoring, and AI-driven decision support. These systems operate across various scenarios, including health monitoring, intervention and coaching, chronic disease management, mental health management, and elderly care. The service contents contain health monitoring, care and support, disease management, lifestyle coaching, mental health promotion, and weight management. AI technologies applied include ML, NLP, rule-based algorithms and models, and other assistive technologies. The forms of human–AI interaction include conversational and instrumental, whose interactions are in the form of chatting with the AI or using the AI as a tool, respectively. In doing so, they generate a broad spectrum of data—from physiological indicators and behavioural patterns to emotional cues and digital interaction traces. Unlike traditional clinical records, these data are often collected passively, generated continuously, and highly personalised, making it difficult to classify and regulate using conventional health data frameworks (Brückner et al., Reference Brückner, Sadare, Fesl, Scheibe, Lang and Gilbert2025).
As shown in this study, data governance practice covers six categories: governance subjects, policies, standards and principles, technologies and facilities, lifecycle measures, data rights protection, and risk management. However, these practices remain uneven and fragmented. For example, while China emphasises national security and data infrastructure, the EU foregrounds privacy rights and ethical AI, and the US leans toward market-driven flexibility, industry data autonomy, and innovation support. Such divergence complicates compliance for global platforms and contributes to regulatory uncertainty, especially around algorithmic decision-making, cross-border data transfers, and secondary use of non-traditional health data. For instance, AI models in healthcare often function as opaque “black boxes,” challenging regulators and users alike in assessing fairness, accountability, and responsibility (Stahl, Reference Stahl2023; Ghassemi et al., Reference Ghassemi, Oakden-Rayner and Beam2024). Moreover, the secondary use of PGHD raises complex issues related to data ownership, consent, and control—especially when such data do not clearly fall under existing legal categories like “clinical data” or “sensitive health information” (Lehmann and Hummel, Reference Lehmann and Hummel2023; Brückner et al., Reference Brückner, Sadare, Fesl, Scheibe, Lang and Gilbert2025). While some service providers employ technical safeguards, such as anonymisation or rule-based consent systems (Shabani and Marelli, Reference Shabani and Marelli2022), these often fall short of addressing risks like data misuse, discrimination, or erosion of user trust. Moreover, rule-based systems may lack the adaptability required to handle real-time, dialogue-based interactions where user intent and context shift dynamically.
This shift from static, predefined data-processing models to continuous, context-dependent human–AI interactions creates new governance challenges. Key risks include unclear ethical guidelines, inconsistent data standards, low data quality, weak processing practices, privacy breaches, and data misuse. These issues are especially prominent in human–AI interaction scenarios, where data are generated continuously, across contexts, and in formats that are difficult to standardise or validate. For example, conversational data collected by a mental health chatbot may contain highly sensitive information but lack the structured metadata required for secure storage or responsible reuse.
In response, existing governance often emphasises data policies compliance, privacy protection, and optimisation of AI technologies to reduce misuse or bias. These measures reflect the efforts of service providers to meet current regulatory requirements and align with policy recommendations (CAC, 2021; European Commission, 2022). However, they tend to be reactive, narrowly scoped, and not fully adapted to the interactive, multimodal, and context-sensitive nature of human–AI interaction data. Their applicability and operability remain limited, especially in non-clinical environments where user roles, data purposes, and risk profiles shift dynamically.
This study suggests the need for AI systems that are not only functionally advanced but also governance-aware. This means embedding risk assessments and transparency mechanisms directly into system design, ensuring that users understand how their data are used, and building accountability pathways that extend beyond formal compliance. It also means rethinking who controls non-traditional data generated through interaction—data that may not fall under existing health privacy regulations, yet can reveal sensitive health-related insights. To move forward, data governance in this space must shift toward lifespan-aware, context-sensitive, and participatory models, integrating user agency, explainability, and adaptive safeguards into the AI design lifecycle. This requires coordination across regulators, developers, and users to build more responsive, human-centred governance infrastructures.
This study offers both theoretical and practical contributions. Theoretically, it deepens the understanding of data governance in human–AI interaction contexts by identifying the distinct types of interaction-generated data and proposing a multidimensional framework for analysing related risks and governance mechanisms. This advances existing literature that has largely focused on technical design or clinical AI systems. Practically, the findings highlight governance considerations that require greater attention in real-world implementation—such as context-sensitive consent, dynamic risk assessment, and stronger safeguards for continuously generated personal health data. These insights support policymakers in refining regulatory mechanisms, guide platform providers and developers in improving system design and data-handling practices, and help healthcare organisations strengthen internal governance procedures.
5. Conclusion
This study systematically examined the literature on human–AI interaction in personal health management, focusing on service functions, interaction-generated data types, governance practices, and associated risks. The findings show that AI technologies are increasingly embedded in consumer-oriented health applications for monitoring, assessment, and personalised guidance. These applications generate continuous and sensitive interaction data, including spanning identity, behaviour, and health information, that introduce substantial governance challenges. To address these challenges, the study offers a set of recommendations that underscore the need for coordinated governance across policy compliance, technical safeguards, and rights-based protections. The findings provide actionable insights for multiple stakeholder groups. Policymakers and regulators may draw on the results to strengthen risk-responsive regulatory mechanisms and promote cross-institutional and cross-jurisdictional cooperation. Developers and platform providers can use the findings to enhance context-sensitive consent processes, improve system transparency, and design more robust data protection measures. Healthcare organisations and service operators may apply these insights to build institutional capacity, refine governance procedures, and strengthen trust-building practices with users. Collectively, these contributions support more collaborative and trustworthy governance of human–AI interaction data. This study has limitations, particularly the reliance on secondary data sources such as published research, policy documents, and online materials, which may not fully capture the dynamics of real-world implementation. Future research could employ empirical methods, including interviews, surveys, and controlled user interaction studies, to validate and refine the proposed framework. Such approaches would enable a more granular and evidence-based understanding of governance risk factors in human–AI interaction and support the development of more targeted governance strategies.
Data availability statement
All policy samples and the whole table of responses to risks in different data governance categories can be accessed online: https://doi.org/10.5281/zenodo.20482552
Author contribution
Conceptualisation: L.X; K.P. Methodology: L.X; K.P. Data curation: L.X; K.P. Data visualisation: L.X.; Writing original draft: L.X.; Writing—review and editing: L.X; K.P. All authors approved the final submitted draft.
Competing interests
None.

 Open access


Comments
No Comments have been published for this article.