


Food insecurity is a major public health concern in the USA, with 11·1 % of households having limited access at all times to enough food for an active and healthy life in 2018(Reference Coleman-Jensen, Rabbitt and Gregory1). Emergency food pantries represent an important resource that aims to alleviate food insecurity in the USA. These private, charitable organisations distribute unprepared food and beverages at no cost and with minimal eligibility requirements to those in need.
Food pantry participants prevalently experience food insecurity, with recent estimates suggesting that 65·5 % of food pantry participants are food insecure(Reference Coleman-Jensen, Rabbitt and Gregory2). Furthermore, those using food pantries are disparately affected by negative diet-related health outcomes, including higher prevalence of hypertension, high cholesterol, diabetes and stroke compared with the general US adult population(Reference Liu, Zhang and Remley3). Diet is a primary risk factor for chronic disease; dietary quality and, in particular, the intake of key under-consumed nutrients, are low among food pantry participants(Reference Liu, Zhang and Remley3–6). These dietary constraints are hypothesised to contribute to the relatively higher rates of diet-related chronic disease in the food pantry population compared with the general US population(Reference Seligman, Laraia and Kushel7,Reference Seligman and Schillinger8) . Overall, dietary quality of food pantry participants is low, as measured by the Healthy Eating Index (HEI), scoring 42·8 points out of 100(Reference Duffy, Zizza and Jacoby9), compared with the USA average of 59 points(10). Given that pantry resources may provide up to an estimated 25 % of monthly dietary intake among those who use them(Reference Verpy, Smith and Reicks11) and that both food-secure (FS) and food-insecure pantry participants are increasingly reliant on food pantry resources as a long-term food source(Reference Lowe, Poubelle and Thomas12), the mix of foods supplied from food pantries has the potential to make a healthful contribution to pantry participants’ diets over time and may be especially impactful to this group.
Approximately three-quarters of the food available in food pantries are composed of charitable donations made by faith-based organisations and excess food from large supermarkets, local shops and farms(Reference Mabli, Cohen and Potter13). The US government supplements these donations through The Emergency Food Assistance Program (TEFAP), accounting for approximately 25 % of the food in pantry inventories(14). Previous investigation has identified that the foods supplied through TEFAP are of very high dietary quality(Reference Zimmerman, Sun and Dixit-Joshi15); however, little is known about the quality of the remaining three-quarters of food items stocked in pantry inventories or, more importantly, the quality of the foods that pantry participants consume originating from the pantry. A small body of research suggests that food pantry inventories in the USA, Canada and Australia supply limited amounts of perishable items, for example, fruit, vegetables and low-fat dairy products, and often supply nutrients in amounts that do not meet estimated requirements, for example, for vitamins A and C, Zn and Ca(Reference Bazerghi, McKay and Dunn16–Reference Simmet, Depa and Tinnemann18). Furthermore, the potential for high availability of certain shelf-stable items (e.g. packet soup, ready-to-use sauces, canned foods, etc.) compared with fresh produce may contribute to high dietary intake of Na. Evidence of low overall food pantry participants’ dietary quality yet high-quality TEFAP contributions presents the question as to where nutrients in the diets of food pantry participants originate. Food pantry participants may obtain food from a variety of sources outside of the pantry environment, including supermarkets, convenience stores, restaurants, fast-food restaurants, etc. Yet, the types of food and subsequently the nutrients obtained from these various sources remain largely unknown. Determining the relative intake of certain nutrients and food groups from food pantries compared with other common sources in pantry participants’ diets will identify sources of food where the nutrient profile may be improved to more closely align with the estimated requirements for population groups.
The aim of this study is to determine and compare the mean intakes of food groups (vegetables, fruit, grains, dairy products and oils), nutrients of public health concern (Ca, K, vitamin D and dietary fibre), the nutrients described as being over-consumed (Na, saturated fat and added sugars) by the general population in the 2015 Dietary Guidelines for Americans(6) from food pantries and other common food sources in the diets of adult rural food pantry participants, compared with the Dietary Reference Intake (DRI) values(19), or Dietary Guidelines for Americans recommendations(14) when a DRI value is not available. A secondary aim is to examine whether household food security status interacts with nutrient and food group intake from each source. Pantry foods are expected to contribute significantly to the intake of Na, grains, added sugar, saturated fat and oils, and to be lacking in Ca, vitamin D, potassium, fibre, vegetables, fruit, dairy products and total protein foods compared with other sources. Household food security status is hypothesised to interact with these associations, indicating differential nutritional benefits gained from food sources by FS, low FS (LFS) and very low FS (VLFS) participants.
Methods
Study design
Data used in this cross-sectional, secondary analysis were drawn from the baseline information collected in the USA. Department of Agriculture funded intervention study: Voices for Food. A detailed description of the VFF methodology is available elsewhere(Reference Bazerghi, McKay and Dunn16). Briefly, the study included Midwestern rural communities with high levels of poverty across Indiana, Michigan, Missouri, Nebraska, Ohio and South Dakota and aimed to promote food security by supporting food policy councils in assisting food pantries to enhance the nutritional quality and variety of foods available to participants. This research was conducted according to the Declaration of Helsinki and was approved by the South Dakota State University Human Subjects Committee prior to the commencement of the study. All participants gave informed consent before completing the study.
Participants
In each of the six participating states, participants were recruited from four pantries in rural communities. A convenience sample of adult participants were recruited between August and November in 2014 using flyers posted in each pantry and by research staff approaching participants. Participants who could read and speak English, had visited the pantry at least once in the previous 12 months prior to the day of data collection and were at least 18 years old (or ≥19 years old in Nebraska) were recruited. Participants were eligible to receive up to $30 in the form of grocery store gift cards, if all surveys and interviews were completed. A total of 613 eligible participants were confirmed eligible and recruited; however, because of incomplete dietary and food insecurity data, only 590 participants (96 %) were included in this analysis.
Survey instrument and dietary assessment
Participants were either interviewed at their participating food pantry by trained interviewers or self-completed interviews. Electronic or paper questionnaires queried information on sociodemographic characteristics and pantry visitation. This information was categorised for analysis as follows: age (18–44, 45–64 and ≥65 years), sex (male and female), race (White, Black, Other that includes American Indian, Asian, Hawaiian, any combination of races and other races), state (Indiana, Michigan, Missouri, Nebraska, Ohio and South Dakota), highest education level (≤high school graduate or equivalent and ≥some college/trade school), employment status (employed for ≥6 months of the past year and employed for <6 months of the past year); annual household income (<$10 000, $10 000–15 000 and >$15 000), number of household members (1, 2 and ≥3), number of visits to the recruitment pantry during the past year (<5 times and ≥5 times), number of different pantries visited during the past year (1 and >1) and participation in any of the following food assistance programmes (participating in at least one programme, participating in 0 programmes) such as the Supplemental Nutrition Assistance Program, Meals on Wheels, soup kitchens, the Special Supplemental Nutrition Program for Women, Infants, and Children, and free or reduced-price school or summer programme meals.
The eighteen-item US Household Food Security Survey Module(20) was administered during the interview to classify household food security status during the past 12 months. The number of affirmative responses to survey questions was summed, and household food security was categorised as FS (zero to two affirmative responses), LFS (three to seven), or VLFS (eight to eighteen), as previously directed(20).
Participants completed the 2014 version of the Automated Self-Administered 24-Hour Recall, an Internet-based dietary recall developed by the National Cancer Institute(Reference Subar, Kirkpatrick and Mittl21), with optional assistance from trained interviewers at the food pantry on the day of recruitment. The researchers worked with the Automated Self-Administered 24-Hour Recall team to modify the food source code to enable respondents to include ‘food pantry’ as a source option for each food, along with various other choices. The food source variable was grouped into four discrete categories for analysis, as follows: 1 = Food pantry; 2 = Supermarket (includes supermarket and grocery store); 3 = Other stores and restaurants (includes convenience store, and store of any other type, vending machine, street vendor or vending truck, restaurant, bar, or tavern, and fast food or drive-through restaurant); 4 = Other (includes other, not applicable, do not know, child care centre, day care, or camp, grown or caught by you or someone you know, produce stand, farmer’s market, orchard, community-supported agriculture organisation, school cafeteria, other cafeteria, residential dining facility or adult day care centre, shelter, soup kitchen, and sport, recreation or entertainment event).
All foods and beverages reported in the Automated Self-Administered 24-Hour Recall were automatically assigned a unique food code and linked to the Food and Nutrient Database for Dietary Studies(22) 2013–2014 and Food Patterns Equivalent Database(23) 2013–2014 to derive the total nutrient, food group and energy content of each item reportedly consumed. An individual was counted as reporting a food source if they had consumed at least one food from the source, but were not counted multiple times for consuming more than one food from that source. Participants were counted in multiple sources if they reported foods from more than one source. Nutrients and food groups of interest were assigned to the source from which they originated and included those outlined as ‘nutrients of public health concern’ in the 2015 DGA(6), including Ca (mg), K (mg), vitamin D (μg), dietary fibre (g), as well as nutrients that are described as being over-consumed by the general population, including Na (mg), saturated fat (g) and added sugars (g); and food groups including vegetables, fruits, grains, dairy products and total protein foods were also included. Reference values against which nutrients were compared were the DRI(19), which was the estimated average requirement where available or the adequate intake. Where a DRI value was not available, the 2015 DGA(6) recommendations were used instead.
Statistical analysis
All statistical analyses were performed using SAS® software version 9.4 (SAS Institute Inc.)(24). Statistical significance was determined at a P value of <0·05. Participant characteristics were compared across the three levels of household food security status using χ 2 or Fisher’s exact tests. The total number and proportion of participants obtaining food from each source and the total number and proportion of food items obtained from each source per participant were calculated.
The total amount of food groups, nutrients and percentage total energy intake (%TEI) from saturated fat and added sugars from each source was calculated for each participant. Mean and standard deviation were reported for intakes from each food source category. Food group and nutrient intake exhibited a substantial proportion of zero values and outliers with a highly positively skewed distribution. Thus, data were replaced by ranks, which indicate the relative position of the true intake value and normalise the data for analysis. Subsequently, the least square means of the ranked values were calculated and compared by multiple one-way ANCOVA with Bonferroni adjustment for multiple comparisons, to determine differences across source categories. Models for the five food groups, Ca, vitamin D, dietary fibre, K and Na were adjusted for total energy intake, age, sex, household, income and state. Models for %TEI from added sugars and saturated fat were adjusted for the same confounders except for total energy intake. Previous studies have not quantified dietary component contributions from food pantries; however, using the information in a previous study(Reference Spees, Clark and Hooker25) where differences in the contributions to dietary quality of approximately ten HEI points, equating to meaningful differences in health outcomes(Reference Kirkpatrick, Reedy and Krebs-Smith26), were determined among food outlets, the authors of this study expected significant differences in mean nutrient intakes among food outlets using power at 80 % and significance level at 0·05 for sixty participants. Thus, the study (n 590) was expected to be sufficient to detect significant differences among food outlets.
To test the interaction between household food security status and food source categories, the multiple two-way ANCOVA was used with Tukey–Kramer adjustment for multiple comparisons. As above, data were transformed using ranked values before analysis. Covariates adjustment for vegetables and Na models included total energy intake, age, sex, household, state and food assistance participation. The model for %TEI from saturated fat was adjusted for the same confounders except for total energy intake.
Results
The majority of participants were food insecure (82 %), including 34 % living in LFS households and 48 % living in VLFS households, while 19 % of participants were living in FS households (Table 1). Participants were predominantly white (79 %), females (71 %), between the ages of 18 and 64 years (80 %), employed for <6 months of the previous year (77 %), had a highest education level of ‘high school graduate or equivalent’ or less (67 %) and participated in at least one food assistance programme (95 %, Table 1).
Characteristics of adult rural food pantry participants by household food security status*
(Numbers and percentages)
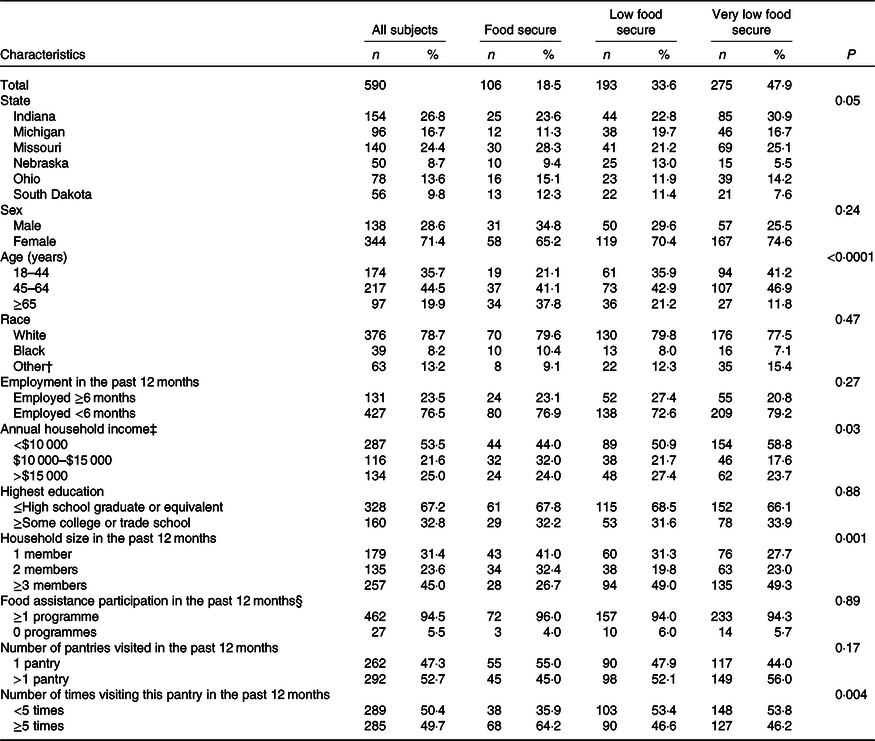
* Totals may not add up to total participants due to missing values. To determine differences between categorical variables, χ 2 tests were used. Fisher’s exact test was reported for race and food assistance participation due to small sample size in subgroups. Statistical significance level was set at P < 0·05.
† Other includes American Indian, Asian, Hawaiian, Hispanic or Latino or Spanish origin, and any combination of races. These responses were collapsed into one category because of the small sample size.
‡ Self-reported combined income of all household members during the past 12 months.
§ Food assistance programmes include the Supplemental Nutrition Assistance Program, Meals on Wheels, The Special Supplemental Nutrition Program for Women, Infants, and Children, Soup kitchens, free or reduced-price school or summer meal programmes.
When stratified by household food security status, significant differences were observed for state, age, annual household income, household size and number of times the participant visited their recruitment pantry over the course of the previous 12 months (Table 1). A higher proportion of VLFS participants (41 %) were between 18 and 44 years of age compared with FS (21 %) and LFS (36 %) participants (Table 1). A lower proportion of FS (27 %) participants reported having ≥3 members in the household, compared with LFS (49 %) and VLFS (49 %) participants (Table 1). A greater proportion of FS (64 %) participants reported visiting their recruitment pantry ≥5 times in the previous 12 months, compared with LFS (47 %) and VLFS (46 %) participants (Table 1). A lower proportion of FS participants (44 %) reported an annual household income <$10 000 compared with LFS (51 %) and VLFS (59 %) participants (Table 1).
Supermarket or grocery store was the most commonly reported source of food by participants, with 87 % of participants consuming at least one food item from this source (Table 2). On average, 60 % of participants’ dietary intake was sourced from a supermarket or grocery store (Table 2). Of participants, 46 % reported consuming one or more items from a food pantry, and 40 % of participants’ dietary intake came from a food pantry (Table 2). About 36 % of participants reported consuming at least one food item from other stores and restaurants; and participants had 35 % mean percentage of food items coming from this source (Table 2). About 57 % of participants reported foods from other sources, and the mean percentage of food items from this source was 31 % (Table 2).
Total number and proportion of food items consumed per individual, and number and proportion of participants consuming food from each source among adult rural food pantry participants
(Mean values and standard deviations; numbers and percentages)
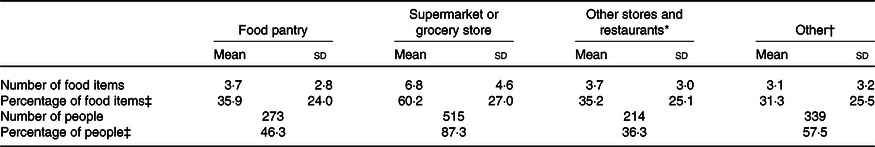
* Other stores and restaurants includes convenience store, other store (any type), vending machine, street vendor or vending truck, restaurant, bar, or tavern, and fast food or drive-through restaurant.
† Other includes other, not applicable, do not know, child care centre, day care, or camp, grown or caught by you or someone you know, produce stand, farmer’s market, orchard, or community-supported agriculture organisation, school cafeteria, other cafeteria, residential dining facility or adult day care centre, shelter, soup kitchen, sport, recreation or entertainment event.
‡ Proportions may add up to greater than 100 % as participants can be represented in more than one source and not every participant consumed foods from all four sources.
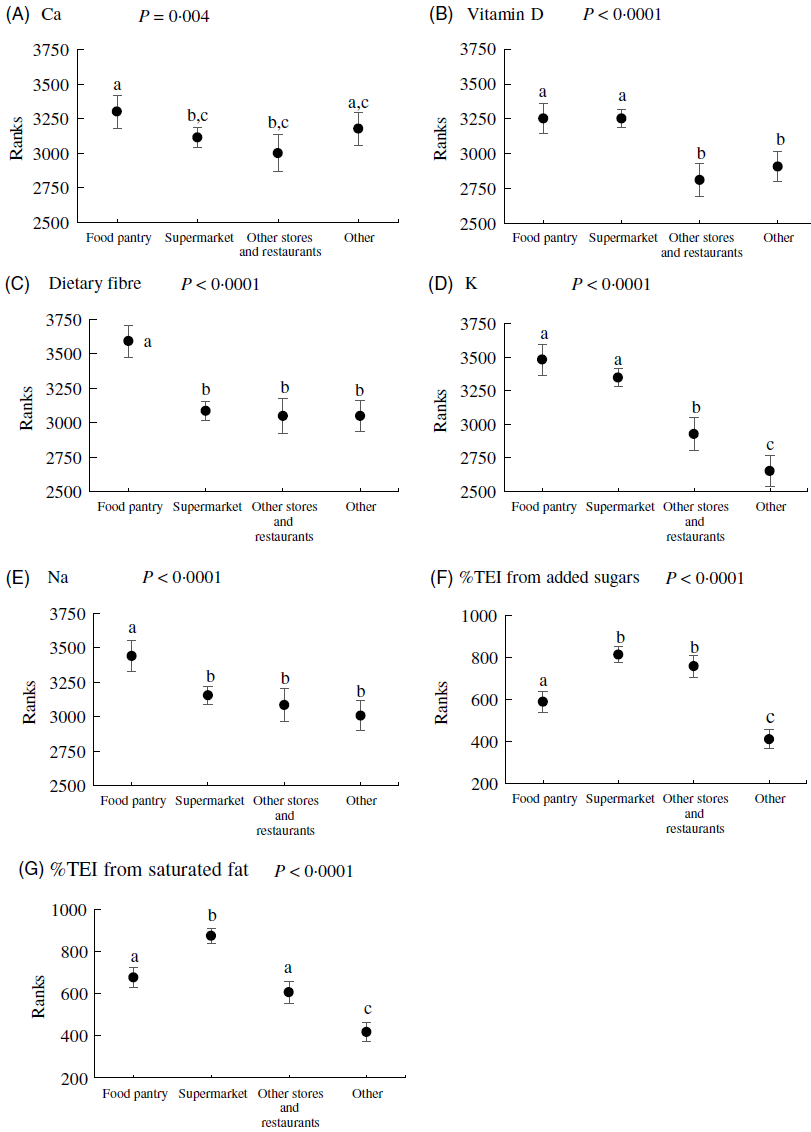
Mean nutrient intakes indicated low intake of key nutrients (Ca, vitamin D, dietary fibre and K) compared with DRI (Table 3). The %TEI from added sugar exceeds the DGA’s recommendation of 10 % (Table 3). Multiple one-way ANCOVA revealed overall significant difference across food source categories for Ca, vitamin D, dietary fibre, K, Na, %TEI from added sugars, and %TEI from saturated fat (Fig. 1). Specifically, dietary fibre intake from food pantries was the highest among all food sources (Fig. 1). Ca intake was significantly higher from the food pantry compared with supermarket and other stores and restaurants (Fig. 1). K and vitamin D intakes sourced from both the food pantry and supermarket were significantly higher than other stores and restaurants or other sources. Among nutrients of public health concerns, Na intake from food pantries was significantly higher compared with all the other food sources; %TEI from added sugars from supermarket and other sources and restaurants was significantly higher than from food pantries or other sources; and %TEI from saturated fat from supermarkets was significantly higher compared with all the other food sources (Fig. 1). Overall, the intake of most nutrients was lower from other stores and restaurants and other sources compared with the food pantry and supermarket.
Nutrient and food group intake from food source categories among adult rural food pantry participants* (Mean values and standard deviations)
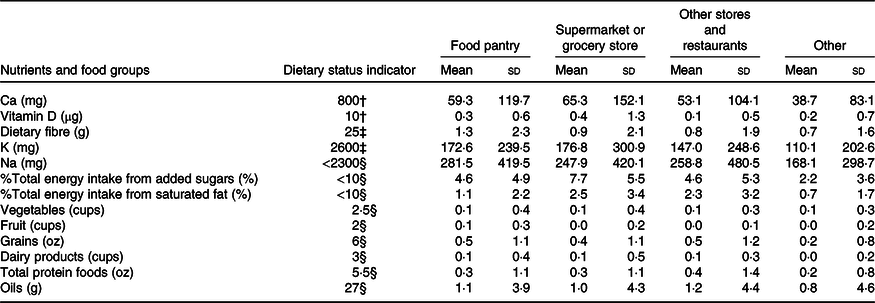
* Food source categories were classified as: food pantry, supermarket, other stores and restaurants (including convenience store, any other type of stores, vending machine, street vendor or vending truck, restaurant, bar, tavern, fast food or drive-through restaurant) and other (including other, not applicable, do not know, child care centre, day care, camp, grown or caught by you or someone you know, school or other cafeteria, produce stand, farmer’s market, orchard, community supported agriculture organisation, residential dining facility, adult day care centre, shelter, soup kitchen, sport, recreation or entertainment event). Vegetables excluded legumes and included dark green, red, and orange vegetables, tomatoes and tomato products, other red and orange vegetables (excluding tomatoes), total starchy vegetables, and all other vegetables. Fruit included whole fruit and fruit juices. Grains included whole grains and refined grains. Dairy products included total milk, milk products (includes Ca-fortified soya milk), yogurt, cheese and whey. Total protein foods included meat, poultry, seafood, eggs, soya, nuts and seeds (excluded legumes). Oils included fats naturally present in nuts, seeds, seafood, and vegetables sources, except palm, coconut and hydrogenated oils.
† Estimated Average Requirement. The reference group selected was women, aged 31–50 years, as this best represents the demographics of the study sample.
‡ Adequate Intake. The reference group selected was women, aged 31–50 years, as this best represents the demographics of the study sample.
§ The Dietary Guidelines for Americans (DGA) recommendation for Na was selected instead of the adequate intake (1500 mg), as it is a more realistic expectation for the general population intake. The DGA recommends limiting saturated fat and added sugars consumption to <10 % of total energy intake. The DGA also recommends consuming 2·5 cups/d of vegetables, 2 cups/d of fruits, 6 oz/d of total grains, 3 cups/d of dairy, 5·5 oz/d of total protein foods and 27 g/d of oils for a healthy USA-style eating pattern at the 2000 kcal (8368 kJ) energy level.
Nutrient intake by food sources in a sample of rural Midwestern food pantry participants (n 590). Values shown are rank means and 95 % confidence intervals. Nutrient data were replaced with ranks and then analysed using multiple one-way ANCOVA using food source categories as the independent variable. Models for calcium, vitamin D, dietary fibre, potassium and sodium were adjusted for total energy intake, age, sex, household, income and state. Models for percentage total energy intake (%TEI) from added sugars and saturated fat were adjusted for the same confounders except for total energy intake. Statistical significance was determined at the level of P < 0·05. The Bonferroni method was used to adjust for multiple comparisons. a,b,c Mean values with unlike letters were significantly different across groups. Food source categories were classified as: food pantry, supermarket, other stores and restaurants (including convenience store, any other type of stores, vending machine, street vendor or vending truck, restaurant, bar, tavern, fast food or drive-through restaurant) and other (including other, not applicable, do not know, child care centre, day care, camp, grown or caught by you or someone you know, school or other cafeteria, produce stand, farmer’s market, orchard, community supported agriculture organisation, residential dining facility, adult day care centre, shelter, soup kitchen, sport, recreation or entertainment event).
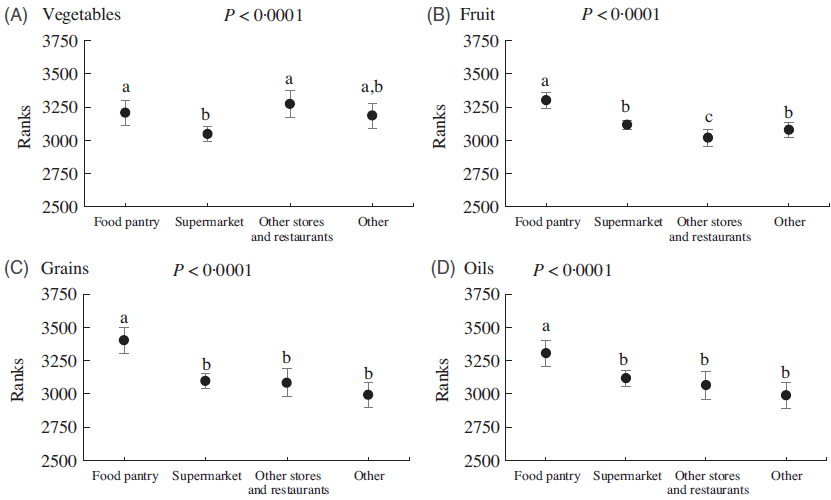
Mean food group intakes were much lower compared with the DGA’s recommendation (Table 3). Multiple one-way ANCOVA revealed overall significant difference across food source categories for vegetables, fruit, grains and oils (Fig. 2). Specifically, fruit, grains and oil intake from food pantries was the highest among all food sources (Fig. 2). Vegetable intake was significantly higher from the food pantry and other stores/restaurants compared with supermarket (Fig. 2).
Food group intake by food sources in a sample of rural Midwestern food pantry participants (n 590). Values shown are rank means and 95 % confidence intervals. Food group intake data were replaced with ranks and then analysed using multiple one-way ANCOVA using food source categories as the independent variable. The main effect of food source was only significant for vegetables, fruit, grains and oils. Models were adjusted for total energy intake, age, sex, household, income and state. Statistical significance was determined at a level of P < 0·05. The Bonferroni method was used to adjust for multiple comparisons. a,b,c Mean values with unlike letters were significantly different across groups. Vegetables excluded legumes and included dark green, red, and orange vegetables, tomatoes and tomato products, other red and orange vegetables (excluding tomatoes), total starchy vegetables, and all other vegetables. Fruit included whole fruit and fruit juices. Grains included whole grains and refined grains. Oils included fats naturally present in nuts, seeds, seafood, and vegetables sources, except palm, coconut and hydrogenated oils. Food source categories were classified as: food pantry, supermarket, other stores and restaurants (including convenience store, any other type of stores, vending machine, street vendor or vending truck, restaurant, bar, tavern, fast food or drive-through restaurant) and other (including other, not applicable, do not know, child care centre, day care, camp, grown or caught by you or someone you know, school or other cafeteria, produce stand, farmer’s market, orchard, community supported agriculture organisation, residential dining facility, adult day care centre, shelter, soup kitchen, sport, recreation or entertainment event).
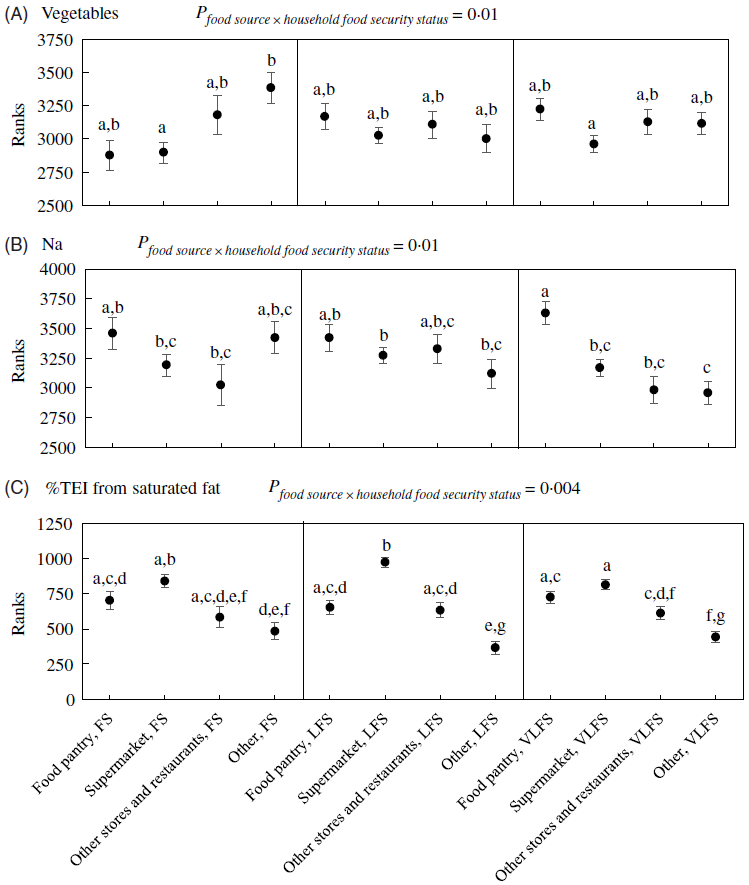
Multiple two-way ANCOVA revealed non-significant interaction effects between food sources and household food security status for most nutrients and food groups. Exceptions to this were observed in the models for vegetables (P = 0·01), Na (P = 0·01) and %TEI from saturated fat (P = 0·004), which displayed significant interaction between food sources and household food security status (Fig. 3). VLFS participants had significantly higher Na intake from the food pantries compared with all the other food sources, while the intake was similar across food sources for FS and LFS participants (Fig. 3). Regarding %TEI from saturated fat, LFS participants had significantly higher intake from supermarkets compared with all the other food sources, while the intake for FS participants was higher from the supermarket when compared with other sources (Fig. 3). For VLFS participants, the %TEI from saturated fat was significantly higher from both the food pantry and supermarket when compared with other sources (Fig. 3). Vegetable intake was similar across food source categories for LFS and VLFS participants (Fig. 3). For FS participants, vegetable intake was significantly higher from other sources compared with supermarkets (Fig. 3).
Vegetable intake, sodium intake and percentage total energy intake (%TEI) from saturated fat by food sources and household food security status in a sample of rural Midwestern food pantry participants (n 590). Values shown are rank means and standard errors. Data were replaced with ranks and then analysed using multiple two-way ANCOVA. Models were structured as nutrient/food group intake = food sources + household food security status + food sources × household food security status + covariates. The interaction term was only significant for vegetables (A), sodium (B) and %TEI from saturated fat (C). Covariate adjustment for the vegetables and sodium models included total energy intake, age, sex, household, state and food assistance participation. The model for %TEI from saturated fat was adjusted for the same covariates except for total energy intake. Statistical significance was determined at the level of P < 0·05. The Tukey–Kramer method was used to adjust for multiple comparisons. a,b,c,d,e,f,g Mean values with unlike letters were significantly different across groups. Vegetables excluded legumes and included dark green, red, and orange vegetables, tomatoes and tomato products, other red and orange vegetables (excluding tomatoes), total starchy vegetables, and all other vegetables. Food source categories were classified as: food pantry, supermarket, other stores and restaurants (including convenience store, any other type of stores, vending machine, street vendor or vending truck, restaurant, bar, tavern, fast food or drive-through restaurant), and other (including other, not applicable, do not know, child care centre, day care, camp, grown or caught by you or someone you know, school or other cafeteria, produce stand, farmer’s market, orchard, community supported agriculture organisation, residential dining facility, adult day care centre, shelter, soup kitchen, sport, recreation or entertainment event). Household food security status was categorised as: FS, household food security; LFS, household low food security; VLFS, household very low food security.
Discussion
To the author’s knowledge, this study represents the first investigation of the nutrient and food group contributions by source and household food security status in food pantry participants’ diets. Contrary to the hypothesis, food pantries appear to be a rich source of Ca, vitamin D, K, dietary fibre and fruit compared with other sources. These results were unexpected and conflict with previous studies that suggested pantry foods provided insufficient nutrients for the number of days intended to last and a low availability of fresh produce relative to shelf-stable items(Reference Simmet, Depa and Tinnemann18), and scored poorly with respect to HEI component scores for Dairy, Whole Grains, Total Fruit and Sodium(Reference Nanney, Grannon and Cureton17). However, approximately 25 % of foods in pantry inventories are supplied through TEFAP(14), and these TEFAP commodities were shown to be of high dietary quality and conform very closely to the DGA recommendations(Reference Zimmerman, Sun and Dixit-Joshi15). Thus, results in the current study point to a potentially heavy reliance of pantry participants on the fruit, vegetables, dairy products and whole grains received from the pantry. While food pantries may provide less fresh produce, they often provide fruit and vegetables through canned alternatives or juices and provide yogurt when available(Reference Simmet, Depa and Tinnemann18). Further, Ca and vitamin D obtained from the pantry may be provided through voluntary fortification of foods supplied to the pantry, such as fortified cereals. Despite potentially being higher in Na or added sugars, pantry foods may represent crucial contributions towards participants’ nutrient requirements.
As low income is common among pantry participants, financial resources may be lacking for purchasing sufficient nutrient-dense foods from sources outside the food pantry. The knowledge of consuming a nutritious diet on a budget may also be limited. Regardless, individuals may be vulnerable to purchasing lower quality foods from convenience stores and fast-food restaurants because of location and time constraints. Research suggests that VLFS individuals are 1·5 times more likely to shop at convenience stores than those with higher food security status, and foods purchased in convenience stores were of the lowest dietary quality of all sources analysed, with a mean HEI score of 40 of 100 points(Reference Spees, Clark and Hooker25). This finding implies that the foods obtained do not align well with the DGA and suggests a diet that is lower in fruit, vegetables, whole grains and low-fat dairy products and higher in empty energy content, saturated fat and Na. Convenience stores may be more present in low-income and rural communities(Reference Larson, Story and Nelson27), and fresh fruit and vegetables available in these stores may be of lower quality and nutritional value(Reference Spees, Clark and Hooker25). Results of our study support this notion, with the mean intakes of fruit, Ca, vitamin D, fibre and K being lower from ‘Other stores and restaurants’ compared with the food pantry and/or supermarket, while providing a significantly higher %TEI from added sugars compared with food pantries and other sources. While these findings indicate that food pantries contribute more to the mean intakes of certain nutrients and food groups compared with the other sources, this does not necessarily translate to participants meeting DRI values or DGA recommendations as shown by the low overall intake. Recent analysis of rural Midwestern food pantry participants identified that regardless of household food security status, participants failed to meet the estimated average requirement or exceed the adequate intake for all under-consumed nutrients of public health concern(Reference Liu, Tooze and Zhang4). Thus, much improvement in the dietary intake is needed in this group for preventing and reducing the risks for diet-related diseases.
In this study, pantry foods contributed a significantly higher mean amount of Na, oils and grains to participants’ diets, compared with all the other sources. This finding is supported by a systematic review that determined a relatively higher availability of foods with long shelf-lives in food pantries and low provision of fresh produce(Reference Simmet, Depa and Tinnemann18). This result is supported by another study that applied the HEI to food items ordered by food pantries from large food banks and identified that the Na component score was among the lowest of all scores(Reference Nanney, Grannon and Cureton17), indicating poor alignment with the DGA Na recommendations.
The %TEI from saturated fat was significantly higher from the supermarket compared with all the other food sources. This finding was unexpected as previous evidence indicates that food consumed outside of the home, especially in fast-food settings and among low-income groups, tends to be associated with higher intakes of saturated fat compared with foods prepared within the home(Reference Powell and Nguyen28). One possible explanation may be related to the very high prevalence of household food insecurity in our sample. A recent cross-sectional study identified that foods and beverage consumed from all stores were of significantly higher dietary quality for HFS compared with all other food security levels(Reference Spees, Clark and Hooker25). This suggests that dietary quality obtained within a source may vary widely based on the ability of the group to afford a healthy diet from that source. Additionally, a previous study has shown that low-income groups consumed a greater amount of saturated fat and Na from minimally processed foods, compared with their higher-income counterparts(Reference Eicher-Miller, Fulgoni and Keast29). Food pantries supply high quantities of meat and protein foods(Reference Simmet, Depa and Tinnemann5,Reference Nanney, Grannon and Cureton17) , which may explain why the food pantry was the second largest contributor to saturated fat intake similar to other stores and restaurants.
Contrary to the secondary hypothesis of this study, household food security status did not have a significant interaction effect with food source on participants’ nutrient intake, with the exception of vegetables, Na and saturated fat. These findings may be partially explained by the differential utilisation of food pantry resources by FS v. food-insecure participants(Reference Kicinski30), such as long term to maintain food security v. short term to cope with emergencies or financial crises. Given the high prevalence of household food insecurity in the present study, it may be expected that many participants are relying on pantry resources on a short-term basis to prevent hunger and thus may be limited to utilising all foods received with less regard for their nutritional quality or effect on long-term health. Furthermore, caregivers in the household, especially mothers, are known to sacrifice quantity and quality in their own diet to alleviate the impact of food insecurity on children(Reference Holben and Marshall31). This may result in parents consuming foods of lower dietary quality and only consuming more nutritious foods once the needs of their children have been met. As almost three-quarters of our sample are women, this point may be particularly salient.
This study raises awareness of the crucial need for nutrition education programmes and practical advice targeted at low-income groups, regarding how to purchase and prepare healthy nutritious meals on a limited budget, to complement the mix of foods received from the food pantry. Interventions targeted at food pantry participants have focused on improving the dietary quality of foods supplied to and obtained from the pantry(Reference Seligman, Lyles and Marshall32–Reference Long, Rowland and McElfish34). However, findings from the present study indicate that pantry foods may, in fact, be contributing greater mean amounts of key nutrients compared with other sources. Though they continue to contribute significantly to problematic nutrients (Na and saturated fat) that are over-consumed by the general population. These findings may help to inform future interventions, nutrition education programmes and strategic changes to improve the availability and choice of nutritious food from the pantry as well as other sources outside the pantry environment. A consideration for limitations or barriers to healthy eating, that extend beyond the acquisition of food items, is essential if changes are to be realistic. Low-income individuals may have limited access to the facilities required to prepare and cook certain meals or may not have the skills, knowledge or time required. Therefore, interventions should be carefully tailored to account for these limitations and provide realistic alternatives where required. Finally, food-based dietary recommendations may be more practical than those based on nutrients. While this study bridges an important gap in the literature by identifying sources from which participants consume nutrients of concern, future research should incorporate a consideration for food groups, to help focus future efforts and intervention projects to improve the dietary quality and nutrient intake of food pantry participants.
A limitation of this study was the need to transform the dietary intake values using ranks. The ranks indicate only the relative position of the true values and relative differences between them; thus translation of the results into absolute differences of intake is not possible. Second, dietary intake was estimated based on a single recall, and this information may not accurately represent long-term usual intake. However, only 40–60 % of participants completed the second and third recalls in the study, and limiting the sample to only those who provided two or three recalls will dramatically reduce the sample size and change the representativeness of the sample. Furthermore, the recall used for analysis was collected on the day of recruitment, while participants were attending the pantry to collect a food bag. This may have resulted in bias in the representation of dietary intake over time, as participants may be visiting the pantry after using most foods from their last visit or as the next allowed visit on a monthly basis. Thus, the foods consumed in the 24-h recall period may not accurately represent average monthly dietary intake and may underestimate the importance of pantry foods because it reflects the dietary intake just before reaching out for more pantry foods or for pantry foods for the first time. Additionally, dietary supplements were not accounted for in the recall, and therefore the dietary intake data did not represent total nutrient intake. Under-reporting in 24-h recalls is common(Reference Murakami and Livingstone35) and may have introduced bias. Last, the generalisability of these results may be limited as they represent only twenty-four food pantries from high-poverty rural counties in Midwestern states at one point in time and the race/ethnic proportions in the other areas may be different. Future studies among additional pantries within this setting and population are needed to confirm these findings.
Conclusions
Food insecurity is a major public health concern and is associated with a plethora of negative health outcomes. As food pantries represent an important form of emergency food assistance, the food and nutrients, they should conform as closely as possible to national dietary guidelines. The present study suggests that food pantries are an essential source of Ca, vitamin D, fibre, K, fruit, grains and oils in participants’ diets and that food pantries are a significant contributor to the total dietary intake compared with other food sources. Future interventions could aim to improve pantry participants’ nutritional knowledge and ability to select healthier choices from other food sources to complement the foods received from the food pantry, as well as introduce pantry-level changes to reduce Na content of pantry foods to improve food security and meet nutrient requirements for a healthy balanced diet.
Acknowledgements
The authors would like to acknowledge Dr John Kearney at the Technological University Dublin, Ireland, for his support, guidance and mentoring in preparing the paper. The authors would also like to acknowledge the Voices for Food Team for acquiring the data used in this study.
The baseline data used for analysis in this project were supported by the USA. Department of Agriculture, National Institute of Food and Agriculture: Voices for Food Grant 2013-69004-20401 and the Hatch Grant IND030489.
Y. L. contributed to formulating the research question and study design, analysed the data, interpreted the data, revised and reviewed the manuscript and approved the final version. N. E. D. formulated the research question, designed the study, analysed the data, interpreted the data, drafted the manuscript, reviewed the manuscript and approved the final version. B. N. W. assisted in acquiring the data, assisted with data analysis, reviewed the manuscript for important intellectual content and approved the final version. R. L. B. reviewed the manuscript for important intellectual content and approved the final version. B. A. C. assisted with study design and statistical analysis, reviewed the manuscript for important intellectual content and approved the final version. T. D. assisted with study design and statistical analysis, reviewed the manuscript for important intellectual content and approved the final version. H. A. E.-M. assisted in acquiring the data, formulated the research question, designed the study, supervised analysis and interpretation of the data, reviewed the manuscript for important intellectual content and approved the final version.
The authors declare that there are no conflicts of interest.


