


Potential Sites of Regulation of Protein Metabolism
Body protein metabolism is regulated at a host of sites from the transcription of particular genes and the up- or down-regulation of particular metabolic pathways, through the stability and selection of particular mRNAs for translation initiation. In addition to the production and selection of particular mRNAs, the process of translation initiation is also extensively regulated both in a general sense and for specific proteins. Once synthesized, body protein can also be regulated by control of the processes of protein degradation. This review will highlight some of the systems which regulate body protein with particular reference to the ability of the amino acid, leucine to act as a control mechanism. Leucine is used as an example to illustrate both specific control points and also to highlight systems of co-ordinated regulation whereby changes in both protein synthesis and protein degradation are altered. The goal of this introduction is to set a context for the papers which follow.
Regulation of Transcription
Transcription of a particular region of DNA into the corresponding mRNA is often regulated by proteins which bind to non-translated regions of DNA and either enhance or repress gene expression. There are currently at least 2000 known human transcription factors providing regulation of specific proteins and the co-ordination of multi-protein pathways(Reference Vaquerizas, Kummerfeld and Teichmann1). For example, expression of some 20 enzymes in the pathway for the synthesis of cholesterol is coordinately regulated by transcription factors known as sterol regulatory element binding proteins. Transcription factors are also important in the co-ordinated regulation of anabolic and catabolic pathways. One example of this, delineated in model systems, is effected by the transcription factor AFT-4 (activating transcription factor 4). Glucocorticoids decrease levels of AFT-4 mRNA and protein resulting in the inhibition of global mRNA translation and protein synthesis, and the activation of genes for protein degradation. Insulin on the other hand increases the levels of AFT-4 mRNA, AFT-4 protein, and AFT-4-dependent mRNAs which counteract the effect of glucocorticoids and result in increased global protein synthesis and inhibited protein catabolism(Reference Malmberg and Adams2).
Alteration in the transcription of DNA also provides the means whereby conditions early in life, such as in utero, can impact on future development. In rats, for example, maternal dietary restriction results in altered β-cell function in the pancreas of the offspring through changes in the expression of genes regulating the early development of these cells(Reference Arantes, Teixeira and Reis3). Human studies also suggest that maternal dietary restriction in the first half of pregnancy predisposes the offspring to metabolic alterations. For example, the cohort study of 300,000 men exposed in utero to the Dutch famine of 1944-45 indicated significantly higher rates of obesity in the offspring at the age of 19(Reference Ravelli, Stein and Susser4).
In addition to affecting offspring development, current research in Sweden is extending the time frame for the effects of diet on development from parent/offspring effects to grandparent/grandchild effects. Kaati and colleagues studied mortality associated with cardiovascular disease and diabetes in relation to dietary intake (derived from historical data on harvests and food prices) of both parents and grandparents. These authors suggest that over-eating by a paternal grandparent prior to the prepubertal growth spurt increases the risk of diabetes in the grandchild (odds ratio 4·1)(Reference Kaati, Bygren and Edvinsson5). Such trans-generational effects suggest alterations in DNA transcription that result from changes in the DNA itself, which are then inheritable. This fascinating area of epigenetics affords a mechanism for adaptation of organisms to environmental changes that is more rapid than conventional natural selection, but epigenetic phenomena have the potential to complicate the study of protein intake on human health.
Regulation of Translation Initiation
One of the first approaches to assessing the initiation of translation was the examination of a shift in ribosomes from free ribosomes to polysomes. An increase in the proportion of ribosomes in polysomes is an indication of an increase in translation initiation. The changes in ribosome distribution occur acutely and are thus an indication of acute changes in the rate of translation initiation and hence protein synthesis. This acute regulation of translation initiation is regulated by covalent modification of initiation factors, usually through phosphorylation of a number of them.
The overall translation initiation pathway, including regulatory initiation factors, is shown schematically in Fig. 1. Initiation begins with the binding of a particular initiating tRNA, a methionyl-tRNA (Met-tRNAi), to the initiation factor, eukaryotic initiation factor 2 (eIF2) with an associated guanosine 5′-triphosphate (GTP). The ability of eIF2 to bind Met-tRNAi is dependent on the presence of the associated GTP so this provides an important regulatory point. The ternary complex then binds with a 40S ribosomal subunit and another complex of initiation factors (eIF4F which includes eIF4G, eIF4A and eIF4E with an associated mRNA) to form a 48S pre-initiation complex. The selection of a particular mRNA by eIF4E is another major point of regulation of translation initiation as is the assembly of the eIF4F complex, which is regulated by the binding of eIF4E to 4E binding protein 1 or 4E-BP1. The pre-initiation complex then binds to a 60S ribosomal subunit to produce an 80S ribosome and the eIF2 –GDP complex is released, as is the eIF4F complex.
Regulation of Translation Initiation.

Regulation of Translation Initiation Mediated by eIF2
Exchange of GTP for GDP on eIF2 is an important part of the overall regulation of translation initiation (Fig. 2). This guanine nucleotide exchange, which is necessary for the reactivation of eIF2, involves the protein eIF-2B. Phosphorylation of eIF2 results in the binding of eIF2 to eIF-2B so that less eIF2-GTP is formed. Thus phosphorylation of eIF2 is an important control point in the regulation of overall rates of protein synthesis. A variety of kinases, generally activated under conditions of stress, are involved in the regulation of translation initiation through phosphorylation of eIF2. These kinases include general control nonderepressible kinase 2 (GCN2), activated by amino acid deprivation; haeme-controlled inhibitor (HBI); double-stranded RNA-dependent kinase or protein kinase RNA-activated (PKR), which is activated by viral infection; and PKR-like endoplasmic reticulum resident kinase (PERK) which is activated by stress in the endoplasmic reticulum. Activation of these kinases results in phosphorylation of eIF2, which enhances the binding to eIF2B and prevents the exchange of GTP for GDP so that translation initiation is down-regulated. This results in the global down-regulation of mRNA translation and suppression of protein synthesis, but can also allow the translation of particular mRNAs at the same time. The ability to maintain translation of particular mRNAs provides the mechanism for co-ordinated responses to stress. For example, with generalized depression of translation initiation due to eIF2 phosphorylation there is preferential translation of the mRNA for AFT-4 which provides for the co-ordinated response of a number of specific genes to facilitate stress reduction(Reference Wek, Jiang and Anthony6).
Regulation of Translation Initiation through elF2.

Regulation of Translation Initiation Mediated by eIF4F
The selection of the mRNA to be translated is facilitated by the protein eIF-4E which binds to the 5′-m7 GTP (7 methyl guanosine cap) cap structure of mRNA (Fig. 3). Another initiation factor, eIF-4G, acts as a scaffolding protein bringing the small ribosomal unit and the mRNA together by binding both eIF4E (with mRNA) and the protein eIF3 which is associated with the 40S ribosomal subunit. The eIF4A is an ATP-dependent helicase important in scanning the mRNA to locate the appropriate start codon.
Regulation of Translation Initiation through elF4.

Regulation of translation initiation and hence protein synthesis through the eIF4F pathway is provided by a family of proteins called 4E-BPs which prevent eIF-4G from binding with eIF-4E thereby inhibiting the binding of mRNA with the 40S ribosomal subunit. The association of 4E-BP and eIF-4E is regulated through phosphorylation. When 4E-BP is phosphorylated it has a reduced affinity for eIF-4E; thus, phosphorylation of 4E-BP is associated with increased availability of eIF-4E and increased association of mRNA with eIF-4E. An important signalling pathway involved in the regulation of 4E-BP phosphorylation is mammalian target of rapamycin complex 1 (mTORC1). Activation of the mTOR pathway results in phosphorylation of 4E-BP which prevents the association of eIF-4E with 4E-BP. By preventing the association of eIF4E with the binding protein, eIF4E is more available for association with eIF-4G and consequently there is increased formation of the active mRNA complex. The mTORC1 also promotes translation initiation by activating the ribosomal protein kinase S6 (S6K).
Leucine-mediated stimulation of the rate of muscle protein synthesis
Understanding the mechanisms by which protein metabolism is regulated provides the potential to enhance the accumulation of body protein through manipulation of the control points. One example of the delineation of the molecular mechanisms in the regulation of protein metabolism has been provided by investigations into the role of leucine in the regulation of protein metabolism. Demonstration of the importance of leucine in the regulation of protein metabolism provides the basis for the potential use of leucine in limiting protein loss in patients with pathological conditions.
Early in vitro studies suggested that amino acids stimulate muscle protein synthesis and inhibit protein degradation in muscle. In particular, branched-chain amino acids, or leucine alone, were sufficient to stimulate protein synthesis(Reference Buse and Reid7–Reference Li and Jefferson9). Attempts to demonstrate the ability of leucine to stimulate muscle protein synthesis in vivo were not always successful(Reference Hagenfeldt, Eriksson and Wahren10, Reference McNurlan, Fern and Garlick11), though a positive effect on nitrogen balance of leucine and/or the keto-acid analogue of leucine was reported(Reference Mitch, Walser and Sapir12–Reference Sherwin14).
However, more recent studies in rats with enteral administration of leucine suggest that oral leucine enhances muscle protein synthesis. Although the initial studies were conducted with a non-physiologically high amount of leucine (1·35 g/kg body weight, an amount equivalent to a total day's intake(Reference Anthony, Anthony and Kimball15)), subsequent studies demonstrated that leucine stimulated muscle protein synthesis in a dose-dependent manner down to much lower levels (Fig. 4, 5 % is 70 mg/kg)(Reference Crozier, Kimball and Emmert16)). The rate of muscle protein synthesis with the 100 % dose was about 43 % higher than the level in overnight fasted animals given a saline gavage, and the rate of muscle protein synthesis in the 10 % group was about 30 % higher than in controls. No changes in eIF2-GTP or in the activity of the exchange protein eIF2B were observed, but co-precipitation experiments demonstrated significant reduction in 4E-BP1 associated with eIF4E even at the lowest dose of leucine. The ability of 4E-BP1 to sequester eIF4E was diminished by hyperphosphorylation of 4E-BP1 with increasing amounts of leucine (Fig. 5). With increased availability of eIF4E there was increased formation of eIF4F (i.e. eIF4A, eIF4E and eIF4G) and enhanced phosphorylation of ribosomal protein S6 kinase (S6K1)(Reference Crozier, Kimball and Emmert16). Since hyperphosphorylation of S6K1 results in the hyperphosphorylation of ribosomal protein S6, activation of S6K1 facilitates an overall increase in the protein synthetic pathway by stimulating the translation of mRNAs encoding for ribosomal proteins and elongation factors (terminal oligopyrimidine tracts at the 5′-end of the message or TOP mRNA). By increasing the translation of TOP mRNAs, leucine enhances the synthesis of proteins involved in mRNA translation.
Leucine-mediated changes in muscle protein synthesis. Sal is saline-treated controls ( ), 5–100 % (
 ) represent oral leucine-treatment with 100% equal to 1.35 g leucine/kg body weight. * denotes significantly different from saline-treated controls, P < 0·05.

Leucine-mediated changes in elF4E-BP1. Sal is saline-treated controls (), 5–100 % () represent oral leucine-treatment with 100 % equal to 1.35 g leucine/kg body weight. * denotes significantly different from saline-treated controls, P < 0·05.

The increase in protein synthesis, the binding of eIF4E to eIF4G, and phosphorylation of S6K1 were all sensitive to rapamyacin(Reference Anthony, Yoshizawa and Anthony17) suggesting that mTOR signaling was a requisite for the stimulation of translation initiation (Fig. 6). Similarly, muscle protein synthesis in the neonatal pig is also sensitive to the provision of leucine(Reference Murgas Torrazza, Suryawan and Gazzaneo18). Comparison of low and high protein meals indicates that protein synthesis is stimulated to a greater extent by higher protein intake and that leucine supplementation of the low protein meals was sufficient to achieve the rate observed with the higher protein intake. Moreover, the stimulation of muscle protein synthesis in the neonatal pig was mediated by phosphorylation of mTOR, 4E-binding protein 1, and ribosomal protein S6 kinase 1, with increased formation of the active eIF4E or eIF4G complex(Reference Murgas Torrazza, Suryawan and Gazzaneo18).
Signaling Pathways Affected by Leucine.

The conclusion that leucine alone is sufficient to stimulate protein synthesis is somewhat complicated by the fact that leucine stimulates the release of insulin (e.g., (Reference Floyd, Fajans and Pek19)) or possibly insulin sensitivity(Reference Garlick and Grant20) which could contribute to the stimulation of protein synthesis observed with the provision of leucine. In the study illustrated in Fig. 3, insulin was significantly elevated at both the 50 % and 100 % levels of leucine. To distinguish the effects of leucine, per se, from the effects of leucine plus elevated insulin on protein synthesis, the ability of leucine to stimulate protein synthesis was investigated in diabetic animals and in the presence of somatostatin which inhibits the release of insulin from the pancreas. In alloxan-treated diabetic rats, with insulin levels of about 25 % of the value in the control (fasted) rat, leucine stimulated muscle protein synthesis, though the effect was smaller than that observed in non-diabetic animals(Reference Anthony, Reiter and Anthony21).
Moreover, the ability of leucine to stimulate muscle protein synthesis was also attenuated in rats treated with somatostatin(Reference Anthony, Lang and Crozier22). In diabetic animals there was no increase in phosphorylation of 4E-BP1 or S6K1despite the increase in protein synthesis, suggesting that leucine stimulates protein synthesis through both an insulin-dependent mechanism, associated with increased phosphorylation of 4E-BP1 and S6K1, and through an insulin-independent mechanism. In somatostatin-treated animals, the ability of oral leucine to increase phosphorylation of 4E-BP1, S6K1 and ribosomal protein S6 was attenuated, but the assembly of eIF4G or eIF4E complex was not affected, suggesting that leucine, without insulin, facilitates the formation of the mRNA cap-binding complex, but that this is not sufficient to stimulate the rates of muscle protein synthesis(Reference Anthony, Lang and Crozier22).
A human study to differentiate responses of muscle tissue to leucine or insulin alone or in combination was performed by Greiwe et al. (Reference Greiwe, Kwon and McDaniel23). Three groups of young, healthy subjects (N = 6) were given leucine intravenously at 1 g/h, sufficient to raise the plasma leucine concentration about threefold above baseline with no demonstrable change in plasma insulin levels, or insulin alone at 40 mU/m2/min which increased plasma insulin concentrations to about 350 pmol/L, or leucine and insulin together which increased insulin concentrations in the plasma further to about 425 pmol/L. Leucine alone increased the levels of S6K phosphorylation about 4-fold with no increase in the level of Akt phosphorylation. Insulin alone increased S6K phosphorylation 8-fold with an increase in Akt phosphorylation, and insulin and leucine together increased S6K phosphorylation about 18-fold also with increased Akt phosphorylation(Reference Greiwe, Kwon and McDaniel23). The data suggest that insulin and leucine may have independent pathways leading to S6K phosphorylation (Fig. 6).
Leucine supplementation in type 1 diabetic adolescents
We set out to see if oral leucine supplementation would improve protein retention in type 1 diabetic adolescents. The goal was twofold: first to explore the possibility of greater protein retention following a meal since adipose tissue accumulation is a problem in long-term insulin treatment, especially in adolescent girls(Reference Ingberg, Sarnblad and Palmer24) and secondly, since these individuals cannot secrete insulin, to examine the effect of leucine on protein metabolism in the absence of alterations in insulin secretion. Six adolescent females (16 years of age) with duration of type 1 diabetes of ~10y were assessed for whole-body protein metabolism on two occasions with constant infusion of L-[1-13]leucine(Reference Desikan, Mileva and Garlick25). The measurements were made during the 5th and 6th hour of consumption of individual caloric requirement as a liquid diet containing 22 % of energy as protein (58 μmol leucine/kg/h designated “control”) or the same diet with three times the amount of lecuine in the control diet added (232 μmol leucine/kg/h designated “leucine”). We were unable to demonstrate any alterations in whole-body protein synthesis with added leucine, but there was a significant decrease in the rate of protein degradation when the diet was supplemented with additional leucine (Fig. 7). There are a number of differences in these results from those demonstrating an ability of leucine to stimulate the rate of protein synthesis. Firstly, our measurements were of whole-body protein metabolism, not specifically muscle; secondly, we were not comparing the fasting state without leucine to the fasting state with leucine, but comparing the rates of protein metabolism in the fed state with and without additional leucine. However, other studies have confirmed the ability of leucine to affect protein degradation.
Leucine kinetics on type 1 diabetes with supplemental dietary leucine. , data from the study day with supplemental dietary leucine; , data from the study day without supplemental leucine. * indicates that the data from the study day with added are significantly different from the study day without added leucine, P < 0·001.

Leucine inhibition of protein degradation
A beneficial effect of leucine supplementation on protein retention through an alteration in the rate of protein degradation has been demonstrated by Baptista et al. (Reference Baptista, Leal and Artioli26) in a study of rats with an accelerated rate of muscle protein degradation resulting from leg immobilization. Leucine supplementation (2·7 g/kg/d by gavage) beginning 3d prior to cast immobilization of a hindlimb resulted in a preservation of muscle mass normally lost during the immobilization process. Insulin was not altered 1 h or 3 h after leucine gavage and was not altered after 5d of leucine treatment. Immobilization resulted in a 35 % reduction in the rate of protein synthesis, assessed in incubated soleus muscle maintained at normal length and cut longitudinally to improve diffusion, and leucine supplementation had no effect on the reduction in the rate of protein synthesis. Immobilization also resulted in about a 30 % loss of soleus muscle mass, while the loss of protein in the leucine-supplemented group was only about 10 %. Compared to immobilization without leucine supplementation, there was a decrease in accumulation of ubiquinated proteins assessed from Western-blot analysis (Fig. 8) and significant reductions in the expression of atrogin-1 (or muscle atrophy F-box, MAFbx) and muscle ring finger 1 (MuRF1) which encode the E3 component (ubiquitin protein ligase) of the ubiquitin-proteosome system of protein degradation (shown in Fig. 9) which were elevated by immobilization(Reference Baptista, Leal and Artioli26). In contrast to the conclusion that the primary effect of leucine supplementation is on the ubiquitin-proteosome system of degradation, work from Sugawara et al. (Reference Sugawara, Ito and Nishizawa27) suggests that the beneficial effect of leucine supplementation in rats fed a protein-deficient diet is mediated not by atrogene regulation, but rather through alterations in the expression of autophagy marker microtubule-associated protein 1 light chain 3 (LC3) B-II, a component of the autophagy-lysosomal system of protein degradation (shown in Fig. 10).
Leucine inhibition of immobilization-induced ubiquitin–protein conjugates. Im, immobilization; leu, leucine-supplemented; a, significantly different from control, P < 0·05; b, significantly different from Im, P < 0·05. The data in Figure 8 are from reference 26.

The Ubiquitin-Proteasome Pathway for Protein Degradation.

Autophagy - Lysosomal Protein Degradation.

Regulation of protein degradation through the autophagy-lysosomal pathway by leucine is also suggested by studies in young humans ingesting essential amino acids including an amount of leucine typical of high quality protein (1·8 g leucine) and essential amino acids with additional leucine (isonitrogenous but 3·5 g leucine). Protein metabolism was assessed from the kinetics of labelled phenylalanine and leucine across the leg(Reference Biolo, Fleming and Maggi28). In this experimental paradigm, acute ingestion of the dietary essential amino acid mixture did not increase the rate of synthesis of mixed muscle protein, but supplemental leucine resulted in an increase in the rate of muscle protein synthesis over 180 min (0·050 %/h basal; 0·076 %/h plus leucine)(Reference Glynn, Fry and Drummond29). The rate of mixed muscle protein degradation was significantly decreased at 180 min by additional leucine, but not at 120 or 180 min. By comparison with the control group, the leucine group had increased mTORC1 signaling (phosphorylation of mTOR and S6K1) and 4E-BP1 phosphorylation. In addition, there was an increase in the amount of mTORC1 complexed to the unc-51-like kinase 1 (ULK1). Complexing of ULK1 decreases its activity which suggests that there was an inhibition of protein degradation via autophagy. The autophagy maker LC3B-II (microtubule-associated protein 1 light chain 3) was also decreased in the group receiving additional leucine, but there were no significant differences in MAFbx or MuRF1(Reference Glynn, Fry and Drummond29).
Insulin resistance associated with leucine
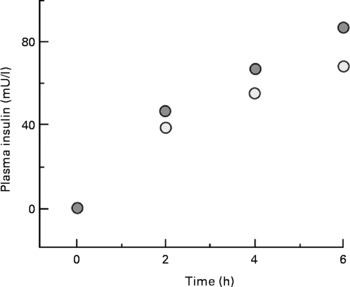
One complication of our study with type 1 diabetic adolescents discussed above was an inability to assess the effect of leucine, per se, on whole-body protein metabolism. These individuals were unable to secrete insulin in response to leucine ingestion, but there was an increase in the concentration of plasma glucose, which necessitated an increase in the amount of insulin infused. To achieve the same glucose control, 30 units of insulin were given during consumption of the basal diet, but 36 units were required during consumption of the diet with supplemental leucine (P = 0·02), resulting in higher concentrations of plasma insulin (Fig. 11(Reference Desikan, Mileva and Garlick25)).
Plasma insulin during consumption of basal or leucine-supplemented diet.  , data from the study day with supplemental dietary leucine;
  , data from the study day without supplemental leucine.
A different human study from Tremblay et al. (Reference Tremblay, Krebs and Dombrowski30) demonstrates insulin resistance with provision of amino acids even more clearly. Intravenous infusion of an amino acid mixture sufficient to increase the concentration of leucine in plasma to ~300 μmol/L (somewhat higher than would be observed after a protein meal) resulted in demonstrable insulin resistance (Fig. 12). Somatostatin was infused to prevent the release of endogenous insulin and glucagon and insulin was infused at rates equivalent to both post-absorptive (~100 pmol/L for 0–180 minutes) and post-prandial levels (~430 pmol/L for 180–360 min). With the lower rate of insulin infusion, there was an increase in glucose disposal (Rd), but no alteration in the insulin-mediated rate of glucose disposal from concomitant infusion of amino acids. With the higher rate of insulin infusion, glucose disposal was increased with both saline (control) and amino acid infusion, but glucose disposal was about 30 % lower when amino acids were given compared to insulin alone. The ability of insulin to suppress endogenous glucose production was also affected by amino acid infusion. At low levels of insulin infusion, glucose production was reduced by ~70 % compared to the basal state (without exogenous insulin). When amino acids were given along with insulin, the decline in glucose production associated with insulin infusion was completely blocked (0–180 minutes, Fig. 12(Reference Tremblay, Krebs and Dombrowski30)).
Amino acid suppression of glucose uptake and endogenous glucose production. (A) Rd, glucose disposal; (B) EGP, endogenous glucose production. From 0-180 minutes insulin was given at 0.25mU/kg/min equivalent to fasting levels and from 180-360 minutes, insulin was infused at 1.0mU/kg/min to achieve levels equivalent to the prandial state. , assessments made in the presence of infused amino acids sufficient to raise plasma leucine concentrations to ~300 μmol/L; , indicate the study days when no amino acids were infused. The symbols denote the significance of the difference of control vs amino acid infusion: * P < 0·05, †P < 0·01 and ◆P < 0·001.

Insulin, in the absence of amino acids infusion, stimulated the activity of S6K1, an effect which was even greater when amino acids were infused(Reference Tremblay, Krebs and Dombrowski30). Moreover, provision of amino acids also regulated some of the upstream components of the insulin signaling pathway. In the presence of amino acids, there was an increase in the serine phosphorylation state of IRS-1 with further effects on downstream components. Provision of insulin at post-prandial-like levels without amino acids increased the activity of IRS-associated PI 3-kinase activity about twofold (low amino acids, Fig. 13), but this effect was not observed when amino acids were also provided (high amino acids, Fig. 13). In addition, in vitro studies with L6 myocytes demonstrated a reduction in glucose transport associated with the amino acid-associated reduction in the ability of insulin to stimulate PI3 kinase activity(Reference Tremblay, Krebs and Dombrowski30).
Leucine-mediated changes in PI3-K activity. Data from skeletal muscle of control () and leucine-supplemented () rats assessed after an overnight fast (PA), 30 (PP30) and 60 (PP60) minutes after gavage with a nutrient bolus. Values with different letters are significantly different P < 0·05.

The importance of the mTOR pathway in mediating amino acid-related insulin resistance was first suggested from studies in muscle cells(Reference Tremblay and Marette31). In the presence of physiological hyperaminoacidaemia, the activation of S6K1 in response to insulin was increased, but there was also increased inhibitory serine/threonine phosphorylation of IRS-1and a reduction in PI 3-kinase activity(Reference Tremblay and Marette31). These in vitro results were confirmed in vivo as described above, where amino acid infusion increases activation of S6K1 and phosphorylation of IRS-1 on multiple serines with a reduction in the ability of insulin to stimulate PI 3 kinase(Reference Tremblay, Krebs and Dombrowski30).
Diminished responsiveness to insulin by human muscle exposed to high levels of a mixture of amino acids does not specifically implicate elevated plasma leucine concentrations in the observed effect. However, data from rats do suggest that leucine alone is associated with insulin resistance. A study of long-term dietary leucine supplementation comparing rats fed eiither a control diet (15 % of energy as protein plus glycine) or a diet supplemented with branched-chain amino acids (4·5 % leucine with isoleucine and valine to prevent a decrease in plasma levels of these amino acids) suggests that leucine alone is sufficient. After 5 weeks on these different diets, rats had a differential sensitivity to an oral glucose bolus (1 g/kg). Although plasma glucose levels were similar in both groups of animals, the animals maintained on higher leucine diets secreted more insulin in response to glucose, resulting in about a 30 % higher insulin-glucose index in the animals receiving the leucine-supplemented diet(Reference Balage, Dupont and Mothe-Satney32). The animals were also tested for their response to a nutrient bolus (leucine equivalent to the control diet with 1 g of glucose and 2 g of sucrose). In response to this nutrient stimulus, phosphorylation of S6K1, S6 and 4E-BP1 was similar in both groups, but there were demonstrable differences in the early steps of insulin signaling with reductions in phosphorylation of insulin receptor β (IRβ), insulin receptor substrate 1 (IRS1, in contrast to the effect observed in human muscle with insulin and amino acid infusion(Reference Tremblay, Krebs and Dombrowski30)), and phosphoinositol 3 kinase (PI3-K) in the group which had previously received the higher leucine diet (Fig. 13(Reference Balage, Dupont and Mothe-Satney32)). These animals also had an increase of about 27 % in the amount of perirenal adipose tissue(Reference Balage, Dupont and Mothe-Satney32).
Longer-term supplementation with dietary leucine
What happens with long-term supplementation with dietary leucine in humans? Acute studies have demonstrated that increasing the leucine content of dietary essential amino acids or a meal provided to human subjects improves the response of the rate of muscle protein synthesis(Reference Katsanos, Kobayashi and Sheffield-Moore33, Reference Rieu, Balage and Sornet34). Insight into the benefit of prolonged leucine supplementation (7·5 g/d for 3 months compared with a wheat flour placebo) in healthy elderly men is provided by a study of Verhoeven et al (Reference Verhoeven, Vanschoonbeek and Verdijk35). Following the period of leucine supplementation, there were no differences in whole-body fat-free mass, upper leg cross-sectional area, or muscle fiber types (myosin heavy chain types) in those individuals receiving supplemental leucine compared to those who received a placebo. There were also no observable differences in muscle strength between the two groups(Reference Verhoeven, Vanschoonbeek and Verdijk35). Although not definitive, this study illustrates the difficulty in translating acute changes in protein kinetics or signaling pathways observed with leucine into demonstrable long-term benefit.
Conclusions
While we do not have a complete picture of the regulation of protein metabolism, we have an increasing number of pieces needed to complete the puzzle. Regulation occurs in multiple time frames from immediate changes, such as those that regulate signalling pathways, to distant regulation, such as responses to conditions in utero or even to environmental factors encountered by grandparents. We are also beginning to appreciate that looking for “the” effects of a particular stimulus needs to be modified to “the effect for this individual at this time”. While these multiple layers of regulation contribute to the complexity of our understanding, they provide systems which are both exquisitely sensitive and highly co-ordinated. Studies involving the ability of the amino acid leucine to regulate protein metabolism provide a means of illustrating many of the regulatory pathways for protein metabolism. Leucine has the capacity both to stimulate protein synthesis though enhanced translation initiation and to inhibit protein degradation through mechanisms including the regulation of activity and transcription of genes of both the autophagy-lysosomal and ubiquitin pathways. Studies of the ability of the amino acid leucine to alter protein metabolism through interactions with regulatory effects due to insulin also highlight the interplay of nutrients and hormones. It may be that leucine is beneficial in subjects with an ability to secrete insulin, such as individuals with type 2 diabetes, but inappropriate for those with insulin-dependent diabetes. The role of leucine supplementation to preserve or restore body protein has not been fully delineated, but animal studies suggest potential benefit. The complex relationship of genotype and epigenetic modification of the genome to nutrient responses are both exciting and challenging and will need to inform future studies on the regulation of protein metabolism.
Acknowledgements
Much of this review on the control of protein metabolism has been taken from “Protein Synthesis and Degradation” in Biochemical, Physiological, and Molecular Aspects of Human Nutrition (Saunders, 3rd edition) by Tracy G. Anthony and Margaret McNurlan. The contribution of Dr. Tracy Anthony is most gratefully acknowledged.
There are no conflicts of interest and there was no specific funding for this work.



