


1. Introduction
Maintaining long service lives for transportation systems has become increasingly challenging as sustainability requirements increase and supply chains become less stable. In public transport, vehicle fleets are expected to achieve high lifetime mileages while operating under conditions such as small production volumes, fluctuating spare-part demand and supplier obsolescence. Conventional sourcing strategies often results in long lead times and elevated inventory risks, which are difficult to reconcile with circular and resilient manufacturing objectives (Reference Izadikhah, Azadi, Toloo and HussainIzadikhah et al., 2021).
Additive manufacturing (AM) has been proposed as a potential approach to address these challenges. At an industrial scale, early studies estimated that widespread AM adoption could reduce global primary energy demand by 2.54-9.30 Exajoule over a ten-year period (Reference Gebler, Schoot Uiterkamp and VisserGebler et al., 2014). Metal AM in particular enables high material utilization and design-driven weight reduction. These characteristics indicate potential resource efficiency benefits compared to subtractive manufacturing routes (Reference Van Sice and FaludiVan Sice & Faludi, 2021). However, several studies also report higher environmental impacts per kilogram of processed material when compared to machining or casting, indicating that benefits are highly application-specific (Reference Van Sice and FaludiVan Sice & Faludi, 2021).
In the bus transportation sector, the use of metal AM remains limited and is largely restricted to spare-part production rather than serial manufacturing. More broadly, environmental assessments within the automotive sector report mixed and context-specific results, highlighting ongoing uncertainty regarding its real-world sustainability implications (Reference Kellens, Baumers, Gutowski, Flanagan, Lifset and DuflouKellens et al., 2017).
Despite these limitations, key characteristics of metal AM - such as tool-less production, on-demand manufacturing and the possibility of localized production - suggest that metal AM may support circular economy strategies including reuse, repair or remanufacturing and reduce (Reference Armstrong, Mehrabi and NaveedArmstrong et al., 2022). Nevertheless, organizations currently lack a concise method to identify suitable components, select an appropriate circular pathway and justify feasibility prior to production (Reference Zaman, Rivette, Siadat and MousaviZaman et al., 2018). Against this backdrop, this paper addresses the following research questions:
RQ1: How can a method reliably identify components that are suitable for metal additive manufacturing at the earliest design stages?
RQ2: How can early-stage, methodical route identification - framed by ISO-aligned circular actions (e.g., Reuse, Repair/Remanufacture, Reduce) - guide design choices to enhance circularity and reduce environmental impact?
In order to address these questions, this paper introduces a framework that combines a questionnaire-based screening for AM-suitability with an explicit R-strategy identification step and a feasibility gate prior to production. The R-strategy perspective is used to operationalize product circularity at the component level by translating screening outcomes into actionable pathways. Each pathway establishes the analytical scope and process-related boundaries for subsequent design decisions and documentation.
The key contributions of this study can be summarized as follows:
-
• A concise, criteria-based screening approach coupled with rule-based R-strategy identification;
-
• A feasibility gate applicable in the early stages of product engineering tailored to AM;
-
• A single-component case study from the bus sector demonstrating the proposed workflow and reporting Life Cycle Assessment (LCA) results for the component.
The following sections are organized as follows. Section 2 summarizes the capabilities of metal AM, DfAM principles and the considered R-strategies. Section 3 introduces the methodological framework, including component selection and evaluation pathways. Section 4 presents the case study and results. Section 5 discusses implications and limitations, followed by conclusions in Section 6.
2. Background and related work
2.1. Metal additive manufacturing capabilities and constraints
Metal AM produces metallic components in a layer-wise manner based on digital models. This paper focuses on laser powder bed fusion (LPBF) and directed energy deposition (DED), as these process families align with the routes considered in this study (Reference Armstrong, Mehrabi and NaveedArmstrong et al., 2022; Reference GardnerGardner, 2023). Binder jetting and bound-metal extrusion are noted as potential alternatives where cost or throughput is prioritized. For LPBF, the manufacture of fine features, internal channels and consolidated geometries is feasible within small to medium build envelopes. Key feasibility constraints are related to support structures driven by overhangs, depowering of enclosed volumes and post-processing access to tolerance-critical surfaces (Reference Yeung, Lane and FoxYeung et al., 2019). For DED, localized material deposition enables repair operation and the addition of features on larger components. Practical limitations are primarily associated with dilution and head-affected zones, achievable surface quality and physical access to the repair region (Reference Saboori, Aversa, Marchese, Biamino, Lombardi and FinoSaboori et al., 2019).
2.2. Design for additive manufacturing principles
Realizing the performance potential of metal AM - such as geometric complexity, customization and load-path tailoring - requires explicit design for AM (DfAM) rather than direct replication of incumbent designs. Without dedicated DfAM, increased support requirements, thermal distortion and qualification risks can offset the expected benefits (Reference Wiberg, Persson and ÖlvanderWiberg et al., 2019). Current DfAM approaches typically combine generative design or topology optimization with manufacturability constraints and build-orientation planning to reduce support volume and heat accumulation (Reference Barbieri and MuzzupappaBarbieri & Muzzupappa, 2022). Post-processing is commonly integrated at the design stage by defining machining allowances and specifying heat-treatment steps for tolerance-critical or fatigue-critical regions. Extending this, Design for Sustainable AM (DfSAM) formulates a multi-objective redesign that balances material usage, process time, support volume, post-processing effort and build-failure risk, embedding Ecodesign principles alongside DfAM rules (Reference AgrawalAgrawal, 2022; Reference Hegab, Khanna, Monib and SalemHegab et al., 2023).
2.3. R-strategies and their mapping to metal additive manufacturing
We consider the circular resource-management actions defined in ISO 59004 -Refuse, Rethink, Circular sourcing, Reduce, Reuse, Repair, Refurbish, Remanufacture, Repurpose, Cascade, Recycle, Recover energy and Re-mine - as a shared vocabulary linking design decisions with circular outcomes across the product life cycle (International Organization for Standardization, 2024; Reference Reike, Vermeulen and WitjesReike et al., 2018). Several R-strategy pathways are directly actionable using AM. Reduce can be pursued through lightweight and material-efficient geometries enabled by AM design freedom (Reference König, Mörsdorf and VielhaberKönig et al., 2025). Repair can be implemented via directed material deposition, most notably LPBF or DED, to restore worn features or add localized reinforcements (Reference Walachowicz, Bernsdorf, Papenfuss, Zeller, Graichen, Navrotsky, Rajvanshi and KienerWalachowicz et al., 2017). In addition, AM supports Remanufacture and Repurpose by enabling geometry updates, feature add-ons or interface adaptations on existing components without full retooling (Reference Duve, Petasch, Lüdemann-Ravit, Heieck, Holder, Wulle and LindDuve et al., 2025).
2.4. Early part screening and multi-criteria decision
Early-stage part screening aims to identify components suitable for AM at the outset of product development, where design freedom and cost leverage are highest. Recent work proposes automated pipelines that extract part features, requirements, production constraints, life cycle costs and geometric data to enable rapid, component-level classification with reduced manual effort and improved planning reliability (Reference Buechler, Schumacher, Reimann and ZaehBuechler et al., 2022). Because AM process and material selection involves multiple, often conflicting criteria, multi-criteria decision-making (MCDM) is commonly applied in early design to support a structured process and resource selection (Reference Liu, Zhu and YeLiu et al., 2020; Reference Zaman, Rivette, Siadat and MousaviZaman et al., 2018). However, two gaps remain. First, many screening methods operationalize only a subset of the criteria reported in the literature, risking inconsistent or incomplete evaluations; comprehensive frameworks that cover recurrent, relevant criteria are still lacking (Reference Brennan, Simpson, McComb, Jablokow and HamannBrennan et al., 2021). Second, most approaches are process-specific or only partially process-agnostic, which limits transferability across AM technologies and design contexts; genuinely generalizable methods remain rare (Reference Brennan, Simpson, McComb, Jablokow and HamannBrennan et al., 2021).
3. Method framework
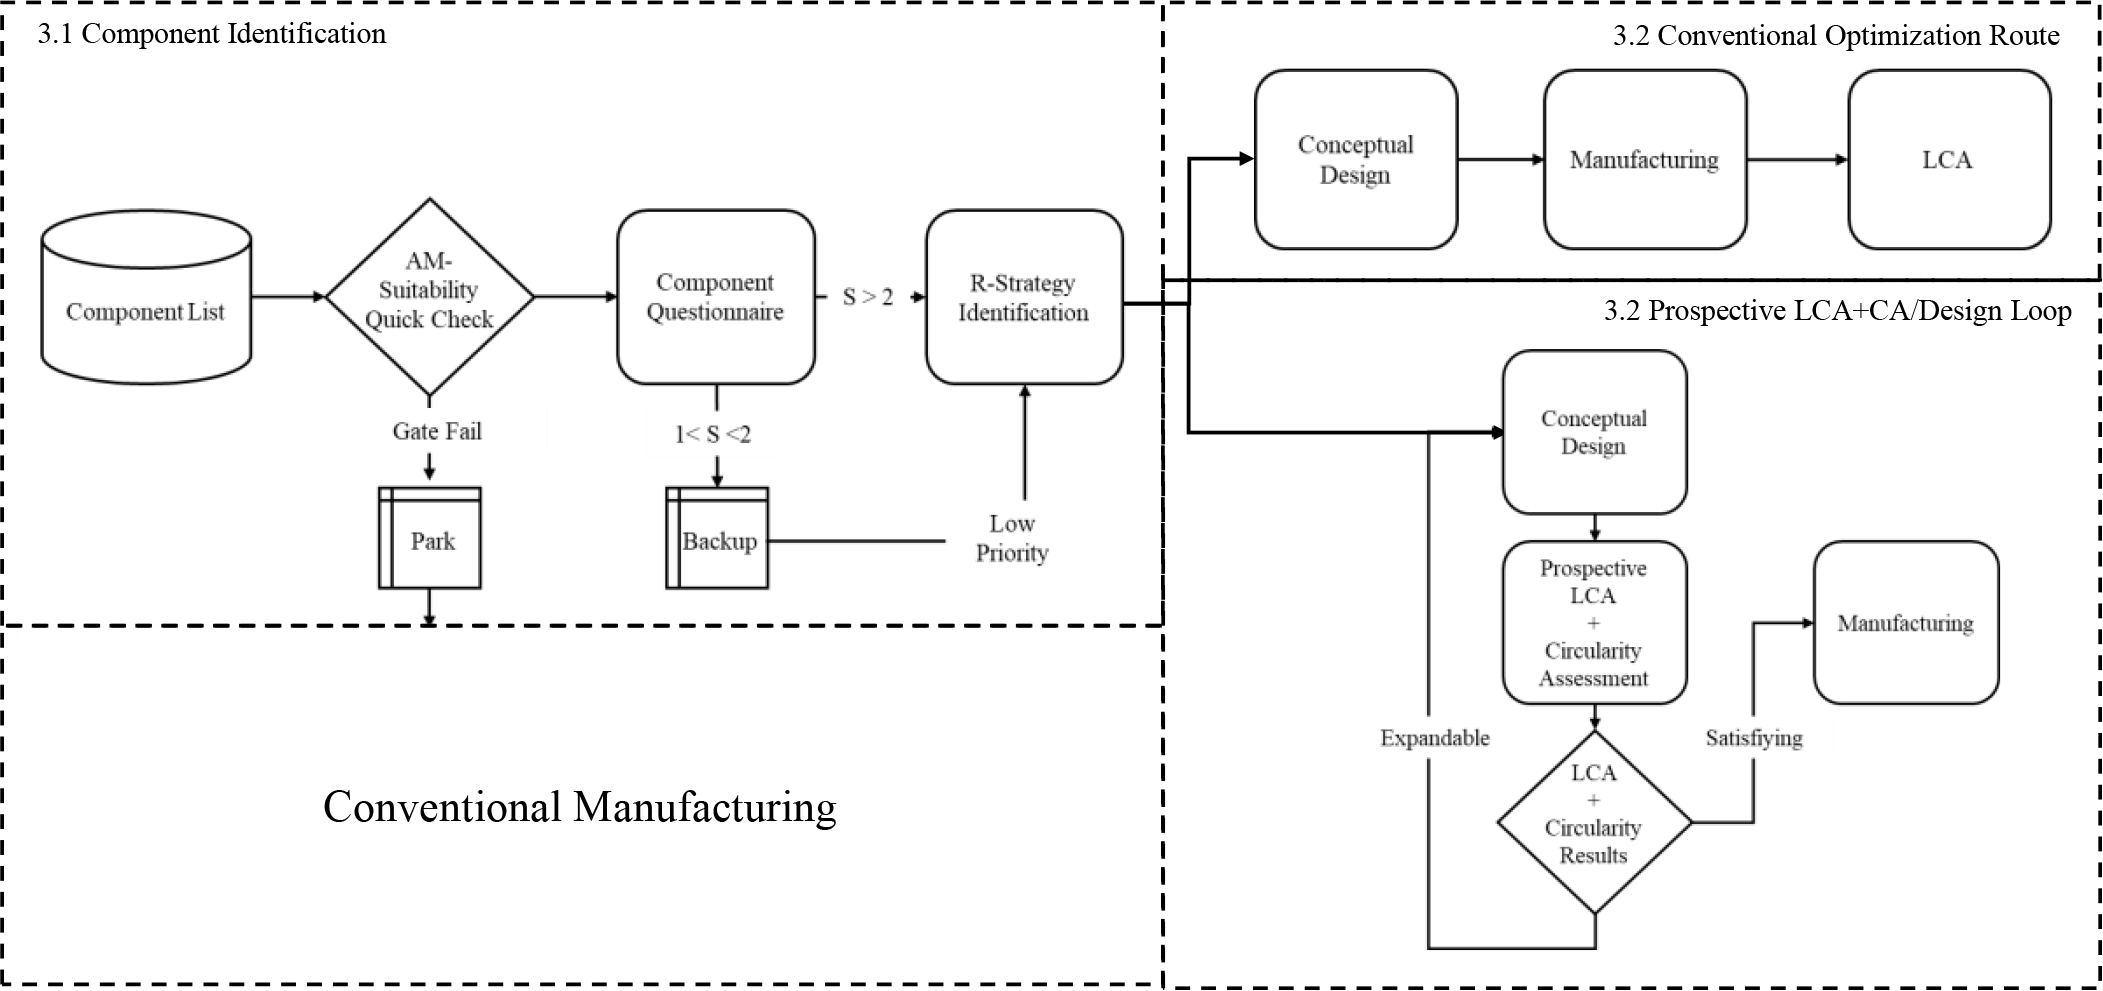
The proposed methodological workflow is illustrated in Figure 1. It aims to systematically identify components that are suitable candidates for AM-oriented redesign and to derive evidence-based recommendations on which circular resource management actions should be prioritized (discussed in Section 3.1). Following component identification, the method supports life cycle-oriented optimization through iterative feedback loops within the design process (Section 3.2). By integrating prospective LCA across the design stages, design options can be compared, environmental performance targets can be defined and assessed and consistency between technical design decisions, resource efficiency and circular-economy objectives can be ensured.
Methodological workflow for component screening, AM-oriented redesign and life cycle-oriented evaluation

Figure 1 Long description
The flowchart illustrates a methodological workflow for component screening, AM-oriented redesign, and life cycle-oriented evaluation. Panel A: Component Identification. The process begins with a component list. An AM-suitability quick check is performed. If the component fails this check, it is parked. If it passes, a component questionnaire is completed. Based on the score (S), components are either identified for R-strategy identification (S > 2), backed up (S = 2), or given low priority (S < 2). Panel B: Conventional Optimization Route. Components proceed to conceptual design, followed by manufacturing, and then life cycle assessment (LCA). Panel C: Prospective LCA+CA/Design Loop. Components also proceed to conceptual design, followed by prospective LCA and circularity assessment. If the results are not satisfying, the process loops back to conceptual design. If the results are satisfying, the component proceeds to manufacturing.
3.1. Component identification
The component identification phase determines which parts of a product warrant AM-oriented redesign and which circularity pathways this redesign should follow. The process starts from a comprehensive list of components, which is used to evaluate the parts sequentially. An initial quick check of AM suitability applies a limited set of exclusion criteria - such as impermissible redesigns or violation of installation-space constraints - to eliminate candidates without realistic AM feasibility. Components failing this gate are assigned a park status and are either retained for conventional manufacturing (CM) or given very low priority. This step ensures that the method remains efficient and applicable in industrial context.
Components passing the quick check are subsequently assessed using a structured component questionnaire that evaluates AM suitability across four criterion groups: function & application, geometry & design, material & technical and economic & manufacturing. Together, these groups capture the functional role and use context of the component, its geometry, material-and process-related constraints and relevant economic boundary conditions. Each criterion is rated on a discrete four-level ordinal scale ranging from 0 to 3, where 0 indicates weak compatibility with AM and 3 indicates strong compatibility. The response options and their mapping were developed based on expert judgment from academia and industry, including specialists from ATLIX (formerly TRUMPF Additive Manufacturing) and supported by literature to ensure consistent interpretation. Criterion weights were derived using the Analytic Hierarchy Process (AHP) (Reference SaatySaaty, 1986) with a mixed panel of industrial and research experts. Weighted aggregation of the ratings results in a single AM-suitability score
 .
.
This score enables a transparent prioritization logic:
-
•
 < 1: AM offers limited benefit; redesign is not recommended.
 -
• 1 ≤
< 2: technically feasible but low-priority cases; AM may be possible but is unlikely to outperform CM -
• 2 ≤
: suitable candidates for AM where redesign is justified.


In parallel with AM-suitability scoring, the questionnaire attributes (e.g. part mass, functional criticality, visibility and failure mode characteristics) are mapped to contributions across the thirteen R-strategies, resulting in a characteristic circularity profile for each component. High part mass, for example, typically supports Reduce and Remanufacture, as lightweighting potential and material value retention become relevant. Customer-visible components tend to be less suitable for Repair but more compatible with Refurbish due to their appearance requirements (Reference Kanishka and AcherjeeKanishka & Acherjee, 2023), whereas non-visible parts show stronger compatibility with Repair or Remanufacture, where functional restoration dominates aesthetic considerations (Reference Zacharaki, Vafeiadis, Kolokas, Vaxevani, Xu, Peschl, Ioannidis and TzovarasZacharaki et al., 2021). The dominant or compatible set of R-strategies identified in this step becomes a direct input to the redesign phase.
3.2. Redesign and evaluation pathways
Based on the recommended R-strategies identified in Section 3.1, corresponding design strategies are derived for the redesign phase. For instance, lightweight design supports the Reduce strategy, while Design for Repairability principles directly enable Repair. In conventional product development, such strategies are implemented within a linear workflow: the design is developed and validated, the component is manufactured and environmental assessment is performed on the final product.
In contrast, the proposed method integrates the selected design strategy into an iterative design-LCA loop. Rather than assessing environmental performance at the end of the process, a prospective LCA is carried out during early design stages to estimate environmental impacts of the future product. This early feedback supports two decision layers: it allows assessment of the selected design strategy and indicates whether the current design variant is sufficiently mature to proceed to manufacturing or whether further optimization is warranted. The loop continues until the environmental performance targets are met, after which the design advances to manufacturing with a validated strategy aligned with technical and circularity objectives.
4. Case study: enhanced circularity and reduced environmental impacts of bus components through additive manufacturing
4.1. Proof-of-concept of the screening method
4.1.1. Scope of the case study and redesign method
The case study demonstrates the application of the proposed screening and redesign method to a structural bus component currently manufactured from steel via milling as the CM process. The objective is to assess whether metal AM offers technical and environmental benefits and to illustrate how the method supports decision-making across component identification, redesign and prospective LCA as a proof of concept. To ensure comparability across redesign pathways, a consistent functional context is assumed: the component performs the same structural function within the same bus platform, independent of manufacturing route and geometric variant.
4.1.2. Results from component identification and R-strategy guidance
The component from this study is illustrated in Figure 2 and passed the preliminary AM quick-check introduced in Section 3.1, indicating that no fundamental redesign constraints or build-envelope limitations hinder an AM-oriented redesign. In the subsequent detailed assessment, the criterion-based questionnaire was applied to evaluate technical, operational and sustainability-related attributes. The weighted aggregation of the normalized ratings results in an AM-suitability score of 2.3 on the 0-3 scale. This places the component above the redesign threshold and qualifies it for AM-based optimization. The score is derived using the criterion weights and response mappings defined in Section 3.1 and developed with input from academic and industrial metal AM experts.
Figure 2 also presents the relevant excerpt of the component questionnaire, including the resulting R-strategy profile. The ranking identifies Reduce as the most promising circularity strategy, followed by Repair and Rethink. While Repair achieves the second-highest score, its redesign potential for this structural component is limited, as improvements to repairability are largely determined by downstream service conditions than by geometric redesign. In contrast, Reduce and Rethink provide actionable levers at the early redesign stage and align well with the inherent strengths of AM.
Component questionnaire including R-strategy recommendation for the use case

Based on these results, the redesign concept focused on a combination of the Reduce and Rethink strategies. The Rethink strategy was implemented through material substitution, replacing the currently used conventional steel with a high-strength steel compatible with the selected AM process. In parallel, Reduce was addressed through topology optimization as a feasible redesign pathway, aiming to lower structural mass, reduce material demand and decrease weight-dependent energy consumption during the vehicle use phase.
4.2. Design optimization, circularity and environmental impact assessment
4.2.1. Assessment method of component circularity and environmental impact
Within the subsequent design-optimization loop and the final component evaluation, circularity is assessed using the Material Circularity Indicator (MCI) proposed by Ellen Mac Arthur Foundation (2015). For this purpose, the provided calculation template (thinkstep, anz, 2025) is applied, accounting for increased component functionality resulting from weight reduction. While the MCI is used as the circularity indicator in this study, other circularity metrics reported by Reference De Pascale, Arbolino, Szopik-Depczyńska, Limosani and IoppoloDe Pascale et al. (2021) may be considered in future work.
The environmental assessment is conducted using a product life cycle (PLC) evaluation, covering raw material production and manufacturing (summarized as beginning-of-life, BoL) as well as the use phase (middle-of-life, MoL). In this study, the assessment is limited to carbon footprint estimation and the associated global warming potential.
For BoL modelling, raw material production is represented using datasets from ecoinvent 3.11. CM is modelled using the ecoinvent milling process and complemented by manufacturing simulation to estimate energy demand. For AM, steel powder atomization is modelled based on carbon footprint data provided by the supplier of the high-strength steel powder used at Daimler Buses. Powder input, energy demand and inert gas consumption (nitrogen) for the AM process were measured from the build jobs as reported in Reference Duve, König, Häfele, Scherer and HeieckDuve et al. (2026). As the powder supplier operates exclusively with renewable electricity, renewable energy is assumed for electricity consumption. In addition, a secondary scenario based on the German electricity mix is included to assess the robustness of the results with respect to alternative electricity supply assumptions.
Boundary conditions for MoL modelling are derived from typical long-distance bus operation. Two use scenarios are considered: application in diesel-powered buses and in battery electric buses. For the diesel scenario, an average fuel consumption of 30 l/100 km is assumed, with an empty vehicle mass of 13 t and a payload of 5 t, corresponding to approximately 50 passengers including luggage. For the electric bus scenario, energy consumption is assumed to be 140 kWh/100 km, with a higher empty weight of 14 t due to battery weight, while maintaining the same payload. For both scenarios, a lifetime mileage of 1,000,000 km is assumed. Weight-dependent energy savings resulting from design optimization are estimated using bus-specific coefficients reported by Reference Helms and KräckHelms and Kräck (2016), who report average reductions of 0.155 l diesel and 0.31 kWh per 100 km and per 100 kg mass reduction. These coefficients are scaled according to the weight reduction achieved for each redesign option. Fuel production and combustion emissions are modelled using corresponding ecoinvent datasets. For the electric bus scenario, electricity supply is modelled analogously, assuming renewable electricity in the primary case and the German electricity mix in an additional comparison case. Environmental impacts associated with end-of-life treatment are excluded from the system boundary applied in this study.
4.2.2. Results from design optimization, circularity assessment and LCA
To assess the environmental implications of the redesign strategies derived in Section 4.1, two AM-oriented design routes were evaluated: a conventional topology-optimization workflow without environmental feedback (Track 1) and the sustainability-constrained DfSAM workflow integrating prospective LCA into the design loop (Track 2), with the objective of reducing material use, process time and support structures. Figure 3 summarizes the resulting redesign variants alongside the CM reference, including geometry, part mass, economic data and MCI values. Economic data were generated using the commercial Cognitive Design Add-In for Synera, which estimates costs based on CAD geometry, manufacturing parameters and associated input variables. Notably, the DfSAM variant also achieves a higher MCI, indicating improved circularity performance compared to both the CM reference and the topology-optimized AM design.
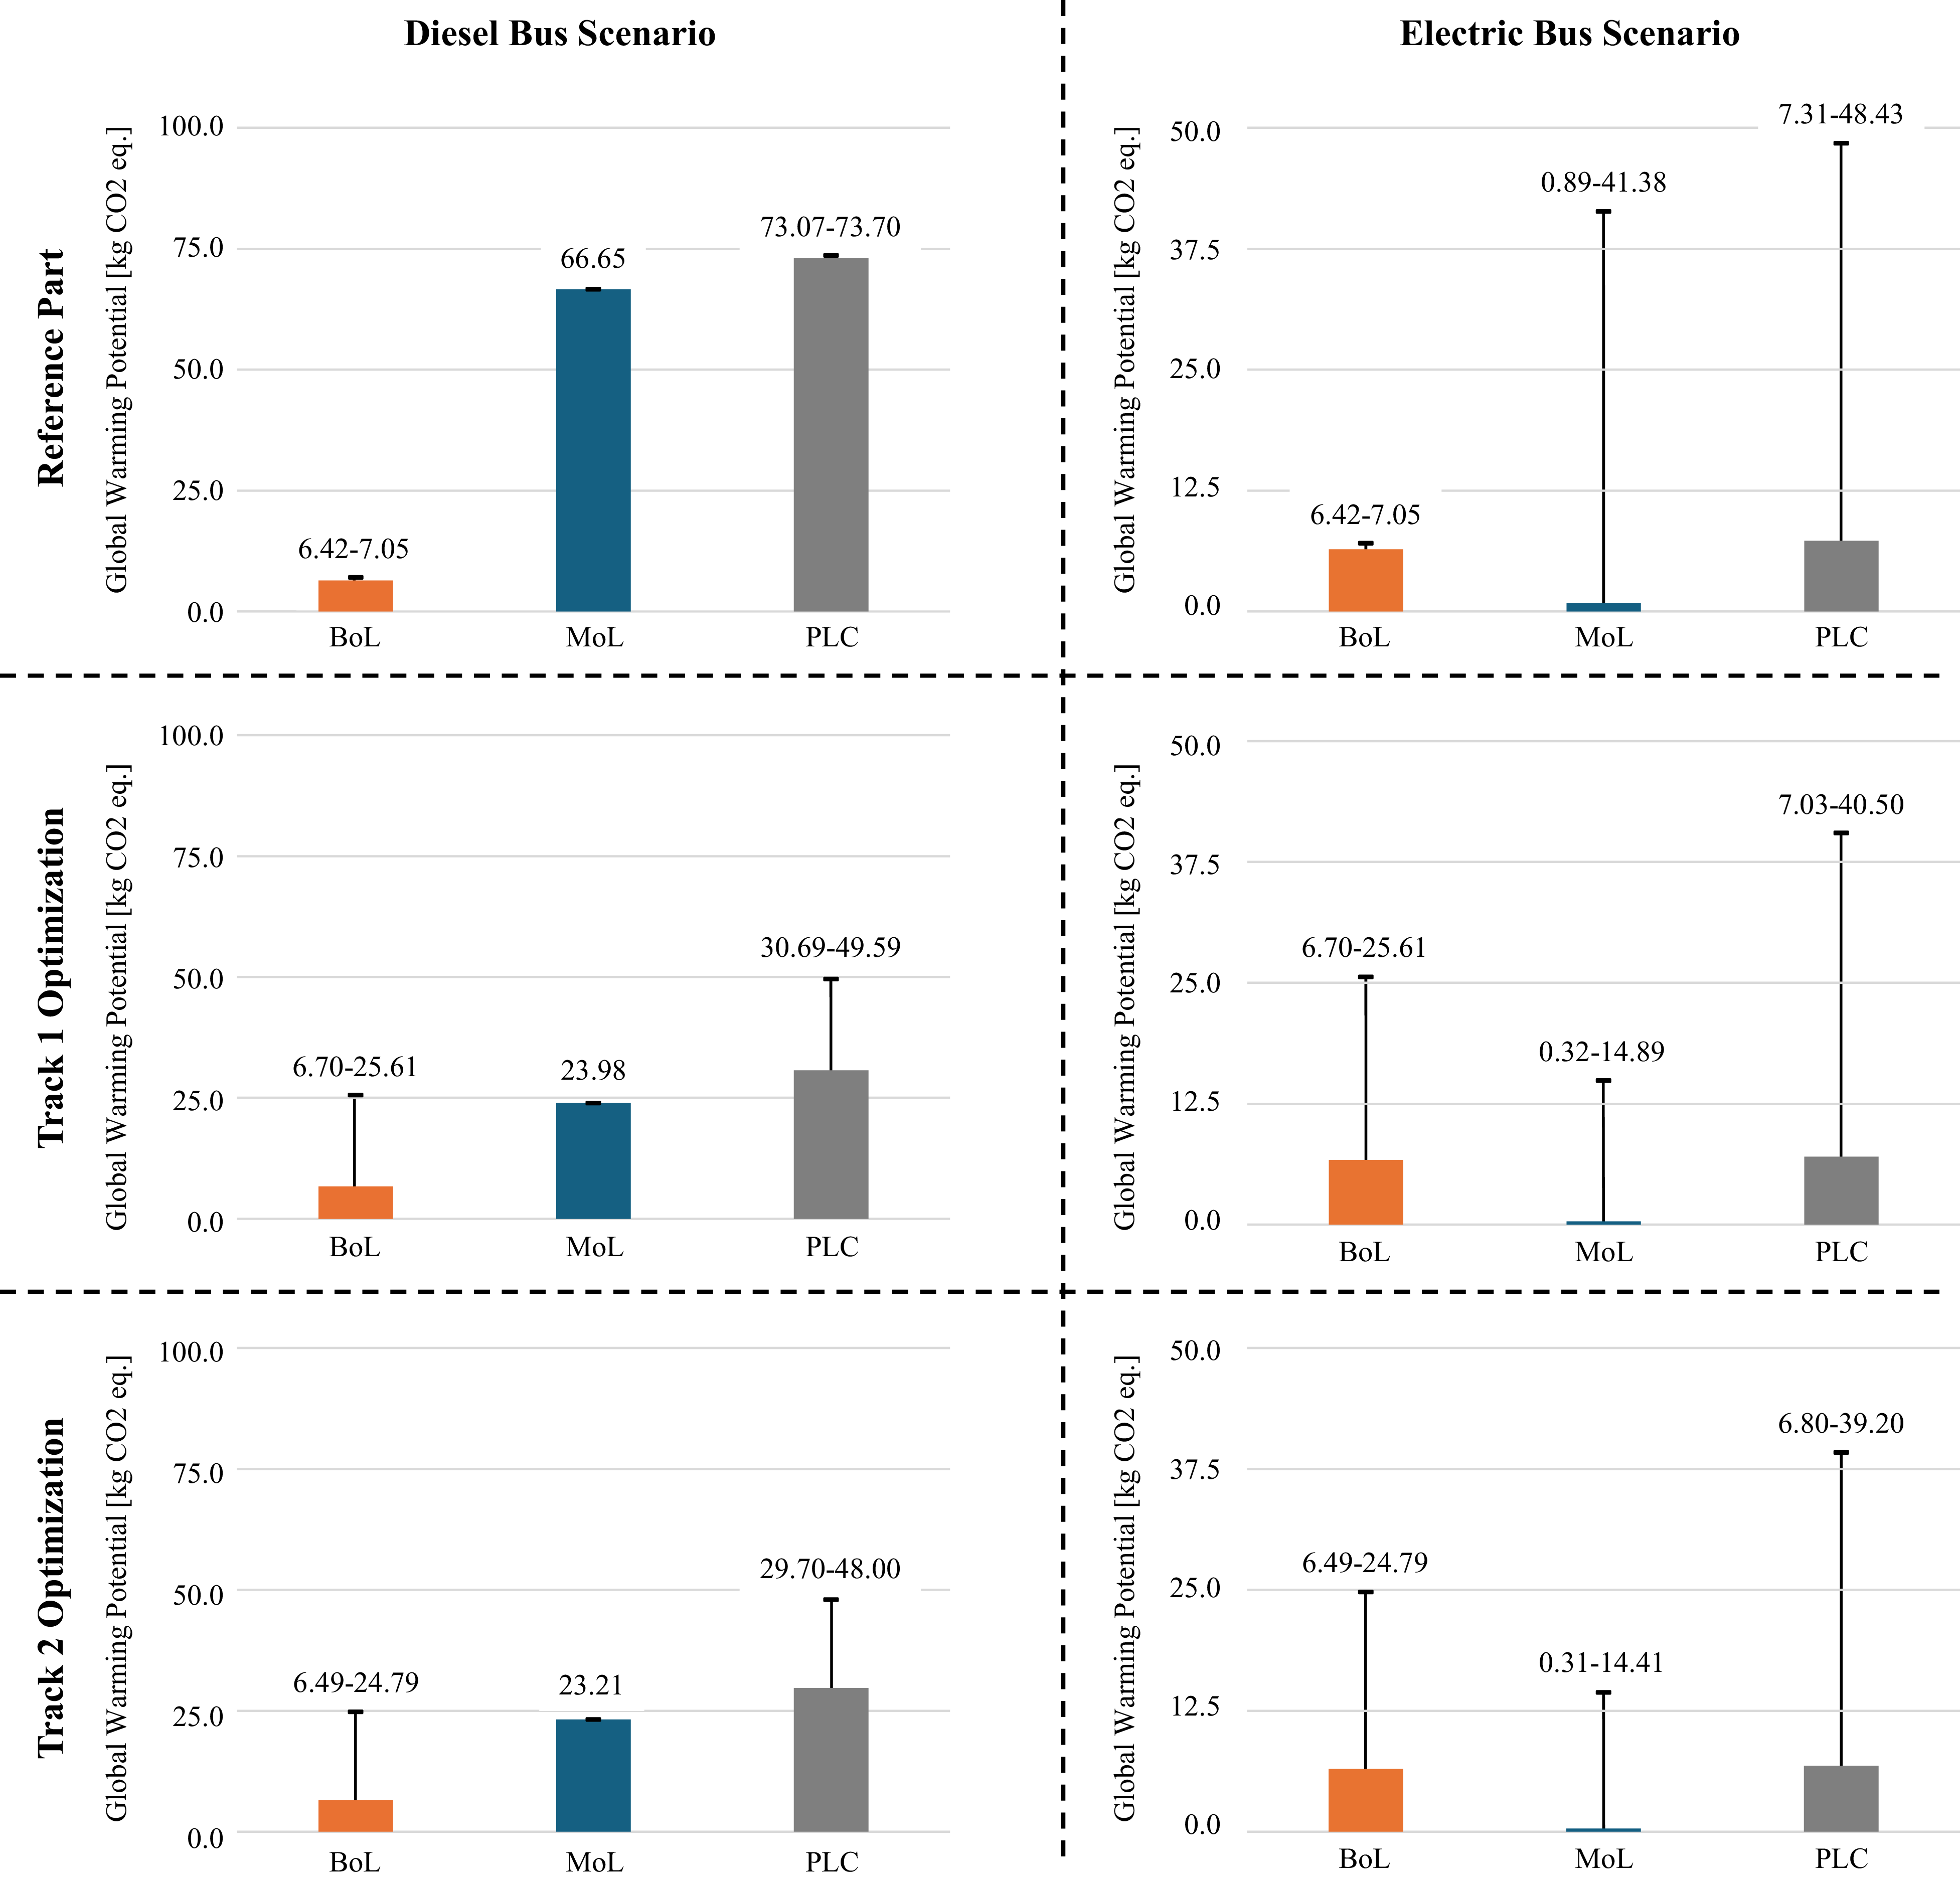
Building on these redesign variants, the environmental performance of both tracks was assessed for conventional diesel and battery electric operation. Figure 4 consolidates the LCA results into a single comparison and illustrates the range induces by different electricity supply assumptions. The effectiveness of the redesign strategies depends on the dominant life cycle stage. Under diesel operation, the long lifetime mileage combined with high fuel consumption makes the use phase the dominant contributor to total CO₂ emissions. In this context, Track 1 achieves noticeable benefits through vehicle mass reduction. However, part of these gains is offset by higher manufacturing impacts resulting from increased build time, support structures and post-processing requirements.
Track 2, in contrast, demonstrates how integrating prospective LCA into the design process mitigates such trade-offs. By explicitly accounting for manufacturing and use phase impacts during the iterative design loop, the DfSAM workflow guides geometry and process decisions toward lower energy demand, reduced support volume, minimal scrap and shorter build times. As a result, Track 2 achieves a larger reduction in total CO₂ emissions than Track 1. This confirms that lightweighting alone (Reduce) is not sufficient; environmental performance improves most when mass reduction is combined with process-efficient Rethink decisions guided by early LCA feedback, consistent with findings reported in the literature (Reference König, Mathieu and VielhaberKönig et al., 2024).
Comparison of the CM reference and the two AM-oriented redesign routes (Track 1: topology optimization; Track 2: DfSAM), including part mass, price estimates and MCI

LCA results of the reference design and both optimization pathways for component usage in diesel and battery electric buses

Figure 4 Long description
Panel A: Diesel Bus Scenario Reference Part: A bar graph comparing global warming potential in kilograms of CO2 equivalent. The horizontal axis lists BoL, MoL, and PLC. The vertical axis ranges from 0 to 100. BoL shows a low global warming potential around 6.42-7.05, MoL around 66.65, and PLC around 73.07-73.70. Panel B: Electric Bus Scenario Reference Part: A bar graph comparing global warming potential in kilograms of CO2 equivalent. The horizontal axis lists BoL, MoL, and PLC. The vertical axis ranges from 0 to 50. BoL shows a low global warming potential around 6.42-7.05, MoL around 0.89-41.38, and PLC around 7.31-48.43. Panel C: Diesel Bus Scenario Track 1 Optimization: A bar graph comparing global warming potential in kilograms of CO2 equivalent. The horizontal axis lists BoL, MoL, and PLC. The vertical axis ranges from 0 to 100. BoL shows a low global warming potential around 6.70-25.61, MoL around 23.98, and PLC around 30.69-49.59. Panel D: Electric Bus Scenario Track 1 Optimization: A bar graph comparing global warming potential in kilograms of CO2 equivalent. The horizontal axis lists BoL, MoL, and PLC. The vertical axis ranges from 0 to 50. BoL shows a low global warming potential around 6.70-25.61, MoL around 0.32-14.89, and PLC around 7.03-40.50. Panel E: Diesel Bus Scenario Track 2 Optimization: A bar graph comparing global warming potential in kilograms of CO2 equivalent. The horizontal axis lists BoL, MoL, and PLC. The vertical axis ranges from 0 to 100. BoL shows a low global warming potential around 6.49-24.79, MoL around 23.21, and PLC around 29.70-48.00. Panel F: Electric Bus Scenario Track 2 Optimization: A bar graph comparing global warming potential in kilograms of CO2 equivalent. The horizontal axis lists BoL, MoL, and PLC. The vertical axis ranges from 0 to 50. BoL shows a low global warming potential around 6.49-24.79, MoL around 0.31-14.41, and PLC around 6.80-39.20.
Under battery electric operation, the results are highly sensitive to the electricity supply used during manufacturing and use. When non-renewable electricity is assumed for manufacturing, the environmental benefits of AM relative to CM are reduced, as the higher energy intensity of AM processes dominates the BoL impacts. In such cases, CM can exhibit lower manufacturing-related emissions and therefore represent the environmentally preferable option at the manufacturing stage. When the use phase is included, AM-based redesign remains advantageous in most scenarios due to mass reduction and associated energy savings during operation. An exception occurs when manufacturing relies on non-renewable electricity while the use phase is powered by renewable electricity. In this specific combination, use phase benefits diminish and manufacturing impacts dominate, resulting in lower total emissions for the CM reference. This highlights that the environmental effectiveness of AM-based redesign depends on the interaction between manufacturing energy supply and operational energy context rather than on lightweighting alone.
Overall, the dominant life cycle stage is determined by the vehicle energy system and the electricity supply in both manufacturing and use. Reduce, understood as mass reduction through geometry optimization and Rethink, understood as process- and resource-efficient manufacturing choices, are therefore not independent strategies but complementary design levers. Under diesel operation, mass reduction remains the primary driver for environmental benefit. Under electrified operation, particularly with renewable electricity during use, process efficiency in manufacturing becomes equally critical. Integrating prospective LCA enables these trade-offs to be identified early and supports environmentally robust AM-based redesign across different operational and energy supply contexts.
5. Discussion
The combined results underline the importance of integrating environmental assessment early in the design process. In the diesel scenario, mass reduction delivers clear use phase benefits, whereas in the electric scenario lightweighting alone no longer guarantees improved climate performance. Here, global warming potential outcomes are increasingly driven by manufacturing energy supply, process efficiency and design-for-AM decisions. This shift highlights the value of embedding LCA feedback within the design-loop, as it exposes trade-offs that remain hidden in ex-post assessments. The DfSAM approach addresses these trade-offs by guiding geometry and process decisions toward lower build energy, reduced support volume and minimal post-processing effort.
The screening method itself also entails limitations. Although the AHP-based weighting was developed with input from academic and industrial experts, multi-criteria assessments inevitably involve subjectivity and alternative expert panels may prioritize criteria differently. In addition, the R-strategy scoring abstracts complex circularity interactions into discrete categories. While this improves practical applicability, it may underrepresent strategies that the literature identifies as highly relevant, such as life extension, remanufacturing or modular replacement. Because end-of-life pathways were not modelled in detail, potential benefits associated with these strategies are not captured in the present study. Overall, the case study demonstrates that early LCA feedback is critical for selecting appropriate circularity strategies, particularly as the dominant life cycle stage shifts from the use phase in diesel operation to the manufacturing phase under electric operation. Future extensions of the method should therefore incorporate end-of-life modelling and uncertainty analyses to support strategy selection beyond Reduce and Rethink.
6. Conclusion and outlook
The proposed framework supports the identification of components suitable for AM and provides guidance for early, circularity-oriented redesign. Transparency is achieved using normalized criteria, explicit weighting factors and fixed decision thresholds, resulting in a traceable screening score. The approach is intentionally data-lean and relies on a limited number of component descriptors to enable go, backup or park decisions. This allows rapid assessment without requiring fully specified designs or detailed LCA datasets.
The framework is also designed to be applicable in practice. The subsequent R-strategy identification narrows the redesign space and points to concrete design options, such as part consolidation, improved repair access or adapted post-processing, before significant redesign effort is invested. Although conceptually general, the framework was demonstrated using a single structural bus component, showing its applicability and its ability to generate route-specific environmental insights.
Future work should focus on increasing robustness by expanding the empirical basis of the framework and applying it across a wider range of components and industrial contexts. Additional data would improve both the prospective LCA estimation and the R-strategy scoring and could support the development of reference benchmarks for industrial decision-making. Deploying the framework at earlier stages of product development - such as requirement definition, functional decomposition and conceptual design - would further enhance its ability to identify AM opportunities before geometry is fixed. Extending the method beyond single components to subsystem and assembly levels represents another promising direction and would support circular design decisions at broader system levels.
Acknowledgement
The authors would like to thank Daimler Buses for providing data for the case study as this work was supported by the ‘CO2OPERATE’ project (no. 03EI5033D) funded by the Federal Ministry of Economics Affairs and Energy (BMWE) based on a decision by the German Bundestag.



 Open access

