





I
The purpose of this article is to examine the association between the characteristics of individual investors and the extent of their involvement in stock investing. Our primary data sources are the subscription lists of issuing companies, church records and individual tax returns. Drawing extensively from these data and bench marking against general population statistics, we describe the ownership structure of the Swedish stock market and derive stock market participation rates for the Swedish population around the year 1920. It is a period characterized by rapid industrialization, migration from rural to urban areas and the suffrage movement, which challenged traditional gender roles. What role did the stock market play in this dynamic environment? How did the stock market serve the different needs of men and women?
Subscription lists are a new data source that has not been used in previous studies of stock ownership. The lists are a complete specification of investors who purchase new shares based on rights that are attached to ownership of old shares or naked rights that have been purchased from non-participating shareholders. The combined data set covers 125,000 shareholdings by 50,000 shareholders. We derive stock market participation rates by relating the number of subscribers to general population statistics conditional on gender and demographic variables including income, profession, age, marital status and place of birth. The estimation of stock market participation rates in historical markets is the main contribution of this study.
An advantage that we share with other studies of historical data sets is that we observe the final beneficiary of stock ownership without the layer of financial intermediary. A disadvantage relative to survey-based studies of stock ownership in modern markets is that we are limited to univariate analysis. We observe the demographic characteristics of individuals who purchase stocks. Since we do not observe non-participation, we are constrained to derive and analyze stock market participation rates for those data combinations that Statistics Sweden once deemed important. With this limitation in mind, we generate a number of new insights into the functioning of historical stock markets.
In early twentieth-century Sweden, stock market participation was scant, about 1 percent of the population, which is the order of magnitude that has been reported from other historical markets (Rutterford and Sotiropoulos Reference RUTTERFORD and SOTIROPOULOS2017). Stock ownership was concentrated in urban areas. Residents of Stockholm, who constituted 7 percent of the population, owned more than half the stock market, while residents in rural areas with more than 70 percent of the population owned less than 10 percent. The early stock market catered to the interests of society’s elites with sufficient income to purchase stocks after covering food, housing and other essentials. The upper class that we loosely identify as the aristocracy (0.3 percent of the population) owned 10 percent of the stock market, the middle class (20 percent of the population) held the bulk of the stock market (more than 85 percent), while workers and farmers (more than 80 percent of the population) owned the remaining 4 percent. The significant ownership share and the high participation rate (20 percent) of the small Swedish aristocracy is noteworthy on its own because the nobility were deprived of their political power and legal privileges long before. Their ownership stake highlights the importance of inherited wealth, social networks and education for the financial success of future generations.
We have detailed demographic data for Stockholm. Less than 10 percent of the population of Stockholm owned more than 90 percent of the shares (which amounts to half the Swedish stock market), and the top 0.2 percent of the income distribution owned 45 percent. Stock market participation increased with education, marriage and age, which are correlated with income. The typical stock market investor was a married man with a highly paid job in the private sector (directors and merchants), the public sector (civil servants and military officers), or earning income from higher education (doctors, dentists, lawyers, clergy, teachers and engineers). The stock market participation rate was higher for university-educated specialists than it was for businessmen and merchants. A recent report from the Investment Company Institute about current stock ownership in the United States also finds that stock market participation increases with income and education, that it is higher for men, married couples and non-Hispanic whites (Investment Company Institute 2008). While our data do not allow us to estimate the marginal effects of the demographic variables, the Investment Company Institute concludes that, after controlling for the impact of income, all statistical differences disappear except for having access to an employer-sponsored pension plan. We concur with the conclusion that income is a central explanatory variable of stock ownership.
Men and women behave differently over the life cycle. In early twentieth-century Sweden, men first established themselves financially, bought stocks and then married, while women married first and became shareholders through their husbands. Supporting a non-working spouse and children was expensive. Furthermore, men remained active stock market investors into old age, while women depleted their stock portfolios towards the end of life. The likely explanation for this difference in behavior is that married men wanted to support surviving spouses and children. Financially supporting family members was particularly important around 1920, when the mortality risk was much higher than today. The fact that women live longer than men and that men marry (much) younger women increases the need for financial protection against mortality risk. We conclude from these life-cycle patterns that stock market investing supports family formation.
The data set for Stockholm contains two demographic variables that are not included in other studies of stock market participation. First, place of birth that is available from the church records allows us to study the extent to which migrants from rural areas to Stockholm did better or worse than those born in the capital of Sweden. Stock market participation rates among migrants exceeded the rates of those who were born in Stockholm. Whether migrants had higher than average ability or worked harder than native-born residents is not possible to determine. Second, the church records state the congregation where a person was born (Lutheran, Catholic or Jewish). We estimate that the Jews of Stockholm (0.05 percent of the city’s population) owned nearly 5 percent of the Swedish stock market; the participation rate exceeded 10 percent. The Jewish population migrated to Lutheran Sweden from other parts of Europe during the nineteenth century with few resources other than their know-how and an interest in making a good living (Carlsson Reference CARLSSON2021). While there are competing theories regarding the financial success of this religious minority in European history, we limit ourselves to noting their visible role in the early stock market of Sweden. Like other urban investors, the Jewish stock market investors drew income from manufacturing (directors), trade (merchants) and education (doctors, lawyers, teachers, etc.).
Most women became shareholders through marriage, but the data set also displays many single women with stock portfolios. The number of unmarried women in the stock market exceeded the number of widows with stock portfolios. The reason for the large number of single women in the stockholder data set is that there was a surplus of single women in Stockholm. Young men and women migrated from rural areas to Stockholm in search of better employment opportunities. Young women migrated in larger numbers than young men because women may also have been attracted by the prospect of meeting eligible men with higher income than men in rural areas (Edlund Reference EDLUND2005). As a result of the female surplus, many women failed to marry and had to provide for themselves. The church records and the individual tax returns reveal that the unmarried women in the stock market were relatively old (45 years of age), had low income and rarely married later in life. Their individual holdings were typically small but, given the number of such unmarried women, they add up to holding a significant fraction of the stock market. Many single women generated income from work (as factory workers, nurses, schoolteachers and telephone operators), and they were investing given no support from a husband, parents or other relatives. We conclude from these observations that the stock market supported female emancipation.
We build on the pioneering work of Berle and Means (Reference BERLE and MEANS1932) and a sequence of papers that explore stock ownership data from the United Kingdom. The early stock market of the United Kingdom was dominated by rentiers (Acheson et al. Reference ACHESON, CAMPBELL and TURNER2017), while most Swedish stocks were held by the urban middle classes. Most stocks were held directly without a financial intermediary (Acheson et al. Reference ACHESON, CAMPBELL and TURNER2017); stock portfolios were poorly diversified (Sotiropoulos and Rutterford Reference SOTIROPOULOS and RUTTERFORD2018); and ownership of railroad stocks was geographically dispersed across the country with a concentration in the bigger cities (Acheson et al. Reference ACHESON, CAMPBELL, GALLAGHER and TURNER2021). In both countries, unmarried women were a visible investor class (Rutterford and Maltby Reference RUTTERFORD and MALTBY2006; Rutterford et al. Reference RUTTERFORD, GREEN, MALTBY and OWNES2011).
The rest of the article is organized as follows: Section II details the various data sets used in this study. Section III provides an overview of the stock ownership structure of Sweden. Section IV uses detailed demographic data from Stockholm to see how stock market participation varies with income, marital status and place of birth. Section V takes a closer look at the unmarried women in the stock market. Section VI concludes the article.
II
The primary data sources for this study are the subscription lists of issuing companies, the population register administered by the church and individual tax returns. We collect ownership data directly from the subscription lists, but we rely on secondary data sources for all other information. Population data for Stockholm for the period 1878–1926 are available through an easy-to-use search engine (Rotemannen). While this is our main data source, we also collect demographic data from the death register (Sveriges dödbok 1815–2022), the digital research room of the National Archives (Census 1880–1930) and various online data sources (geni.com and ancestry.com). These digital databases have been created to support the growing demand for genealogy. We retrieved income data from the tax calendars for Stockholm and its suburbs every second year for the period 1914–30.
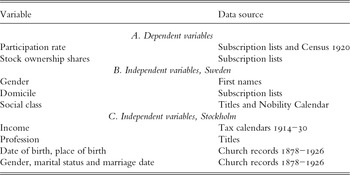
Table 1 is an overview of the data and sources. Panel A lists the data sources that we use to estimate stock market participation rates and stock market ownership shares. Panel B describes the variables collected from the entire data set to condition stock ownership on gender, geography and social class. Panel C describes the data collected specifically for Stockholm residents. Manually collecting these data for all of Sweden would be an overwhelming task. We compute stock market participation rates by relating the number of shareholders to the population statistics from the 1920 census. This approach means that we are limited to analyzing stock market participation for the population categories used by Statistics Sweden at the time. It also means that we are limited to univariate analysis of stock market participation. The remainder of this section explains the data sources in more detail.
Variable specifications and data sources

Table 1 Long description
The table categorizes variables into dependent and independent types, detailing their data sources. Dependent variables like participation rate and stock ownership are sourced from subscription lists and the 1920 Census. Independent variables for Sweden include gender, domicile, and social class, sourced from first names, subscription lists, and titles. For Stockholm, income and profession are derived from tax calendars and titles, while demographic details such as date of birth and marital status are from church records. The table highlights the diverse sources used to gather data, emphasizing the reliance on historical records for demographic and social information.
The table lists the main variables and the data sources. The church records are those contained in Rotemannen.
Subscription lists for Sweden
The Swedish Company Law of 1910 prescribes that old shareholders have preemptive rights to purchase new shares issued by the company. One of many legal requirements surrounding the rights offer is that the issuing company must file a subscription list with the Swedish Company Registration Office. The motivation for the filing requirement is consumer protection. By requiring that the agreement is in writing, the law gives the subscriber ample time to think over the decision to buy shares.
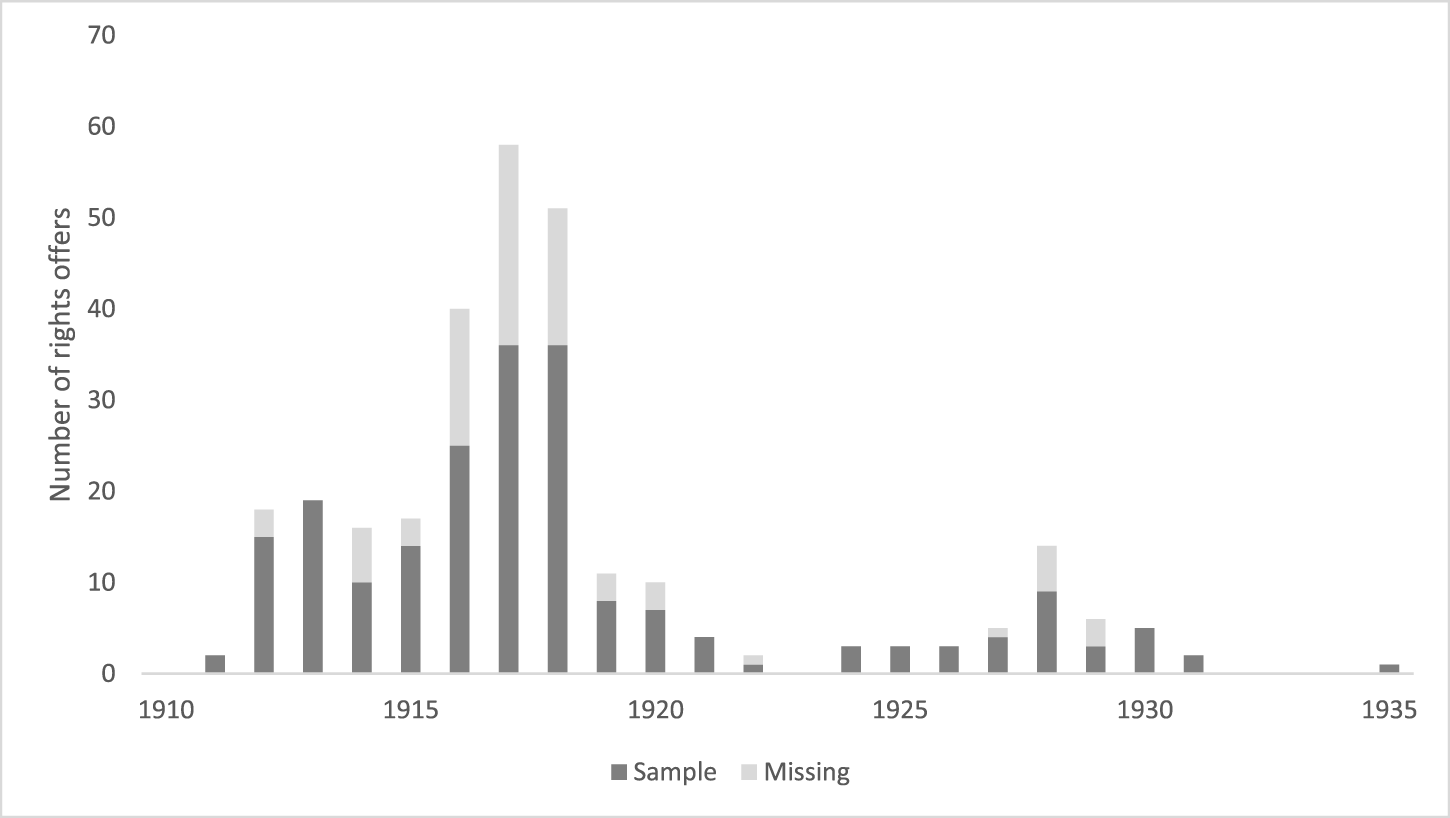
We searched the National Archives and the Swedish Companies Registration Office for subscription lists by companies listed on the Stockholm Stock Exchange from 1912 to 1935. During this period, 220 listed companies made 269 rights offers. The distribution of rights offers had the highest concentration during World War I (Figure 1). In our search for paper documents among hundreds of thousands of documents, we were able to find 184 subscription lists by 101 companies. The 184 rights offers are 166 new issues of common stocks, 11 issues of participating preferred stocks and 7 issues of limited preferred stocks. There are no rights offers of bonds or other debt securities. Only the holders of common stocks and/or participating preferred stocks have preemptive rights to purchase the new shares. Limited preferred stockholders and debtholders do not have preemptive rights.
Distribution of rights offers 1912–35

Figure 1 Long description
A bar graph illustrating the number of rights offers from 1910 to 1935. The x-axis is labeled with years ranging from 1910 to 1935 and the y-axis is labeled 'Number of rights offers' with values from 0 to 70. Each bar represents a year, divided into two categories: 'Sample' and 'Missing'. The graph shows a peak in rights offers around 1915 to 1920, with the highest number reaching over 60. After 1920, the number of offers declines significantly, with smaller peaks around 1930. The bars are visually segmented to indicate the proportion of sample and missing data for each year.
Our objective is to compute stock market participation rates and stock ownership shares of listed Swedish companies. Data are incomplete: (i) the subscription lists are spread out over time; (ii) not all listed companies issue shares (101 of 220 companies); and (iii) we retrieved only a portion of the subscription lists (184 of 269 rights offers). Some subscription lists have been misplaced by the Swedish Company Registration Office, and others have not been filed. As the shareholder base grew, filing lengthy and heavy paper documents became cumbersome. Some companies submitted a one-page statement by the board of directors stating that the company complies with the law and has a subscription list available for inspection. The handling government agent simply approved the statement without requesting a copy of the subscription list.
The data set is neither a cross-section nor a balanced panel. We stack the subscription lists and treat the combined data set as a cross-section of stock market ownership structure in 1920. We ignore the fact that the new issues are spread out over time, that some listed companies issued shares many times and that many listed companies did not issue shares at all. Sampling over a time period that spans 23 years means that our estimates of stock market participation rates are upward biased, at the same time as sampling from a subset of firms that conduct rights offers introduces a downward bias. The net effect of these biases is ambiguous. Furthermore, if the sample characteristics are different from those of the general population, our in-sample estimates of ownership shares may deviate from the population ownership shares.
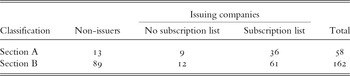
Our sample of subscription lists is biased towards larger companies with a broader shareholder base (Table 2). The Stockholm Stock Exchange sorts regularly traded stocks into Section A and occasionally traded stocks into Section B (Rydqvist and Guo Reference RYDQVIST and GUO2021). Section A stocks traded 50 percent of the days when the Stockholm Stock Exchange was in session, while Section B stocks traded only 3 percent of all business days. Stock market capitalization across all listed firms, averaged across firm-years, is 56 million kronor for Section A companies and 15 million kronor for Section B stocks. The number of shareholders that we obtain from the sample of subscription lists averages 1,050 for Section A stocks and 300 for Section B stocks. It is reassuring that the sample of subscription lists is tilted towards larger stocks with more shareholders. We are likely to capture all the large investors, who participated in many new issues; at the same time we certainly do not include many shareholders with small ownership shares in a single company or a few companies that did not issue new shares. The bias towards larger stocks suggests that the biases in our estimates of participation rates are minor and that in-sample estimates of ownership shares are close to the underlying population shares.
Sample selection
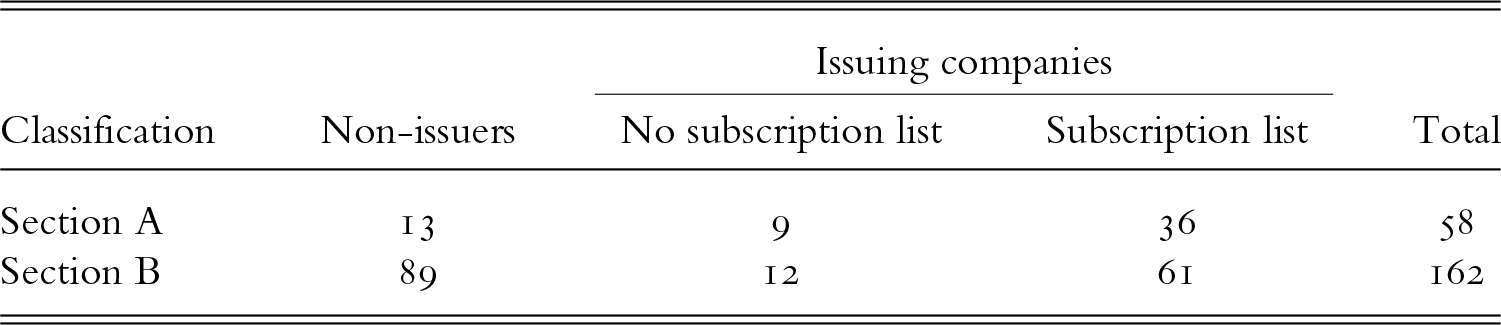
Table 2 Long description
The table compares the number of issuing companies on the Stockholm Stock Exchange between 1912 and 1935, divided into Section A and Section B. Section A has 58 issuing companies, while Section B has 162. In Section A, 36 companies have a subscription list, whereas in Section B, 61 companies have one. Section A has fewer non-issuers, with 13 compared to Section B's 89. The data suggests that Section B had more active participation in terms of issuing companies and subscription lists during the sample period.
The table reports the number of companies listed on the Stockholm Stock Exchange at some point between 1912 and 1935. Section A stocks trade in a daily call auction; Section B stocks only trade upon request by a stock exchange member the day before. Issuing companies carry out at least one rights offer during the sample period. The column ‘Subscription list’ denotes the number of issuing companies for which we retrieved at least one subscription list.
The original subscription lists were handwritten with the subscribers’ signature next to the name, title and address. The company retained the original and submitted a handwritten or typed copy to the Swedish Companies Registration Office. Approximately half of the submitted subscription lists were typed and half handwritten. We used OCR technology to digitize the data from the typed subscription lists, and we retyped the handwritten lists. The complete data set consists of 125,000 rows of bidding information. Most firms appear only once, but a few firms carried out multiple rights offers with nine being the maximum.
The design varies widely. Most subscription lists spell out the subscriber’s first name and family name, but middle names are mostly left out or replaced by initials. Some subscribers, especially women, preferred nicknames to given names. For the most part, the stated address was the residential address, but some subscribers used their stockbroker’s address. In companies with few shareholders, the name of the subscriber was sufficient and street addresses and titles have been omitted. Over time as the shareholder base expanded and stock ownership became anonymous, the subscription lists were completed more fully.
Before matching the ownership data with other demographic data sources, we standardized the information such that each subscriber’s name, address and title were the same everywhere. To do this, we sorted the stacked data set by Excel such that names, titles and addresses that look alike appear together. Based on logical rules, judgement and knowledge of the Swedish language, we gave each subscriber a unique name, title and address. Standardization is needed for many reasons. First, subscribers presented themselves differently from one occasion to the next: names were fully spelled out, represented by initials, abbreviated, substituted by nicknames, and first names may or may not have been supplemented by middle names. Second, Sweden carried out a spelling reform in 1907 with the objective of standardizing spelling, but it took several decades for the reform to fully sink in across the population. The spelling of the same name depends on the record keeper for the day. Third, titles change over time: an unmarried woman gets married then becomes widowed, a lieutenant becomes captain then gets promoted to major, etc. Fourth, people switch residential address frequently, in some cases, several times a year. Typed names and fully written names are relatively easy to standardize, while handwritten initials are notoriously difficult to get right. There may be transcription errors in copying the original handwritten document, meaning the name and initials may not be correct in the typed version.
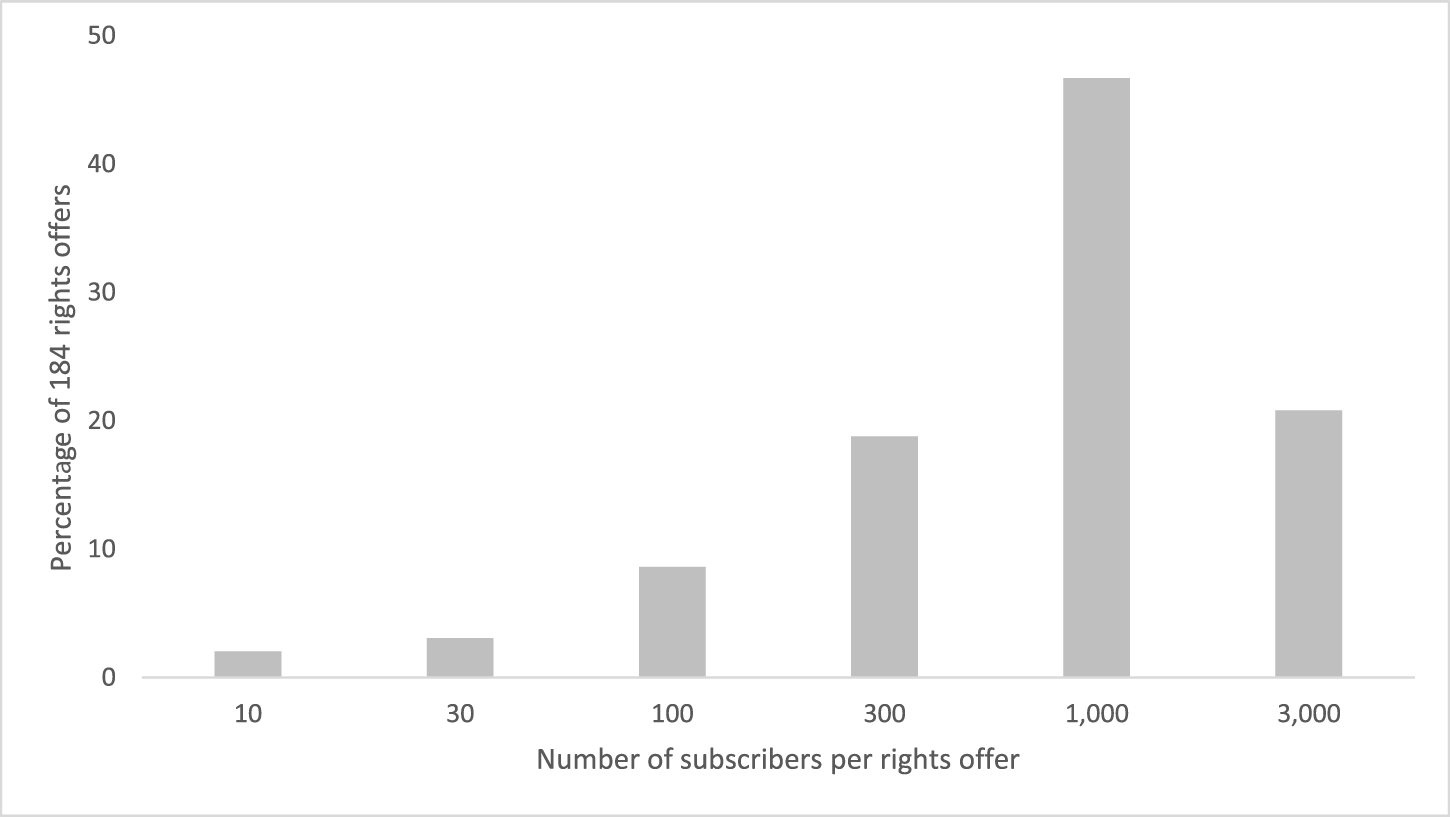
The number of subscribers per rights offer varies from as few as 10 to more than 3,000 (Figure 2). One-fifth of the issuing companies had 3,000 subscribers, half of the companies had 1,000 subscribers, and the remaining three-tenths of the companies between 10 and 300 subscribers. The number of subscribers equals approximately the number of shareholders. The numbers are small by modern standards, and they are small in comparison with those of a representative sample of listed UK companies around 1920 (Rutterford et al. Reference RUTTERFORD, SOTIROPOULOS and VAN LIESHOUT2017) and large US corporations in 1929 (Berle and Means Reference BERLE and MEANS1932). The small number of shareholders per firm makes this research project feasible.
Number of subscribers per rights offer
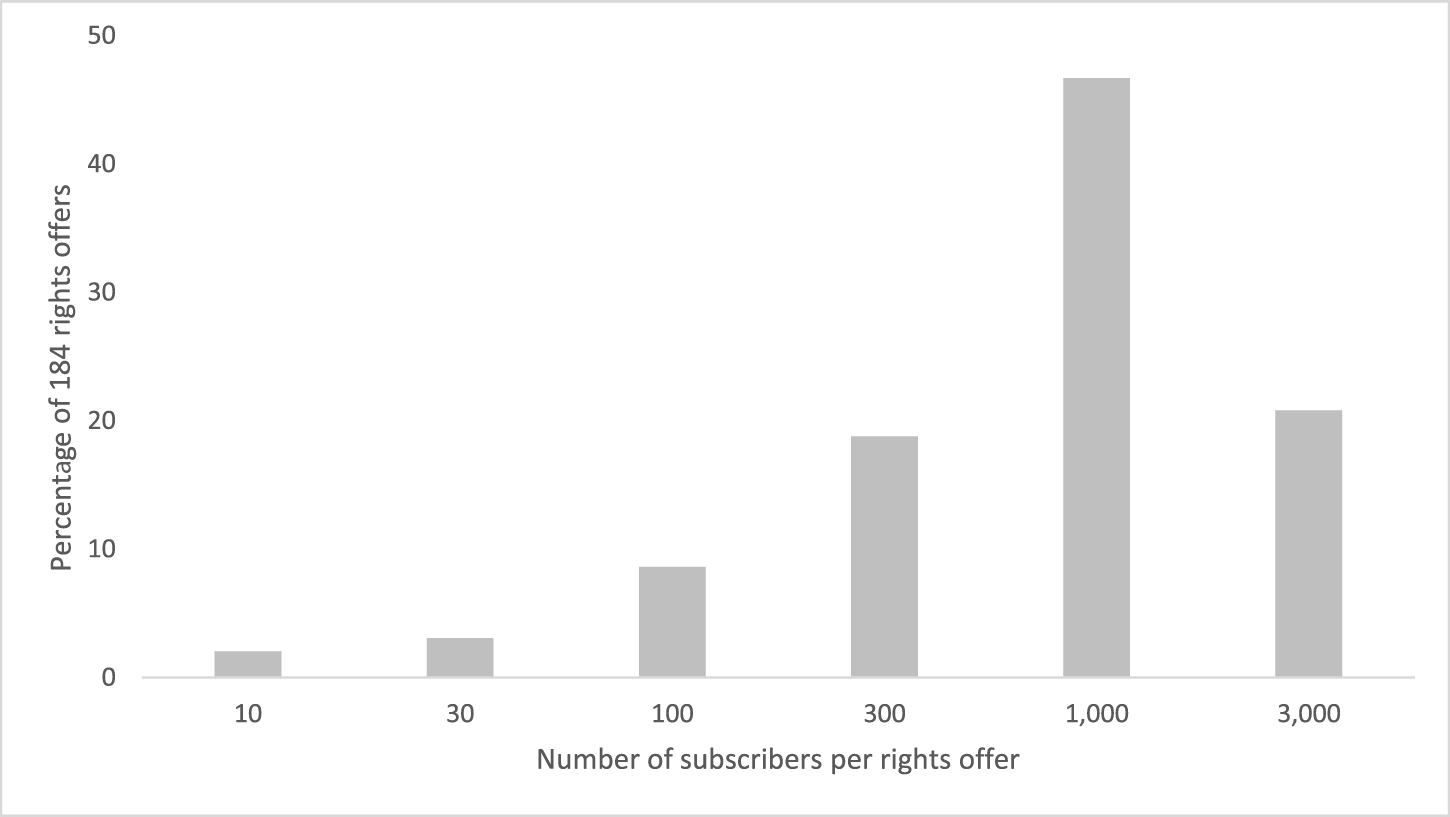
Figure 2 Long description
A bar graph showing the percent of 184 rights offers based on the number of subscribers per offer. The x-axis is labeled 'Number of subscribers per rights offer' with values 10, 30, 100, 300, 1,000 and 3,000. The y-axis is labeled 'Percent of 184 rights offers' ranging from 0 to 50. The bars represent the following approximate percentages: 10 subscribers at about 2 percent, 30 subscribers at about 3 percent, 100 subscribers at about 10 percent, 300 subscribers at about 15 percent, 1,000 subscribers at about 45 percent and 3,000 subscribers at about 25 percent.
Demographic data for Stockholm
The population registry specifies the complete set of names, birth date, place of birth (church or congregation), and the complete history of residential addresses, titles and marital status for residents of Stockholm. We accessed these data through the digital database Rotemannen, which covers every person who lived in the city of Stockholm at some point between 1878 and 1926. It specifies the date of entry into Stockholm and the date of exit. A limitation for our purposes is that many residents of Stockholm moved to the suburbs during the period we study and then disappear from the database.
We matched the ownership data from the subscription lists with the demographic data from the church records by name, title and street address. The aristocracy and the middle classes have uncommon names that make them relatively easy to identify. Members of the aristocracy, especially women, have many middle names that uniquely identify the person. Workers, on the other hand, have common names and most of the time no middle names, which means that workers can only be identified by matching the street address exactly. Men from the middle classes have distinct professional titles that make them easy to identify even when the street address does not match. The title information for women is less useful because it refers to the woman’s marital status. With the complete set of names and the date of birth, we are able to identify the individual in numerous other databases including Google searches. Outside sources matter for obtaining information for the many individuals who moved from Stockholm to the suburbs.
The population data are organized around households: head of household, spouse, children, other relatives (father, mother, siblings), servants living in the household and unrelated renters of free space in the household. We group the shareholders into households. Most of the time, the head of the household held the shares in his own name, but there are numerous cases where the shareholder was either the spouse or the children of the household head. When grown-up children or siblings lived in the same household, we treat them as separate households to reduce the complexity of the task at hand.
Tax returns for Stockholm
Tax returns are public information. For this study, we manually retrieved income from the tax calendars of Stockholm every even year from 1914 to 1930. Each calendar reports taxable income two years back, i.e. the calendar for 1914 reports taxable income for 1912, etc. The calendars were sorted alphabetically by family name and title. Names are robust apart from minor variation in spelling, while titles vary substantially over time and between data sources. For the aristocracy and the middle classes, the family name is often sufficient to identify the person in the tax calendar. For individuals with common names, the complete set of first names makes matching possible; the initials in the tax calendars usually follow the same order as in the population registry. Husband and wife appear together (two separate rows), and we added their incomes. Sweden has a dual income tax system, and the tax calendar reports two incomes. We retrieved both and used the higher income for our analysis. Reported income is the sum of labor income, rental income, dividends and capital gains.
III
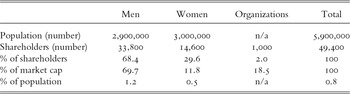
We emphasize four traits of aggregate stock ownership structure (Table 3). (i) Most stock ownership was direct without financial intermediary. Organizations owned 18.5 percent. These ownership shares arose when corporations held controlling shares in other listed corporations (pyramid ownership structures). Many small companies also invested in stocks. A few closed-end funds owned 2.8 percent of the stock market. (ii) Nearly 30 percent of the shareholders were women. The fairly large number of women in the stock market is a bit surprising given the patriarchal organization of society where a daughter passed from father to husband. A large presence of female investors was also a feature of early stock markets in the United Kingdom (Rutterford et al. Reference RUTTERFORD, GREEN, MALTBY and OWNES2011). (iii) There were few foreign investors in the Swedish market. In modern data, the foreign stock market ownership share is about 40 percent (Sundqvist Reference SUNDQVIST1985). A few shareholders in the subscription lists reported a foreign mailing address, but most of them had Swedish names. A few Swedish companies placed their newly issued shares in London, Brussels and New York. The ultimate ownership of these shares among foreign investors cannot be traced from the subscription lists. (iv) The stock market participation rate was 0.8 percent (the bottom row of Table 3). It was slightly higher for men (1.2 percent) than for women (0.5 percent). Historical participation rates were much lower than in modern stock markets, where the participation rate exceeds 50 percent (see Investment Company Institute 2008 for the United States). The higher participation rate today is probably the result of higher per-capita income and longer life expectancy. Employment contracts that offer stock market investments as an alternative to traditional pensions also raise stock market participation.
Stock ownership structure of Sweden 1920
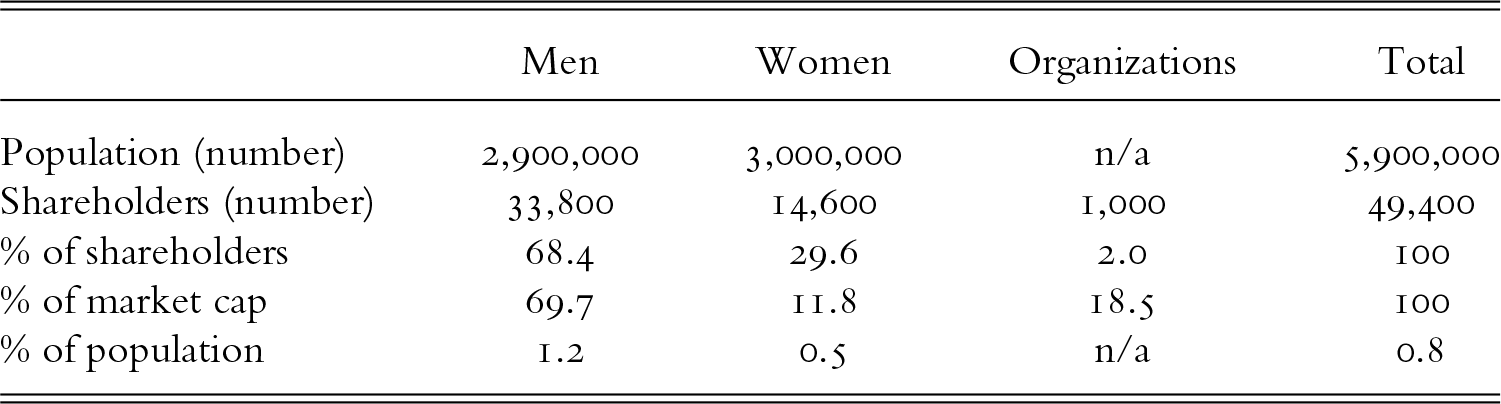
Table 3 Long description
The table presents the stock ownership structure in Sweden in 1920, categorizing shareholders by gender and organizations. Men comprised 68.4% of shareholders, women 29.6%, and organizations 2%. Despite men being only 1.2% of the population, they controlled 69.7% of the market capitalization. Women, representing 0.5% of the population, held 11.8% of the market cap. Organizations, though a small percentage of shareholders, accounted for 18.5% of the market cap. The data highlights a significant gender disparity in stock ownership and market influence during this period.
We construct the table from the shareholder information in 184 subscription lists and the Statistical Yearbook 1925, table 8. The numbers have been rounded. We sort the shareholders into gender by first name and title. We are unable to identify the gender of about 2,000 shareholders. The table does not include the very large subscriptions by Arthur Gullberg and Higginson & Co. in partnership with the Swedish Match Company. These shares were purchased for distribution in foreign stock markets.
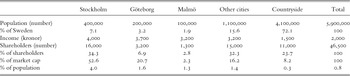
Stock ownership was dispersed across Sweden with a concentration in urban areas (Table 4). One-third of the shareholders resided in Stockholm with an ownership share of half the market. Since most people lived in rural areas (72.1 percent), the stock market participation rate was much higher in Stockholm (4.0 percent) than in the countryside (0.3 percent). Average income in Stockholm (4,000 kronor) was higher than average income in the countryside (1,500 kronor). Another contributing factor is that many listed companies had their headquarters and production facilities located in Stockholm, which means that they were better known to residents of Stockholm than to people who lived farther away. In any case, it is interesting that stock market investments had already spread to remote places by 1920.
Geographic distribution of stock ownership in Sweden 1920
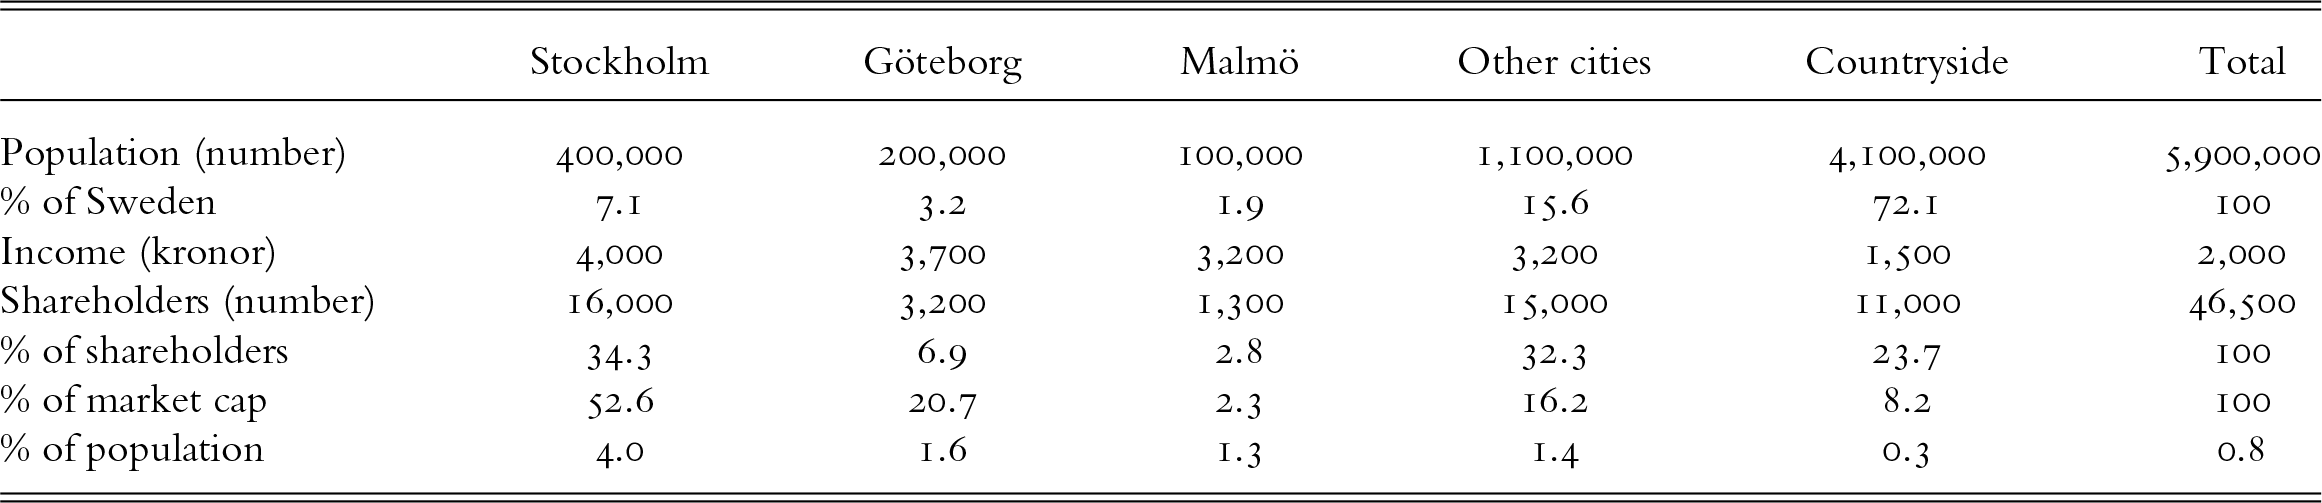
Table 4 Long description
The table presents the geographic distribution of stock ownership in Sweden in 1920, comparing population, income, shareholders, and market capitalization across regions. Stockholm, despite having only 7.1% of the population, accounts for 52.6% of the market cap and 34.3% of shareholders, indicating a concentration of wealth and stock ownership. In contrast, the countryside, with 72.1% of the population, holds only 8.2% of the market cap and 23.7% of shareholders, suggesting limited stock ownership relative to its population size. Göteborg and Malmö have moderate shares of market cap and shareholders compared to their population sizes. The data highlights disparities in stock ownership and market influence across different regions, with urban areas showing higher economic activity and stock market participation than rural areas.
We construct the table from the shareholder information in 184 subscription lists and the Statistical Yearbook 1925, table 10. The numbers have been rounded. Average annual income per employee originates from the Swedish Census 1920 (Folkräkningen 1920, part 4, table G). The number of shareholders is less than in Table 2 because residential addresses are partly missing.
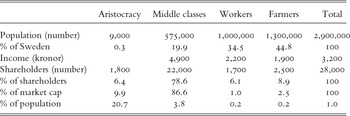
Next, we organize stock ownership data by socioeconomic status. The year 1920 falls somewhere in the transition between the old class society, with political power in the hands of the aristocrats and priests, and modern society based on ‘one person, one vote’. We chose to mix concepts by organizing society into aristocracy, middle classes, workers and farmers. We identify members of the aristocracy by the family name according to the Swedish Calendar of Nobility and various lists available from Wikipedia. The Swedish aristocracy is divided into nobility with titles (dukes, counts and barons), nobility without title and unintroduced nobility, who gained their title in another country. For all others, we identify socioeconomic status through their professional titles. This method works for men, who identify themselves through their profession, but it doesn’t include women, who mostly refer to themselves by their marital status. Hence, our analysis of socioeconomic status is based on the male portion of the data set.
A number of patterns emerge from Table 5. (i) The middle classes dominated the stock market with an ownership share of 86.6 percent. Members of the middle classes derived income from business (merchants, managers, business owners, etc.) or higher education (physicians, lawyers, military officers, teachers, government officials, etc.). (ii) The aristocracy, which by 1920 represented 0.3 percent of the population, owned nearly 10 percent of the stock market. Their stock market participation rate of 20.7 percent exceeded by far the stock market participation rate of the general population. The aristocracy gained their prominent position in society in the seventeenth and eighteenth centuries, and in some cases even farther back. (iii) Workers and farmers, who constituted 79.3 percent of Sweden’s population 1920, together held a small share of the stock market, about 3.5 percent. Their stock market participation rate was merely 0.2 percent. Given the low income of workers and farmers, their presence in the stock market is nevertheless noteworthy.
Socioeconomic distribution of stock ownership in Sweden 1920
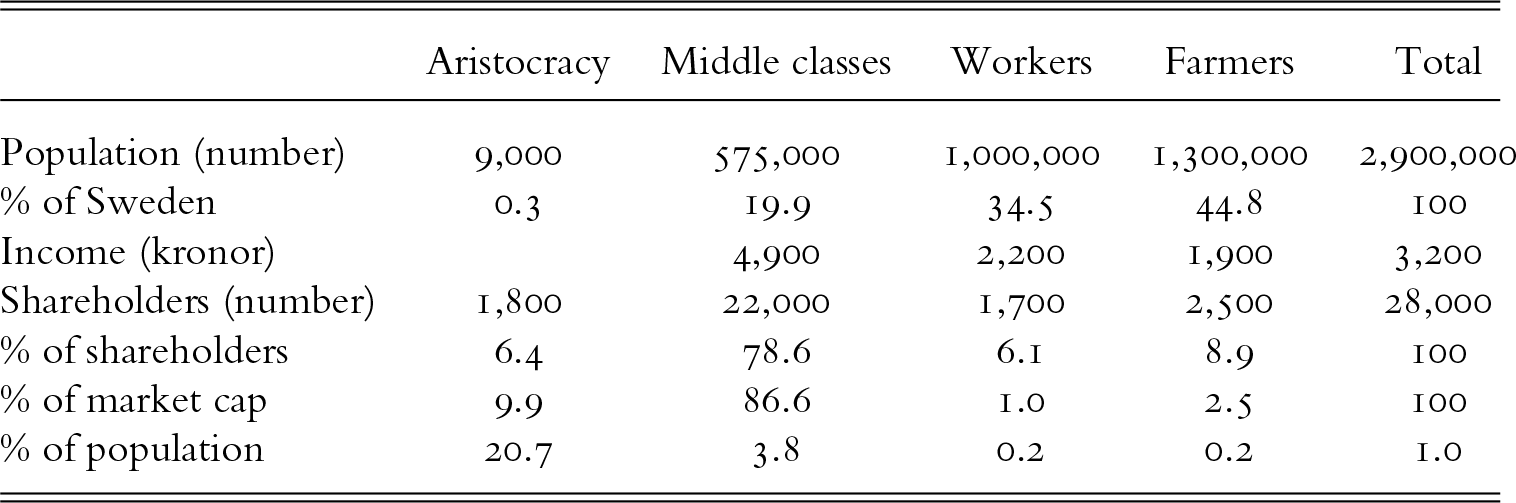
Table 5 Long description
The table examines the socioeconomic distribution of stock ownership in Sweden in 1920, focusing on aristocracy, middle classes, workers, and farmers. Middle classes, while comprising 19.9% of the population, held 86.6% of the stock market capitalization. Aristocrats, though only 0.3% of the population, owned 9.9% of the market cap. Workers and farmers, making up 79.3% of the population, collectively held just 3.5% of the market cap. The average income for middle classes was 4,900 kronor, significantly higher than workers and farmers, who earned 2,200 and 1,900 kronor respectively. The data suggests a concentration of stock ownership among the middle classes, with aristocrats also holding a notable share despite their small population size.
We construct the table from the shareholder information in 184 subscription lists and the Statistical Yearbook 1925, table 10. We base the estimation of social status on the professional titles of men. Professional titles are missing for about 7,000 shareholders. We identify members of the aristocracy by their family name. The number of aristocrats has been estimated by multiplying the total male population by 0.3, which is the percentage of the population consisting of the aristocracy around 1920 (Lindqvist Reference LINDQVIST2022). The annual income per employee has been taken from the Swedish Census 1920 (Folkräkningen 1920, part 5, table 1). We have no information about the average income of the aristocracy.
IV
In this section, we take a closer look at the stock ownership structure of Stockholm. The motivation is that we have more detailed information about the shareholders of Stockholm. One important difference is that we treat a married woman as a shareholder through her husband. Accordingly, we measure stock market participation at the household level rather than individually, which consequently raises the participation rate (see Tables A1–A5 in the Appendix). For continuity between the tables, we carry forward the children even though we do not have data about how many children owned stocks through their parents.
Income
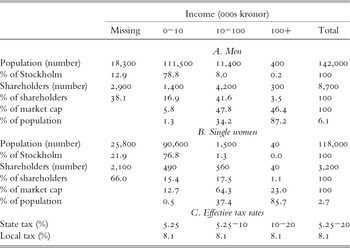
The Census of 1920 reports the income distribution among residents of Stockholm. Our objective is to compare the income distribution of the shareholders with the general income distribution of Stockholm and compute stock market participation rates by income bracket for men and women separately. The number of working men with income (142,000) exceeded the number of working women with income (118,000) because married women often worked in the home. Therefore, with respect to women, we limit ourselves to computing stock market participation rates for single women (never married and previously married).
Stock market participation increased with income for both men and women (Table A1). The participation rate in the lowest income bracket (below 10,000 kronor) was 1.3 percent for men and 0.5 percent for women. In the highest income bracket (above 100,000 kronor), it was close to 100 percent for both men and women. Shares were expensive to buy and there were no mutual funds that offered stock portfolios at a low price to low-income people. Shares in closed-end funds were as expensive as other shares to buy because these funds had not been created to offer low-cost diversification. Data exhibit a high degree of wealth inequality in society. The few men in the highest income bracket (0.2 percent) held nearly half the value of all shares (46.4 percent).
Income taxation was light by modern standards. The local tax was proportional at 8.1 percent of income, and the central tax was progressive with a maximum marginal tax rate of 26.25 percent, which kicked in at a taxable income of around one million kronor. At income above one million kronor, the marginal tax rate dropped to zero, which resulted in a maximum effective tax rate of 20 percent regardless of income. If we treat missing observations as low income, more than 90 percent of the male population and 98 percent of the women paid 5.25 percent of income to the central government. Few individuals paid more than 10 percent. Seven shareholders reported taxable income above the highest breakpoint.
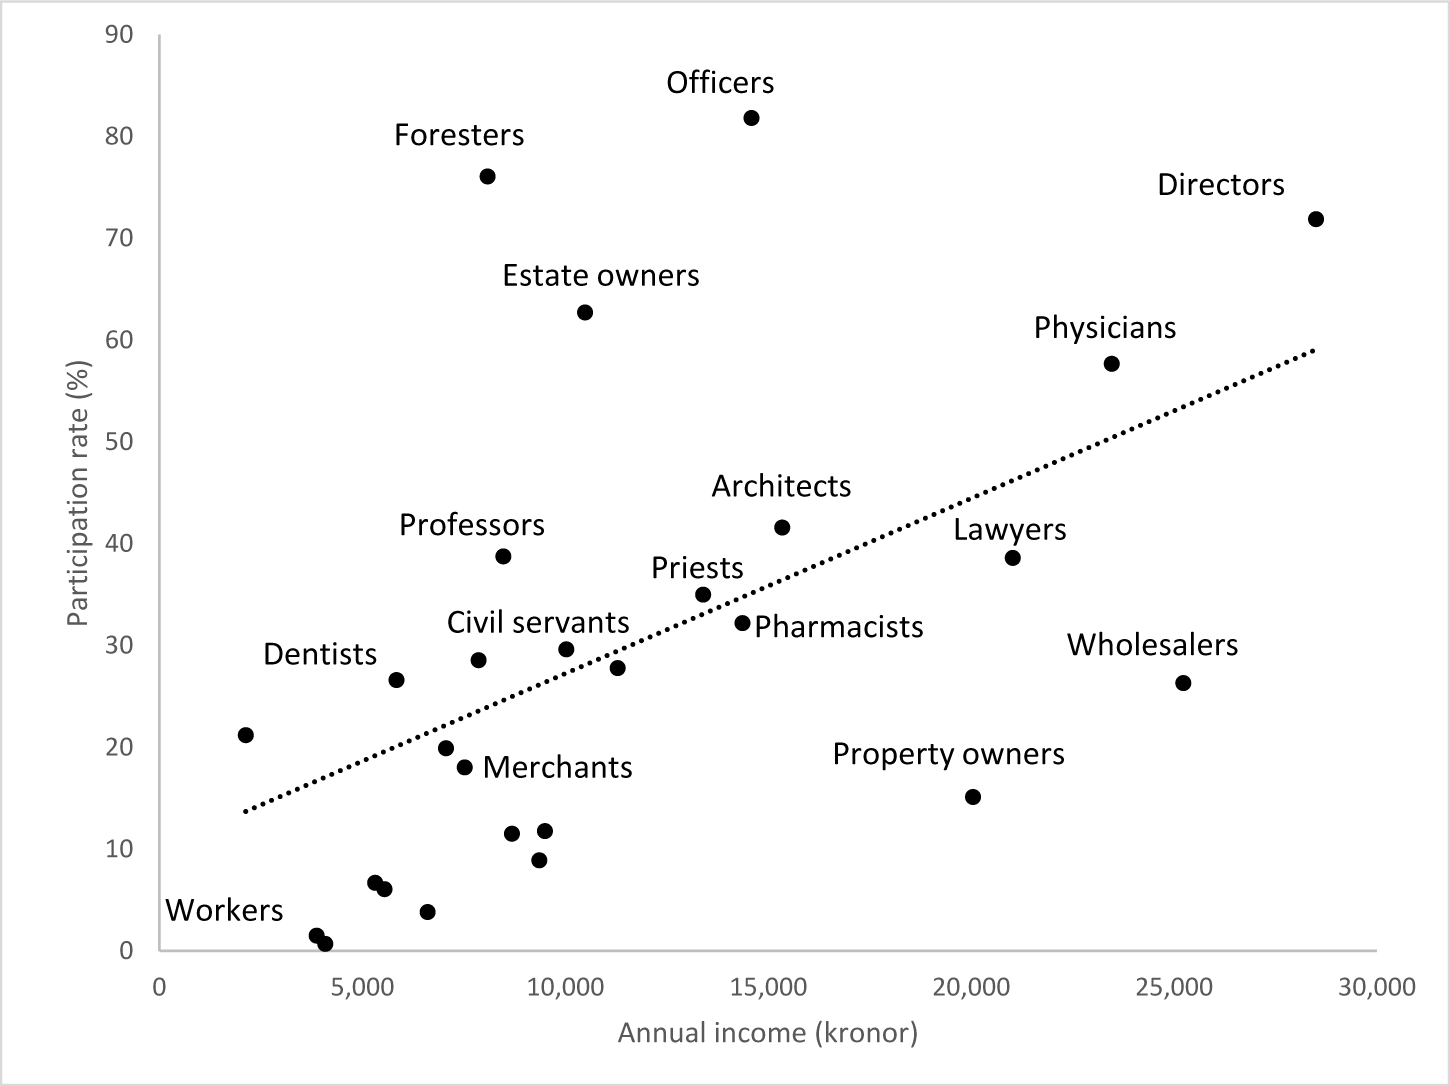
The Census of 1920 also reports the number of individuals and aggregate income by profession. Based on professional titles for men, we compute the stock market participation rate for 27 professional categories and plot those rates against average income as reported in the census statistics (Figure 3). High-income earners were largely present in the stock market, while only a small proportion of workers and other low-income earners bought stocks.
Stock market participation and income by profession for men
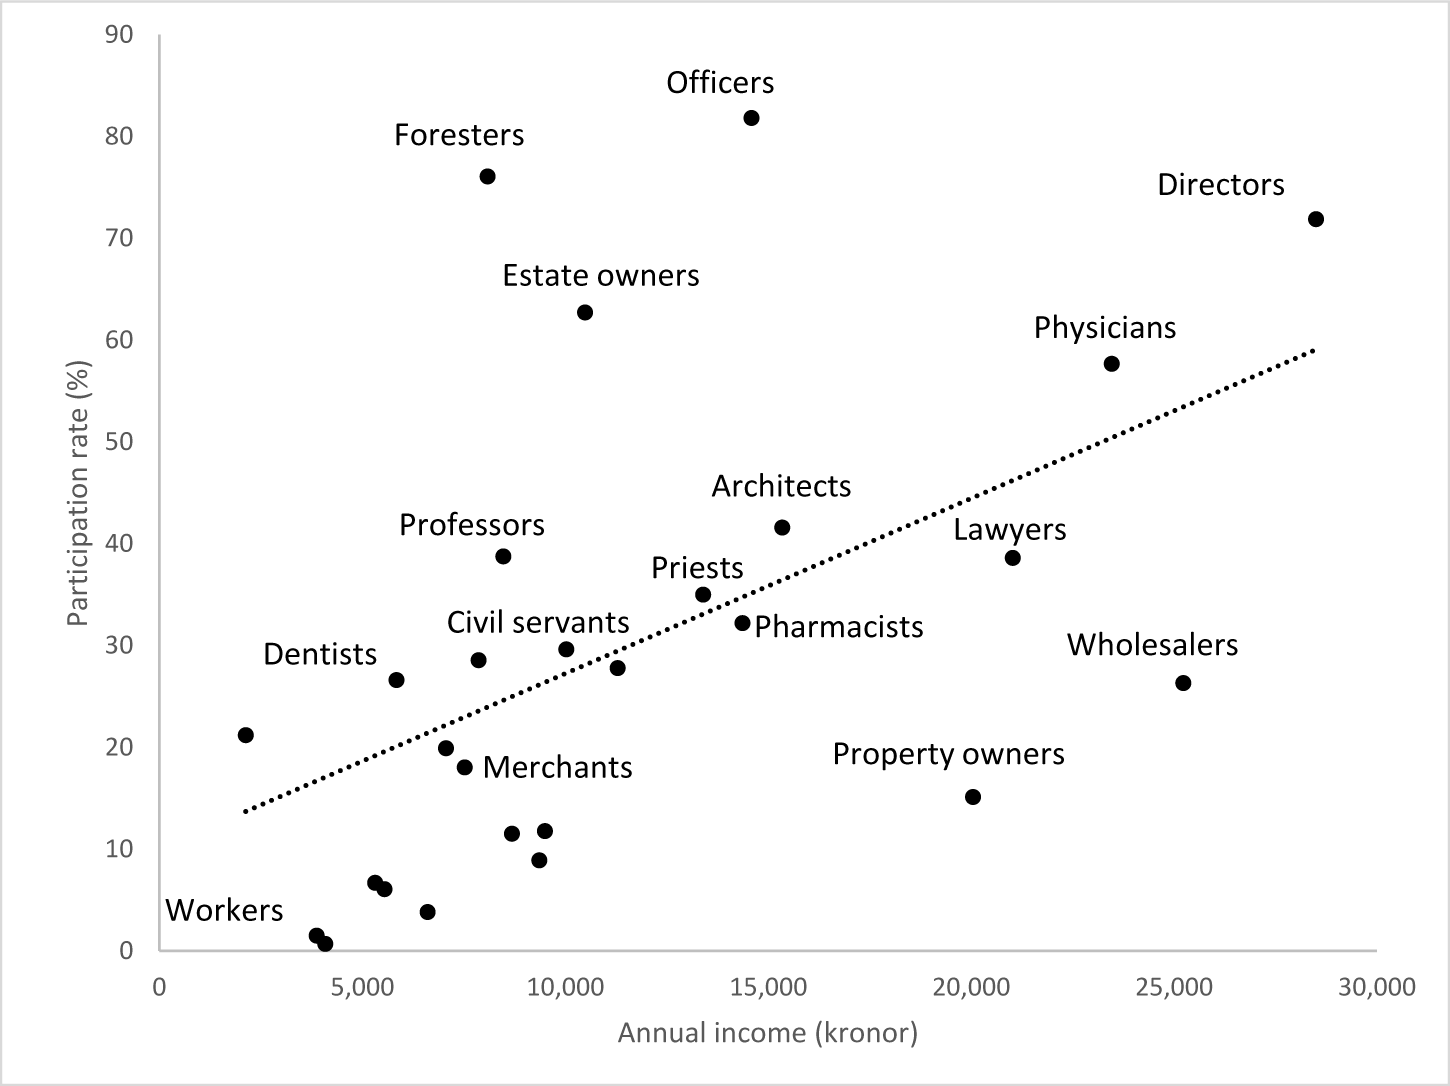
Figure 3 Long description
A scatter plot showing the relationship between annual income in kronor (x-axis) and participation rate in percentage (y-axis) for different professions. The plot includes data points for workers, dentists, civil servants, professors, priests, pharmacists, architects, merchants, property owners, lawyers, wholesalers, physicians, directors, officers, foresters and estate owners. A dotted trend line indicates a positive correlation between income and participation rate. Workers have the lowest participation rate and income, while directors and officers have higher rates and incomes.
Many professions above the trend line required university-level education: architects, dentists, foresters, lawyers, physicians, priests, professors and military officers. Based on professional titles, we estimate that approximately one-third of the shareholders of Stockholm had a university-level degree. The estimate is uncertain because the common titles Director and Engineer include many individuals without a university degree. We know from modern stock ownership data that higher education is associated with above-average stock market participation (Haliassos and Bertaut Reference HALIASSOS and BERTAUT1995; Campbell Reference CAMPBELL2006). University education leads to employment that generates high labor income during one’s working life and loss of labor income in retirement. Income from stock market investments is a vehicle for those people to support life in retirement. An alternative interpretation is that stock ownership and higher education may require financially well-off parents or inherited wealth.
Below the trend line, we find many professions that are associated with business ownership: merchants, pharmacists, property owners, wholesalers and self-employed craftsmen. Business owners exhibit less than average stock market participation also in modern data (Shum and Faig Reference SHUM and FAIG2006). There are many reasons why business ownership substitutes for stock market investments: (i) the business may require ongoing investments that crowd out alternative investments; (ii) a business can be passed on to someone else and generate investment income after the owner retires from work; (iii) the business is risky and a risk-averse business owner may not be willing to increase risk exposure by investing in stocks (Faig and Shum Reference FAIG and SHUM2002).
Military officers exhibit the highest stock market participation rate among the 27 professional categories. Army officers include captains, colonels, generals, navy commanders, admirals, etc. The official salary range for captains and majors was 5,160–7,860 kronor, which is much less than the average income of 14,600 kronor in Figure 3 and even less than the average of 32,900 kronor among shareholders with military titles. There are two explanations for the discrepancy in income between the official pay schedule and taxable income. (i) Before 1915, the role of military commander was a part-time occupation, and many individuals with high administrative positions in the private sector were also military officers (Granholm Reference GRANHOLM2013). The bulk of our data set covers World War I, and many individuals may have preferred to refer to themselves by their military title rather than using the civilian title Director. (ii) Traditionally, the military and the navy were attractive employers for the aristocracy with inherited wealth. According to our shareholder data, about one-third of the aristocracy of Stockholm served in the military.
Civil servants were prominent buyers of equities. We find them in the center of Figure 3 with a stock market participation rate of 30 percent and an average income of 10,000 kronor. Civil servants include court judges, officials of the central bureaucracy and top politicians (ministers). Many higher officials were aristocrats who served at the Royal Court. Another third of the aristocracy of Stockholm were government employees.
Finally, we notice the stock ownership of the clergy. Priests exhibit a stock market participation rate of 30 percent with an average annual income of 13,000 kronor. Ministers of the Swedish Church were highly paid employees of the state church. In 1920 they earned, on average, four times as much as skilled workers; they had families to support. In contrast, Catholic priests received a small stipend but were esentially unsalaried, and had no family to support.
Marriage
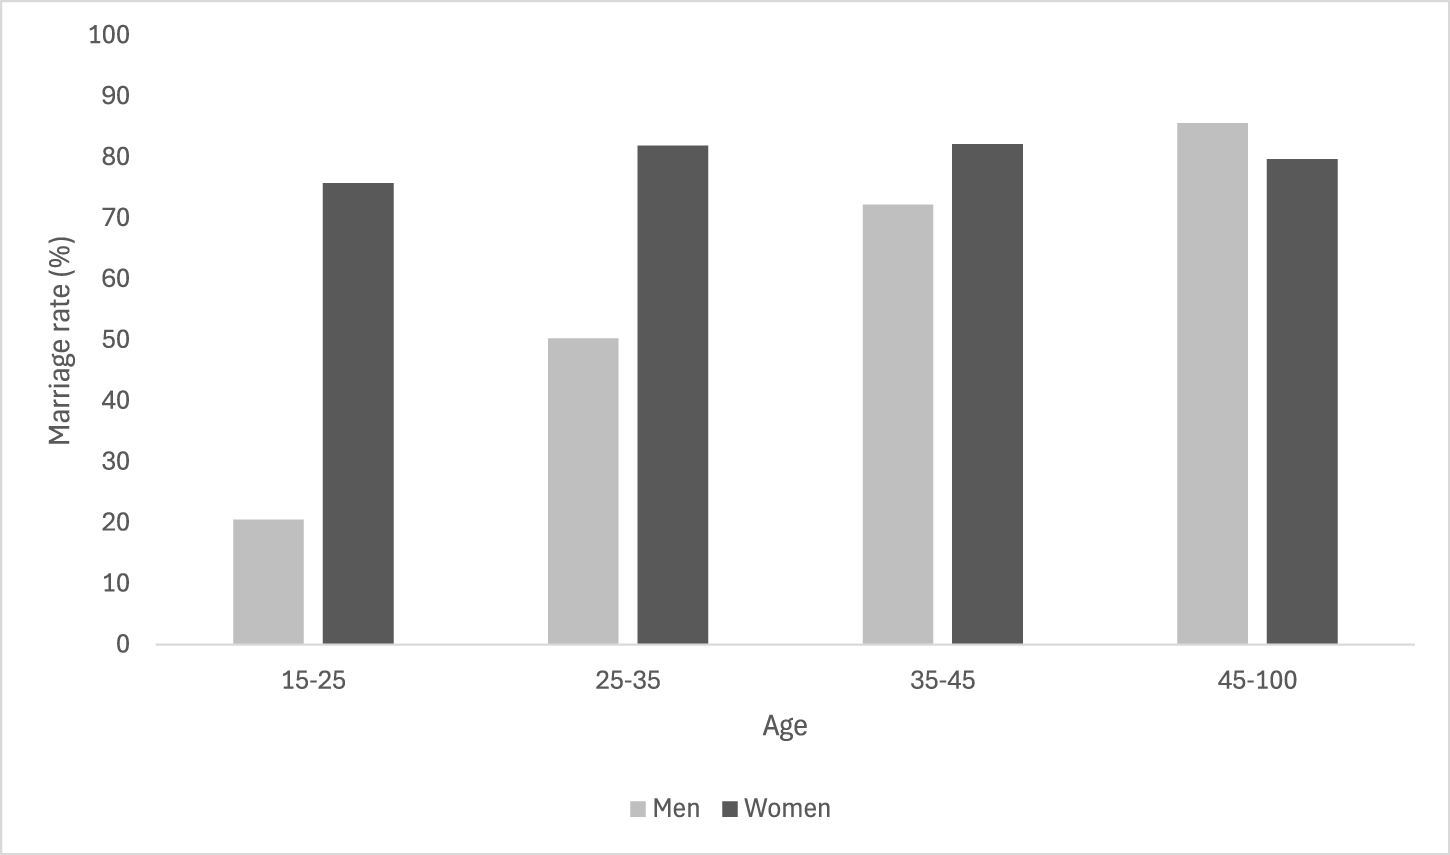
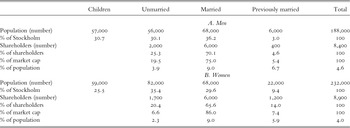
Married couples dominated the stock market with an ownership share of 75 percent and a participation rate of 9 percent (Table A2). Marriage meant that the man had established himself in society with sufficient income to support a non-working spouse and children.
The stock market participation rate for men increased with age, while the participation rate for women exceeded 75 percent at all ages (Figure 4). The difference in marriage rate between men and women over the life cycle suggests that men bought stocks before marriage, while women became stockholders through marriage.
Stock market participation and marriage over the life cycle

Figure 4 Long description
A bar graph displays marriage rates by age group for men and women. The x-axis represents age groups: 15 to 25, 25 to 35, 35 to 45 and 45 to 100. The y-axis shows the marriage rate in percentage from 0 to 100. For ages 15 to 25, men have a lower marriage rate than women. In the 25 to 35 age group, the marriage rate for men is lower than for women. For ages 35 to 45, the marriage rate for men is slightly lower than for women. In the 45 to 100 age group, the marriage rates for men and women are similar. The legend indicates men and women are represented by different shades.
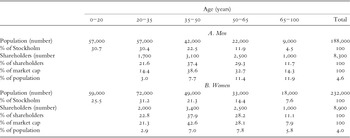
Shareholders were older than the general population (Table A3). Men age 50 and above held more than 40 percent of the shares. The higher stock market participation rate among the elderly is not surprising given that income increases with age. In the shareholder population of Stockholm in 1920, income grew about three times over the life cycle (in real terms), which is considerably more than in modern data, where real income for men with a university degree approximately doubles.
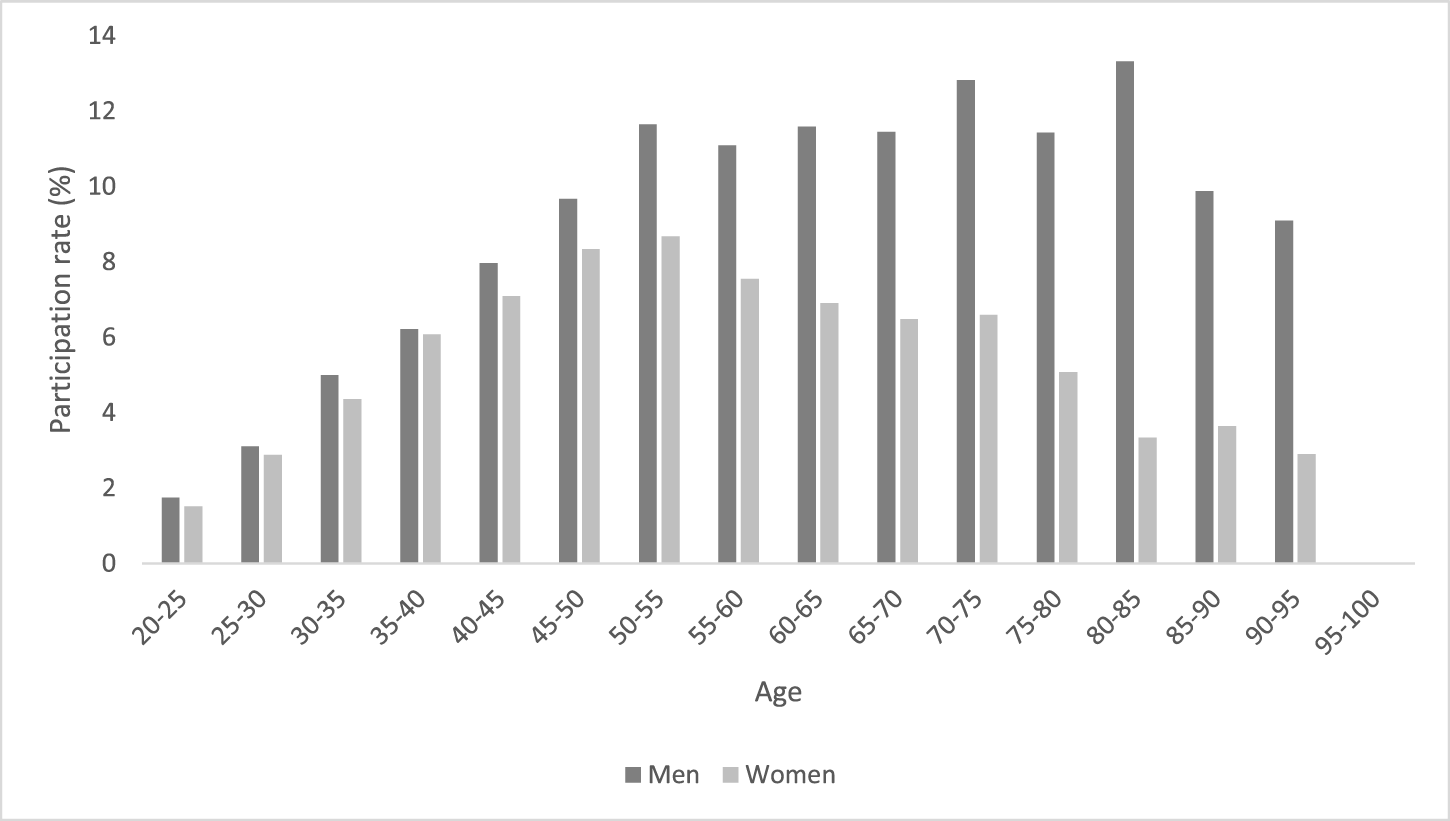
The participation rate of men levels out in old age, while the participation rate of women drops off (Figure 5). A quadratic regression model through the 15 data points for men and women, respectively, implies that the participation rate of men peaked at age 70 and remained high for the rest of their lives, while that of women peaked at age 55 and then decreased. Men remained active investors in old age to support a surviving spouse and children. Some older women were active stock market investors as they may have wanted to retain financial wealth for grown-up children or other relatives under their protection.
Stock market participation over the life cycle

Figure 5 Long description
A bar graph showing stock market participation rates by age group for men and women. The x-axis represents age groups from 20 to 25 up to 95 to 100. The y-axis represents participation rate in percentage, ranging from 0 to 14. Men have higher participation rates across most age groups, peaking at 70 to 75. Women's participation peaks at 50 to 55 and declines thereafter. The graph illustrates a general trend of higher participation in older age groups for men compared to women.
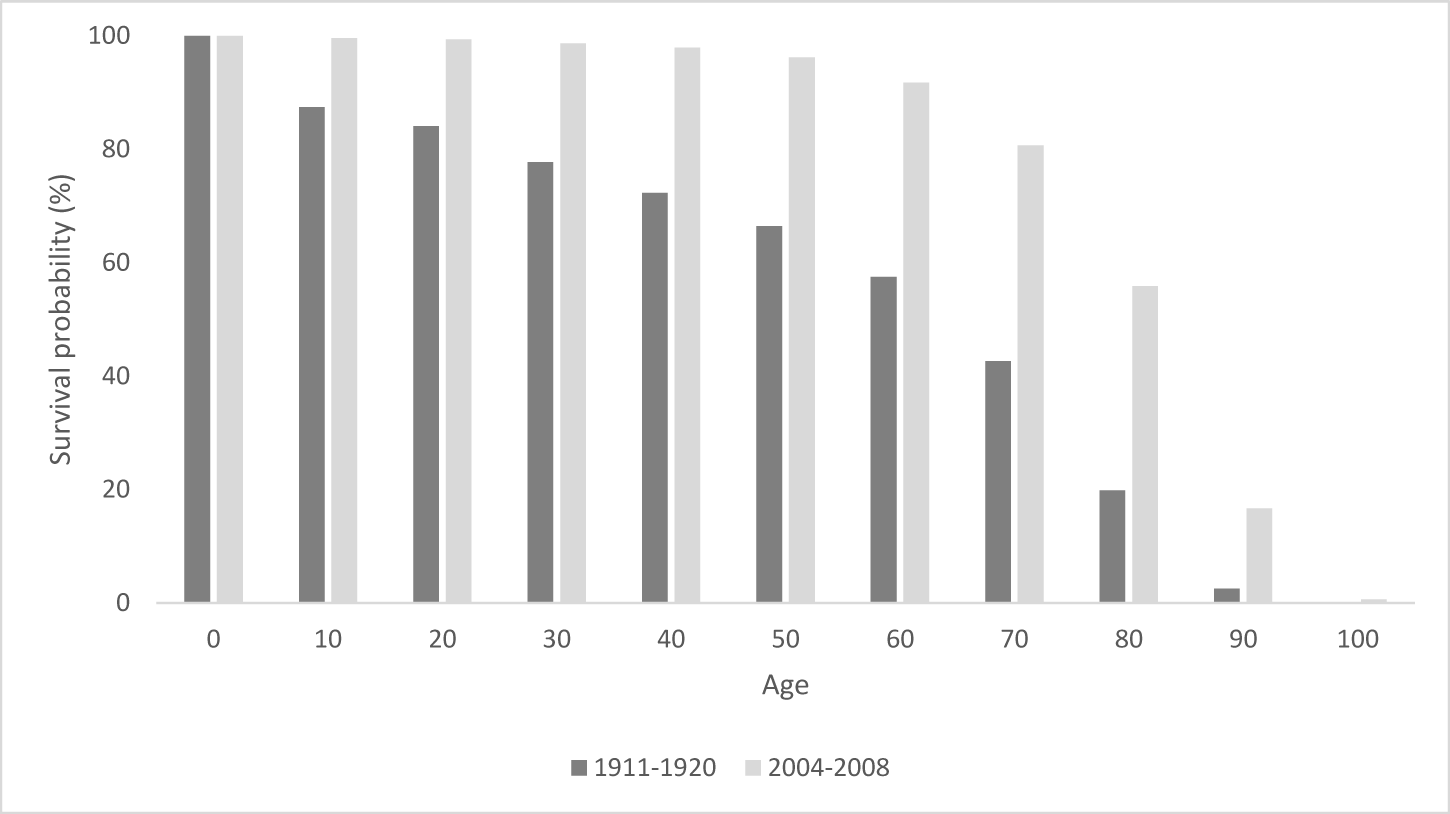
Financially supporting family members was important because the mortality risk was high. In 1920, the probability that a man would live to the age of 50 was only 66 percent compared to more than 96 percent today (Figure 6). Medical advances and a higher standard of living have reduced the mortality risk over time. The fact that women live longer than men increases the need for a man to financially support surviving family members. The difference in survival probabilities for men and women increases with age and becomes quite remarkable in older age. For example, in 1920 the probability that a woman would live to the age of 80 was 37 percent compared to a man for whom the probability was 20 percent.
Survival probability over the life cycle for men, 1911–20 and 2004–8

Figure 6 Long description
A bar graph comparing survival probability by age for two periods: 1911 to 1920 and 2004 to 2008. The x-axis represents age, ranging from 0 to 100 and the y-axis represents survival probability in percentage, ranging from 0 to 100. For each age group, two bars are shown: one for 1911 to 1920 and another for 2004 to 2008. The graph shows higher survival probabilities in 2004 to 2008 across all age groups compared to 1911 to 1920. The difference in survival probability becomes more pronounced with increasing age, especially noticeable from age 50 onwards.
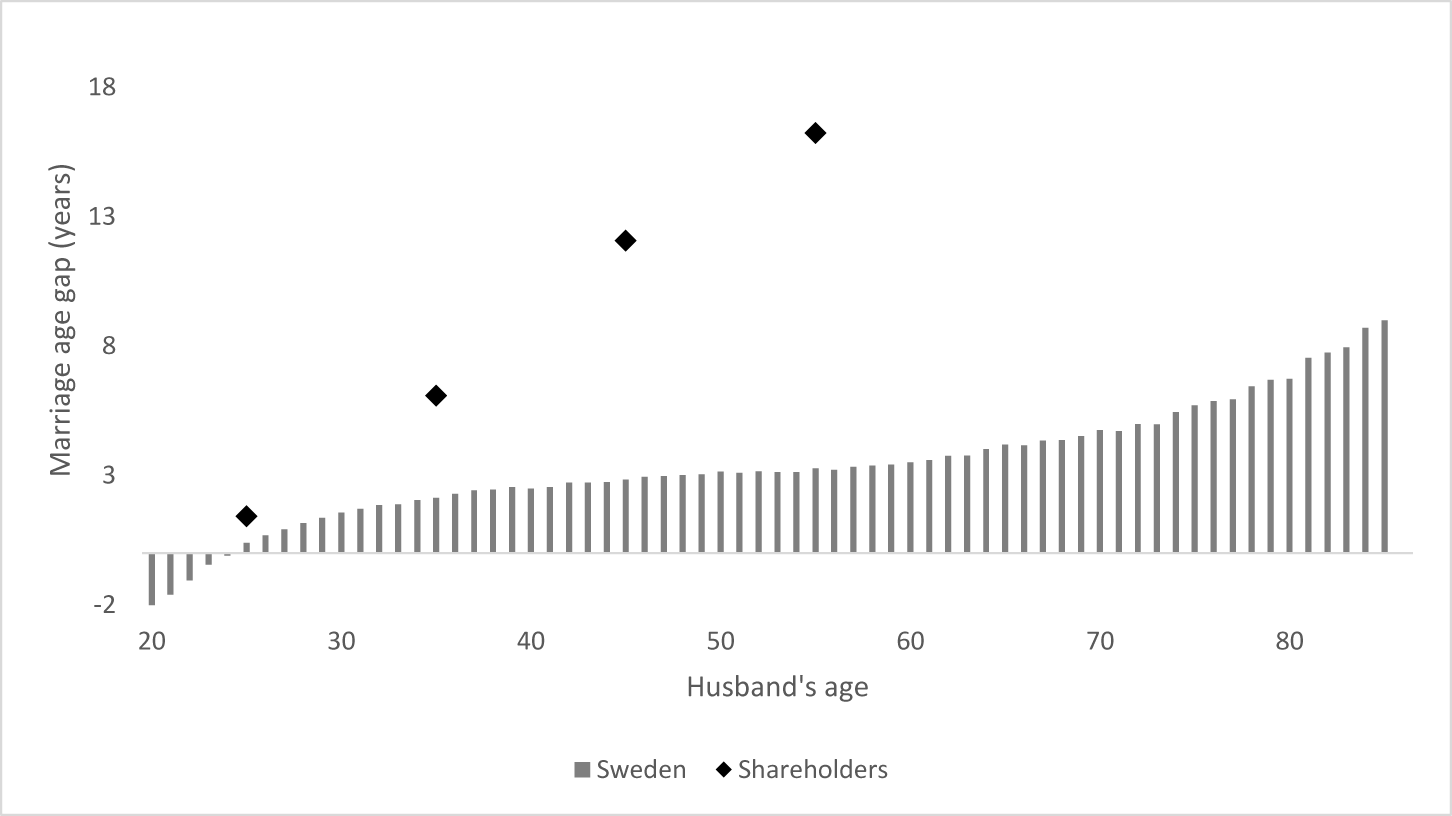
The additional fact that men married younger women further added to the need for the financial protection of spouses and children. A stock market investor who married in the age span 30–40 years, on average, attracted a spouse who was six years younger, and the spouse of a stock market investor who married in the age span 40–50 years was 12 years younger (Figure 7). We can compare these numbers to the marriage-age gap among the 400 wealthiest Americans on the Forbes Fortune 400 List. The average age gap in that particular sample of wealthy men is seven years in the first marriage and 22 years in the second marriage (Schwyzer Reference SCHWYZER2013). The marriage-age gap across the general population of Sweden is three years. In 1920, mortality risk was one reason why men were attracted to young women and why women were attracted to high-income men. A man may want to reduce the risk of his children growing up without a mother, and a woman may want to reduce the risk of being unable to support her children financially without a father.
Stock market participation and the marriage-age gap

Figure 7 Long description
A graph showing the marriage age gap in years on the y-axis and husband's age on the x-axis. The graph compares data for Sweden, represented by vertical bars and shareholders, represented by diamond symbols. The age gap for Sweden starts slightly below zero at age 20 and gradually increases, reaching around 15 years by age 80. The shareholders' data points are scattered, showing larger age gaps, particularly noticeable at ages 30, 40, 50 and 60, where the gaps are significantly higher than the general Swedish population.
Place of birth
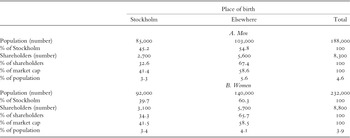
Men and women migrated from rural to urban areas. The male population of Stockholm in 1920 was 45 percent born in Stockholm and 55 percent immigrants (Table A4). Five percent were immigrants from a foreign country. For women, the proportions were 40 percent from Stockholm and 60 percent immigrants. The stock market participation rate for immigrants exceeded the rate of those who were born in Stockholm. Standard arguments for explaining this difference is that people who choose to move from one place to another have either higher ability or stronger incentives than native-born residents.
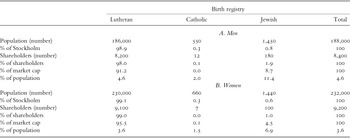
The church administrated the population registry. Most parishes were Lutheran, but there were also two Catholic and five Jewish congregations located in the biggest cities. The administration of the population registry by congregation allows us to study stock market participation by type of congregation, where parents chose to register their newborn child. Using this definition, 98.9 percent of the male population of Stockholm were Lutheran, 0.3 percent were Catholic and 0.8 percent were Jewish (Table A5). The stock market participation rate among the Jews stands out; it was 11.4 percent among men and 6.9 percent among women. The Jewish population of Stockholm held 8.7 percent of the shares in Stockholm, which was approximately 4.5 percent of all shares across the country. The Jews of Stockholm were businessmen (merchants, directors, factory owners, etc.) and highly educated specialists (physicians, lawyers, professors, etc.). Most Jews immigrated to Sweden from continental Europe during the nineteenth century without financial wealth (Carlsson Reference CARLSSON2021). The low stock market participation rate among registered Catholics may be the result of immigration from rural areas, where parents did not have the option to register their child in a Catholic congregation.
V
Many investors were unmarried women. Rutterford et al. (Reference RUTTERFORD, GREEN, MALTBY and OWNES2011) propose that single women were a resourceful investor class that contributed to building the country’s future. In this section, we propose an alternative view that single women were an important investor class as a result of excess female migration from rural to urban areas. Necessity motivated unmarried women to buy stocks.
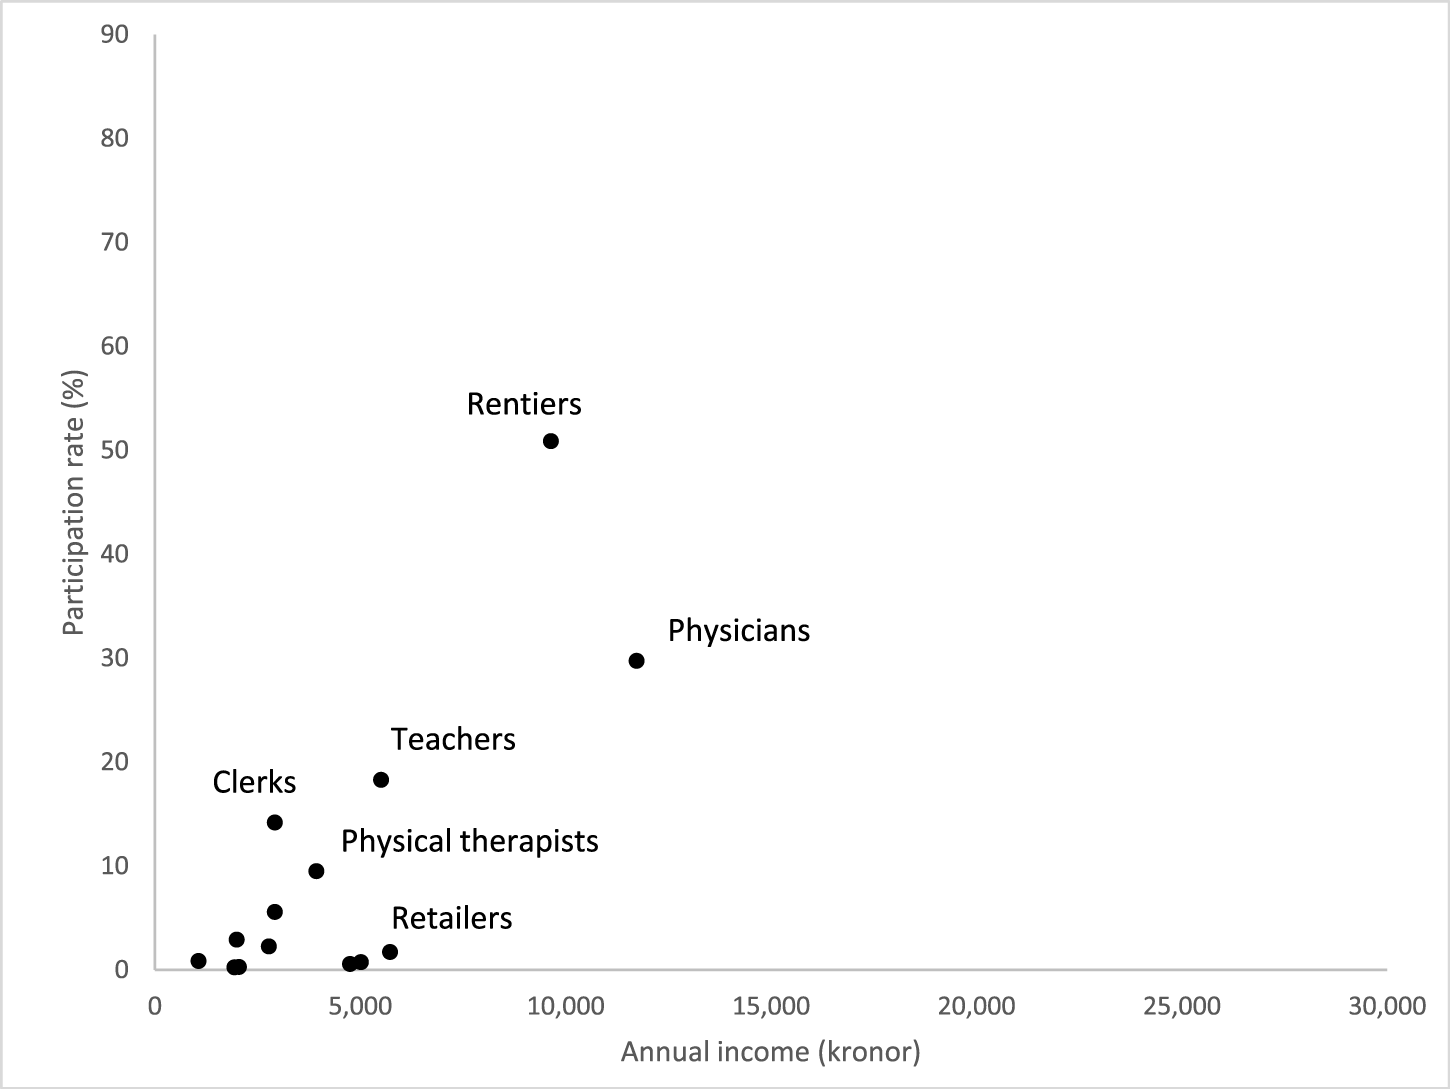
In Stockholm, there were more unmarried women (1,700) than widows (1,200) (see Table A2). The unmarried women were on average 45 years old, some of them married later in life (8 percent) and only a few had income that exceeded the lower limit of the tax calendar (25 percent). As indicated by available professional titles, the unmarried women earned a living as nurses, teachers, clerks, telephone operators, etc. Professions that require higher education, notably physicians, teachers, physiotherapists and nurses, had higher participation rates than other professions (Figure 8). We observe the highest stock market participation rate among rentiers, which we identify as an unmarried woman without a professional title. Many of them were the daughters of financially successful men as indicated by the father’s professional title. Some unmarried women were aristocrats.
Stock market participation and income by profession for women

Figure 8 Long description
A scatter plot showing participation rate in percentage on the y-axis and annual income in kronor on the x-axis. Data points represent different professions: Rentiers, Physicians, Teachers, Clerks, Physical therapists and Retailers. Rentiers have the highest participation rate at around 50 percent with an income below 10,000 kronor. Physicians have a participation rate of about 30 percent with an income around 15,000 kronor. Teachers, Clerks, Physical therapists and Retailers have lower participation rates and incomes, with Clerks and Retailers having the lowest values on both axes.
There were many unmarried women in the stock market because there were many unmarried women in Stockholm. In the general population of Stockholm, there were more unmarried women (82,000) than unmarried men (56,000). Since there were more unmarried women than unmarried men, many women had to rely on their own ability to provide for themselves and bought stocks as security against future living expenses.
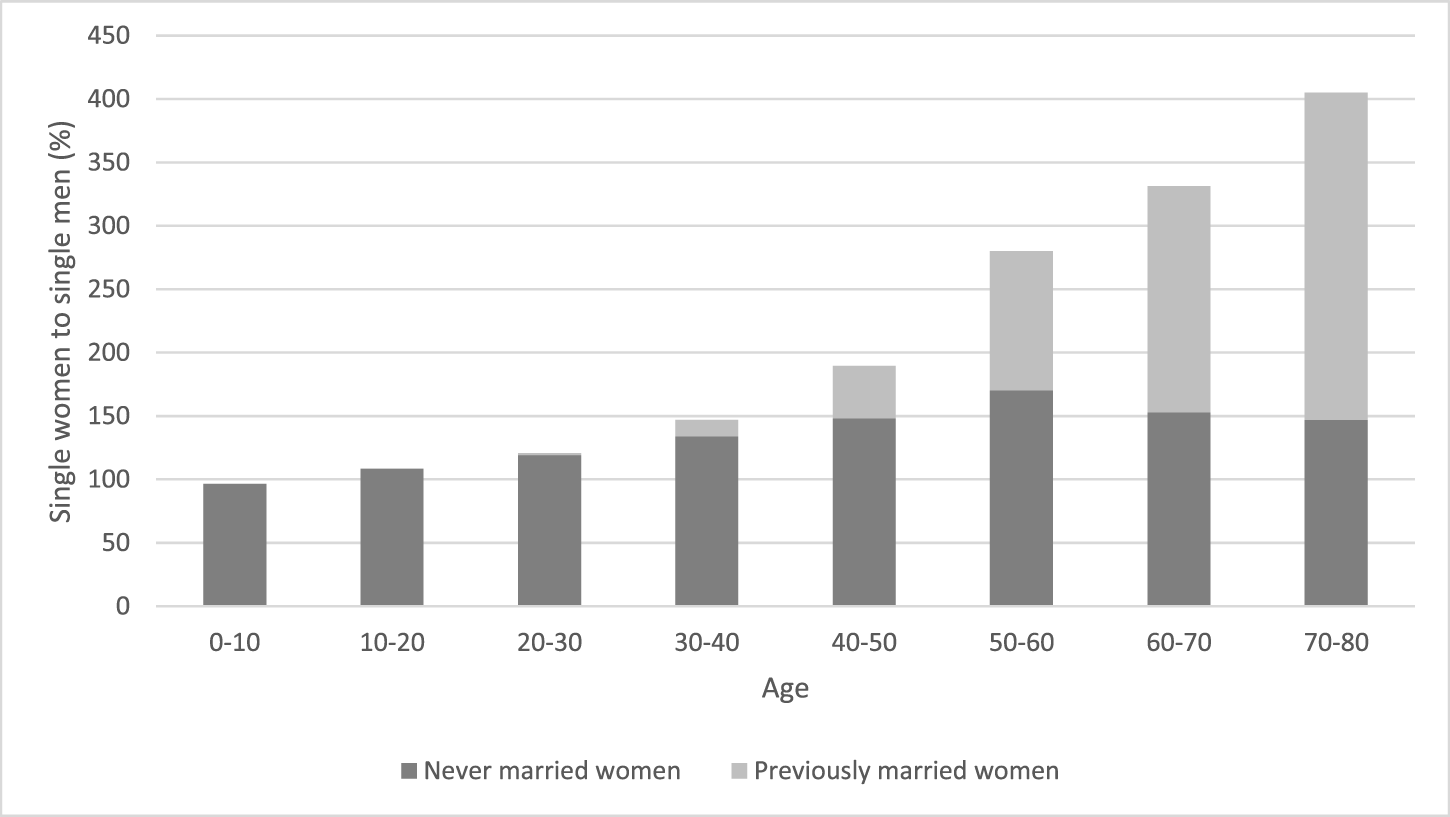
The number of girls in the age span 0–10 years was approximately equal to the number of boys, but already in the next age span 10–20 years, the number of girls exceeded the number of boys (Figure 9). In the age span 20–30 years, there were 121 single women per 100 single men, and in the age span 50–60 years, the number of single women was 280 per 100 single men. The surplus of single women (unmarried and previously married) to single men increased exponentially with age. Presumably, older men with higher income married the younger women.
Ratio of single women to single men in Stockholm 1920

Figure 9 Long description
A bar graph showing the ratio of single women to single men in percentage across different age groups. The x-axis represents age groups: 0 to 10, 10 to 20, 20 to 30, 30 to 40, 40 to 50, 50 to 60, 60 to 70 and 70 to 80. The y-axis represents the percentage of single women to single men, ranging from 0 to 450 percent. Each bar is divided into two segments: the lower segment represents never married women and the upper segment represents previously married women. The ratio increases with age, peaking in the 70 to 80 age group.
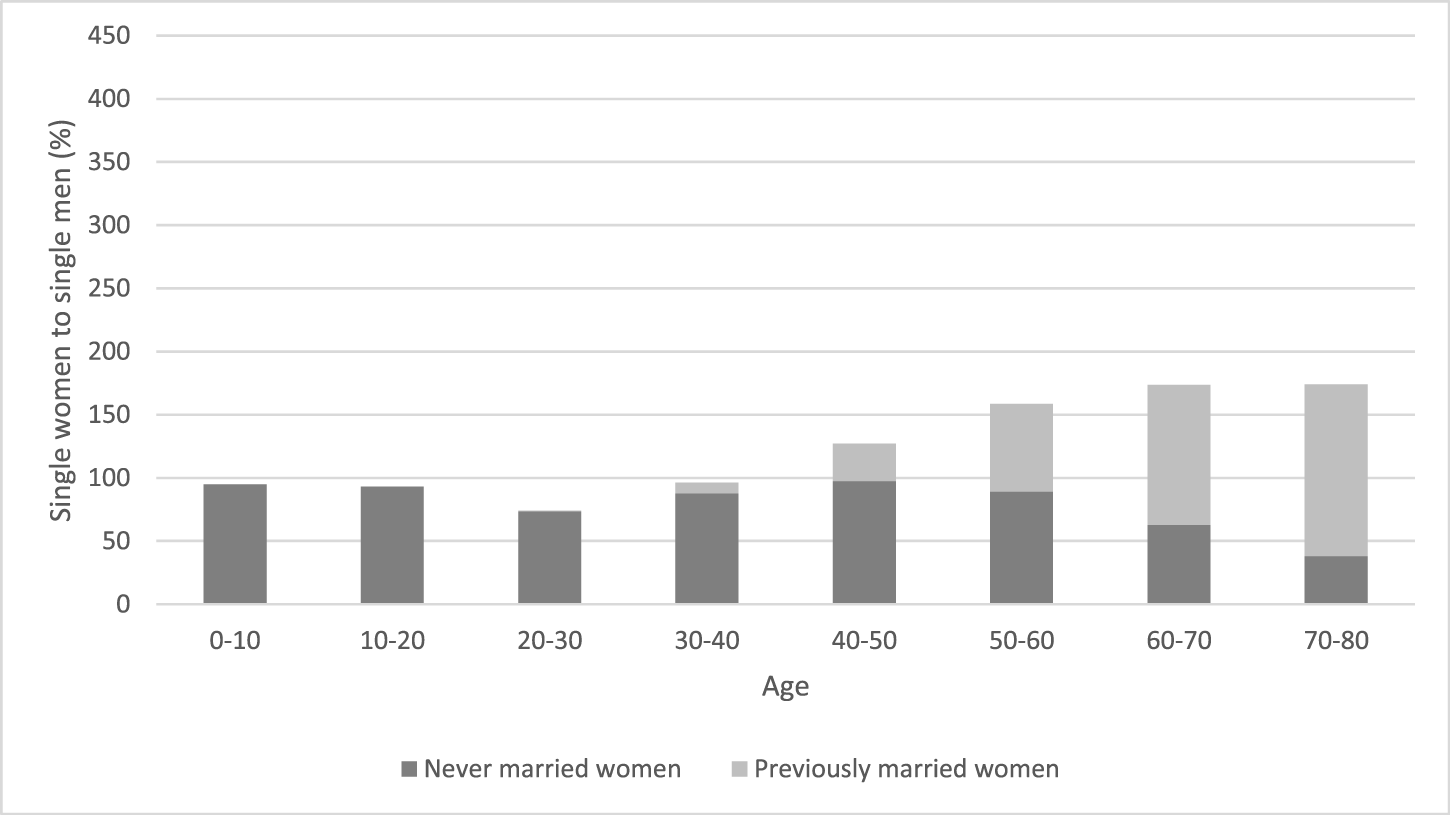
The distribution in rural areas was different (Figure 10). The number of girls in the age spans 0–10 years and 10–20 years was about the same as that of boys. In the next age span 20–30 years, the number of single women decreased to 74 per 100 single men. The deficit of unmarried women turned into a surplus at higher age, which means that the propensity to move from rural to urban areas decreased with age. Across the country, unmarried, young women were in short supply.
Ratio of single women to single men in rural areas 1920

Figure 10 Long description
The bar graph displays the ratio of single women to single men in percentage across different age groups. The x-axis represents age groups: 0 to 10, 10 to 20, 20 to 30, 30 to 40, 40 to 50, 50 to 60, 60 to 70 and 70 to 80. The y-axis shows the percentage of single women to single men, ranging from 0 to 450 percent. Each bar is divided into two segments: never married women and previously married women. In the age groups 0 to 10 and 10 to 20, the ratio is around 100 percent, indicating equal numbers of single women and men. The ratio decreases in the 20 to 30 age group and gradually increases in older age groups, with the highest ratios observed in the 60 to 70 and 70 to 80 age groups, where previously married women contribute significantly to the total percentage.
Men and women migrated from rural areas to Stockholm in search of better employment opportunities. High-income men gathered in Stockholm, and young women migrated from rural areas to Stockholm, where high-income men clustered. Some women married successfully, while others failed to marry and had to provide for themselves by investing in the stock market. Marrying a high-income man was particularly attractive in a society where women were excluded from high-income employment.
VI
We have studied stock ownership in an emerging market. Stock ownership was dominated by the urban middle class, there were no financial intermediaries and there were few foreign investors. While stock ownership was concentrated in the largest cities, many stock market investors resided in remote places around the country. Stock market participation was concentrated in households with income from higher education, business or inheritance. The high participation rate of the aristocracy points to the importance of inherited wealth, education and social networks. Detailed demographic data from Stockholm support the general notion that income was a primary determinant of stock market participation.
The stock ownership data reveal in a number of ways how the stock market facilitates life-cycle planning. Income from stock ownership replaces labor income in retirement. The patterns of stock market participation rates across professions suggest that stock ownership was relatively more important for individuals with higher education than it was for businessmen and property owners, who could continue to draw income from non-financial assets in retirement. Shifting labor income into retirement is also a central function of the stock market today, which is dominated by 401(k)-type retirement accounts and pension funds (Rydqvist et al. Reference RYDQVIST, SPIZMAN and STREBULAEV2014).
In 1920, mortality risk was high, and income from stock ownership replaced labor income in case of early death. A man built financial wealth before proposing marriage to a young woman, who would care for his children in case of premature death. Women were attracted to men who could secure the future financial needs of a non-working widow with small children. Accordingly, men became stockholders before they married, while women became stock market investors through their husbands. We conclude that the stock market supported family formation.
Excess female migration from rural to urban areas implies that more single women than single men resided in Stockholm. Many women who migrated from rural to urban areas failed to marry, and, consequently, had to compensate for loss of labor income in retirement through stock market investments of their own. We conclude that the stock market supported female emancipation.
Appendix: Tables
Stock market participation and income in Stockholm 1920
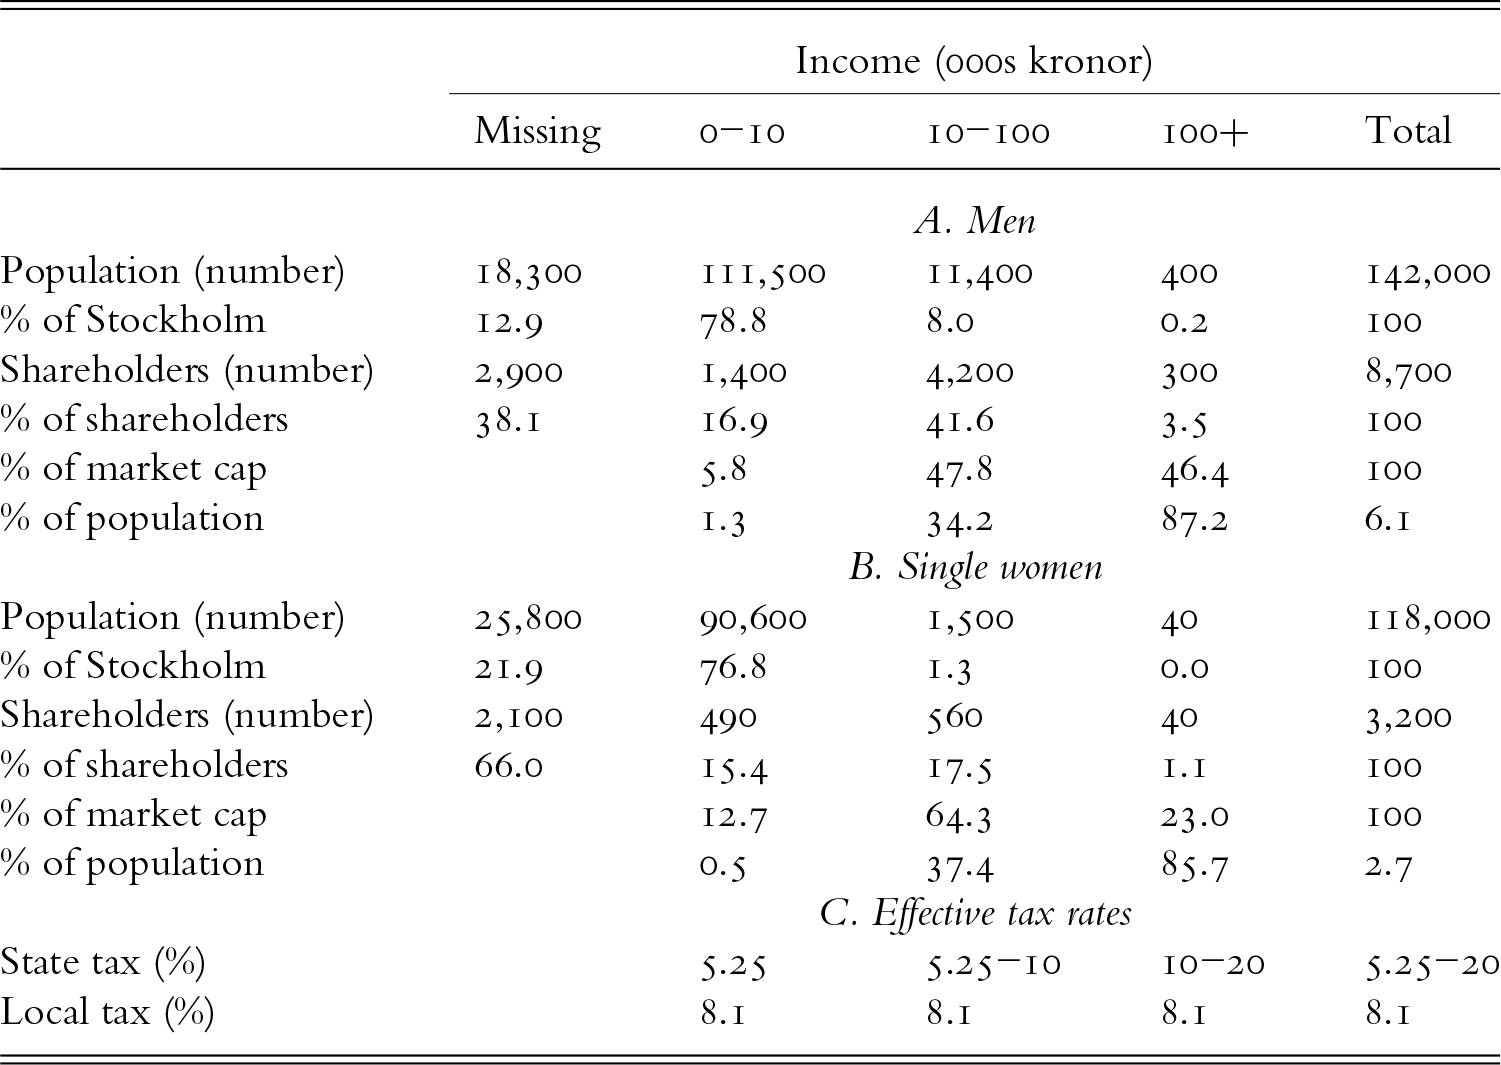
Table A1 Long description
The table compares stock market participation rates by income bracket for men and single women in Stockholm in 1920. Men had higher participation rates, especially in higher income brackets, with 41.6% of shareholders earning between 100,000 and more kronor. Single women had a higher percentage of shareholders in the lowest income bracket, with 66% earning less than 10,000 kronor. The effective tax rates varied by income, with state tax rates increasing with income, while local tax rates remained constant. The data highlights disparities in stock market involvement based on gender and income, with men dominating higher income brackets and market capitalization. Missing data for certain groups, such as married women without their own income, may affect the interpretation of these trends.
The table reports stock market participation rates by income bracket for men and women, respectively. Population data originate from the Swedish Census 1920 (Folkräkningen 1920, part 5, table 15, Stockholm). Income data have been collected from the tax calendars for Stockholm (Taxeringskalendern för Stockholm 1914, 1916, 1918, 1920, 1922, 1924, 1926, 1928 and 1930). Income data are missing for shareholders with annual income below the limit (3,000–8,000 kronor), shareholders with common names, and married women without income of their own. The numbers have been rounded.
Stock market participation and marriage
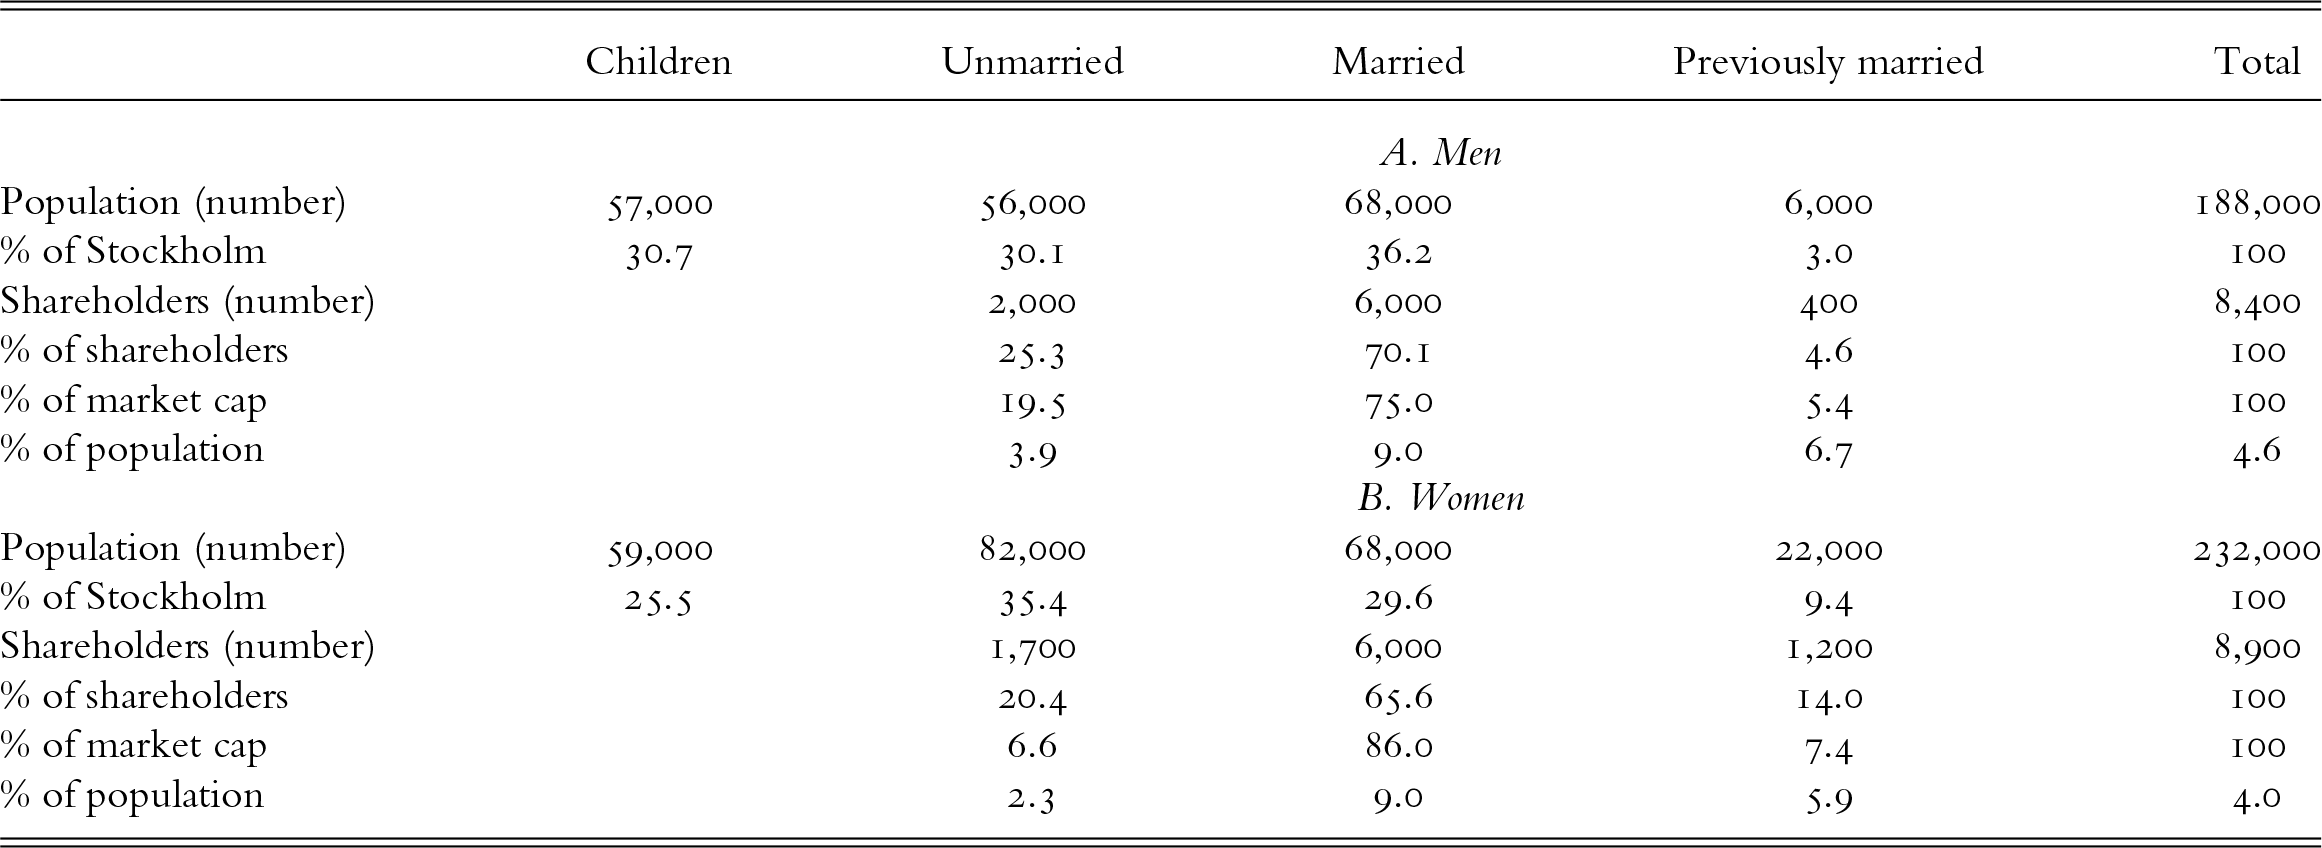
Table A2 Long description
The table compares stock market participation rates by marital status for men and women in Stockholm, based on 1920 census data. Married individuals, both men and women, show the highest participation rates, with men holding 75% of the market cap and women 86%. Unmarried men and women have lower participation rates, with men at 19.5% and women at 6.6% of market cap. Previously married individuals have the smallest share, with men at 5.4% and women at 7.4% of market cap. The number of married men equals the number of married women, highlighting a balanced gender distribution in this category. The data suggests that marital status significantly influences stock market involvement.
The table reports the stock market participation rate by marital status for men and women, respectively. Population data originate from the Swedish Census 1920 (Folkräkningen 1920, part 3, table 2, Stockholm). Marital status information has been taken from the church records for Stockholm (Rotemannen). The number of married men equals the number of married women. The numbers have been rounded.
Stock market participation and age
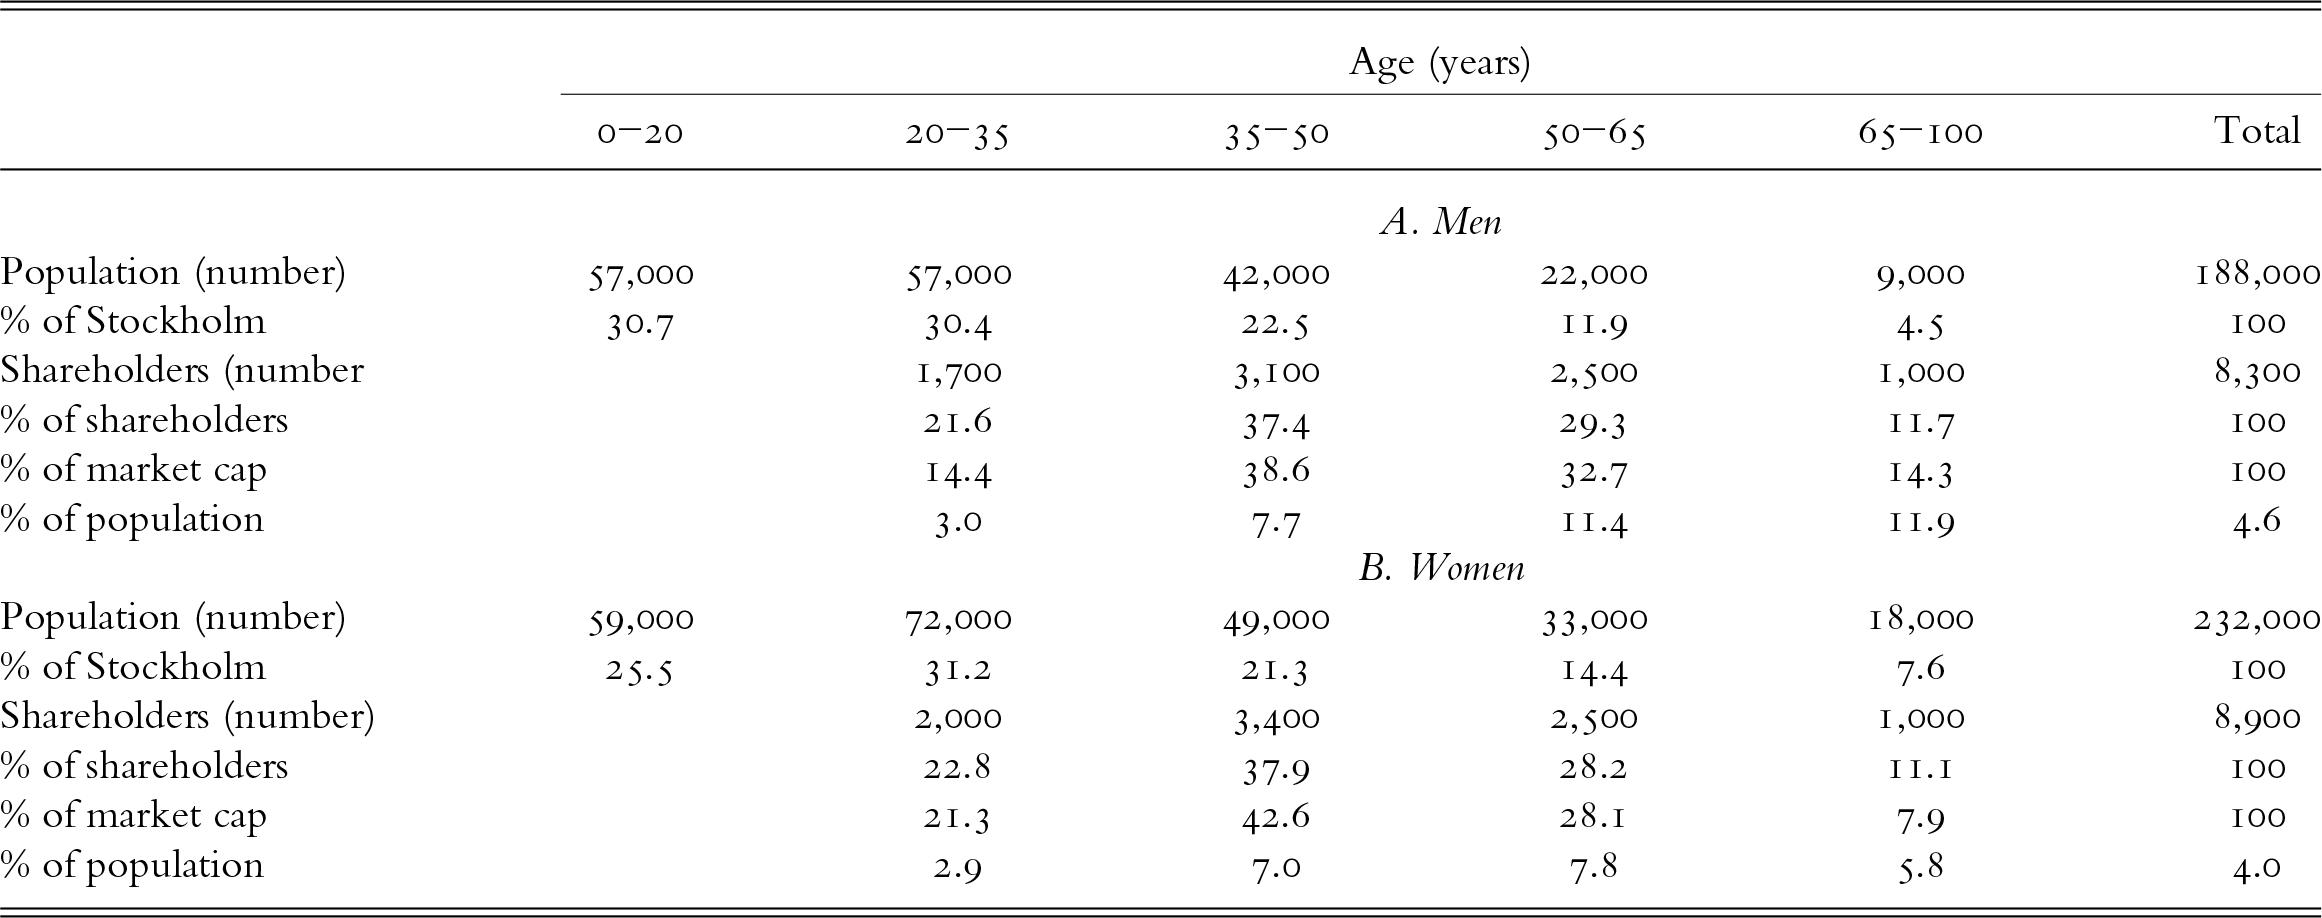
Table A3 Long description
The table compares stock market participation rates by age and gender in Stockholm, based on 1920 census data. Men aged 35-50 have the highest percentage of market capitalization at 38.6%, while women in the same age group hold 42.6%. Both genders show a peak in shareholder numbers in the 35-50 age range, with men at 3,100 and women at 3,400. The youngest age group (0-20) has no recorded shareholders for either gender. Men aged 50-65 have a higher percentage of their population participating in the stock market at 11.4%, compared to women at 7.8%. The data suggests that middle-aged individuals are more active in the stock market, with men having a slightly higher participation rate in terms of population percentage.
The table reports the stock market participation rate by age for men and women, respectively. Population data originate from the Swedish Census 1920 (Folkräkningen 1920, part 3, table 2, Stockholm). Age data have been taken from the church records for Stockholm (Rotemannen). The numbers have been rounded.
Stock market participation and place of birth
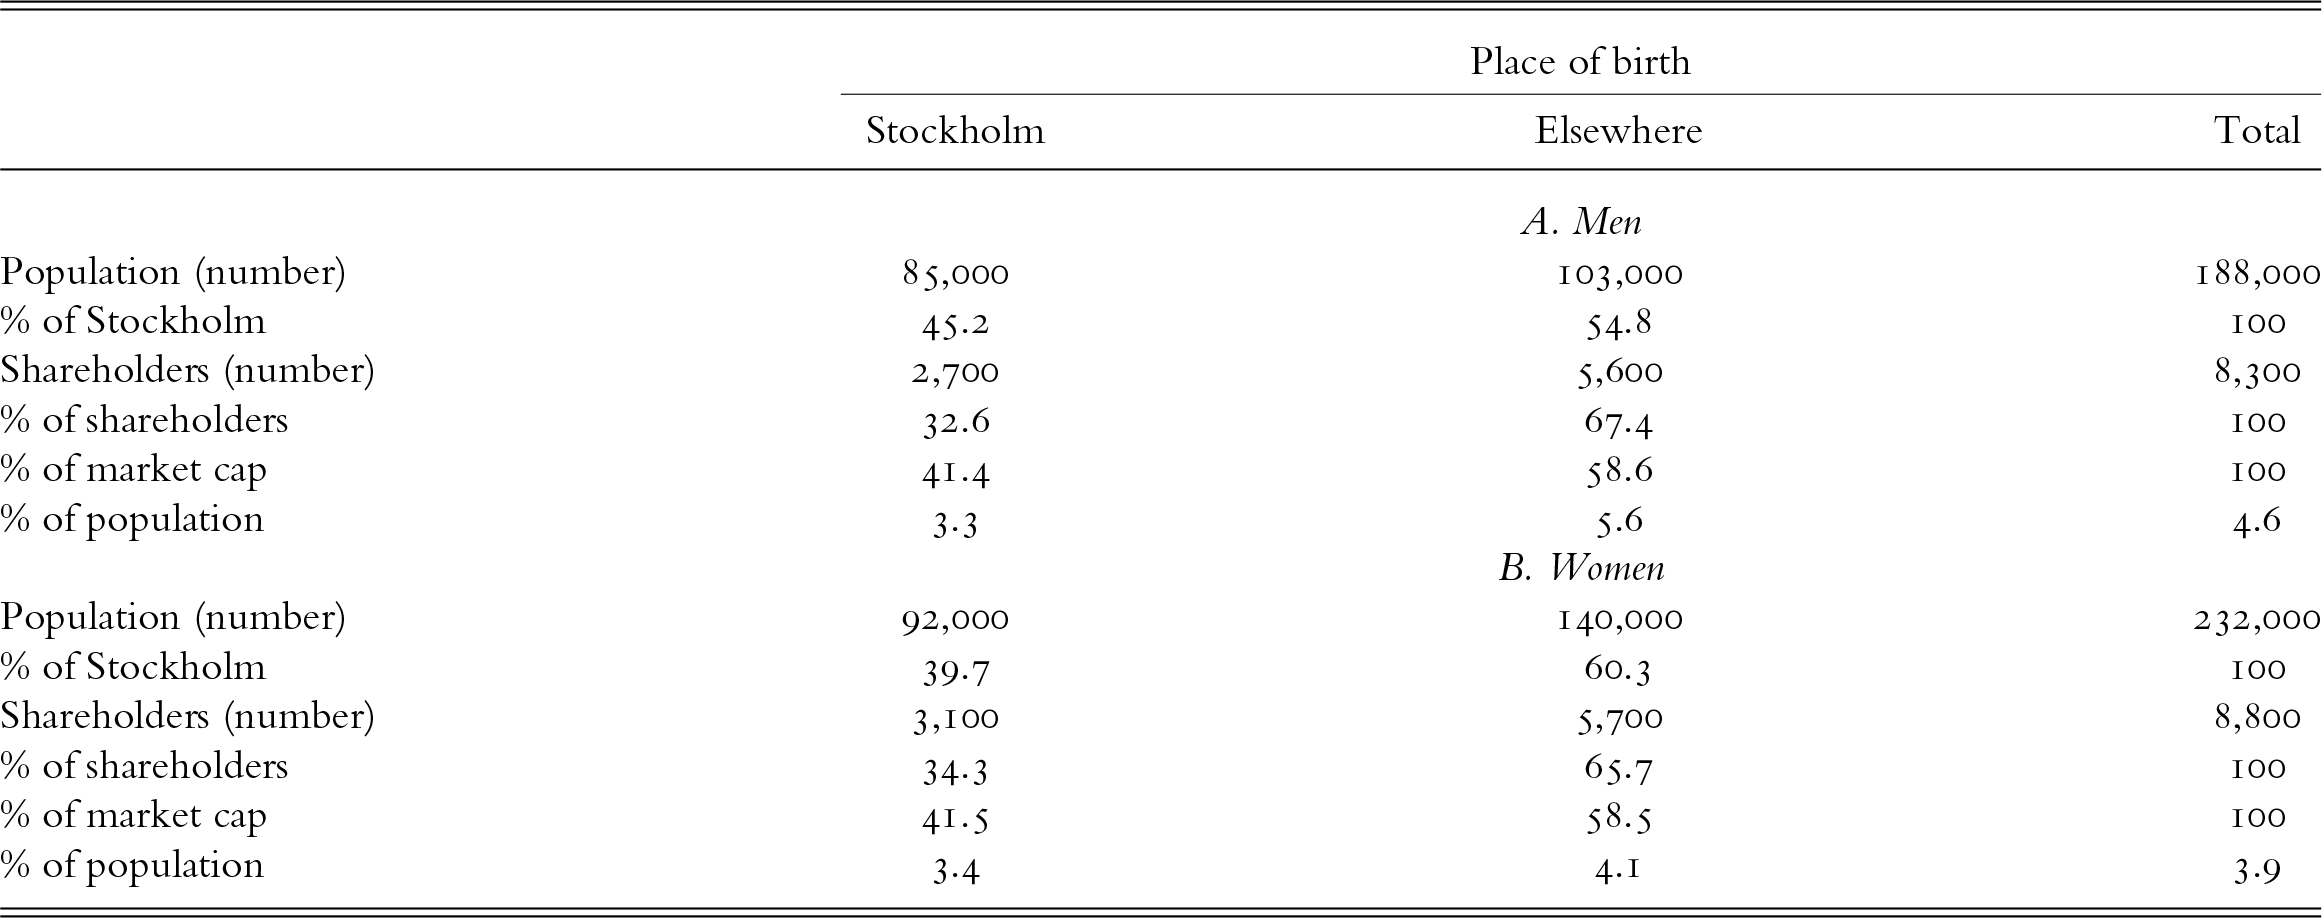
Table A4 Long description
The table compares stock market participation rates by place of birth for men and women in Stockholm, based on 1920 census data. For men, those born elsewhere have a higher participation rate and market cap share than those born in Stockholm, with 5.6% versus 3.3% participation and 58.6% versus 41.4% market cap share. For women, the trend is similar but less pronounced, with 4.1% versus 3.4% participation and 58.5% versus 41.5% market cap share. The data suggests that place of birth influences stock market involvement, with those born outside Stockholm participating more actively. The differences are statistically significant due to large sample sizes.
The table reports the stock market participation rate by place of birth for men and women, respectively. Population data originate from the Swedish Census 1920 (Folkräkningen 1920, part 3, table 13, Stockholm). Place of birth has been collected from the church records for Stockholm (Rotemannen). The numbers have been rounded. Given the large sample sizes, the differences in participation rates are statistically significant.
Stock market participation and faith

Table A5 Long description
The table compares stock market participation rates among men and women in Stockholm by birth registry: Lutheran, Catholic, and Jewish. Lutheran individuals make up the majority of shareholders, with 98% for men and 99% for women. Despite their small population size, Jewish men and women have higher participation rates relative to their population, with 11.4% and 6.9% respectively. Catholic individuals have the lowest shareholder numbers and market cap percentages. The data highlights significant differences in stock market engagement across religious groups, with Lutheran individuals holding the largest share of market capitalization.
The table reports the stock market participation rate by birth registry for men and women, respectively. Population data originate from the Swedish Census 1920 (Folkräkningen 1920, part 2, table 6). Birth registry has been collected from the church records for Stockholm (Rotemannen). The numbers have been rounded.

 Open access

