


Obesity is a major worldwide public health problem(Reference Kartiosuo, Ramakrishnan and Lemeshow1), and its incidence has been increasing in the past years(Reference Thomas-Eapen2–Reference Nga, Dung and Chu4), affecting not only adults but also children and adolescents(5). According to the WHO, 29 % of children aged 7–9 years are overweight, and 12 % are obese in the European region(5). As a result, they have a higher probability of developing poor health during their childhood and/or in their adult life(6).
From all the nutrition exposures identified, high energy-dense food consumption has been considered a main risk factor, in addition to other behaviours(Reference Flieh, Moreno and Miguel-Berges7,Reference Turck and Bohn8) . In the past decades, diets worldwide have become sweeter, with a notable increase in the intake of free sugars (FS)(Reference Popkin and Nielsen9), which allude to monosaccharides and disaccharides added to food/drinks as well as natural ones that already exist in some food/drinks, e.g. fruit juices and honey(10). Recently, FS intake has been discussed as a big contributor to the obesity expansion(Reference Farajian, Risvas and Panagiotakos11–Reference Chatelan, Gaillard and Kruseman14), even though its consumption differs by age, setting and country. Nevertheless, studies have shown its intake was higher among children(15).
Regarding recommendations, the WHO recommends <10 % of the total energy intake (%TEI) from FS and an additional reduction to below 5 % (25 g or 6 teaspoons) a day to observe health benefits(10). Furthermore, The American Academy of Pediatrics advises, in case of consumption, that children take ‘the minimum amount of added sugar necessary to promote the palatability, enjoyment, and consumption of nutrient-rich food items’(Reference Zupanic, Hristov and Gregoric16). Despite some reduction of FS intake, it was observed in USA adults from 18 % (in the period of 1999–2000) to 13 % (in 2007–2010), and also a decrease was described for USA children and adolescents (1994–2010)(Reference Bailey, Fulgoni and Cowan17), mean energy intake from FS still tends to increase above 16 % in the same period in adolescents(Reference Bailey, Fulgoni and Cowan17).
Currently, in Europe, added sugar intake contributes to 7–11 %TEI in adults and 11–17 %TEI in children(Reference Azais-Braesco, Sluik and Maillot18). Some countries assessed the consumption of FS from their national surveys, such as the case of France (15·3 %)(Reference Deshayes, Seconda and Reiser19), the Netherlands (20·7–19·7 % in boys and 19·9–19·8 in girls ages 7–13)(Reference Sluik, Van Lee and Engelen20), the UK (13 %)(Reference Amoutzopoulos, Steer and Roberts21) and Ireland (9·5 % children 5–12)(22). In Portugal, data from the National Food, Nutrition, and Physical Activity Survey (IAN-AF 2015–2016) reported that children and adolescents had about 10 % TEI and 11 % TEI of added sugar and FS, respectively, mostly from sweets and soft drinks(Reference Marinho, Severo and Correia23). Considering all samples, 75 % and 34 % of the population were adhered to the WHO recommendation <10 %TEI and <5 %TEI of FS, respectively. The adherence in children and adolescents is even lower.
Sugar-sweetened beverages (SSB) and carbonated beverages have been reported to be the primary source of total energy intake and the main source of added sugar in young people in the USA(Reference Brown, Dulloo and Montani24). Systematic reviews and a meta-analysis in children, adolescents and adults have shown that an enlarged consumption of sugar and/or SSB is linked to weight gain as well as overweight and/or obesity(Reference Te Morenga, Mallard and Mann13,Reference Keller and Bucher Della Torre25,Reference Malik, Pan and Willett26) . Howbeit, no evidence has been identified about other FS top sources and obesity(Reference Bailey, Fulgoni and Cowan17).
In recent years, FS has acknowledged some attention from researchers also from public health policymakers, as well as the general population(27). Not only because they are linked with weight gain but also because of their association with the higher risk of chronic diseases such as type II diabetes and CVD(Reference Kell, Cardel and Bohan Brown28–Reference Wang30).
Moreover, people’s socio-economic status (SES) has been linked to health inequalities and behaviors, influencing their life course(Reference Mackenbach, Stirbu and Roskam31). Particularly poorer dietary habits have been linked with lower SES(Reference Mishra, Ball and Arbuckle32,Reference Bolt-Evensen, Vik and Stea33) . Likewise, a child’s diet is highly influenced by the SES of their parent or guardian(Reference Vilela, Oliveira and Pinto34), as well a lower level of education of the mother has been related with a higher consumption of energy-dense foods(Reference Vilela, Oliveira and Pinto34).
To the best of our knowledge, no studies have previously described trajectories of FS intake and trajectories by food sources of FS intake during childhood and how they could be influenced by SES. Thus, the proposed study aims to describe the trajectories of free sugar intake and its main sources in children from 4 to 13 years of age and to estimate the associations with socio-economic factors.
Methods
Participants
Participants are children recruited from public maternal units in the metropolitan area of Porto, Portugal, born between 2005 and 2006, that enrolled the prospective Portuguese population-based birth cohort Generation XXI (G21) (n 8647 children)(Reference Alves, Correia and Barros35,Reference Larsen, Kamper-Jorgensen and Adamson36) . The eligibility was considered if mothers were residents of the Porto Metropolitan Area and delivered alive-born children with a gestational age≥24 weeks. Baseline data were collected in the first 72 h after the delivery during the hospitalisation through face-to-face interviews.
All children were invited for follow-up at 4 years old (2009–2011: participation proportion of 86 %), 7 years old (2012–2014: participation proportion of 80 %), 10 years old (2015–2017: participation proportion of 76 %) and 13 years old (2018–2020: participation proportion of 54 %, interrupted earlier than expected due to COVID-19 pandemic).
Briefly, data collected included demographics, social conditions and lifestyles (diet and physical activity, sleeping habits and medical care). Also, all follow-up evaluations included objective measures of body composition, blood pressure and blood analysis.
The final sample in the current analyses included only information from children who had three or more completed food diaries (in at least one of the waves). The data available in the present analyses are for 2493 children at 4 years, 3587 children at 7 years, 2855 children at 10 years and 2833 children at 13 years.
Ethics
GXXI was conducted in agreement with the guidelines from the Declaration of Helsinki and was approved by the National Data Protection Authority and the Ethics Committee of São João Hospital. All study phases complied with the Ethical Principles for Medical Research Involving Human Subjects expressed in the Declaration of Helsinki. Written consent was obtained from parents or legal caregivers at each data collection, and at 13 years of age, children also were assent.
Data collection
Dietary intake
Dietary intake data were assessed through 3-day food diaries (2 weekdays and 1 weekend) in a sub-sample (about 50 % of the main sample) at each follow-up as previously detailed(Reference Moreira, Severo and Oliveira37). At 4, 7 and 10 years of age children’s parents were asked to describe all foods and beverages consumed (as meticulously as possible including commercial brands, if applicable) and the amount in grams, units or household measures. In the absence of a parent, the meals were reported by the child’s daytime main caregiver. At 13 years of age, adolescents were asked to report their diaries and ask their parents for help when needed. Written instructions were provided to assist with the fulfillment of the diaries, including an example of a complete food diary and household measure photos to help with the food quantification.
Trained nutritionists computerised the food diaries using the methodology of software eAT24 (Electronic Assessment Tool for 24-h recall) from the national dietary survey (IAN-AF 2015–16)(Reference Goios, Severo and Lloyd38). Food items were classified according to FoodEx2 system(39), and complex food or recipes were broken down into their single ingredients as recommended by EU Menu methodology(40). Total energy and macronutrients were estimated based on the Portuguese Food Composition Table at PortFir (http://portfir.insa.pt), updated with data from the European Food Information Resource (EuroFIR)(Reference Uusitalo, Kronberg-Kippila and Aronsson41) network databases.
Free sugars estimation
The food composition database contained total sugar (TS) values in every food item. All items and recipes were broken down into single ingredients. TS estimation of each recipe was based on the quantity of TS in each single ingredient.
Added and free sugar content of each item have been previously estimated in a dietary dataset(Reference Marinho, Severo and Correia23). Added sugar was estimated following a ten-step methodology(Reference Louie, Moshtaghian and Boylan42). Step 1, foods with zero grams of TSs allocates 0 grs of added sugars. Step 2, foods that are in the unprocessed or slightly processed with no added sugars allocates 0 grs of added sugars. Step 3, foods with slight amount of naturally occurring sugars allocates 100 % of TSs as added sugars. Step 4, a calculation constructed on the standard recipe used in the food composition database is used in which all ingredients follow the previous steps. Step 5, a calculated formula which is based on the comparison with values from unsweetened variety. Step 10, assign 50 % of TSs as added sugar. From the original proposed methodology(Reference Louie, Moshtaghian and Boylan42), the steps 6–9 were not used.
Finally, FS were defined as proposed by WHO(10) as the added sugars (monosaccharides and disaccharides added to food/drinks), plus the sugars naturally present in honey, syrups, fruit juices and fruit juice concentrates.
Anthropometrics
At all follow-ups, weight and height data were measured by trained professionals. Weight was measured with no shoes and light clothing to the nearest 0·1 kg using a scale (TANITA® model TBF 300). Height was measured to the nearest 0·1 cm by using a stadiometer (SECA 206 Hamburg, Germany®). BMI was computed, and BMI sd scores (BMI Z-scores) were calculated according to the WHO growth charts(43). Underweight and normal categories were combined since the percentage of underweight was too low (0·6 %) to be considered an individual category.
Socio-economic status
At baseline, during a face-to-face interview with the mother, data such as the mother’s age, parent’s education, profession/occupation and monthly household income(Reference Vilela, Oliveira and Pinto34,Reference Soares, Lopez-Cheda and Santos44) were collected. Educational level was measured according to the total years of formal and completed education classified by the International Standard Classification of Education 2011 classes(45): 9 or less years of education being the lowest, intermediate less or equal to 12 years and 13 or more the highest. Occupation was classified into three different groups conferring the National Classification of Occupations(46) and grouped as Soares et al(Reference Soares, Lopez-Cheda and Santos44). The three groups were ‘low’, ‘intermediate’ and ‘high’ occupational status. The ‘low occupational status’ corresponded to farmers, skilled and unskilled workers, machine operators and assembly workers, the ‘intermediate’ were administrative, services and sales workers and the ‘high occupational status’ group were executive servants, industrial directors, scientists, middle management and technicians. Household income per month included salaries or other different sources of income (financial assistance, rents, monetary allowances and subsidies)(Reference Soares, Lopez-Cheda and Santos44), independently from the family size. It has been divided in three categories: the low category was classified as ≤500–1000€, the middle category 1001–2000€ and the high category ≥2001€.
Statistical analysis
The usual nutrient intake method was used to estimate the distribution of the intake in the participants and consider removing the effect of intra-variability. It was done through a three-step method: (1) transform the nutrient intake data to a normal distribution using the Box–Cox or the log transformation; (2) estimate the usual intake in normal space using linear mixed models and removing the intra-individual variability and finally (3) transform the usual intake estimates back to the original scale. The resulting estimates of usual nutrient intake are more accurate than estimates obtained using traditional methods, such as simply averaging the nutrient intake data(Reference Guenther, Kott and Carriquiry47).
The food contributors of FS (grams per day) and adherence to the dietary recommendation, using the recommendations from WHO of <10 % TEI or <5 % of TEI, were estimated by sex and age group. The simple average for each food group and the total FS intake from all the days were calculated by dividing the contribution of each food group by the total FS intake by wave.
A mixed-effects model with linear and quadratic terms for time was used to estimate the trajectories of FS and its association with SES. For age, it was used quadratic terms because the association between age and FS intake was not linear. Interaction terms between time and SES variables (maternal education, maternal occupation and income), mother’s age and children’s BMI were included to assess if these variables had an effect on FS trajectories. All the models were adjusted for sex, mother’s age, children’s BMI and SES (one variable at a time). Age was subtracted 4 years, so the variable age included in the model was age minus 4, the interpretation of the intercept is the value of the outcome at 4 years of age.
A sensitivity analysis was performed to test the tracking of FS intake, and the associations only considered plausible reporters. Misreporting of energy intake was estimated using the Goldberg method(Reference Goldberg, Black and Jebb48) adapted later by Black(Reference Black49). The ratio of reported EI to predicted basal metabolic rate estimated by Schofield equations(Reference James and Schofield50) considering fixed categories for physical activity (PAL = 1·6) and multiplied by a factor. This factor includes a correction for sample size, for the number of reported days (n 3) and for the variation of EI (23 %), predicted basal metabolic rate (8·5 %) and PAL (15 %). Participants are defined as under, plausible or over-reporters whether individual ratio of EI:predicted basal metabolic rate is below, within or above the 95 % confidence limits calculated, respectively, corresponding to two sd.
All statistical analyses were performed using R version 4·3·0 using the package nlme(Reference Pinheiro, Bates and Team51). Associations were presented with coefficients (β) and respective 95 % CI. A significance level of 5 % was considered.
Results
Subject characteristics
General characteristics of the children included in the current analysis (n 5268 (60·9 %)) and their mothers, including the SES, are described in Table 1. Considering maternal characteristics, 77·2 % were 22–35 years of age, 48·4 % belonged to intermediate occupational status and 42·1 % had completed nine or less years of education. The more frequently reported household income category was middle class (47·1 %). Regarding the children, the majority were males (51·3 %), and 69 % had underweight/normal weight at 4 years of age. Compared with the children not included (n 3379 (39·1 %)), those included had a higher proportion of older mothers at delivery, with higher SES (higher occupation and household income) and with a lower prevalence of obesity.
General characteristics of the population

Occupation was classified in low (farmers, skilled & unskilled workers, machine operators and assembly workers), intermediate (administrative, services and sales workers) and high (executive servants, industrial directors, scientists, middle management and technicians) occupational status. Household income classified as low (≤500–1000€), middle category (1001–2000€), and high category (≥2001€).
Free sugar intake and adherence to recommendations
Table 2 presents the FS intake among the children’s sample by age, sex, as well as adherence (%) based on the WHO recommendations. The mean (sd) daily intake of FS (g/day) and the respective mean value in percentage of total energy intake were 36·1 (8·5 %), 46·9 (9·7 %) g/d, 51·0 (9·7 %) g/d and 51·9 (9·1 %) at 4, 7, 10 and 13 years of age, respectively. Boys and girls have a similar percentage of total energy from FS intake, slightly higher in boys at 4 years and 7 years and in girls at 10 years and 13 years.
Mean and median intakes (g/d) and adherence (%) based on the WHO recommendations for free sugars
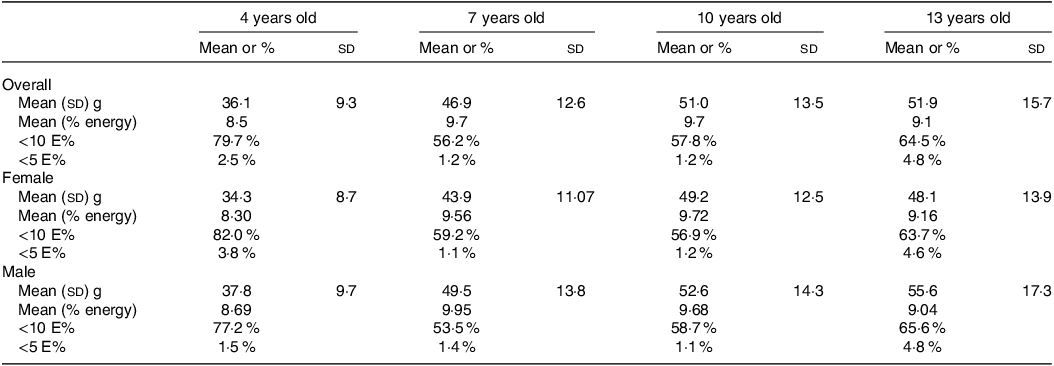
The adherence to the WHO recommendations below 10 % of TEI was achieved in over half of the participants of all ages. Moreover, the highest adherence below 10 % TEI can be observed at 4 years of age in girls (82 %) compared with boys (77·2 %). The adherence below 5 % TEI was, in general, in a very low proportion of the population, being lower at 7 years in girls (1·1 %) and at 10 years of age in boys (1·1 %).
Main food contributors
Graph 1 describes the main food contributors of FS intake at the different ages analysed from 4 to 13 years of age. The main FS contributor at all ages was sweets and candies (that can be seen as table sugar, honey, candies, chocolates and ice cream). The subsequent main food sources were soft drinks, cereal bars, cookies and biscuits, nectars (pulped fruit juices with or without added sugar less than 20 %), cakes, yoghurts and milk (flavoured milk). Trends show that the FS intake from some items declined as children grew older. Such is the case of FS of yoghurts (22–7 %) and, to a lesser extent, sweets (25–21 %). Notably, the inverse occurred with the second contributor as children became older, with increasing FS from soft drink intake (9–18 %) and from nectars (3–11 %).
Trajectory of the percentage of free sugar intake from the main food group contributors.
Footnote: *Milk including “flavored milk”

Trajectories of fress sugar and association with socio-economic status
Table 3 shows the three linear mixed models used between FS and SES considering the adjustment for sex, age, children’s BMI z-score at 4 years of age and one SES variable at each model. The increase of FS intake during the period from 4 to 13 years was on average 4·62 g/year (IC 95 %: 4·20, 5·04), but this velocity decreased by 0·32 g/year2 until 13 years. The highest increase in FS intake was observed from 4 to 7 years, showing the highest inflection point at 10 years (Graph 2(a)).
(a) Free sugar trajectories by SES and obesity (in total sample).
Footnote: Inflection points: A.) FS and sex: girls 10.6 years, boys 10 years, B.) FS and mother’s education: class 1 (0–9 years) 9.9 years, class 2 (10–12 years) 10 years, class 3 (>12 years) 11.6 years, C.) FS and household income: low class 10.2 years, middle class 10.3 years, high class 11.5 years and D.) FS and BMI: under/normal 10.2 years, overweight 10.7 years, obese 11.5 years. (b) Free sugar trajectories by SES and obesity (only in plausible reporters)

Associations between SES and free sugar intake trajectories (linear mixed effects model)

Random effect abbreviations: β- standarized beta coefficient, σ2- Residual variance, ρ 01 - correlation between the random slope and the random intercept, ICC- Interclass correlation coefficient, N- dimension of linear predictor.
Model 1 was adjusted for mothers’ education, model 2 for income and model 3 for mothers’ profession.
The mother’s profession/occupation classification refers to low: as farmers, skilled and unskilled workers, machine operators and assembly workers, the intermediate: administrative, services and sales workers and high: executive servants, industrial directors, scientists, middle management and technicians.
After adjustment, boys and children from younger mothers had higher FS intake. The higher-maternal SES was significantly associated (β) with lower children’s FS intake, and namely, for high v. low years of education (–3·7; 95 % CI: − 4·93, −2·40), high v. low household income (–4·9; 95 % CI: − 6·50, −3·27) and high v. low occupational status (–3·5; 95 % CI: − 4·97, −1·94). Despite these associations, the trajectories of intake were similar according to the SES since no interactions were found between the trajectories and the SES variables. A significant interaction was only found between FS trajectories and obesity status (β = –1·04; IC 95 % (–1·50, −0·59)). The increase of FS was smaller in obese children compared with normal weight, as children with obesity were already consuming less FS at an early age compared witho other BMI categories.
The models considering adjustment for confounders (Table 3) maintained almost the same results obtained in the crude models (online Supplementary Table S1).
The trajectories of FS intake by sex, SES and BMI can be observed in Graph 2. Boys have a higher consumption of FS than girls at all ages although the same increasing trajectory was observed in both boys and girls. Furthermore, the higher the education of the mothers, the less FS intake was observed in children of all ages. Whereas, the categories of low and middle education levels followed the same trajectory pattern. The same occurred with household income with those from a lower household income showing the highest intakes of FS up to 13 years and low and middle household income had similar trajectories. Also, the trajectories were similar for underweight/normal weight and children with overweight who presented higher intake when compared with children with obesity. In children with obesity, the trajectory of FS intake increased from 4 to 10, and it dropped strongly from 10 to 13 years.
Additionally, the inflection points of FS intake during childhood stratified by the referred variables were analysed. Girls attained the highest intake at 10·6 years and boys 10 years. For FS intake v. mother’s education (B) class 1 (0–9 years), the inflection point is 9·9 years, in class 2 (10–12 years) at 10 years and in class 3 (>12 years) at 11·6 years. Regarding FS intake and household income (C), the lower class had an inflection point of 10·2 years, middle class 10·3 years and higher class 11·5 years. Finally, the FS intake and BMI (D) had an inflection point of 10·2 years, 10·7 years and 11·5 years, respectively, for underweight/normal weight, overweight and obese children.
The estimation of underreporting in this sample was 8·2 % and 1·4 % for overreporting. The sensitivity analysis, including only plausible reporters (90·0 %), showed a similar FS tracking, but the drop observed from 10 to 13 years was attenuated (Graph 2(b)). No inflection points of FS intake were possible to detect. The FS intake during the period from 4 to 13 years was, on average, 4·37 g/year (CI 95 %: 3·94, 4·80), similar to the one in the total sample but the velocity is lower, decreasing by 0·24 g/year2 until 13 years. However, the direction and magnitude of associations between socio-economic factors and FS intake remain similar (online Supplementary Table S2).
Discussion
This study, following Portuguese children from 4 to 13 years, in the scope of a well-established birth cohort, describes the trajectories of FS intake as well as its main food contributors in school-aged children and its associations with their mothers SES.
To our knowledge, there are no studies describing the trajectories of FS intake during childhood. The comparison of our data is difficult since, to the best of our knowledge, no studies reported the trajectories by food source. Also, no study analyses FS intake trajectories and respective food sources at the individual level to help better understand how children’s diets change over time.
In the present study, the trajectories of FS intake during childhood increased from 4 years of age and close to 10 years it stabilised. On average, the FS intake increased 4·6 g/year from 4 to 13 years. The sensitivity analysis only in plausible reporters shows that the increase was, on average, 4·37 g/year with a lower velocity, decreasing by 0·24 g/year2 v. 0·32 g/year2 in the total sample. Also, the findings of this study indicated sweets as the main contributor at all ages. Followed by soft drinks, cereal bars, cookies and biscuits, nectars, cakes and yoghurts. Some of these contributors declined (yoghurts and to a lesser extent sweets) as children grew older and inversely, and soft drink intake presented the highest increase as they became older.
In the ALSPAC cohort in the UK, one of the few studies analysing longitudinally free sugar intake suggested that a growth in the energy intake during childhood is due to the increase of FS, particularly sweet miscellaneous foods, highlighting confectionery (mostly sugar and chocolate)(Reference Emmett and Jones52). In comparison with cross-sectional data in the CCAF/2019 in France, the main contributors in children and adolescents were cake/pastries (16·2 % from the total FS intake), followed by sugary drinks (14·5 % from the total FS intake), and the third main contributor was fruit juices (13·8 % from the total FS intake)(Reference Deshayes, Seconda and Reiser19).
From The National Children’s Food Survey II (NCFS II) in Ireland, the main contributors were sugar, confectionery, preserves and savory snacks (26 % TEI from FS), followed by biscuits, cakes and pastries (18 % TEI from FS), and breakfast cereals (11 % TEI from FS)(53). The findings from the current study aligned with Perrar et al. (Reference Perrar, Schadow and Schmitting54) and colleagues, who studied time and age trends of FS intake in the German DONALD open cohort study in children and adolescents. They found that in three different time periods (1985–1995, 1996–2005 and 2006–2016), the main FS contributor was sweets in all waves representing 38·1 %, 33·4 %, 34·2 % from TEI, followed by juices also in all waves 19·5 %, 22·9 % and 21·6 %. Their third main contributor in the first two periods was SSB with 15·1 % and 15·0 %; however, in the last period (2006–2016), it was dairy products with 12·4 %. Interestingly, the fourth contributor of this last period was SSB, meaning a decline in consumption in German children. Amoutzopoulos et al(Reference Amoutzopoulos, Steer and Roberts21) have similar findings to our study as they found that the main contributors of FS in children and teenagers in the UK from 2014 to 2016 were “cereals and cereal products” for children 4–10 years (33–34 %) and for teenagers “non-alcoholic beverages” (33 %) from which 23 % was from soft drinks and 20 % from fruit and vegetable juices.
Furthermore, in the current study, the consumption of FS in grams was lower in girls than in boys but similar by sex when analysed in %TEI and globally lower than data reported in other European countries. In the IDEFICS study (2007–2008), children aged from 2 to 9 years from eight European countries showed a higher mean intake of 79 g/d (18 % TEI). It also showed that boys had a higher intake in grams a day when compared with girls (81 v. 77); however, FS intake in % of TEI did not differ by sex(Reference Graffe, Pala and De Henauw12). Data from the Food Behavior and Consumption survey in France (CCAF) in 2019 show that the mean intake of FS in young children (3–6 years) is 56·5 g/d (15·6 % TEI) and for children (7–12 years) is 62·3 g/d (15·1 % TEI)(Reference Deshayes, Seconda and Reiser19). The National Children’s Food Survey II (NCFS II), Ireland 2017–2018, registered a mean intake of FS of 38·4 g/d (9·5 % TEI) in children from 5 to 12 years of age(53). Furthermore, the DONALD cohort (1985–2016) in Germany from children to adolescents (3–18 years) had a total FS mean intake of 17·1 % TEI(Reference Perrar, Schadow and Schmitting54). The GRECO study (2009) in Greek children from 10 to 12 years of age showed that their mean FS intake was 63·5 g/d (11·2 % TEI)(Reference Farajian, Risvas and Panagiotakos11). From the Dutch National Food Consumption Survey 2007–2010, it was seen that boys 7–8 years had a mean TEI of FS of 20·7 % and girls 19·9 % when observing 9–13 years it was slightly lower 19·7 % in boys and 19·8 % in girls(Reference Sluik, Van Lee and Engelen20). An Australian study (2007) in children (2–16 years) the FS intake average was 69g/d (14 % TEI)(Reference Louie, Moshtaghian and Rangan55). Ultimately, a UK study using data from the National Survey (2014/2015–2015/2016) children from 4 to 10 years of age had a median intake of 47·8 g/d representing 13 % TEI(Reference Amoutzopoulos, Steer and Roberts21).
In relation to the adherence to the WHO recommendation of FS (<10 TEI%), in the present study, overall half or more of the participants accomplished it in each wave (4, 7, 10 and 13 years) 80 %, 56 %, 58 % and 64 %, respectively. Overall, a low percentage of children adhered to the <5 TEI% of FS per wave was 2 %, 1 %, 1 % and 4·8 % correspondingly. When compared with the ALSPAC cohort in the UK, the adherence to <5 TEI% was lower in British children at all ages (0·1 % at 7 years, 0·4 % at 10 years and 0·8 % at 13 years) as well with <10 TEI% (5·8 % at 7 years, 6·2 % at 10 years and 8·8 % at 13 years) compared with GXXI. The UK National Diet and Nutrition Survey shows in their survey adherence from 2016/2017 and 2018/2019 that only 2 % of the British children from 4 to 10 years consumed <5 TEI% from FS(Reference Buckland, Northstone and Emmett56). In Portuguese children, the National survey 2015–2016 showed a higher level of adherence in children (5–9 years) to the <5 TEI% of FS recommendation, which is 11·3 % and to the <10 TEI% is 51·6 % and in adolescents (10–17 years) is 11·6 % and 51·3 %, respectively(Reference Marinho, Severo and Correia23). Furthermore, in comparison with the IDEFICS study(Reference Graffe, Pala and De Henauw12), the participants meeting the WHO guideline recommendations of <10 TEI% and <5 TEI% were 19·6 % and 4·1 %, respectively. From the CCAF/2019 in France, it was observed that 87 % of the children and adolescents were exceeding the 10 % TEI threshold(Reference Deshayes, Seconda and Reiser19). Dutch children (7–18 years) had an FS intake of 14 % TEI from which none of the participants had an adherence to <5 % TEI and only 5 % adhered to the <10 TEI% between 2007 and 2010(Reference Sluik, Van Lee and Engelen20).
From our results, boys and children from younger mothers had higher FS intake. Higher- maternal SES was associated with lower children’s FS intake, namely, for occupational status, years of education and household income. However, the trajectories of FS intake during childhood do not change according to the different categories of mothers SES. The same trajectory pattern was observed in the three classes of education with an increase from 4 to 10 with a slightly decreased until 13 years. Similar results were observed from the remaining SES variables. The AVON Longitudinal study has found SES disparities in the UK, differences in BMI trajectories among maternal education started to appear at 4 years and continued rising with age but no information on trajectories of FS intake in respect to SES or BMI was reported(Reference Emmett and Jones52). Since no other studies evaluated specific trends in childhood regarding FS intake in the context of SES, we looked at other important sources of FS for children such is the case of SSB. From a Norwegian study regarding consumption trends of SSB from childhood to adulthood regarding the SES inequalities, it was observed that participants with parents in a higher education range had a lower SSB consumption in two time periods compared with those with parents with a lower education. Also, they observed statistical differences between adolescents planning to attend university compared with the ones not planning to keep studying after high school(Reference Bolt-Evensen, Vik and Stea33). Furthermore, a study with data from the HSBC survey (Health Behavior In School-Aged Children) in Nordic countries (Norway, Denmark, Finland and Sweden) regarding food habit trends and their relation to SES in adolescents from three national surveys in different time points (2001/2002, 2005/2006 and 2009/2010) consumption of sweets in Norway from 2001/2002 showed a positive association with SES (OR 1·71, CI 1·06, 2·76) and in Sweden 2009/2010 a negative association was found (OR 0·47, CI 0·26, 0·85). For the remaining Nordic countries, no significant association between SES and sweet consumption in adolescents was observed. Also, they looked at SSB consumption, and only Denmark had a significant negative association (OR 0·47, CI 0·23, 0·95) between SES and SSB consumption(Reference Fismen, Smith and Torsheim57).
Strengths and limitations
One of the main strengths of this study is using a population-based birth cohort, allowing a longitudinal approach to food trends during childhood. To our knowledge, no studies have followed FS trends, and their food sources in children longitudinally and according to SES and few studies have reported the association of FS intake and SES during childhood, which brings new knowledge to the scientific community. Also, the large sample explored food consumption, especially FS intake from food diaries. The use of 3-day diaries covering week/weekend days, coded and handled by trained interviewers from the area of nutrition into a software developed specifically for the Portuguese population could minimise the bias and support accuracy. In order to get more detailed data from the FS intake, some dishes were disaggregated into single ingredients to allow more accurate intake.
Despite the advantages of using diaries, they also could face limitations such as (a) the people filling the diaries would need some literacy. This could imply a participation bias as discussed below; (b) filling up the diaries could be complicated for people who are not used to cooking, facing difficulties with reporting recipes or ingredients; (c) filling the diary could lead to changes in the diet due to reporting. To minimise possible bias, strict instructions were given to the parents and children at 13 years not to change behaviours or anything in their writing report; (d) an additional limitation could be related to the fact that in the first waves, parents reported the food consumption and at 13 years children started reporting the food consumption along with their parents and (e) an additional important disadvantage to take into consideration is the underreporting, particularly in people with overweight or obesity, which tend to underestimate their intake compared with those with a normal weight(Reference Jones, Ness and Emmett58,Reference Lioret, Touvier and Balin59) .
In the present study, only for BMI status different trajectories were observed, particularly obese children reported lower FS intake during the period, and the decrease from 10 to 13 is more pronounced. This could mainly be related to the possibility of children being on a diet, particularly avoiding sugar-based foods. Furthermore, it could be justified by parents misreporting from 4 to 10 years of age and even from children at 13 years, which could explain the more pronounced decline of FS intake from 10 to 13 years in children with obesity. Since a small number of children at 13 years are in dieting (1·1 % of the total sample mentioned being on a caloric restriction), misreporting and the changing methodology of reporting could be the main plausible explanation for this drop, as supported by our sensitivity analysis on plausible reporters.
Another disadvantage could be related to some attrition bias. When comparing participants included and not included in the current analysis, since only participants who fill complete diaries are included, the sample includes older mothers and those belonging to a higher SES. However, the differences found could be related to the large sample size since Cohen’s effect size is not high (<0·35). Even though an underestimation of FS intake occurred due to this bias, it is not expected to affect the general conclusions on tracking and sources. Also, it was possible to find associations between FS and SES and to see the tracking according to the three different categories of SES.
Conclusion
The intake of FS increases during childhood (4·6 g/year) with a pick point in early adolescence and was mainly driven by the increasing intake of soft drinks and nectars. Even children’s FS intake in this period of life was always higher when their mothers had a lower SES, this trajectory pattern did not change according to SES. Only differences in the trajectory of intake were observed by children’s BMI status (a higher decrease in consumption was seen in children with obesity) but attenuated after adjustment for misreporting. Even though Portugal has more policies oriented towards sugar reduction compared with other European countries, this study reinforces the need to develop additional ones to decrease FS intake, targeting its main food sources during this early stage of life.
Acknowledgements
The authors gratefully acknowledge the families enrolled in Generation XXI for their kindness, all members of the research team for their enthusiasm and perseverance and the participating hospitals and their staff for their help and support. The authors acknowledge the support from the Epidemiology Research Unit, Institute of Public Health, University of Porto.
Generation XXI was funded by the Health Operational Programme – Saúde XXI, Community Support Framework III and the Regional Department of Ministry of Health. It was supported by the Calouste Gulbenkian Foundation, by FEDER from the Operational Programme Factors of Competitiveness – COMPETE and through national funding from the Foundation for Science and Technology – FCT (Portuguese Ministry of Education and Science) under the ‘Stimulus of Scientific Employment program– Individual Support’ by the PhD grant UI/BD/152796/2022 (SS).
S. S. was responsible for the study design, interpretation of the data and draft of the manuscript. M. S. was responsible of the analysis and interpretation of the data. A. R. M. was involved in data definition and interpretation of data. C. L. takes part on the conceptualisation of the study and interpretation of results as well as supervised the collection of dietary data. All authors approved the final version of the manuscript.
The authors declare none.
This study was conducted according to the guidelines laid down in the Declaration of Helsinki, and all procedures involving research study participants were approved by the National Data Protection Authority and the Ethics Committee of Sāo Joāo Hospital. Written informed consent was obtained from all subjects/patients.
Supplementary material
For supplementary material/s referred to in this article, please visit https://doi.org/10.1017/S0007114524001740


