


Politics in many of the world’s richest countries seems blocked (Mildenberger Reference Mildenberger2020; Patashnik Reference Patashnik2009). Polarized electorates and entrenched interest groups make it difficult to assemble broad coalitions to tackle challenging problems ranging from climate change to AI regulation. The potential of expanding the “scope of conflict” to break the interest group logjam, trumpeted long ago by Schattschneider (Reference Schattschneider1960), seems increasingly out of reach, given the current polarization of voters and parties and the weakness of other organized actors, such as labor unions or social movements (Hacker et al. Reference Hacker, Hertel-Fernandez, Pierson and Thelen2021; McCarty, Poole, and Rosenthal Reference McCarty, Poole and Rosenthal2016). Business interests flourish under such blocked politics, because they are able to prevent new government rules and dilute any new legislation once it is passed (Hacker and Pierson Reference Hacker and Pierson2010; Stokes Reference Stokes2020), at times with the tacit support of consumers themselves (Culpepper and Thelen Reference Culpepper and Thelen2020).
Nowhere does the power of business seem more pervasive today than in technology, where a handful of giant companies dominates the American political economy (Rahman and Thelen Reference Rahman and Thelen2019). The potential overreach of this influence has alarmed even the most elite corridors of power. Former President Joe Biden warned the nation, in his farewell address, of the “potential rise of a tech-industrial complex” and the corollary threat of a reigning oligarchy in the United States. The prominent presence of the CEOs of the largest tech companies at the inauguration of President Donald Trump, Biden’s successor, only aggravated this unease. In recent years, the European Union has grown increasingly preoccupied about the dominant role of US tech companies in the EU economy (Farrell and Newman Reference Farrell and Newman2019). These concerns are only exacerbated by the fact that none of these companies is European. Across the world, many worry that technology companies are supplanting some functions of modern states. Once the bearers of radical innovation, tech companies are now the breakwaters to new discoveries, motivated as they are to protect their own economic positions by buying up or squeezing out nimbler competitors (Berger et al. Reference Berger, Calligaris, Greppi and Kirpichev2025; Cioffi, Kenney, and Zysman Reference Cioffi, Kenney and Zysman2022; Lehdonvirta Reference Lehdonvirta2022).
Against this backdrop of consolidating tech power, are there moments when broad coalitions emerge in favor of more stringent technology regulation? Studies of policy making show that focusing events—unexpected, eye-catching episodes that bring a policy issue directly into the spotlight—can spark political earthquakes. They can change the public’s perceptions of an issue, forcing it onto the agenda of policy makers and disrupting the status quo (Birkland Reference Birkland1997; Bishop Reference Bishop2014; Kingdon Reference Kingdon1984). In this article, we examine corporate scandals as the kind of focusing event that can produce changes in regulatory preferences and unblock gridlock (Culpepper, Jung, and Lee Reference Culpepper, Jung and Lee2024). Enron and Facebook both experienced scandals that tilted public opinion and then lawmakers against their industries in political debates surrounding regulation (Jones and Baumgartner Reference Jones and Baumgartner2005; Kalyanpur and Newman Reference Kalyanpur and Newman2019). The EU’s passage of the Digital Markets Act and the Digital Services Act, as well as the passage of tough privacy regulation in the state of California, demonstrates that since the Cambridge Analytica scandal, some jurisdictions have started to take on Big Tech (Bradford Reference Bradford2023).
We focus on the microfoundations by which focusing events lead to regulatory reform. That is, we start with voters and the effect of media coverage on corporate scandals on two aspects of their policy views. First, we consider the effects of media coverage of focusing events on policy preferences. Research on policy responsiveness has clearly established that changes in public preferences can shift politicians’ incentives and thereby public policy (Canes-Wrone and Shotts Reference Canes-Wrone and Shotts2004; Caughey and Warshaw Reference Caughey and Warshaw2018; Page and Shapiro Reference Page and Shapiro1983; Stimson, Mackuen, and Erikson Reference Stimson, Mackuen and Erikson1995). Changing preferences is thus the sine qua non of a consequential response to a significant event. Media coverage of corporate malfeasance, we argue, should increase the public’s demand for more regulation of the sector in question.
Yet changes in regulatory preferences are not the only potential consequential response of corporate scandals. The “focus” in focusing events suggests that people not only change their views on an issue but also come to believe that issue is more important and more influential to their vote choice (Krosnick Reference Krosnick1990). Past research finds that at the individual level, issue salience can shape attitude consistency (Krosnick Reference Krosnick1988) and voting behavior (Canes-Wrone, Minozzi, and Reveley Reference Canes-Wrone, Minozzi and Reveley2011; Fournier et al. Reference Fournier, Blais, Nadeau, Gidengil and Nevitte2003; Miller et al. Reference Miller, Krosnick, Fabrigar, Krosnick, Chiang and Stark2016) and enhance both political accountability and responsiveness (Bromley-Trujillo and Poe Reference Bromley-Trujillo and Poe2018; Hutchings Reference Hutchings2003). Accordingly, we are also interested in how media coverage of scandals affects the issue salience of corporate regulation.
To examine these microfoundations empirically, we fielded a two-wave online panel survey across four countries: France, Germany, the United Kingdom, and the United States. The study incorporates several methodological features that distinguish it from existing work in this area. First, we conducted the surveys concurrently across multiple national contexts, allowing for comparative insights. Second, by reengaging the same nationally representative pool of respondents across two survey waves, we were able to pair experimental treatments with rich, pretreatment measures of political dispositions and psychological traits. Third, the experimental design leverages high-fidelity media stimuli, incorporating real-world, long-form news coverage to simulate a naturalistic information environment in four different polities. Together, this combination of features enables a rigorous, cross-country, and causal assessment of how media coverage of corporate malfeasance can shift public opinion and issue salience. The scandal at the heart of our survey experiment, which we present in more depth later, is the 2018 Facebook data breach perpetrated by the political consultancy Cambridge Analytica.
To preview our findings: as per our preregistered expectation, media coverage of corporate scandals increased preferences for the regulation of big tech companies and amplified the issue salience of technology policy in both the pooled results and in all four countries individually. Exposure to the scandal significantly increased anger in all four countries, and that anger triggered shifts in policy preferences, again as per our preregistered expectations. Finally, we found that increases in salience are associated with a greater propensity to participate in politics around the issue of technology regulation.
This article extends to technology regulation previous insights about the effects of corporate scandals on public support for financial regulation (Culpepper, Jung, and Lee Reference Culpepper, Jung and Lee2024). The growing literature on the political determinants of the regulation of big tech companies has focused largely on elite interactions and the power of interest groups (Culpepper and Thelen Reference Culpepper and Thelen2020; Farrell and Newman Reference Farrell and Newman2019; Li Reference Li2023; Thelen Reference Thelen2018); we balance this discussion by integrating consideration of the role and preferences of voters. By linking consumption of media information about corporate scandals to changes in policy preferences and issue salience, our work also contributes to the broader literature on media effects (Barnes and Hicks Reference Barnes and Hicks2018; Ladd and Lenz Reference Ladd and Lenz2009; Leeper and Slothuus Reference Leeper, Slothuus, Suhay, Grofman and Trechsel2020). Most fundamentally, this piece argues for renewed attention to the microfoundations of the events that catalyze public opinion and shape the politics of focusing events (Birkland Reference Birkland, Fischer and Miller2017; Green-Pedersen and Walgrave Reference Green-Pedersen and Walgrave2020; Jones and Baumgartner Reference Jones and Baumgartner2005; Markarian and Newman Reference Markarian and Newman2024).
Media Effects and the Microfoundations of Focusing Events
In today’s online world, many political scientists are almost constantly consuming political news, pausing only to sleep in between refreshing their social media feeds. But under ordinary circumstances, for all but the most sophisticated voters, politics is “out of reach, out of sight, out of mind” (Lippmann Reference Lippmann1922, 18). The daily lives of these voters are simply too strenuous and overloaded for them to be attentive to and keep informed on most policy issues, even those that affect them directly. As a result, the myriad problems that weigh heavily on democratic publics are not always self-evident or salient politically. This is where focusing events have a role to play.
Focusing events are sudden, rare phenomena such as crises or disasters that cast a problem in bold relief, draw the public’s attention to it, and shape the public’s views in ways that propel the issue onto the policy agenda and demand responsiveness from governments (cf. Birkland Reference Birkland1997, Reference Birkland1998; Birkland and Schwaeble Reference Birkland and Schwaeble2019; Kingdon Reference Kingdon1984). We adopt this definition advisedly, both to anchor our research in past work and to try to move this research program forward. All work on focusing events owes a debt to Kingdon, whose capacious definition of focusing events included “a crisis or disaster… a powerful symbol that catches on, or the personal experience of a policymaker” (99–100). The power of focusing events, in Kingdon’s memorable locution, was often to “simply bowl over everything standing in the way of prominence on the agenda” (101). But Kingdon’s definition contained too many different types of things: symbols and experiences differ from events in significant ways for agenda-setting.
Birkland (Reference Birkland1998) narrowed the focus of these events exclusively to disasters. For Birkland, a focusing event meets all the following criteria: it is “sudden; relatively uncommon; can be reasonably defined as harmful or revealing the possibility of potentially greater future harms; has harms that are concentrated in a particular geographical area or community of interest; and that is known to policy makers and the public simultaneously” (54). This stringent definition has dominated how the focusing event is used in the political science and public policy literatures ever since.
Our definition of the focusing event has the advantage of including, for example, financial crises or pandemics that may have widespread rather than concentrated harms and whose characteristics may be discovered by elites ahead of the public.Footnote 1 Goldman Sachs, after all, knew the stock market was tanking well before the general public; that does not make the financial crisis of 2008 any less a focusing event with respect to financial regulation. Here we return to Kingdon’s goal of linking the focusing event and rendering an issue problematic and prominent on the public agenda. We consider our research a friendly amendment to the focusing event literature, one that extends the research on focusing events in two key aspects. First, although prior research often spotlights natural disasters and major accidents like oil spills and nuclear catastrophes, we draw attention to corporate scandals—a less commonly studied kind of focusing event that can produce stark shifts in regulatory preferences and has in the past shown the capacity to break through political gridlock (Jones and Baumgartner Reference Jones and Baumgartner2005). Second, although research on focusing events often emphasizes the elite level of policy entrepreneurs and experts, interest groups, and government leaders, we emphasize the microfoundations of the effect that such events have on setting policy agendas and priorities.Footnote 2
In other words, we zero in on the impact of corporate scandals, as focusing events, on voters. We expect focusing events to potentially move voters in two ways: they could change the policies that voters want (issue preferences); and they could change the importance that voters attach to those policies (issue salience).Footnote 3 Much of the media effects literature has focused on preferences and whether the information consumed through the media changes what policies voters want (e.g., Barnes and Hicks Reference Barnes and Hicks2018). That is rightly a foundational concern for political scientists. But focusing events are also impactful because they potentially change how important those policies that voters ostensibly want are to them. If policy preferences change significantly on an issue but voters continue to regard that issue as relatively inconsequential, politicians may not think it is worth antagonizing incumbent interest groups by trying to change policy (Krosnick Reference Krosnick1990; cf. Baron Reference Baron1994; Culpepper Reference Culpepper2011).
For scandals to influence either preferences or salience, voters need to know about them. Our specific interest is thus on the effects of media coverage of corporate scandals on public opinion. Here, we first acknowledge the long-standing minimalist view of media effects, according to which media coverage has a weak or indeterminate influence on policy preferences and voting behavior (Bennett and Iyengar Reference Bennett and Iyengar2008; Katz and Lazarsfeld Reference Katz and Lazarsfeld1955; McGuire Reference McGuire and Comstock1986). More recently, however, a growing body of scholarship has established evidence for more robust media effects on preferences (Bartels Reference Bartels1993; Gabel and Scheve Reference Gabel and Scheve2007; Huber and Arceneaux Reference Huber and Arceneaux2007; Ladd and Lenz Reference Ladd and Lenz2009). Questions remain about how partisan self-selection into media outlets influences this effect (De Benedictis-Kessner et al. Reference De Benedictis-Kessner, Baum, Berinsky and Yamamoto2019) and whether media content reflects policy and preferences more so than it affects them (Barberá et al. Reference Barberá, Casas, Nagler, Egan, Bonneau, Jost and Tucker2019; Wlezien and Soroka Reference Wlezien and Soroka2024). In the presence of competing media frames, evidence suggests that people fall back on partisan motivated reasoning (Chong and Druckman Reference Chong and Druckman2007; Slothuus and Bisgaard Reference Slothuus and Bisgaard2021). However, in the words of Leeper and Slothuus (Reference Leeper, Slothuus, Suhay, Grofman and Trechsel2020: 154), “there remains little controversy over the core belief that media can—at least sometimes, and in some ways—influence public views, opinions and behaviors.”
There is slightly less agreement, and indeed less research overall in political science, on the effect of media coverage on issue salience. In fact, the literature on issue salience has yielded diverging findings on whether salience is changeable or is instead a largely stable property of opinion. Miller, Krosnick, and Fabrigar (Reference Miller, Krosnick, Fabrigar, Krosnick, Chiang and Stark2016, 150) argue that issue salience—understood as the personal importance of issue areas to voters—is stable over time, because “personal issue importance appears to be rooted in more enduring and thoughtfully generated links between an issue and key elements of a citizen’s self-concept and place in the social structure” (see also Krosnick, Berent, and Boninger Reference Krosnick, Berent and Boninger1994). They distinguish this view of salience stability (understood as personal issue importance) from the less well-formed and entrenched notions of salience as national issue importance, which they view as neither stable nor psychologically consequential (see also Soroka and Wlezien Reference Soroka and Wlezien2010).
By contrast, the media agenda-setting literature has long found that salience—understood primarily as national issue importance—is responsive to cues from elites, the media, and the real world (Behr and Iyengar Reference Behr and Iyengar1985; Fournier et al. Reference Fournier, Blais, Nadeau, Gidengil and Nevitte2003; Hayes Reference Hayes2008; Iyengar and Kinder Reference Iyengar and Kinder1987; see Dennison Reference Dennison2019 for a review of this literature’s treatment of salience). Miller and Krosnick (Reference Miller and Krosnick2000) show that importance judgments mediate the relationship between media exposure and candidate evaluation. Miller (Reference Miller2007, 712) goes back up the causal chain to establish that negative emotions mediate the relationship between media exposure and salience, demonstrating that “when media exposure to an issue causes negative emotional reactions about the issue, increased importance judgments will follow.” In this article we follow Miller’s lead in focusing on the negative content of media coverage to see whether it affects issue salience, understood as personal issue importance.
Our review of past research thus leads us to expect that media coverage of an event like a corporate scandal will move preferences in favor of regulation and increase issue salience. Given our larger interest in the impact of focusing events on policy response, we further consider the extent to which increasing issue salience can spur greater political participation. Simply agreeing that an issue is important can be cheap talk, but expressing a willingness to act on those beliefs gets the attention of politicians. The best evidence for this link between issue salience and voting comes from the literature on immigration and voting for parties of the far right. Scholars have found evidence that it is the increased salience of immigration, rather than changes in immigration preferences per se, that accounts for the rise in far-right voting (Boomgaarden and Vliegenthart Reference Boomgaarden and Vliegenthart2007; Dennison Reference Dennison2020; Ivarsflaten Reference Ivarsflaten2008). Other scholars find that anti-immigrant voters regard immigration as a more salient issue than do pro-immigration voters, on average (Kustov Reference Kustov2023).Footnote 4
The potential effects of focusing events not only on increased salience but also on a greater willingness to participate in politics evoke V. O. Key’s (Reference Key1961, 263) notion that “latent opinion is really about the only type of opinion that generates much anxiety.” Key adds, “The risks of governance come in part from uncertainties about whether mass attention will be mobilized or whether it will remain indifferent and uninformed” (265). Focusing events like corporate scandals create the conditions to overcome such uncertainties by drawing the public’s attention to a scandal, centering negative information about corporate behavior, and coordinating action in response to that behavior. This is one pathway for latent opinion to become activated. In the second half of this article, we therefore return to the issue of how changing salience changes the propensity to participate in politics, particularly among those voters who normally view themselves as powerless.
Corporate Scandals as Focusing Events
Scandals, whether they involve corporations or politicians, have three defining features: a transgressive act, whether of laws or norms; the public revelation of that transgressive act; and intensive mediatized coverage of the event, animated by public disapproval (Adut Reference Adut2008; Nyhan Reference Nyhan2014; Thompson Reference Thompson2000). Beyond the definitional level, however, corporate scandals differ in important respects from political scandals, which have been the subject of much more political science scholarship. Political scandals are media feeding frenzies around acts of alleged malfeasance by those occupying or seeking political office, but many events never get covered by the media in a way so as to become viral events (Entman Reference Entman2012; Nyhan Reference Nyhan2014). The political scandals we observe in the world are only subsets of the universe of potential scandals, many of which the media does not seize on. Media incentives are therefore important to understand, as is the extent to which the media agenda is already congested (Nyhan Reference Nyhan2014). Nyhan’s (Reference Nyhan2014; Reference Nyhan2017) work, in particular, has emphasized that scandals are more likely to break out when politicians, whether presidents or governors, have low approval ratings. He argues that lower approval ratings reduce the costs for opposition politicians who attempt to publicize an event as scandalous and that the media and opposition politicians together create a ratcheting effect in generating more coverage around potential malfeasance events, such that they become full-blown scandals (Nyhan Reference Nyhan2014, 439).
Once they do break out, political scandals can have important effects on public opinion, but these effects may be attenuated by partisanship and the media environment. Scandals generally depress the vote share of affected politicians in subsequent elections (Basinger Reference Basinger2013; Rottinghaus Reference Rottinghaus2023). Funck and McCabe (Reference Funck and McCabe2022) find that when the only thing a voter knows about a candidate is their partisanship, association with a scandal lowers the likelihood of voting for the candidate by 12–26 percentage points. However, in high-information environments in which respondents know a lot about candidates, that effect size often falls to zero. Given the role of motivated reasoning, the information environment can play a decisive role in how scandals influence public opinion. Partisans react more strongly to moral transgressions by politicians on the other side of the aisle (Walter and Redlawsk Reference Walter and Redlawsk2019), and newspapers of the left are more likely to cover scandals of the right, and vice versa (Puglisi and Snyder Reference Puglisi and Snyder2011). Our media sphere is increasingly fragmented, so the ability of earlier political scandals such as Iran-Contra to prime the broad public (Krosnick and Kinder Reference Krosnick and Kinder1990) may be less likely if viewers hear different, partisan-influenced stories on Fox News than on CNN.
Unlike political scandals, however, corporate scandals typically lack this partisan element. They are more likely to be valence events, with all parties denouncing the wrongdoing and promising to deal with it most effectively. The exception is when corporate scandals involve politicized figures, such as politically active CEOs (Culpepper, Lee, and Shandler Reference Culpepper, Lee and Shandler2026a). The media still plays a fundamental role in scandal production in corporate scandals, of course. But without the signals from opposition politicians that are often the origin of potential political scandals, the media actors involved in corporate scandals have to bet on what will resonate with public opinion. Our article does not theorize which corporate scandals succeed in catching the public eye. But we expect that the very fact of scandals being a media coproduction means that only those revelations that are considered genuinely shocking—and therefore, more likely to reach the cascading level of news coverage required to develop into a scandal—will draw the scarce attention of journalists.
Because corporate scandals contain shocking revelations, they reduce a complex policy story to a simple morality tale. Scandals always have a moral valence, typically confronting the public with a clear villain (the corporate transgressor) who has violated a shared norm or law. The publicity around that norm violation means that scandals are what Adut (Reference Adut2008, 23) calls “moral disturbances”: the transgression is observed collectively, and the public response is driven by shared moral disapproval. Political scandals, at least those in many of today’s polarized polities, lack this shared moral outrage that crosses partisan lines.Footnote 5 The power of the corporate scandal, compared to the political scandal, lies in the shared moral narrative it tells (Culpepper and Lee Reference Culpepper and Lee2026).
At the same time, the revelation at the heart of scandals is educational: it brings voters new information about policy areas. Writing about policy-making systems, Jones and Baumgartner (Reference Jones and Baumgartner2005, 55) argue that “new information carries with it the possibility to shock, to disrupt, and to destabilize as it intrudes into the policy process.” They use the example of the Enron and WorldCom corporate scandals to illustrate this aggregate process. Our claim is that corporate scandals have a disruptive effect on macro-political equilibria only because they have that same effect on individual attitudes. The latter drives the more easily observed effect of the former. Reporting on corporate scandals presents new information in a censorious register, which shifts the calculus of considerations that shape voters’ expressed views on policy questions (cf. Zaller Reference Zaller1992).
There is a smaller literature on the political consequences of corporate as opposed to political scandals, but media coverage of banking scandals has been shown to change preferences for financial regulation (Culpepper, Jung, and Lee Reference Culpepper, Jung and Lee2024). Our approach builds on this work but applies it to the domain of technology regulation. We focus on Facebook/Meta, one of the world’s best-known technology companies. Our question is whether the informational and emotional content of corporate scandals can both move preferences in this domain in favor of stricter regulation and increase the salience of this regulation.
The regulation of Big Tech, like financial regulation, is what Carmines and Stimson (Reference Carmines and Stimson1980) call a hard issue: it is one where responses are not visceral, and partisan politics has not yet established clear differences associated with different parties. Technology policy is complicated, and many voters do not have crystallized views about it. When presented with a corporate scandal affecting a Big Tech company, we expect they will be more open to considering changing their minds, because they may have not fully made up their minds yet. How often does the average voter think about technology regulation? Not often and not with the clear signals from partisan leaders associated with easy issues such as abortion. It is in hard issue areas that we expect scandals can have a significant impact on opinions. Just as corporate scandals are not often partisan events, hard issue areas are unlikely to be subject to clear patterns of partisan divergence. For both reasons, we expect that corporate scandals are more likely to change minds across the board than are political scandals.
Because they are fundamentally moral stories, we expect that the emotional response that corporate scandals evoke will be especially consequential. Emotional responsiveness is a key factor in preference changes that result from exposure to news (Gross Reference Gross2008; Kim and Cameron Reference Kim and Cameron2011). For instance, the ability of episodic news stories to generate support for specific policies depends to a large degree on the intensity of people’s emotional reactions (Aarøe Reference Aarøe2011; Aarøe and Petersen Reference Aarøe and Petersen2020). Among the various emotions that news reporting elicits, anger is particularly potent at shifting policy preferences, because it impels positive action, is driven by a desire to correct perceived injustices, and depresses the search for competing political information (Halperin et al. Reference Halperin, Russell, Dweck and Gross2011; Valentino et al. Reference Valentino, Brader, Groenendyk, Gregoriwicz and Hutchings2011; Wagner Reference Wagner2014).Footnote 6
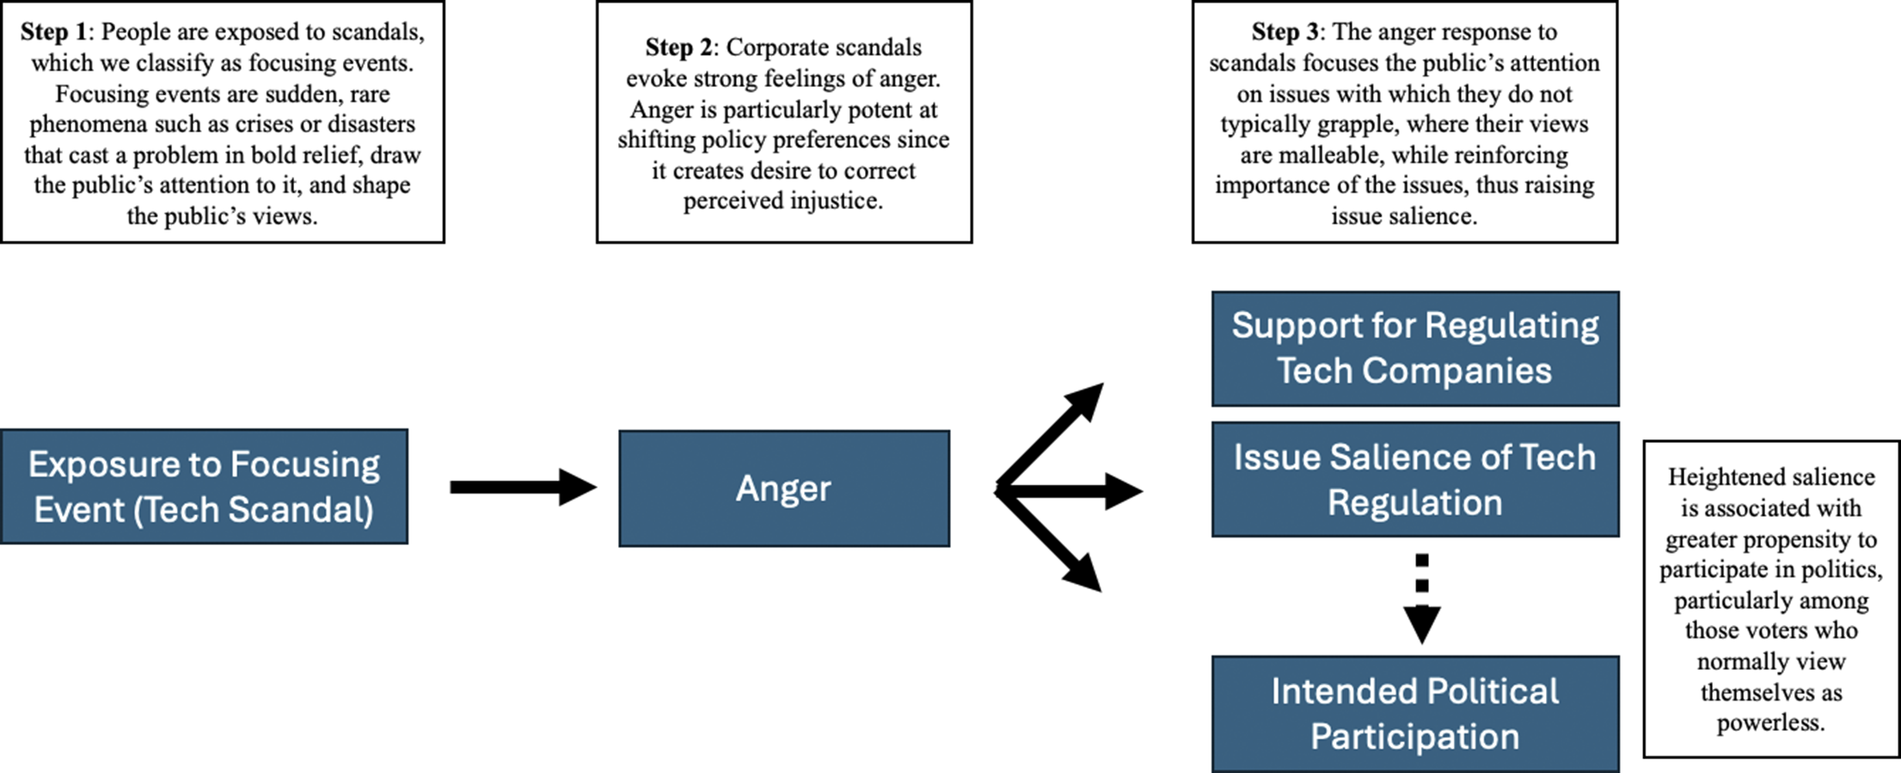
Public outrage is almost a definitional characteristic of the media coverage of scandals, and we anticipate that reading about corporate scandals will trigger large increases in anger. For all these reasons, we expect media coverage of scandals to increase preferences for more stringent government regulation in related policy areas. We also expect these same considerations—clear villain narratives about corporations, new information about the actions of these large companies, and anger created by the perception of wrongdoing—to influence issue salience. Finally, we hypothesize that increasing issue salience is associated with a greater willingness to engage politically to demand policy reform. For ease of reference, we illustrate our full conceptual model in figure 1, highlighting the predicted relationships between the key variables.
Conceptual Model Linking Scandals, Anger, and Political Behaviors

Research Design
To examine how media coverage of corporate scandals shapes voters’ regulatory attitudes, our research design incorporated several critical features. First, it was conducted simultaneously across multiple countries to enable a comparative analysis of contextual dynamics. Second, it surveyed a large and diverse sample of respondents to facilitate heterogeneous subgroup analyses. Third, it employed two waves of surveys among representative samples to capture detailed pretreatment dispositional and demographic variables while minimizing the risk of priming. Finally, it used authentic media content reflective of the coverage that individuals were likely to encounter in everyday media environments. This combination of features constitutes the gold standard of comparative experimental survey research.
We conducted a two-wave survey experiment in four countries: France, Germany, the United Kingdom, and the United States.Footnote 7 We chose these countries because they are democratic centers of technology innovation where tech regulation is internationally consequential (Bradford Reference Bradford2023), and where public opinion could reasonably be expected to spur policy makers to adopt more stringent regulatory postures.
We fielded the first wave of the study in March 2023. This preliminary survey measured participants’ baseline levels of support for technology regulation and collected demographic, psychological, and political data. There were no experiments in this wave. Using a dedicated survey instrument to collect dispositional and sociopolitical variables avoids the concern of these variables priming participants (as they could have if collected immediately prior to the experimental treatments) and steers clear of the issue of respondents being influenced by the treatments (were they to be fielded after the experimental stimuli). A full list of the scales and sources of all collected measures are in online appendix A.
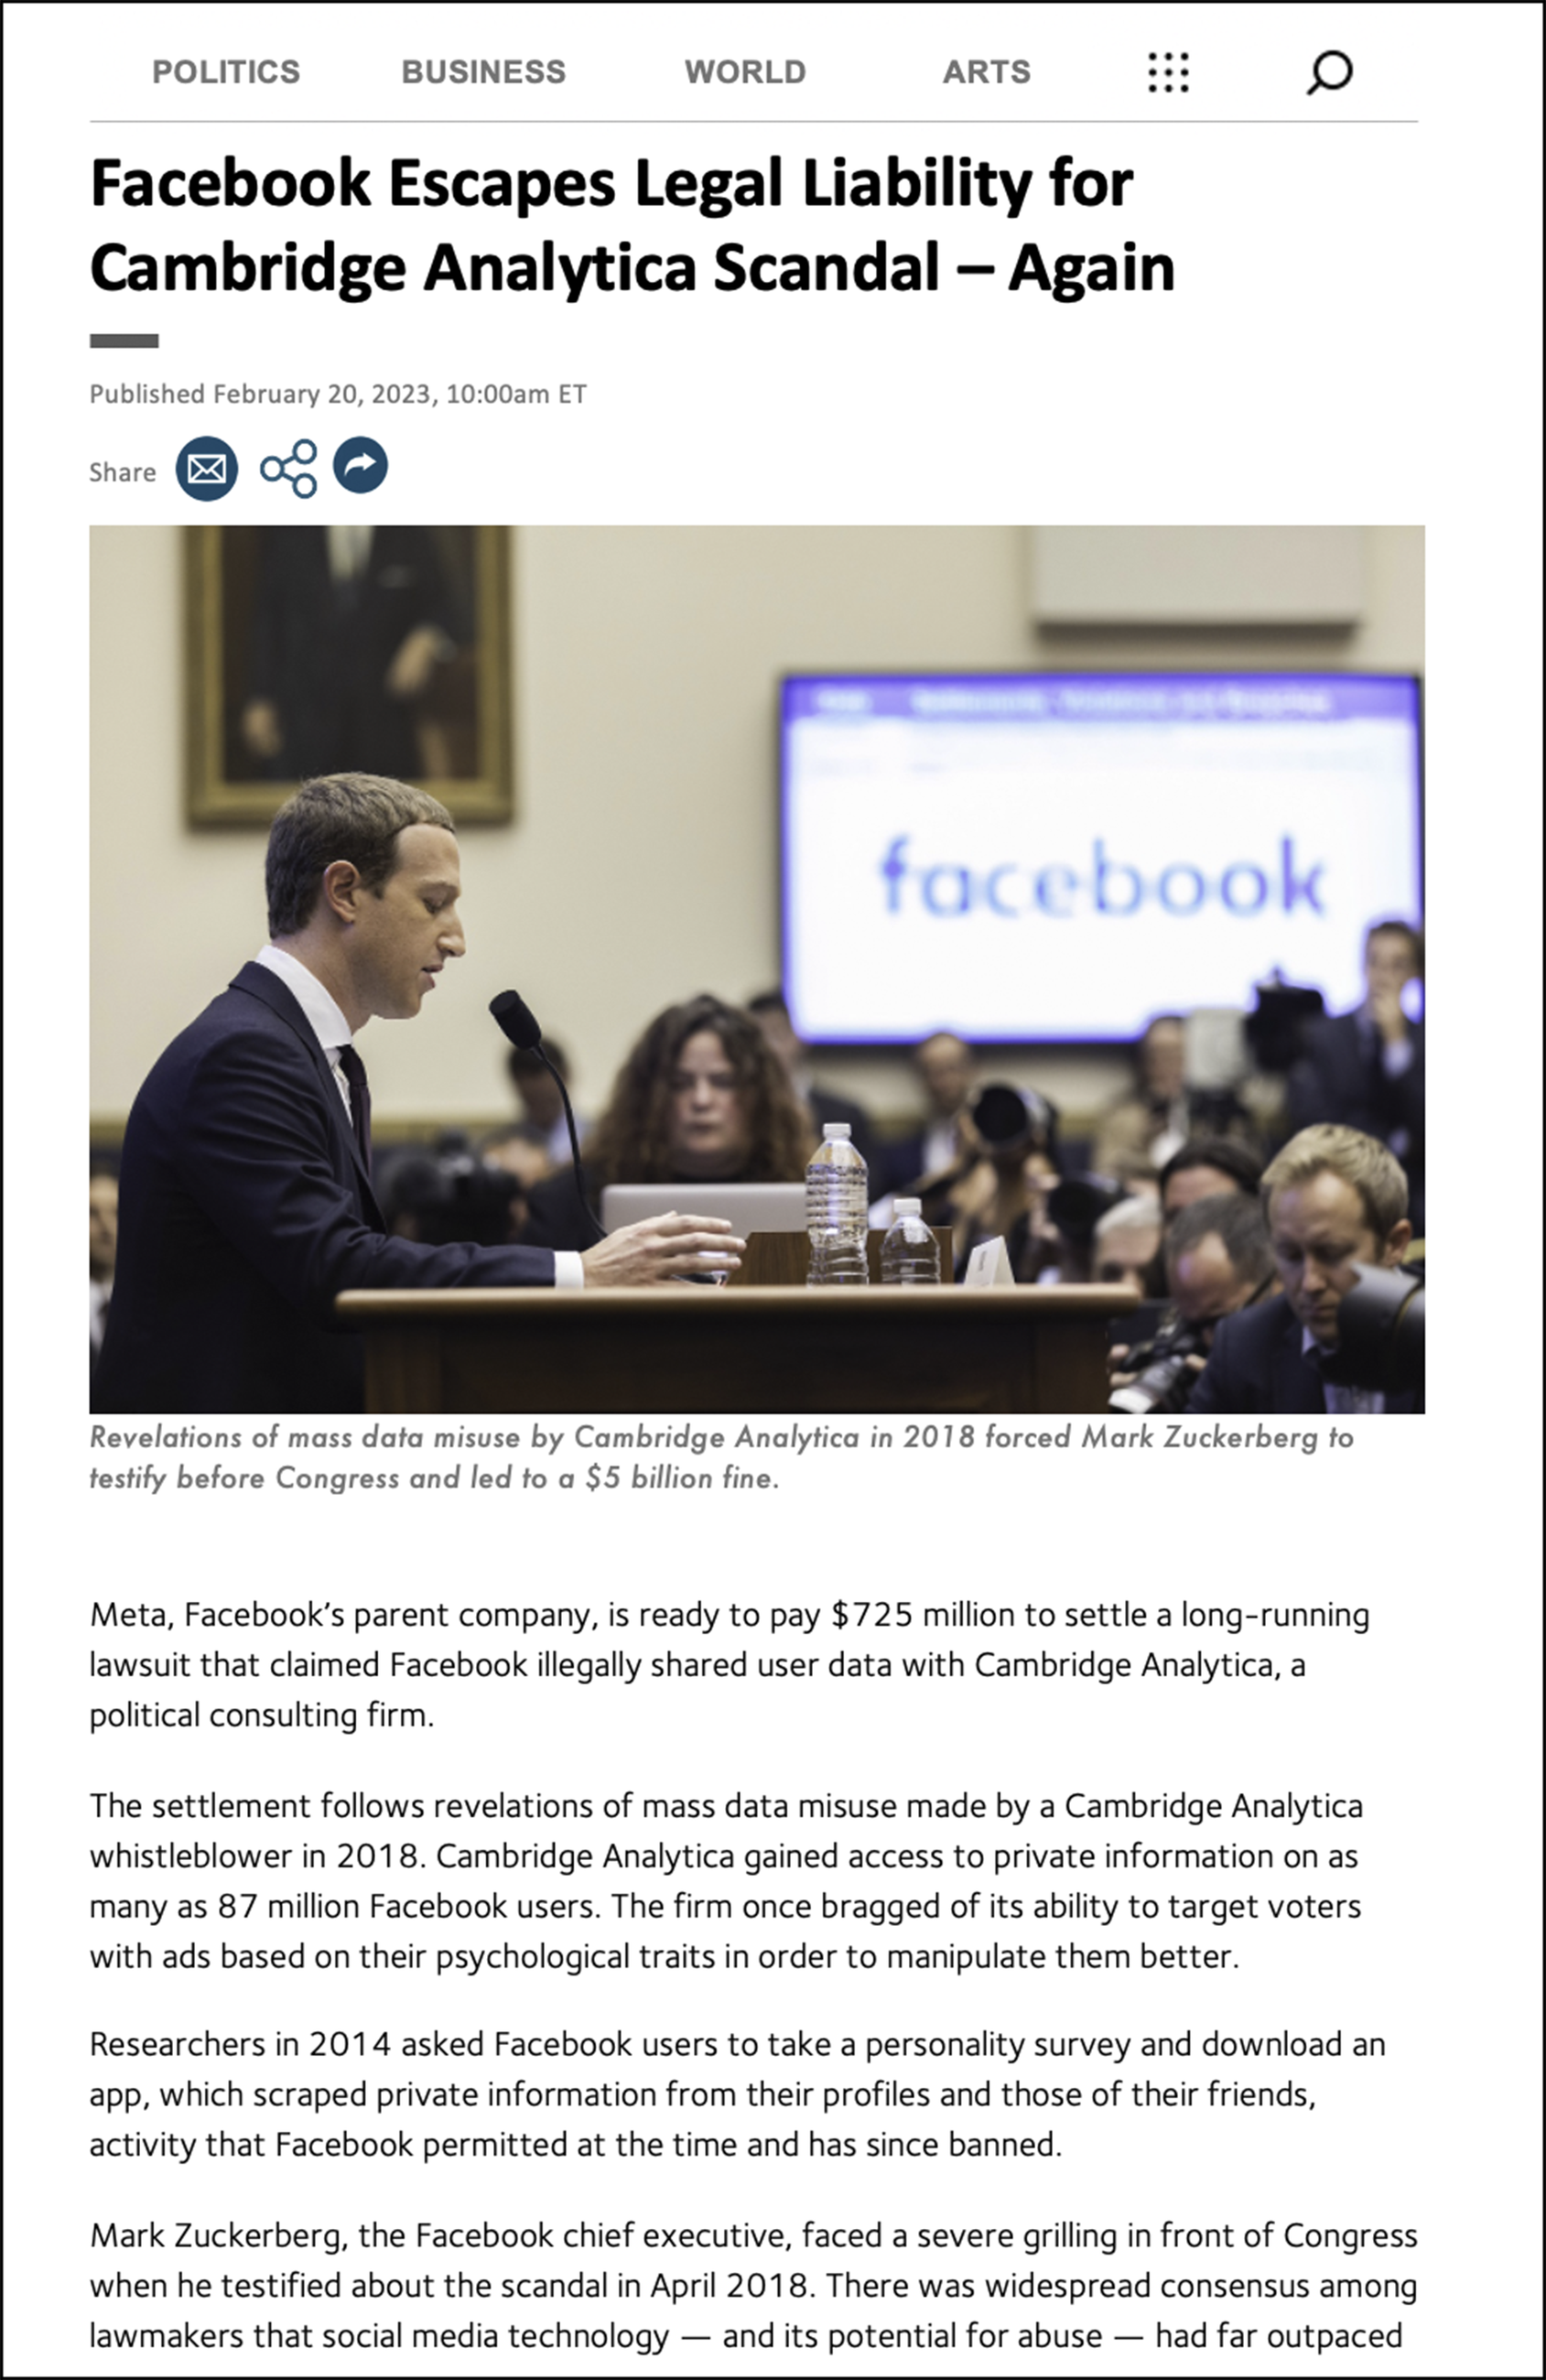
In the second survey wave, to which they received an invitation 10 days later, participants were randomly assigned to one of two experimental arms: a technology scandal treatment group or a control group.Footnote 8 The technology scandal arm was focused on the Cambridge Analytica scandal, which had been widely reported in all four countries. The scandal article reported the salient facts of the original incident: through a Facebook app, Cambridge Analytica gained access to private information from as many as 87 million Facebook users. This information gave Cambridge Analytica the capacity to micro-target voters and thereby potentially influence their behavior. It also reports on the court cases stemming from the original scandal in which Facebook/Meta has since been involved.
We based each of the country’s media treatments on articles that appeared in the press, staying close to the language and style used in the respective national media ecosystems. The article themes and language were similar in treatment groups across countries, and the format and pictures used were identical. We devised the headlines and picture captions to reinforce the central experimental manipulation of each piece. An excerpt of the technology scandal article appears in figure 2, and full copies of the articles used in all four countries appear in online appendix B.
Screenshot of the Scandal Treatment Article
Note. This is the first page of the experimental treatment used in the United States. Copies of complete articles from all countries appear in online appendix B.

The control articles report on the business practices of Office Depot, Next, dm, and Carrefour in the United States, United Kingdom, Germany, and France, respectively. We chose to focus on these well-known corporations to ensure that it was scandalous corporate behavior that was driving the treatment effects, and not the mere mention of businesses. The control article intentionally adopts a neutral tone, discussing the companies’ regular business practices. For example, in the Office Depot article, the article explains that the company, best known for its retail office supplies business, has transformed into a full-fledged business-to-business (B2B) solution provider.
Accounting for a retention rate of 72% between waves 1 and 2,Footnote 9 a total sample of 3,986 participants completed both waves across the four countries: 983 in France (FR), 1,046 in Germany (DE), 1,001 in the United Kingdom (UK), and 956 in the United States (US). The survey was fielded by YouGov and uses YouGov’s methodology to draw representative samples of each country’s population.Footnote 10 We pretested all articles before data collection, using manipulation checks to verify that readers succeeded in identifying the key messages. We also preregistered our expectations about the effects of scandals before launching the experiment; an anonymized version of the pre-analysis plan is in online appendix L.
Dependent Variables
We measured three dependent variables of interest: voters’ preferences toward regulating technology companies, the salience of tech regulation as a political topic, and voters’ intention to participate politically in this issue space. For our questions about policy preferences, we were unable to find a well-established, cross-nationally validated measure that captured voters’ preferences regarding the regulation of technology companies. We therefore decided to create such a scale, following the maxim of Ansolabehere, Rodden, and Snyder (Reference Ansolabehere, Rodden and Snyder2008) that scales are more reliable and less subject to measurement error than are individual questions. These features are especially appropriate for an issue area like technology regulation that has multiple facets and cannot be boiled down into a single question.
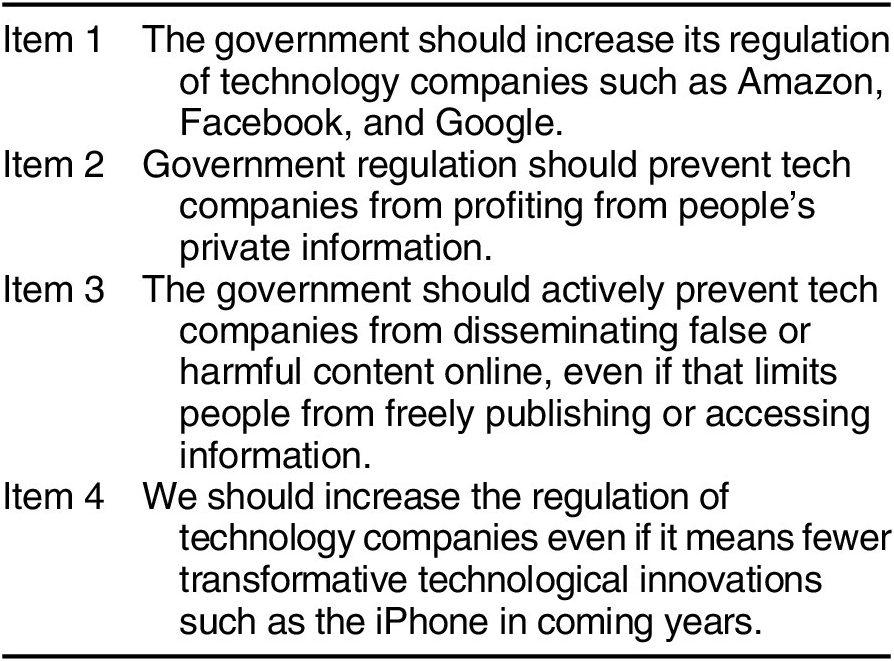
This process resulted in a set of items we call the Technology Regulation Scale. We began by devising a series of 10 prospective statements on the basis of a review of the technology policy literature, identifying key areas of policy as competition/antitrust, privacy regulation, the proliferation of fake news, and the trade-off between regulation and innovation (Bradford Reference Bradford2023; Cioffi, Kenney, and Zysman Reference Cioffi, Kenney and Zysman2022; Farrell and Newman Reference Farrell and Newman2019; Rahman and Thelen Reference Rahman and Thelen2019). We then conducted nine pilot studies across our countries of interest. We conducted exploratory and confirmatory factor analyses to whittle down the scale to produce a final set of four policy items with high internal validity (Cronbach’s α = 0.778) and cross-national legitimacy. These items are displayed in table 1. For details about the cross-national validation process, see online appendix D (Culpepper, Lee, and Shandler Reference Culpepper, Lee and Shandler2026b).
Technology Regulation Scale Items

The first item assesses respondents’ general appetite for regulating large tech companies; the second adds the context of tech companies profiting at the expense of individuals’ privacy rights; the third item asks about trade-offs between public harms from online content and free expression and open access; and the fourth measures the trade-off between regulation and innovation. We offer this scale as an appropriate survey instrument for future researchers who are investigating attitudes toward technology regulation in comparative perspective.
Issue salience is somewhat easier to measure. Miller, Krosnick, and Fabrigar (Reference Miller, Krosnick, Fabrigar, Krosnick, Chiang and Stark2016, 149) present convincing evidence that “when evaluating candidates for public office, making vote choices, and expressing policy preferences directly to elected officials and the news media, citizens are apparently focused primarily on issues they consider to be personally important rather than issues they consider to be nationally important.” In line with these findings, our salience question asked respondents: “How important is the issue of big tech and regulating technology companies to you personally?”
For political participation, we asked respondents how likely they are to engage in the following activities during the coming year: participate in a protest march, rally, or demonstration about tech companies; sign an online petition about tech companies; contact their political representative about tech companies; and seek out more information about policies related to tech companies (cf. Gibson and Cantijoch Reference Gibson and Cantijoch2013). Responses for all three scales were registered on a five-point Likert scale: higher numbers indicate a greater demand for technology regulation, greater issue salience, and a stronger intent to engage politically in this issue space.
Results
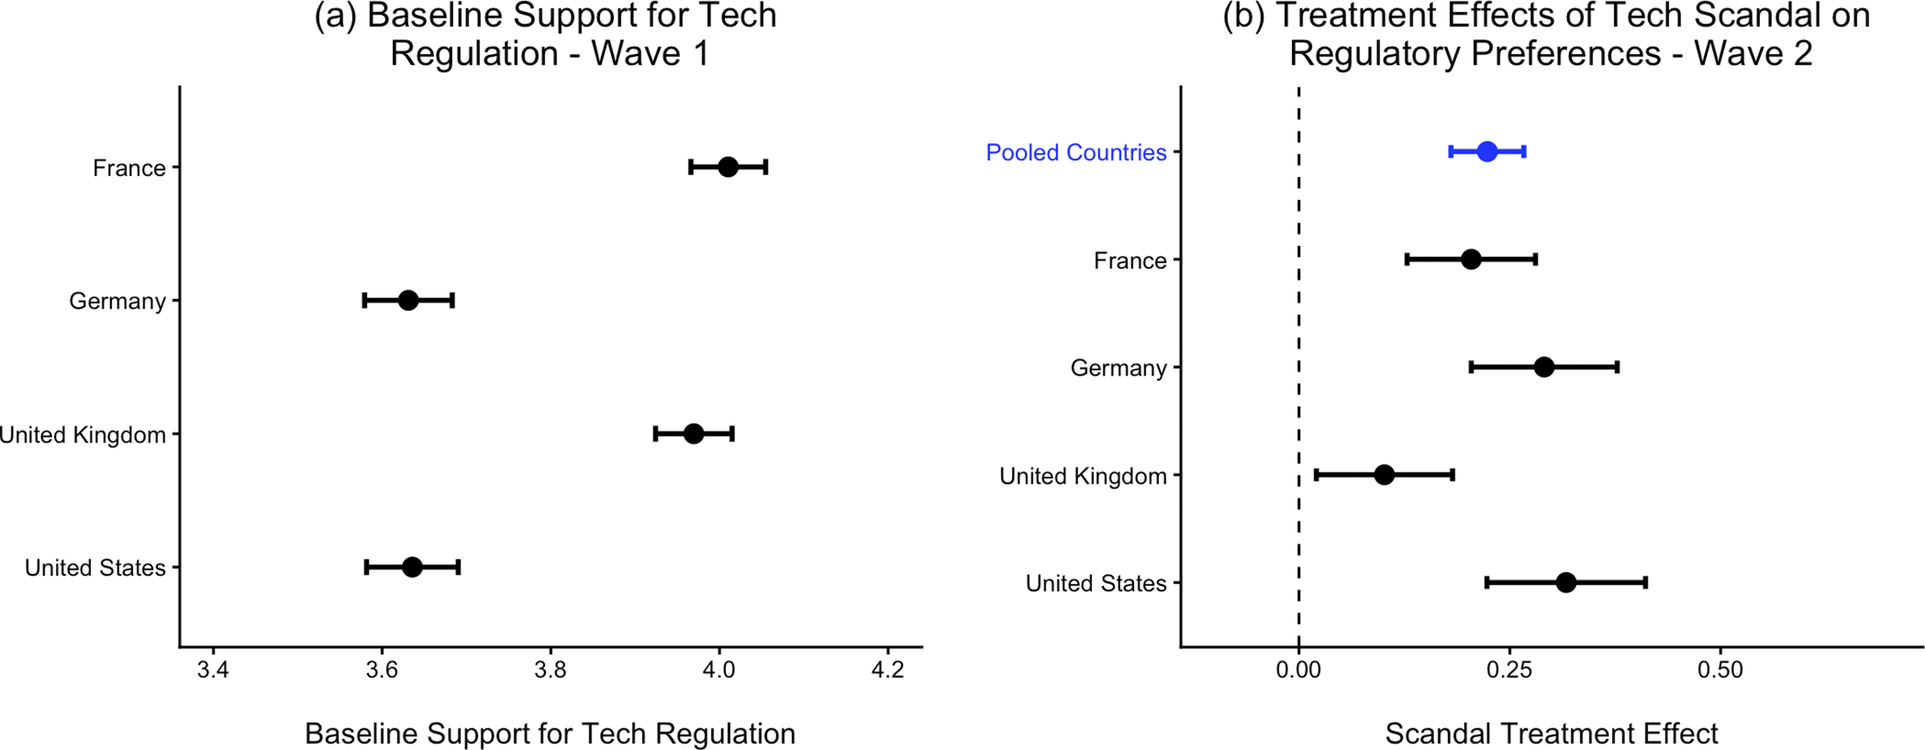
Our baseline survey data, drawn from the pre-experimental first wave, allowed us to characterize the prevailing attitudes toward technology regulation across the four countries in our study. As shown in panel a of figure 3, Americans and Germans want lower levels of technology regulation than do the British and French, although respondents in all countries lean more toward than away from regulation on our five-point regulation scale. From this baseline, we can now test our central question, examining whether exposure to media coverage of a major technology scandal will cause people to adopt more pro-regulatory attitudes. Panel b presents the answer to this central question, with the plot revealing the treatment effect of exposure to the scandal article (relative to the neutral control article), across the pooled dataset and for each country.Footnote 11
Baseline Level of Support and Effect of Scandal on Support for Tech Regulation
Note. Dots indicate group mean scores, and bars depict 90% confidence intervals. Scale ranges from 1 (least support for regulation) to 5 (most support for regulation). In panel b, for the pooled sample and all four country samples, there is a statistically significant difference at p = 0.10 level between members of the treatment and control group as depicted by the upward slope. Specific point estimates and confidence intervals are detailed in online appendix E.

For the pooled sample and for each individual country, the data reveal that exposure to the negative content of scandal coverage significantly increases demands for regulation. Even though regulatory preferences began from a lower starting point in Germany and the United States (as shown in figure 3a), the Facebook scandal affected preferences for the regulation of technology similarly across all four countries, for which the effects are positive and significantly different from zero.Footnote 12 The effect is significantly larger in the United States (0.32) than in the United Kingdom (0.10), but the country effects are otherwise indistinguishable statistically.
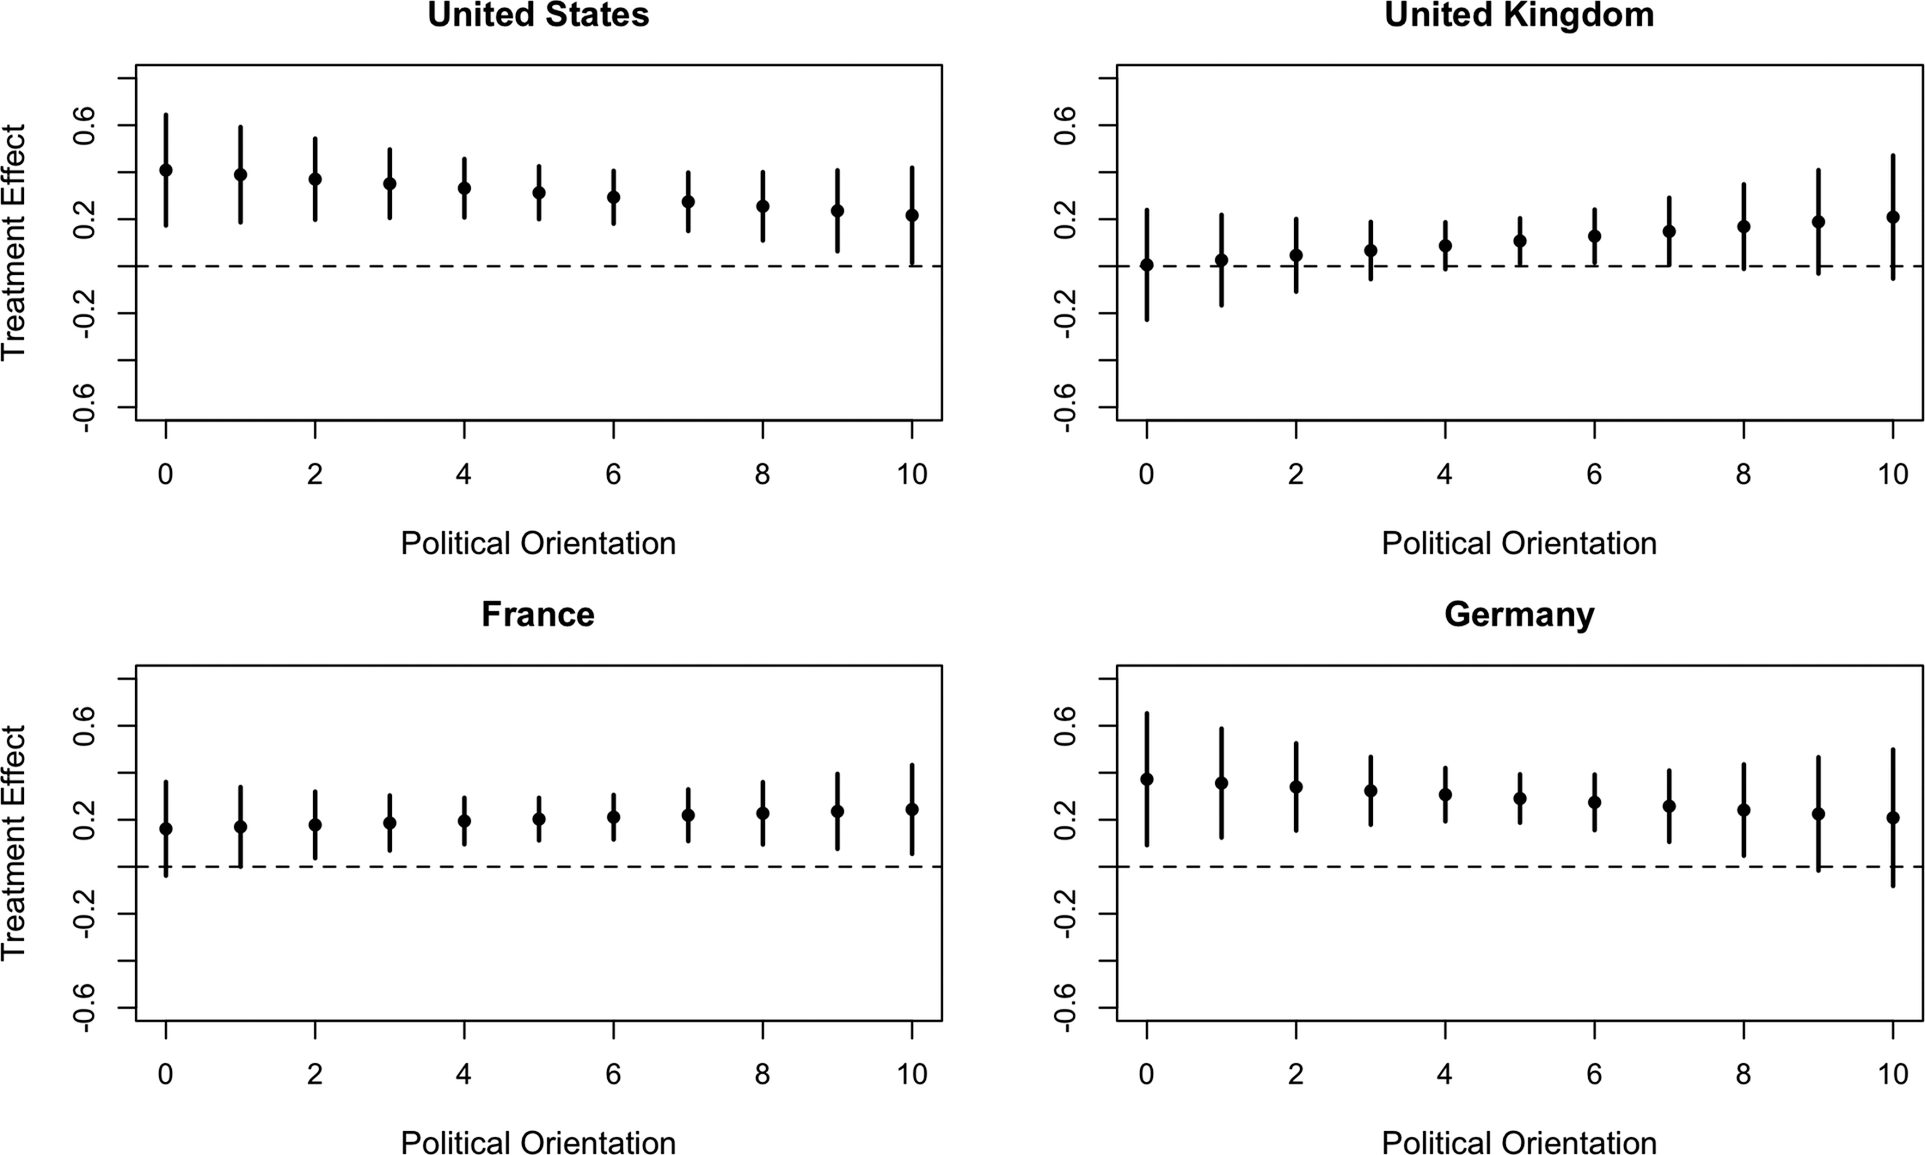
Focusing events are important for policy making in democracies because they create a widely shared perception of a failure of existing policy. Presumably this perception cuts across ideological lines, which is why it catches the attention of politicians on all ends of the spectrum. But that is something we should test and not assume. Those on the right often prefer less regulation than those on the left, so it may well be that exposure to a scandal increases preferences for regulation of big tech companies but only among those on the left, who are already predisposed to consider more regulation a solution to policy problems identified by a scandal. However, that was not in fact what we found. In figure 4 we present interaction analyses detailing the marginal scandal treatment effect at each level of political orientation, and the results confirm that in none of our four countries did we observe a significant difference in the reaction to the scandal treatments between those on the political right and those on the political left.
Political Orientation and the Effect of the Scandal Treatment on Tech Regulation, by Country
Note. The panel shows the marginal effect of the scandal treatment (with 95% CIs) on support for regulating big tech companies along the values of political orientation, where 0 = strong progressive and 10 = strong conservative.

Indeed, one useful way to consider the average causal effects we observed on technology policy is to think about their effects on the size of support for potential reform expressed by people in different ideological camps. Prior to our treatment, in wave 1 of the survey, only 36% of treated centrists and conservatives indicated strong support for regulating tech companies, along with 53% of treated progressives.Footnote 13 The absence of broad cross-party majorities can be the death knell for the regulatory reform initiatives that often follow focusing events, especially when there are entrenched interest groups. Yet in wave 2, following our treatment, the number of strong supporters rose to 50% of treated centrists and conservatives and 63% of treated progressives. At least in our pooled sample, exposing people to media coverage of the technology scandal brought into being majority support that crossed the political spectrum.
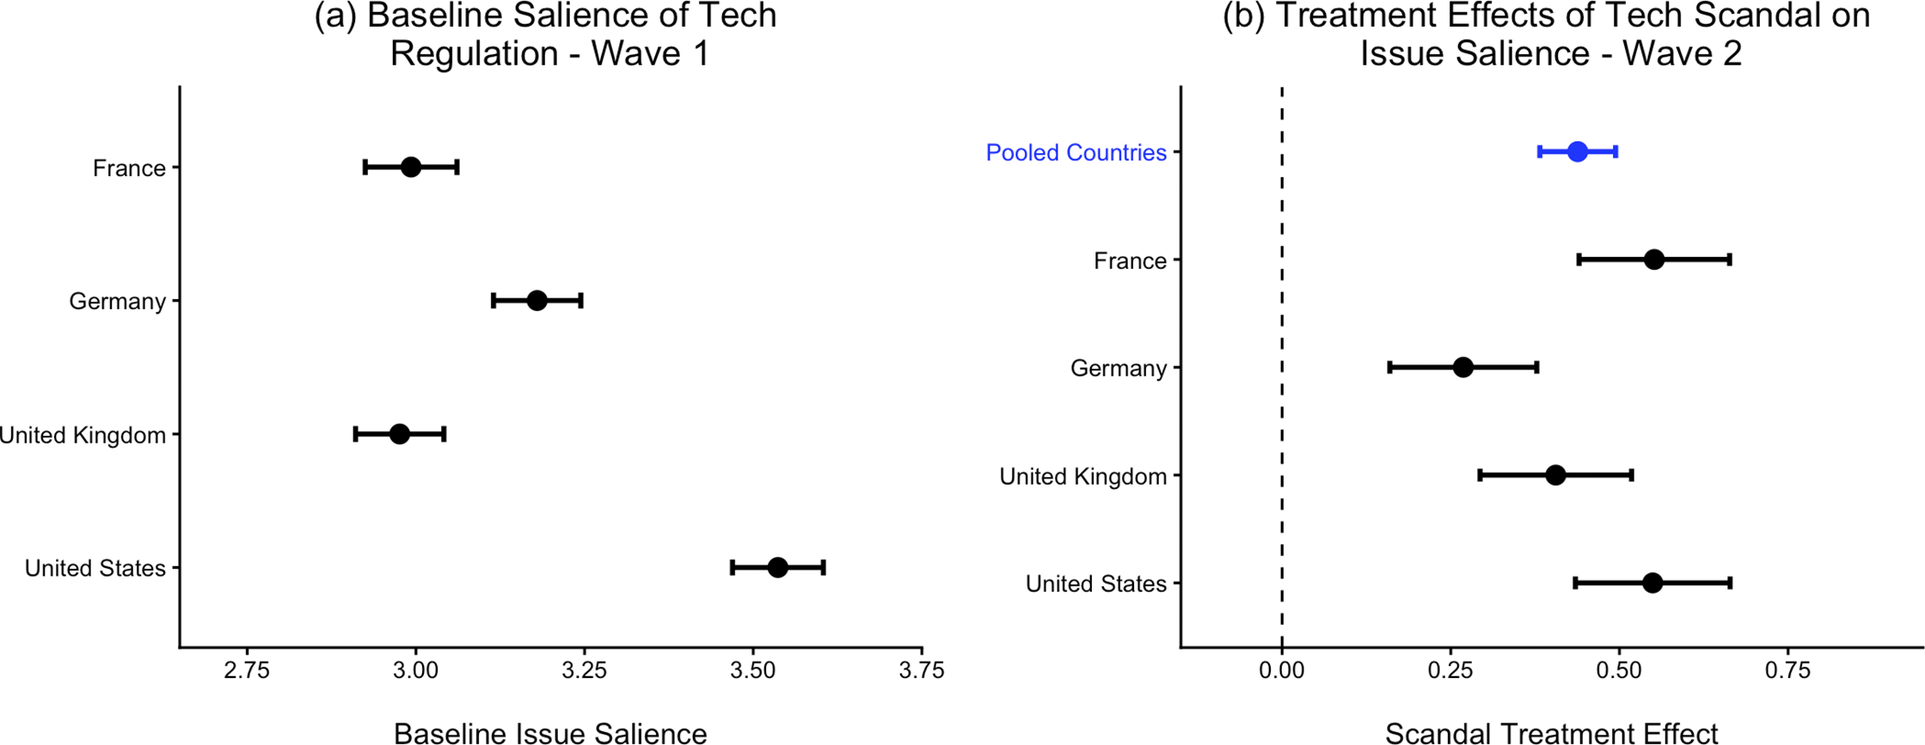
Having explored the effect of public exposure to media coverage of corporate scandals on support for tech regulation, we next turn to the second hypothesized outcome that should emerge from the focusing event: increases in issue salience. We begin by laying out in figure 5a the baseline level of issue salience as measured in wave 1, prior to any experimental treatments. We have already seen that Americans want lower tech regulation than the British and French. However despite this regulatory reluctance, we also found that Americans view technology regulation as more important to them personally than people in any of the other three countries. The Germans also view tech as slightly more salient than do the British and French, despite having lower average preferences for regulation.
Baseline Salience and Effect of Scandal on Issue Salience of Tech Regulation
Note. Dots indicate differences group mean scores, and bars depict 90% confidence intervals. Scale ranges from 1 (low issue importance) to 5 (high issue importance). For the pooled sample and all four country samples, there is a statistically significant difference at p = 0.10 level between members of the treatment and control group as depicted by the upward slope. Specific point estimates and confidence intervals are detailed in online appendix H.

From this baseline, in figure 5b, we conducted the same analysis that we ran for regulatory preferences (in figure 3b), although this time we shifted our attention to issue salience as the outcome variable. In addition to increasing pro-regulatory preferences, exposure to negative scandal coverage significantly increased the salience of regulation. The magnitude of the effect on the salience of technology policy was large and statistically significant, reaching an average effect of 0.44 units in the pooled sample (p = 0.000) and up to 0.55 units in the United States and France (p = 0.000). This is consistent with our preregistered expectation for all four countries.
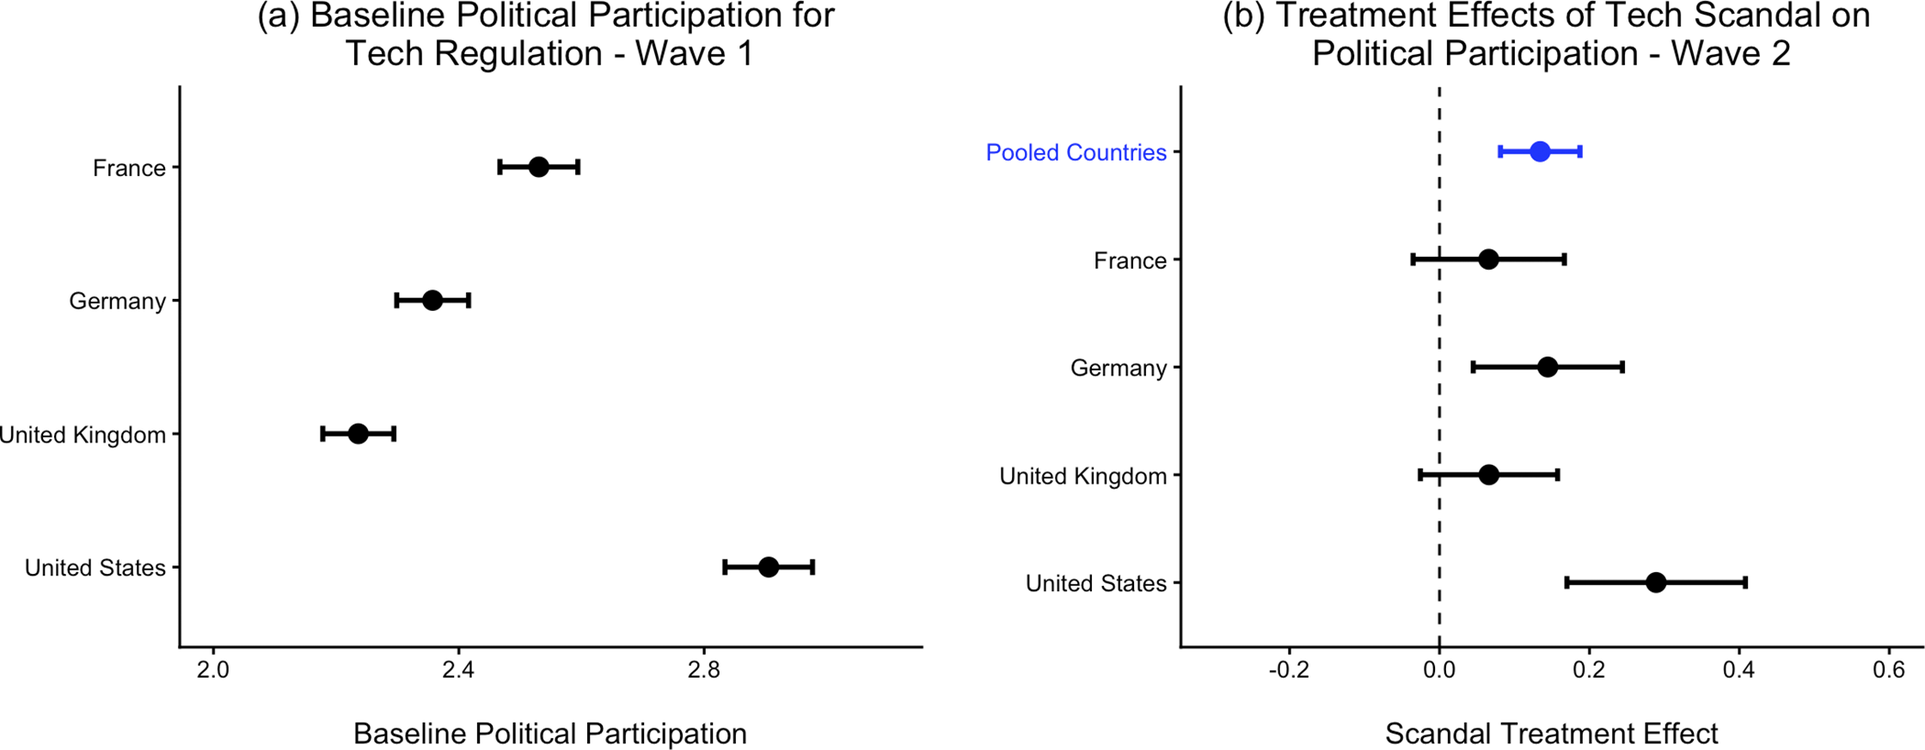
As we discussed earlier, the rise in salience is consequential for understanding the microfoundations of focusing events because it might prompt previously quiescent people to participate in politics. To evaluate this possibility, we began by considering the direct effect of exposure to the scandal treatment on participation. We preregistered the expectation that exposure to the treatment would increase participation in the pooled sample and in all countries. Panel b of figure 6 shows our results for participation. As expected, our scandal treatment triggered a corresponding significant increase in intended political participation in the pooled data and in two of the four countries (Germany and the United States). However, in France and in the United Kingdom, the effect of the treatment on participation was positive but not significant.
Baseline Levels and Effect of Scandal Treatment on Political Participation
Note. Dots indicate differences group mean scores, and bars depict 90% confidence intervals. For the pooled sample and in Germany and the US, there is a statistically significant difference at p = 0.10 level between members of the treatment and control group as depicted by the upward slope. Specific point estimates and confidence intervals are detailed in online appendix I.

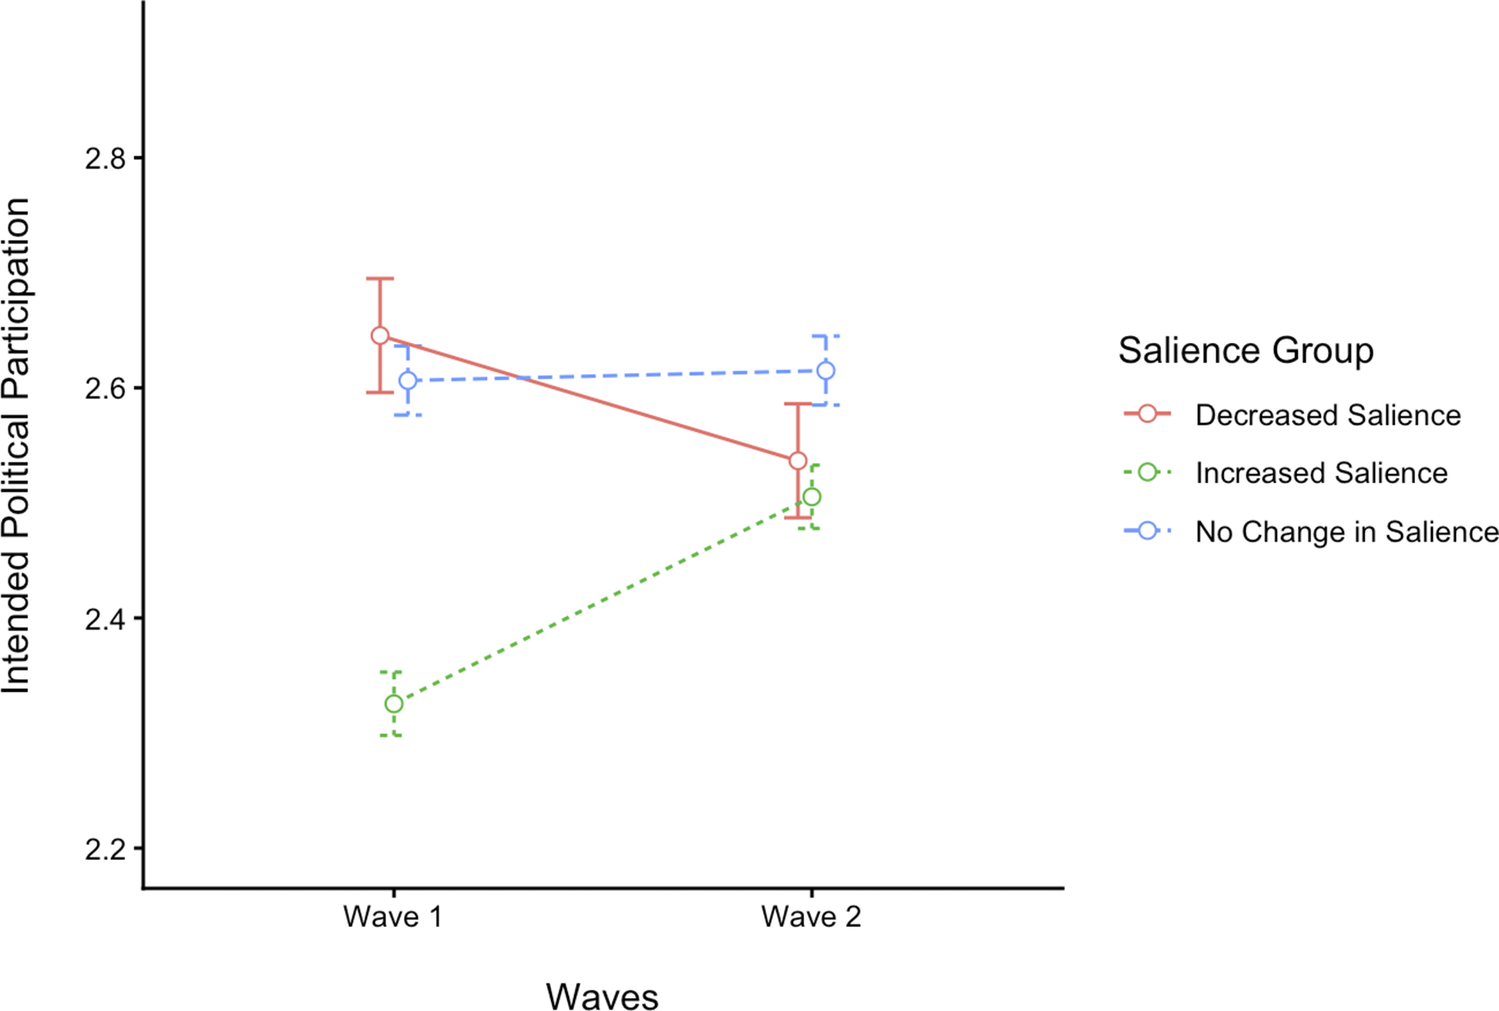
We earlier theorized that motivating people to become politically active is tied to issue salience. In figure 7 we connect the effects on salience to the effects on participation, showing how shifts in treated subjects’ issue salience track shifts in political participation. For those few treated subjects whose salience levels remained static from wave 1 to wave 2 or whose recorded salience decreased between waves, we see a corresponding flatline or reduction in participation levels from the pretreatment to posttreatment wave. Yet for the majority of treated subjects, whose salience levels increased between waves 1 and 2, the data revealed a large, corresponding increase in their intent to be politically active on the issue of technology regulation.
Shifts in Issue Salience and Political Participation in Treatment Group
Note. Dots indicate differences group mean scores for those exposed to the scandal treatment, and bars depict 95% confidence intervals.

One striking result shown in figure 7 is that the group of treated respondents who recorded an increase in issue salience between waves 1 and 2 began from a very low base of intended political participation, compared to those whose issue salience decreased or remained stable. In other words, the people for whom the treatment triggered increases in salience were previously politically inert around the issue of tech regulation. We take this as suggestive evidence that corporate scandals are effective in activating those people who are politically tuned out and for whom it takes a scandal to jolt them into becoming interested and active in political issues.
To explore how these people differed from the two groups, we drilled down into our data from wave 1. We found that it is precisely the kind of low-efficacy, politically apathetic people whom the government and technology companies do not want to become politically active who respond to scandals by showing a leap in salience and intent to participate. This group of people exhibited significantly lower trust in government (mean difference = 0.45, p = 0.000), significantly lower political efficacy toward big business (mean difference = 0.19, p = 0.000), and significantly lower interest alignment with big business (mean difference = 0.35, p = 0.000) than other treated subjects who did not have an increase in salience between waves. Awakening political participation around technical regulatory issues is consistent with the effect of focusing events on latent opinion.
The Role of Anger in Propelling Scandal Effects
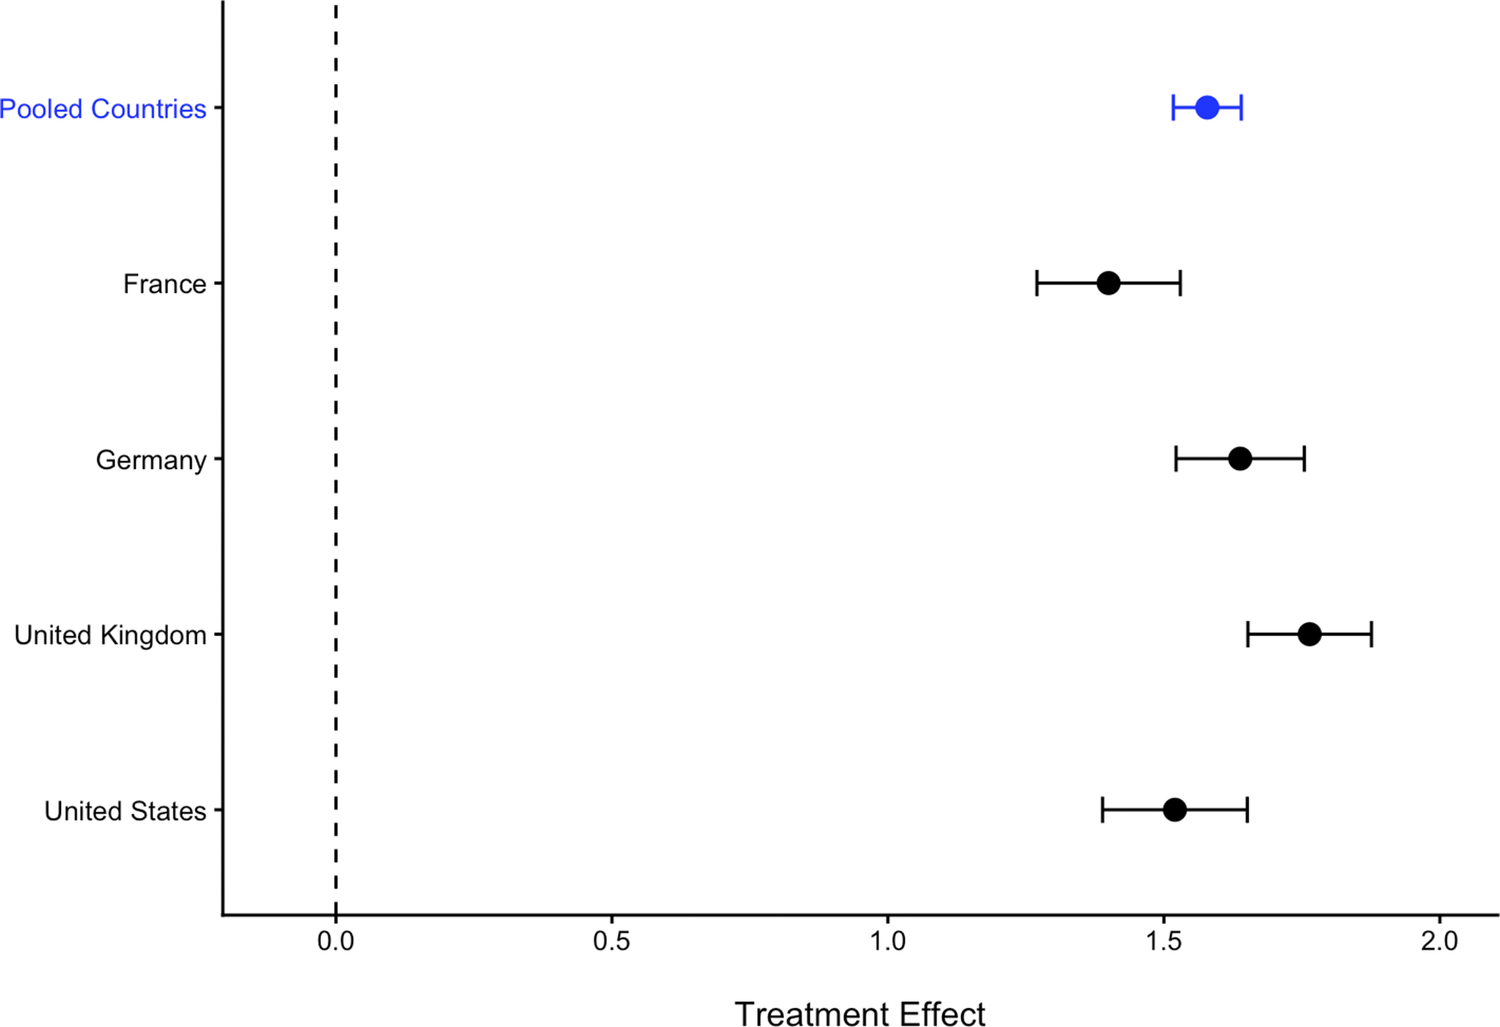
We previously observed that people’s emotional responsiveness to news stories is a critical factor that determines whether the event causes shifts in political behaviors (Gross Reference Gross2008; Kim and Cameron Reference Kim and Cameron2011). Our expectation in this case was that anger would be fundamental to the effect of scandals in guiding policy preferences, salience, and participation. Public anger is inextricably tied with scandal media coverage—to the point that a scandal is only defined as a scandal if it arouses public outrage. Anger is frequently driven by a desire to correct a perceived injustice or unfairness (Halperin et al. Reference Halperin, Russell, Dweck and Gross2011), and scandals of the sort that we used in our media treatments are therefore likely to evoke anger. In our case, we expected that exposure to tech scandals would arouse anger toward the perpetrators, which in turn would cause people to (a) support more stringent regulation that punishes the perpetrator and fixes a broken system, (b) view the area of tech regulation as more personally important to them, and (c) state an intention to be more politically active on this issue. In the parlance of statistical methodology, anger should mediate the relationship between scandal exposure and attitudinal shifts. In figure 8, we show that our treatment condition dramatically increased anger in the pooled sample (effect size: β = 1.58, p = 0.000) and in each of the four countries.
Effect of Scandal on Anger
Note. Dots indicate differences group mean scores, and bars depict 90% confidence intervals. DE = Germany, FR = France, UK = United Kingdom, US = United States. For the pooled sample and all four country samples, there is a statistically significant difference at p = 0.10 level between members of the treatment and control group as depicted by the upward slope. Specific point estimates and confidence intervals are detailed in online appendix F.

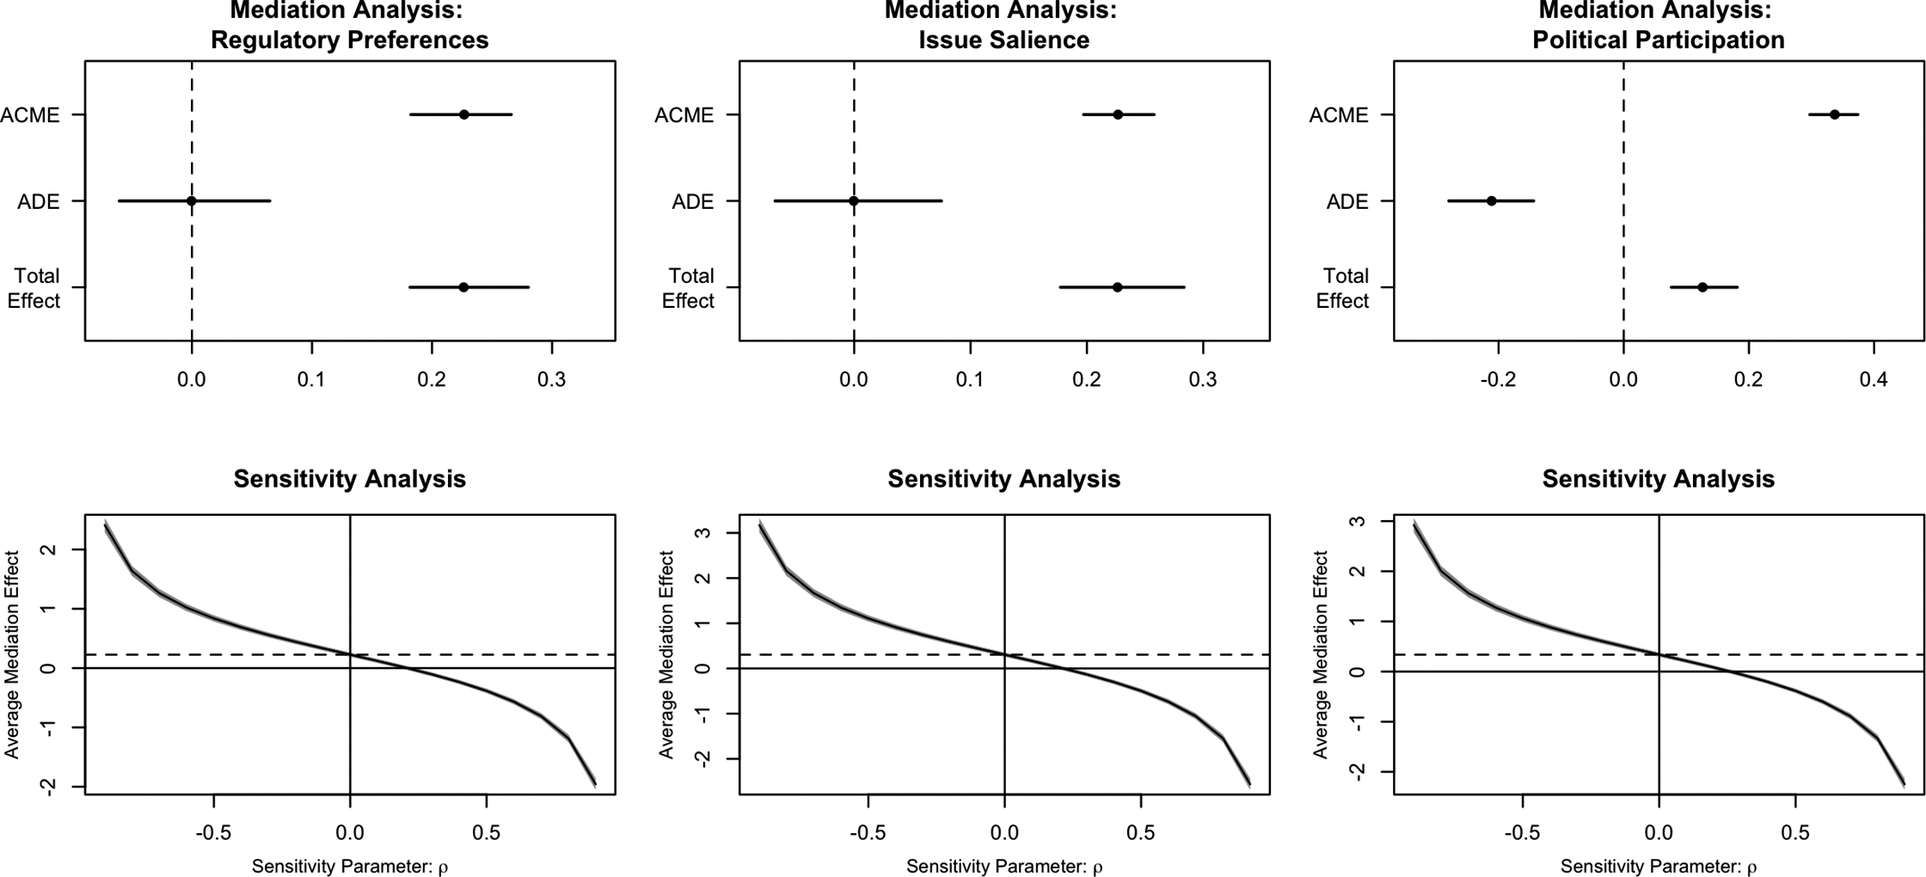
To test our expectations about the mediating role of anger, we employed the mediation analysis technique developed by Imai et al. (Reference Imai, Keele, Tingley and Yamamoto2011). This technique estimates two equations that predict the mediator variable and outcome variable through least-square regression analyses. After calculating the coefficients and standard errors for each of the equations, the procedure performs a bootstrap simulation to compute the average causal mediation effect (ACME), which is the estimate of the effect that exposure to the scandal treatment (T) exerted, through the anger mediator variable (M), on support for regulation, issue salience, and intent to participate (Y).
Conducting this analysis revealed that anger significantly mediates the effect of scandal exposure on these attitudes. Scandal exposure triggered heightened anger (β = 1.576, p < .000), and the magnified anger led to more pro-regulatory policy preferences (β = .144, p < .000), greater issue salience (β = .194, p < .000), and a newfound intention to participate politically around this issue area (β = .214, p < .000). Across all three mediation models, the ACME statistic was significant at the p = 0.000 level, mediating more than 99% of the total effect. The anger mediation outputs and sensitivity analyses appear in figure 9, and the full regression table appears in online appendix G. In short, this analysis confirms that anger serves as the mediator for the effect of the technology scandal treatment on regulatory preferences, issue salience, and political participation
Anger Mediating the Effect of Tech Scandals on Regulatory Preferences, Issue Salience and Political Participation
Note. Estimates of ACME, ADE, and total effect with 95% confidence intervals. ACME: average causal mediation effect; ADE: average direct effect. Figures are based on regression analyses that are produced in full in online appendix G.

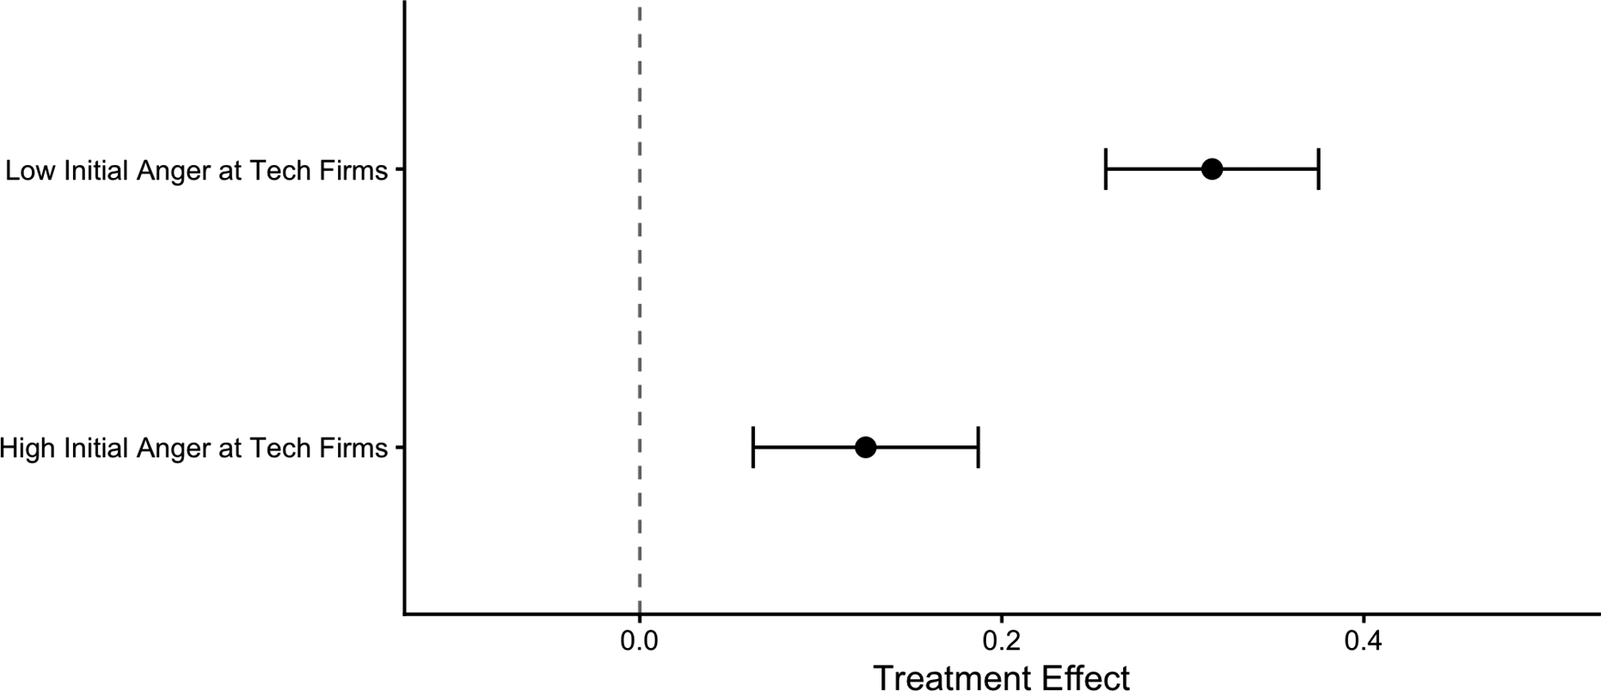
One possibility that may occur to some readers is that scandals are not themselves making people angry but instead are priming anger among those who already are angry. This alternative explanation suggests that those who are angrier at the system or at tech companies are more likely to pay attention to scandals and therefore be outraged by them. To consider this alternative, we estimated the scandal treatment effect among two groups within our pooled sample—those with low and high initial anger at big technology firms. Their level of anger was measured in the pretreatment wave more than a week before administering the treatment article. The results shown in figure 10 reject this interpretation. People who already had high levels of anger toward technology firms in the pre-experimental wave experienced a significantly lower treatment effect (β = 0.125) than people who had low anger toward technology companies (β = 0.316).
Scandal Treatment Effect on Regulatory Preferences among People with Differing Levels of Pretreatment Anger at Big Technology Firms

In online appendix K, we similarly test the idea that those who believe the economy is rigged—a sentiment associated with populist appeals (Culpepper et al. Reference Culpepper, Shandler, Jung and Lee2025)—are more responsive to the treatment. We find similar results as in figure 10, with the scandal treatment having a larger effect on those who were less convinced the system is rigged. In short, our evidence clearly suggests that it is not the case that angry people respond more to the scandal treatment. Instead, what we find is that scandals cause anger and that anger drives much of the response in regulatory attitudes that we have observed.
Discussion
Enron, Dieselgate, and Cambridge Analytica—each of these scandals shocked the public and led to a groundswell of popular anger with corporate wrongdoing, jolting policy makers in the United States and Europe into action. The results in this article shed light on the microfoundations through which focusing events like these lead to regulatory reform efforts in politics. Media coverage of corporate scandals can move public opinion in the direction of asserting tighter public oversight over large companies.
Our results provide robust evidence, across four of the world’s most advanced economies, that scandals change political preferences with respect to regulation, that they make technology regulation more salient, and that they encourage people to become more politically active around this issue. The effects of scandals on regulatory preferences, issue salience, and political participation are mediated by anger. For each of the outcomes that we examined—preferences, salience, and participation—the fact that scandals can cause people to update their positions is important.
Yet the dynamics of how these outcomes interrelate is a crucial piece of the story. Our analysis of the link between salience and participation suggests that those treated respondents whose salience increased after treatment were the people especially likely to be initially politically quiescent, with low trust in government and low efficacy toward big business. That this group experienced sharp increases in the stated propensity to participate in technology politics, after reading about the Cambridge Analytica scandal, provides a tantalizing glimpse of how focusing events can politically activate previously dormant voters.
Collective outrage is a defining feature of corporate scandals, and that outrage has clear political consequences, even in a technical policy area such as technology regulation (Miller Reference Miller2007; Vasilopoulos et al. Reference Vasilopoulos, Marcus, Valentino and Foucault2019). Although strong negative emotions like anger are known to shape political attitudes after major news events (Gross Reference Gross2008; Kim and Cameron Reference Kim and Cameron2011), our findings show that this anger does more than prompt people to update their policy preferences: it also heightens issue salience and stimulates political participation. Yet in today’s polarized political climate, few issues still generate genuine, cross-cutting mobilization. Our results also suggest that, in contrast to political scandals, corporate scandals can pierce these partisan divides when they evoke anger at clear moral transgressions. The shared experience of outrage can briefly create a sense of moral consensus that transcends ideology. In this way, scandals act as focusing events that transform diffuse frustration into collective demands for reform, suggesting a democratic pathway to counter the structural advantages of dominant technology firms in politics. More broadly, they demonstrate how anger toward corporate misconduct can catalyze public engagement, elevate issue salience, and open windows for meaningful regulatory change.
In this article we used the micro-findings of the media effects literature (Leeper and Slothuus Reference Leeper, Slothuus, Suhay, Grofman and Trechsel2020) to illuminate the macro-perspective of the literature on focusing events and agenda-setting in public policy (Baumgartner, Jones, and Wilkerson Reference Baumgartner, Jones and Wilkerson2011; Green-Pedersen and Walgrave Reference Green-Pedersen and Walgrave2020). The role of public opinion in this latter literature is crucial but assumed, rather than tested. Through rigorous tests, we showed how media effects work in several different countries, and those findings resonate with the emphasis on rapid policy change associated with the policy agendas literature (Jones and Baumgartner Reference Jones and Baumgartner2005). Focusing events can take major policy reforms from the impossible to the inevitable in a short period of time (Kingdon Reference Kingdon1984). We have built on the pioneering work of Birkland (Reference Birkland1997, Reference Birkland1998) to expand the conceptual definition of focusing events beyond disasters, showing how corporate scandals exemplify events that are sudden and rare and that draw public attention to specific policy problems. We suggest that in an era of blocked governments and declining public confidence in political institutions, this is an important area for political scientists to explore further.
Beyond the literature on focusing events, our study has shown the utility of looking at how the media changes preferences and salience simultaneously, rather than only one or the other, as has been the case in much of the media effects literature. Interventions that change both what people want and how important they view the issue as being to them are obviously more likely to be of political moment. Understanding which events affect only salience, which events affect only preferences, and which affect both simultaneously is an important question to which political scientists should pay more attention.
One line of inquiry that we did not discuss is what is going on cognitively when people read about scandals. Past research suggests that media coverage can influence opinion cognitively in one of two ways: priming and learning (Arceneaux Reference Arceneaux2012; Bartels Reference Bartels2002; Iyengar and Kinder Reference Iyengar and Kinder1987; Krosnick and Kinder Reference Krosnick and Kinder1990; Lenz Reference Lenz2009). In separate analyses included in online appendix J, we describe one approach to examining whether the scandal coverage effects we found are due to priming or learning. We find that at least one of the persuasion pathways—either priming or learning—is needed for media coverage of corporate scandals to move preferences for corporate regulation. Absent a negative predisposition to big tech companies or the ability to acquire new information by reading about the scandal, media coverage of a corporate scandal does not shift regulatory attitudes. These findings vary in interesting ways across our four country contexts, but we note here that our study was not designed, strictly speaking, to test for and differentiate between different pathways to persuasion. We see this is as a vital stimulus for future research.
We further acknowledge a limitation of our design, which is that our experimental stimuli, modeled on authentic media coverage, included secondary narrative elements beyond the initial revelation at the heart of the Cambridge Analytica scandal. In particular, the article noted that Facebook/Meta escaped legal liability for its data breach, which may have independently shaped participants’ responses and confounded the observed effect of the original scandal in isolation. We prioritized real-world news coverage, which generally includes a recent “hook,” even at the cost of discussing lawsuits about the scandal in the same article as the scandal; after all, the original scandal took place five years before our survey experiment. Although a stripped-down stimulus limited to the scandal’s core facts would have eliminated this potential confound, it would also have reduced ecological validity, because the article then would not have resembled the character of real-world news reporting. Future work could build on our approach by systematically varying the presence or absence of such secondary elements to better isolate scandal effects.
The bulk of the evidence we presented suggests that corporate scandals provide an important and regular opportunity to galvanize broad coalitions in favor of more regulation by changing preferences and salience at the same time. On this basis we would argue that corporate scandals are politically important events. Given the prominent role that the leaders of the largest tech companies are playing in democratic politics in the United States and elsewhere at the current moment, we invite our colleagues to join us on this research frontier.
Supplementary Material
To view supplementary material for this article, please visit https://doi.org/10.1017/S1537592726104411.
Data Replication
Data replication sets are available in the Harvard Dataverse at https://doi.org/10.7910/DVN/G9PREY.
Acknowledgments
For comments that helped improve this article, we thank Pierre-Henri Bono, Michael Donnelly, Kris-Stella Trump, and the anonymous reviewers and editors of Perspectives on Politics, as well as participants in the 2023 and 2024 American Political Science Association meetings and the 2025 IAST-Oxford-Sciences Po Conference, as well as seminar participants at the London School of Economics and at the Blavatnik School of Government at Oxford University. Thanks also to Julie Bernard and Mika-Erik Moeser for research assistance with the survey experimental treatments. This project received funding from the European Research Council (ERC) under the European Union’s Horizon 2020 research and innovation program (grant agreement no. 787887). This article reflects only the authors’ views and not those of the ERC.


 Open access

