


Ultra-processed foods, as defined by the NOVA classification, are industrial formulations of substances extracted or derived from foods, which do not have or have extremely low amounts of whole foods in their composition. Ultra-processed foods are obtained from high-yield crops, such as sugar and syrups, refined starches, oils and fats, protein isolates, besides remains of intensive livestock. They are produced to look, smell and taste good or even ‘irresistible’. Various ingredients for exclusive industrial use are added, such as flavourings, dyes, emulsifiers and other additives that change their sensory attributes. The ingredients and procedures used aim to create low-cost, hyper-palatable and convenient products. Ultra-processed foods are widely promoted by marketing strategies, with potential to replace fresh meals prepared from fresh or minimally processed foods(Reference Monteiro, Cannon and Levy1).
Recent evidence from systematic reviews and meta-analyses has shown the association between the consumption of ultra-processed foods and the risk of chronic non-communicable diseases in children and adults. The high consumption of these foods was associated with a higher risk of obesity, hypertension, type II diabetes, CHD, metabolic syndrome, depression, respiratory diseases, cancer and mortality from all causes(Reference Louzada, Costa and Souza2–Reference Silva Meneguelli, Viana Hinkelmann and Hermsdorff9).
Ultra-processed foods have high levels of free sugars, saturated and trans fats, and higher energy density. On the other hand, they present low quantities of vitamins, minerals and fibres. French study that compared ultra-processed and non-ultra-processed foods showed that the former had less satiety power, high blood glucose response(Reference Fardet10). They have been associated with higher speeds of energetic intake(Reference Forde, Mars and de Graaf11), greater presence of contaminating residues related to processing and packaging(Reference Steele, Khandpur and Da Costa Louzada12,Reference Kim, Rebholz and Wong13) . Furthermore, they provide a favourable intestinal environment for the micro-organisms responsible for inflammatory diseases(Reference Zinöcker and Lindseth14). In the UK, ultra-processed foods already represent 65·4 % of energetic intake among children, 67·8 % among adolescents and 54·3 % among adults(Reference Onita, Azeredo and Jaime15–Reference Rauber, Martins and Azeredo18) and have been associated with deterioration in the nutritional quality of the diet and with the increased risk of obesity(Reference Rauber, Steele and Louzada16,Reference Rauber, Da Costa Louzada and Steele17,Reference Rauber, Chang and Vamos19) .
Consistent evidence suggests that the food environment is an important determinant of food consumption(20–Reference Swinburn, Kraak and Allender22). In this sense, places where meals are eaten, such as at schools, home and restaurants, determined by the nature of the availability and accessibility of food and their social environment, can have a quite different impact on the consumption of ultra-processed foods. In the UK, a previous study showed that eating out was associated with a higher consumption of non-core foods, such as hamburgers, ice cream, cookies and other sweets(Reference Ziauddeen, Page and Penney23,Reference Ziauddeen, Almiron-Roig and Penney24) . Previous studies showed that, among British children and adolescents, the consumption of ultra-processed foods was influenced by eating contexts, such as the presence of other people and the location(Reference Onita, Azeredo and Jaime15,Reference Rauber, Martins and Azeredo18) . In this way, the present study aims to analyse the association between different places of consumption and the intake of ultra-processed foods in the UK in 2014–2016.
Methods
Study design and population
We used data from the National Diet and Nutrition Survey Rolling Program (NDNS-RP), a nationally representative survey data collection from the UK population aged 1·5 years and above, about diet, nutrient intake, and nutritional status(25). We used data collected between April 2014 and March 2016 (years 7–8 combined).
The sample design was randomly drawn from the Postcode Address File, a list of all addresses in the UK. One adult and one child/adolescent were randomly selected from each household. A child ‘boost’ of addresses was included for scenarios where only children were recruited to ensure the participation of approximately equal numbers of children/adolescents and adults. More details were described elsewhere(26). For this study, we used food consumption and sociodemographic information.
Food consumption
The individuals were asked to answer a 4-d food diary. Participants received instructions to record all foods and drinks consumed inside and outside their home over 4 consecutive days. Portion sizes were estimated based on either household measures or weights from packaging. Visits were continuously carried out throughout each year to ensure that seasonal variations in dietary intake were captured. In addition, diary days were randomly selected to guarantee a balanced representation of all weekdays(27).
All foods and beverages were coded using the system Diet In, Nutrient Out (DINO), then energy and nutrient profile were calculated using the Nutrient Databank, which is food composition table that is updated for each survey year, of the Department of Health(26). Those participants who answered at least three diaries were included (1417 adults and 1306 children n 2723)(25).
Food classification according to processing
Recorded food items were classified into four food groups in the NOVA classification. This system classifies all foods according to the industrial processing characteristics foods that are submitted before consumption(Reference Monteiro, Cannon and Levy1). The four groups of the NOVA classification are unprocessed or minimally processed foods (e.g. cereals, legumes, vegetables, fruits, milk, meat, rice and flour), processed culinary ingredients (e.g. sugar, table salt, vegetable oils, butter and honey), processed foods (e.g. fresh cheese, sugar or salted nuts, canned vegetables, canned fish and simple bread) and ultra-processed foods (e.g. sweets, ice cream, breakfast cereal, packaged bread, carbonated soft drinks, flavoured yogurts, cookies, sausages and processed meat), which are industry food formulations, typically ready-to-eat or ready-to-heat.(Reference Monteiro, Cannon and Levy1). Foods were classified according to key variables of the NDNS, the ‘Food Number’ and ‘Subsidiary food groups’. For the classification of dishes, their respective food items were disaggregated in order to ensure a more accurate classification, then each single ingredient of the dish was classified according to the NOVA system. More details about food classification are described elsewhere(Reference Rauber, Steele and Louzada16,Reference Rauber, Da Costa Louzada and Steele17) .
Eating location
The place where consumption occurred for each food and beverage was recorded. The databank showed thirty-six groups of locations where consumption was reported. For this analysis, locations were grouped according to similarities:
-
Home: anywhere in the house (bedroom, dining room, garden, kitchen, etc.).
-
Institutional: school, work, homecare, community centre/day centre/drop-in and nursery/kindergarten.
-
Fast-food restaurants: fast-food outlet.
-
Sit-down restaurants: restaurants, pubs and night clubs.
-
Coffee shops: coffee shops, café, deli and sandwich bar.
-
Leisure and sports places: sports clubs, sports leisure venue, leisure activity place, cinema and shopping centre.
-
‘On the go’: street, bus, car and train.
-
Friends and relatives’ house.
-
Other places: holiday accommodation, not at home, place of worship, public hall/function room, other places, outdoors and unspecified.
Data analysis
We included participants aged 4 years or above. The children aged between 1·5 and 3 years (n 248) were excluded because of the very different eating behaviours, which would make the sample too heterogeneous for this analysis. In addition, they are a public with marked differences in terms of consumption environments (e.g. no obligation to attend school) and autonomy in food choices. Individuals (n 26) from 1st percentile and above 99th of total energy intake were excluded because they were considered implausible values(Reference Nielsen and Adair28). For each person, we have calculated the contribution of each reported eating location to total energy intake. Then, we calculated the mean of 3 or 4 d (depending on the number of records available for each person) in order to deal with variations, for all individuals and according to age groups (4–10, 11–18 and ≥ 19 years). Next, we estimated the percentage of NOVA groups for the total energy content consumed at each eating location.
For the analysis of association between the consumption of ultra-processed foods and the eating location, we carried out stratified models for child (4–10 years old), adolescent (11–18 years old) and adult (19 years or over). Our explanatory variable was the dietary contribution (%) of each eating location to total energy intake and outcome variable was the dietary contribution (%) of ultra-processed foods to total energy intake. The association of the contribution of each eating location (as a % kcal) to the diet of the individuals and ultra-processed foods consumption (as a % kcal) was investigated through crude and multiple-adjusted linear regressions. The coefficients represent the increment in the contribution of ultra-processed foods to total energy intake for each percentage point increase in the contribution of each eating location to total energy intake. In the adjusted analyses, we considered as potential confounding factors age (the ages of children and adolescents were used as continuous variable; for adults, they were grouped into 19–39, 40–59, 60–74 and ≥ 75 years), sex (female and male), region of the country (South England including London, England Central, North England, Scotland, Wales and Northern Ireland), ethnicity (White and non-White) and occupational social class (of the main food provider of household: higher managerial and professional occupations; lower managerial and professional occupations; intermediate occupations, small employers, own account workers; and lower supervisory, technical, semi-routine and routine occupations, never worked, other). We adopted 5 % level of significance in our analysis.
Considering the complex sample, we used the svy or weights commands in Survey Package, on software Stata version 14 (Stata Corp., College Station,), to allow the extrapolation of the results to the UK population.
Ethical aspects
NDNS was conducted according to guidelines laid down in the Declaration of Helsinki, and the survey was approved by the Cambridge South NRES Committee (Ref. No. 13/EE/0016), other committees and research governance. This study was approved by the Committee for Ethics in Research of the School of Physical Education and Sports of the University of São Paulo (No. 4,285,880).
Results
The study comprised 2449 individuals (509 children, 539 adolescents and 1401 adults), as shown in Table 1, the sample description. The contribution of each eating location to total energy intake of individuals is presented in Table 2. For the entire UK population, the main eating locating was at ‘home’, which contributed to almost three-quarters (72·6 %) of total energy intake, followed by ‘institutional places’ (12·0 % of total energy intake) and ‘sit-down restaurants’ (4·5 %). The eating locations with the lowest contributions were ‘leisure and sports places’, which represented 0·8 % and ‘fast-food restaurants’, which contributed to 0·7 % of total energy intake.
Description of the study population. UK population aged 4 years or above (2014–2016)
(Numbers and percentages)

Contribution (%) of reported eating location to total energy intake by age group. UK population aged 4 years or over 2014–2016
(Mean values and 95 % confidence intervals)

* Child: 4–10 years old; adolescent: 11–18 years; adult: 19 years or over.
† School, care’s home, community centre/day centre/drop-in, nursery/kindergarten and work.
‡ Not at home – unspecified, other place, outside, place of worship, public hall/function room and unspecified.
The eating location with the greatest energy contribution to total energy intake was at ‘home’ for all age groups (64·6 % for children, 65·1 % for adolescents and 74·4 % for adults), followed by ‘institutional places’ (19·6 %, 15·1 % and 10·9 %, respectively). The other eating locations that stood out among children were ‘friends and relatives’ house’ with 5·8 %, ‘on the go’ with 1·5 % and ‘leisure and sports places’ with 1·4 %. For adolescents, the highlights were ‘on the go’ (2·7 %) and ‘fast-food restaurants’ (2·1 %). Among adults were ‘sit-down restaurants’ (5·0 %), ‘coffee shops’ and ‘on the go’ with 1·6 % each.
Figure 1 illustrates the contribution of each of the NOVA groups to the total energy content consumed at each location. In all eating locations, except in ‘sit-down restaurants’, the consumption of ultra-processed foods represents more than 50 % of the energy content consumed. The eating location with the highest ultra-processed foods representation was ‘fast-food restaurants’ (88·6 %), followed by ‘on the go’ (72·2 %), ‘leisure and sports places’ (71·8 %), ‘institutional places’ (61·1 %), ‘other places’ (57·7 %), ‘home’ (55·0 %), ‘friends and relatives’ houses’ (50·0 %), and ‘sit-down restaurants’ (44·9 %). The results by life stages are presented in the Supplementary Information (S1).
Distribution of total energy intake according to NOVA classification in each reported eating location. UK population aged 4 years or over (2014–2016).
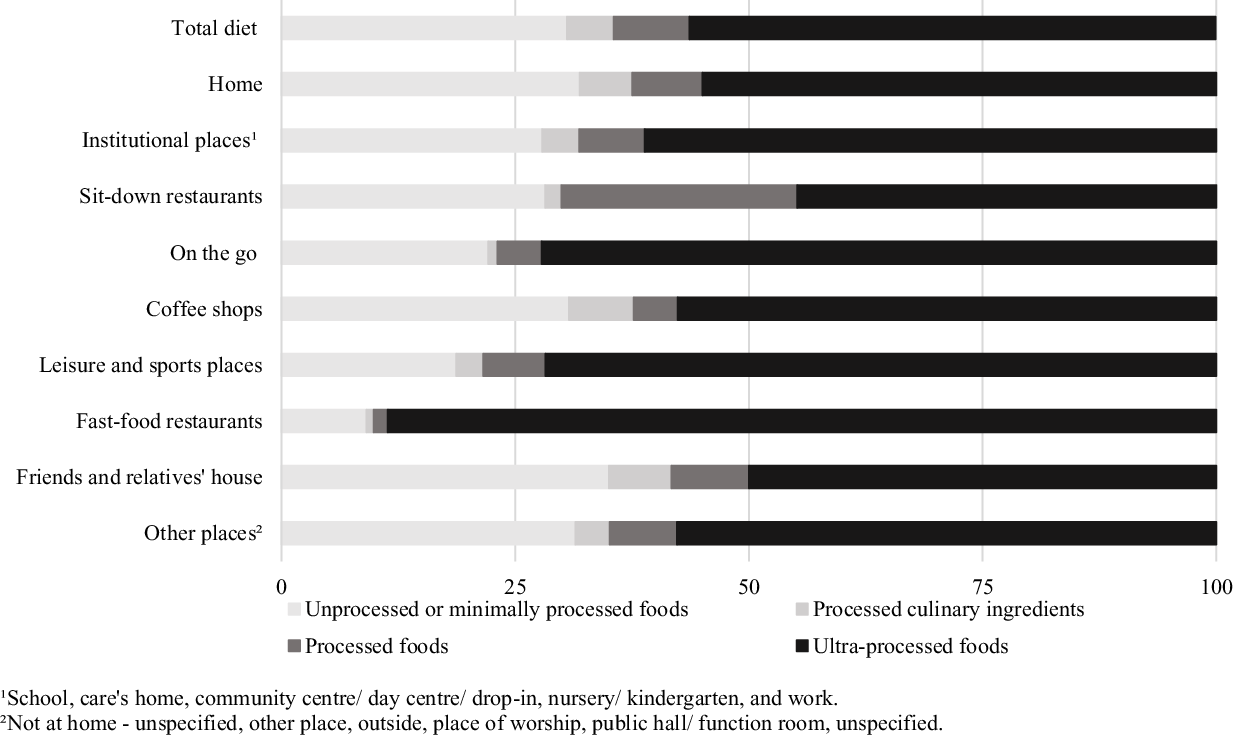
The consumption of unprocessed or minimally processed foods was higher in ‘friends and relatives’ houses’ (35·0 %), ‘home’ (31·9 %), ‘coffee shops’ (30·7 %), and ‘sit-down restaurants’ (28·2 %) and lower in ‘fast-food restaurants’ (9·1 %) and ‘leisure and sports places’ (18·7 %). The share of processed culinary ingredients ranged from 6·9 % in ‘coffee shops’ to 0·8 % in ‘fast-food restaurants’. The consumption of processed foods was particularly high in sit-down restaurants (25·2 %).
The subgroup of ultra-processed foods that contributed the most according to the eating locations was packaged pre-prepared meals, sandwiches and hamburgers with 66·9 % in ‘fast-food restaurants’, 27·9 % in ‘sit-down restaurants’ and 20·6 % at ‘home’. Ultra-processed breads were highly consumed in ‘institutional places’ (24·1 %) and sugary products had a high participation in ‘leisure and sports places’ (39·8 %), ‘on the go’ (39·1 %), ‘other places’ (38·4 %), ‘coffee shops’ (29·5 %), and ‘friends and relatives’ houses’ (27·2 %) (Table 3). The results by life stages are presented in the Supplementary Information (S2–4).
Distribution of total energy intake according to ultra-processed foods subgroups in each reported eating location. UK population aged 4 years or above (2014–2016)
(Mean values and standard errors)

* School, care’s home, community centre/day centre/drop-in, nursery/kindergarten and work.
† Not at home – unspecified, other place, outside, place of worship, public hall/function room and unspecified.
The association of the contribution of each eating location to the diet of the individuals and ultra-processed foods consumption is demonstrated through crude and adjusted analysis in Table 4. For children, the crude analysis showed that only at ‘home’ (β −0·10, 95 % CI − 0·17, −0·03) was inversely associated with ultra-processed foods consumption, this means that each 1 % increase in the consumption at home (% kcal) decrease 0·10 % energy from ultra-processed foods. In contrast, energy share of ‘leisure and sports places’ (β 0·47, 95 % CI 0·20, 0·73) and ‘other places’ (β 0·15, 95 % CI 0·04, 0·25) was directly associated with ultra-processed foods consumption, in other words, each 1 % increase in leisure and sports places and other places increase 0·47 % and 0·15 % in ultra-processed consumption, respectively. After adjusting for sociodemographic factors, the statistical significance remained in all these three locations.
Crude and adjusted linear regression analysis† of the association between energy consumption from ultra-processed foods location and contribution of eating. UK population between 4 years old or over (2014–2016)
(Coefficients and 95 % confidence intervals)
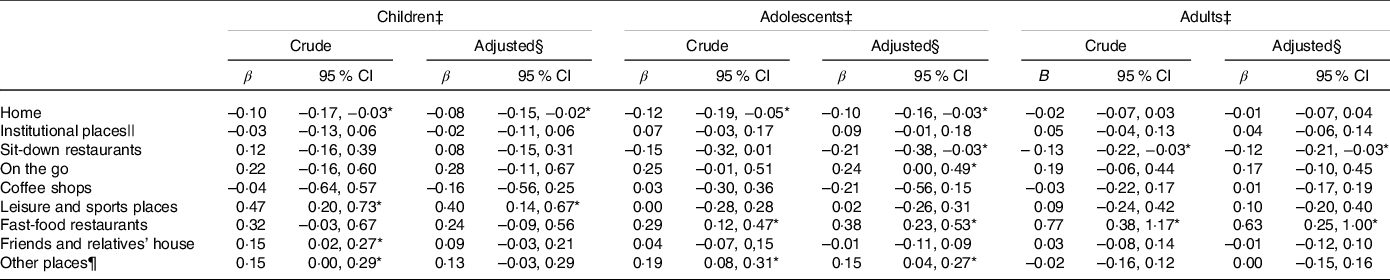
* P ≤ 0·05.
† The coefficients represent the increment in the contribution of ultra-processed foods to total energy intake for each percentage point increase in the contribution of each eating location to total energy intake.
‡ Children: 4–10 years; adolescents: 11–18 years; adults: ≥ 19 years old.
§ Adjusted for age, sex, occupational social class, region and ethnicity.
|| School, care’s home, community centre/day centre/drop-in, nursery/kindergarten and work.
¶ Not at home – unspecified, other place, outside, place of worship, public hall/function room and unspecified.
In adolescents, the crude analysis shows that only at ‘home’ (β −0·12, 95 % CI − 0·19, −0·05) was inversely associated with ultra-processed foods consumption. The energy share of ‘fast-food restaurants’ (β 0·29, 95 % CI 0·12, 0·47) and ‘other places’ (β 0·10, 95 % CI 0·01, 0·19) was directly associated with ultra-processed foods consumption. After adjusting for sociodemographic factors, the statistical significance remained in all these three locations, but ‘sit-down restaurants’ (β −0·21, 95 % CI − 0·38, −0·03) appeared as inversely associated with consumption of ultra-processed foods and ‘on the go’ (β 0·24, 95 % CI 0·00, 0·49) was directly associated with higher ultra-processed food consumption.
In adults, the consumption at ‘sit-down restaurants’ (β −0·13, 95 % CI − 0·22, −0·03) was inversely associated with ultra-processed foods consumption. On the other hand, consumption in ‘fast-food restaurants’ (β 0·77, 95 % CI 0·38, 1·17) was directly associated with ultra-processed foods consumption. The associations remained significant after adjusted analysis.
Discussion
Our findings showed the relationship between the eating environment and food intake in the UK population in 2014–2016, showing that different eating locations impact in a different manner in the consumption of ultra-processed foods. Our analyses showed that the greater consumption in ‘leisure and sports places’ increased the consumption of ultra-processed foods among children. In adolescents ‘on the go ’ was associated with an increase in the consumption of ultra-processed foods. ‘Fast-food restaurants’, on the other hand, were related to an increase in the consumption of these foods among adolescents and adults. Despite that, the consumption at ‘sit-down restaurants’ was associated with a lesser presence of ultra-processed foods among adolescents and adults and at ‘home’ for individuals aged 19 years or younger.
Home was the place that contributed the most to total energy in all age groups, followed by ‘institutional places’ and ‘sit-downs restaurants’. A similar result was found in a study by the HECTOR project, which analysed data from eleven European countries including the UK (for men the contribution away from home were 21·8 %; for woman were 20·8 %)(Reference Orfanos, Naska and Rodrigues29).
Our findings can be explained by the pattern of meals and the local characteristics that determine a greater or lesser stimulus to the consumption of ultra-processed foods. In fast-food outlets, for example, the majority of the sold products are ultra-processed, such as highly processed hamburgers, chicken and fish fingers, pizzas, desserts, carbonated sugary drinks and other artificially sweetened drinks(Reference Young, Coppinger and Reeves30–Reference Kaushik, Narang and Parakh32). Another particularity of this environment is the offer of large sized portions, the promotions of the ‘pay one, take two’ type and excessive advertising characteristics that may encourage overconsumption(Reference Fulkerson33). The negative impact of fast-foods outlets on the diet is even more important in adolescents, who have 5 % of energy content from these places, which is twice what is seen in adults.
In parallel with our results, investigations based on data from the NDNS 2008–2014, that analysed consumption according to two food groups, core v. non-core foods, among children aged 1·5 to 18 years old, showed that ‘food outlets’ (restaurants, fast-food outlets and coffee shops), ‘on the go’ and ‘leisure and sports places’ presented a higher consumption of non-core foods, which includes some ultra-processed foods, such as biscuits, cakes, chocolate, ice cream and puddings(Reference Ziauddeen, Page and Penney23,Reference Toumpakari, Tilling and Haase34) .
The consumption in ‘leisure and sports places’ and ‘on the go’, in turn, may determine a higher consumption of ultra-processed foods due to their practicality, portability and convenience. Generally, ultra-processed foods are developed so that they can be consumed anywhere and do not use plates and cutlery. Most of the time, they are sold as snacks, or drinks and may be easily acquired in vending machines or grocery stories, common in gyms, subway/train stations, shopping centres, among other places(Reference Wills, Kapetanaki and Rennie35–Reference Caraher, Lloyd and Mansfield37).
As expected, consumption in sit-down restaurants is higher among adults than among children and adolescents. These places are characterised by a totally different food environment when compared to leisure and sports places, and fast-food restaurants. They usually offer freshly prepared handmade meals made from the combination of unprocessed or minimally processed foods, processed culinary ingredients and processed foods and people usually eat in tables shared with family or friends. In countries like the UK, where cooking at home is becoming increasingly rare, sit-down restaurants seem to be a place that can be important for the consumption of healthier food.
Food consumption at ‘home’ was associated with lower consumption of ultra-processed foods in children and adolescents, but not in adults. In general, other studies have shown that consumption at home by adolescents was associated with consumption of healthy foods, such as vegetables(Reference Müller, Libuda and Diethelm38,Reference Tyrrell, Greenhalgh and Hodgson39) , water, coffee and tea(Reference Müller, Libuda and Diethelm38).
On the other hand, our findings may rise the hypothesis that parents could offer healthier meals to their children at home, but this does not necessarily apply to their own diets. Although the house environment has a negative association with the consumption of ultra-processed foods, these products still represent an important portion of the energy content consumed at this environment. Analyses of household availability in the UK show that most of the calorie purchases in the UK come from ultra-processed foods(Reference Moubarac, Martins and Claro40–42). Other relevant factors in the UK are delivery and takeaway foods that are usually made of ultra-processed foods(Reference d’Angelo, Gloinson and Draper43). Despite these differences in the percentage of ultra-processed foods participation, studies conducted in different countries demonstrate that the place of consumption, especially fast-food chains and other places outside the home, are directly associated with the increase in food consumption characterised by the high degree of processing(Reference Ziauddeen, Page and Penney23,Reference Ziauddeen, Almiron-Roig and Penney24,Reference d’Angelo, Gloinson and Draper43–Reference Nago, Lachat and Dossa46) .
In contrast to what was found in the UK, in middle-income countries, such as Brazil and Mexico, culinary preparations, made from unprocessed or minimally processed foods and processed culinary ingredients, represent the largest calorie of household purchases(Reference Andrade45,Reference Marrón-Ponce, Tolentino-Mayo and Hernández-F47) . On the other hand, when we look at high-income countries, such as Australia and Canada, the percentages of amounts spent on ultra-processed foods and their domestic availability were found to contribute to the energy provided from these foods to be similar to that in the UK(Reference Monteiro, Moubarac and Cannon48,Reference Venn, Banwell and Dixon49) .
Despite the associations, our findings showed a high consumption of ultra-processed foods in all eating locations. Considering that they are one of the major causes of the Global Syndemic of Obesity, Malnutrition and Climate Change, environmental changes that facilitate the consumption of healthier foods is a major challenge nowadays. Among the necessary actions, we highlight nutrition education programmes, as well as fiscal and regulatory measures that reduce the supply and the obesogenic nature of the environments.
This is the first study, to our knowledge, that analysed the relationship between the eating environment and the consumption of ultra-processed foods at all stages of life. These analyses are especially important within the UK context, which shows a significant share of ultra-processed foods in daily energy content.
The complex and representative sample allows us to extrapolate our findings to the entire UK population. In addition, the results are important not only for this population but will also add to the scientific literature regarding ultra-processed foods and the food environment.
The NDNS-RP is an important research, as it is a national and representative sample, in addition to a robust methodology. Detailed information was collected on the food consumed, nutrient intake, health status, physical activity and sociodemographic data. Furthermore, the details regarding the occasions of consumption and where it happened allowed analyses of real consumption to be carried out according to the reported locations.
Where information refers to the place of consumption, the place of preparation or purchase was not asked. Therefore, individuals could have bought ready-to-eat or ready-to-heat food outside the home and consumed it inside the home. The opposite can also be true, that is, the meal being a homemade preparation that was consumed outside the home.
Some limitations must be considered. The collection of data related to food consumption occurred through a food diary of four consecutive days, which were representative for the 7 days of the week. For participants aged 11 years and younger, items were registered with parental or guardian supervision. Therefore, some items may have been underreported, especially for unhealthy foods, underestimating the consumption of ultra-processed foods. Underreporting of unhealthy foods may also have occurred among adults.
Our findings showed the relationship between the eating environment and the food intake of the UK population in 2014–2016, showing that different eating locations impact in a different manner in the diet quality. Our results reinforce the potential negative impact of fast-food chains to the detriment of sit-down restaurants and draws attention to the importance of attention to food consumption in on the go and in leisure and sports places. Surprisingly, consumption of foods both at home and in institutional settings is not protecting the population from consumption of ultra-processed foods. In this sense, interventions aimed at reducing the consumption of these foods in these environments are necessary, mainly because institutional places are expected to be protected through regulations.
Acknowledgements
We are grateful for the financial support from CAPES and FAPESP and also to the scientific technical support from the School of Public Health at the University of São Paulo.
This work was supported by the Coordenação de Aperfeiçoamento de Pessoal de Nível Superior (CAPES), grant number 88887362789/201900 and Fundação de Amparo à Pesquisa do Estado de São Paulo (FAPESP), grant number 2016/14302–7. CAPES and FAPESP had no role in study design, data collection and analysis, decision to publish, or preparation of the manuscript.
Planning and analysis were performed by T. N. S. and M. L. da C. L. The first draft of the manuscript was written by T. N. S. and all authors commented on previous versions of the manuscript. All authors have read and approved the final manuscript.
The authors declare there is no conflict of interest.
Supplementary material
For supplementary material/s referred to in this article, please visit https://doi.org/10.1017/S0007114521004992


