


State of the art and purpose (RB)
The phenomenon of recarving, which refers to the practice of altering or reworking existing sculptures, has gained significant recognition and acceptance within specialized sculpture studies. However, the complexities surrounding the reuse issue – specifically, the intentional repurposing of materials or forms – remained largely unexamined and poorly defined until the early decades of the 20th c., when scholars began to explore the implications and significance of such practices in historical context.
The identification of recarved Roman portraits began with Hans Peter L’Orange’s investigations of the reused reliefs on the Arch of Constantine, published in 1939,Footnote 1 and Filippo Magi’s discovery of the Cancelleria reliefs shortly thereafter.Footnote 2 Horst Blanck’s pioneering monograph, Wiederverwendung alter Statuen als Ehrendenkmäler bei Griechen und Römern, significantly advanced our understanding of this topic by reinterpreting many Roman sculptures.Footnote 3 Scholarship on the phenomenon of recarving has gradually increased, particularly due to important articles, published in the 1980s, that focused on the recarved portraits of Rome’s infamous emperors Caligula, Nero, and Domitian, resulting from memory sanctions (damnatio memoriae).Footnote 4 Subsequently, numerous detailed investigations have been conducted into the technical aspects of recut portraits.Footnote 5 Catalogs of collections and exhibitions have identified many examples,Footnote 6 as have various general handbooksFootnote 7 and monographs.Footnote 8
In recent years, Eric Varner investigated the portraits of Roman emperors who experienced public disgrace, publishing a vast catalog of mutilated and recarved representations that was the first comprehensive work on these topics and a starting point for future research. Varner’s study concentrates on portraits from the times of Augustus to Constantine, tracking trends and attitudes in the practice of mutilation and reworking over the centuries.Footnote 9
Subsequently, Marina Prusac examined recut portraits in historical context to understand the reasons for recarving statues over time. She concluded that, in the 1st and 2nd c. CE, recarving occurred primarily in connection with damnatio memoriae, while in Late Antiquity, it was often motivated by the need for proper reuse, mainly due to a shortage of stone. The foundation of Prusac’s discussion, throughout her book, is a catalog showcasing a representative selection of portraits from 100 BCE to 565 CE.Footnote 10 Given the broad timespan covered in her work, the chronological development of the practice of recarving is assessed by categorizing the evidence into three distinct periods of varying lengths (Period 1: 100 BCE–CE 235, Period 2: 235–284 CE, Period 3: 284–565 CE). The statistical review presented in her work is based on examples from the Capitoline Museums, the Louvre, the Ny Carlsberg Glyptotek, and the Istanbul Museum, while her geographical analysis focuses on Asia Minor.
More recently, as part of his PhD dissertation examining the evolution of imperial representation in free-standing sculpture, Sam Heijnen compiled an extensive list of imperial portraits, ranging from Augustus to Justinian.Footnote 11 His Roman Imperial Portraits Database (RIPD), which includes details about the iconography and provenance of the sculptures analyzed, has been made freely available online.Footnote 12 Recarving was not the real focus of this study, hence the author did not explore the geographical distribution or technical limitations connected with the phenomenon, only mentioning the effect these recarved images might have had on ancient viewers, specifically with regard to the (un)intentional reference to former emperors.
Starting from the evidence collected in these studies, our aim is to present an up-to-date discussion of the reworking of imperial portraiture in the first three centuries CE, assessing its frequency in comparison with the production of new statuary, its chronological fluctuations, and, most importantly, its geographical variations. This review will illustrate different recarving patterns and practices, shedding light on the underlying cultural, economic, and socio-political factors that influenced them. Given the large quantity of surviving imperial portraits, our analysis relies heavily on the catalogs of Heijnen, Varner, and Prusac, and, while autoptic analysis was only possible for a limited number of case studies, every attempt was made to gather as much information as possible for all of the sculptures included in our dataset.
Data collection
This paper examines recarved portraits of Roman emperors from Augustus up to just before Diocletian. The shorter timeframe than Prusac’s allows for a more detailed analysis of the changes that occurred during the first three centuries of the Roman Empire. Reliefs were not included in the investigation, nor were portraits of imperial women or male relatives who did not become emperors.
The collected data encompasses all known male imperial portraits from Rome, Italy, and the provinces, including those of uncertain identification, which were listed for the sake of completeness even if they were not subsequently considered for analysis.Footnote 13 The dataset includes both recarved portraits and those that do not appear to have been modified in antiquity to fully assess the practice of reworking against total sculptural production during the period under consideration. Although the analysis stops with the Soldier emperors, 32 entries dating to Late Antiquity were also included, as these images were recarved from portraits of emperors belonging to the first three centuries CE. The list was first compiled from the RIPD, then integrated with additional findings from recent investigations, discoveries, and publications.Footnote 14
Recent studies have presented new interpretations of recarved portraits that have been accepted and included in the present study. The image of Nerva in the Holkham Hall collection (RIPD 687) has been determined to be a recarving of Domitian rather than Vitellius;Footnote 15 two portraits of Trajan from Athens (RIPD 708, 782) were derived from those of Domitian;Footnote 16 the unfinished head of Trajan in the Musei Capitolini (RIPD 788) was perhaps about to be recarved into a portrait of Constantine,Footnote 17 and four portraits of Septimius Severus were recarved from those of Antoninus Pius (#61, RIPD 1616, 1618, 1655).Footnote 18
On the other hand, in some cases, a lack of convincing evidence led us to discard the possibility of recarving. This was the case with Claudius from Piraeus (RIPD 452),Footnote 19 Trajan in the Antiquario Palatino in Rome (RIPD 785),Footnote 20 Caracalla at the Louvre (RIPD 1733),Footnote 21 and Severus Alexander from Villa Adriana (RIPD 1873).Footnote 22
In total, four entries were removed because they depicted private individuals,Footnote 23 their authenticity was questionable,Footnote 24 or they appeared to be duplicate entries.Footnote 25 Finally, the miniature sardonyx bust listed as an unidentified Late Antique emperor (RIPD 2143) was reclassified as a Constantinian emperor.Footnote 26
The collected data allowed us to assess recarving diachronically, identifying which emperors were most affected by this practice and the periods during which it was absent, while also examining the reasons behind these trends. When available, provenance information also granted insights into the geographical distribution of recut imperial portraits and the relationship between recarving and local sculptural traditions. Lastly, we evaluated the degree to which these portraits were recarved.
General considerations on recarving: emperors and chronological frame (RB)
By analyzing the vast amount of data and information collected, it is possible to identify which imperial images were typically recut and under which emperors the practice of recarving became most common (Figs. 1–2).Footnote 27
Original identities of recarved imperial portraits (n=189). (Chart by the authors.)

Number of newly created and recarved portraits representing each emperor (n=2,028). Portraits of uncertain identity were not included. (Chart by the authors.)

Unsurprisingly, the emperor who was most frequently subjected to reworking was Nero,Footnote 28 followed by Caligula and Domitian, all of whom were generally regarded as “bad” rulers and consequently affected by memory sanctions. During the 1st c., the survey documents the greater – and quite impressive – extent of the phenomenon of recarving, especially in relation to Caligula, who was the first Roman emperor subjected to damnatio memoriae,Footnote 29 and under the Flavian dynasty.Footnote 30
Claudius is the Julio-Claudian emperor whose portraits were most commonly produced by reworking those of a predecessor (26% of the total), almost exclusively using heads of Caligula. Among the Flavians, Vespasian has the highest percentage of reworked portraits (51%), recut from those of Nero and Vitellius. He is followed by his sons Titus (32%) and Domitian (25%), whose portraits were recarved from those of Julio-Claudian emperors subjected to memory sanctions.Footnote 31 In the case of Domitian, the reuse of Nero’s portraits might have been the result of a conscious attempt to suggest a retrospective identification, exploiting the enduring authority of Neronian imagery.Footnote 32
But proving that “he who lives by the sword will perish by the sword,” Domitian’s image was largely reused, especially to create portraits of Nerva and Trajan. Most of Nerva’s portraits were recarved from Domitian’s, and the motivation for this can be attributed to two distinct factors: first, the urgent need for images of him upon his accession, and second, the practical necessity of quickly replacing the former emperor with the new, elderly one, who died within 16 months.Footnote 33
In the following centuries, the only significant instances of recarving involve images of Antonius Pius recut into those of Septimius Severus, and Elagabalus reworked as Severus Alexander.Footnote 34 Their limited numbers are nothing compared to the numerous examples from the 1st c. CE.
We have ample evidence for the phenomenon of “retrospective reconfiguration,”Footnote 35 when the image of a “bad” emperor was transformed into that of a good predecessor. This is particularly common with Caligula, whose portraits were largely refashioned into the appearance of both Augustus and Tiberius.Footnote 36 The sculptural transformation of Caligula into Augustus was facilitated by the youthful appearance of the two emperors, who also belonged to the same family, making the final result more visually and artistically plausible.Footnote 37 Furthermore, such alterations were influenced by the enduring popularity of the cult of the deified Augustus and the demand for his portraits long after his death.Footnote 38 Some of Nero’s portraits were also recarved as Augustus and, in one instance, as Claudius.Footnote 39 Looking at these examples, Varner proposed an intriguing hypothesis regarding Nero/Augustus images: he suggested that rather than erasing Nero’s likeness, as was done with Caligula, these portraits were meant to reaffirm the Augustan legacy.Footnote 40 With a more conventional intention, some portraits of Domitian were retrospectively refashioned into those of his brother Titus.
The reconfiguration of imperial portraits was also connected with Roman economic pragmatism: high-quality marble was rare, especially in certain regions of the Empire, and expensive to quarry and to transport. Some scholars claim that these concerns, together with the need to save time, were the main drivers for the practice of recarving.Footnote 41 While the role of economic considerations should not be downplayed, one cannot deny the aesthetic implications of this phenomenon.Footnote 42 Both Varner and Karl Galinsky suggest that the reworking of imperial images was often intentionally partial, since the aim was not to eradicate the memory of the original subject entirely, but rather to show both the dishonorable predecessor and the good successor.Footnote 43
According to some scholars, however, the association could also work in reverse. The artistic and technical procedure of recarving is the same as that for damnatio memoriae, but modern scholars have defined the final transformation as a translation or transfer of memory, translatio memoriae.Footnote 44 The reuse of the images of exemplary rulers was not new, as evidenced by painted and sculpted portraits of Alexander the Great altered into, among others, the likeness of Divus Augustus,Footnote 45 and the practice gained great recognition during the Tetrarchy and the reign of Constantine, when there was a strong political emphasis on continuity from the good emperors of the past, such as Augustus, Trajan, and Hadrian. Thus, centuries could elapse before a portrait was reconfigured into a new likeness,Footnote 46 which raises the question of the degree to which the authorities successfully conveyed political messages through these reworked portraits. Whether ancient “visually astute”Footnote 47 viewers could clearly have recognized the previous identity of reconfigured portraits remains an unresolved question; we must assume varying levels of familiarity with the likeness of the reigning emperor, while the memory of the faces of previous rulers would have necessarily faded with time.
It is also worth exploring the possible reasons why, during specific periods, we find no evidence for recarving and what might be the reasons for this absence. At times of crisis, such as in the Year of the Four Emperors, the Year of the Five Emperors, and the so-called Military Anarchy, reworked portraits are either missing or nearly absent. This suggests that the destruction or storage of usurpers’ images was favored: marble was precious, and there was always the possibility of rehabilitation. Galinsky describes, as one of the best-documented examples of this practice, statues of Galba being, at first, (partially) destroyed during the regime of his successor Otho, then restored only a few months later by Vespasian’s general Antonius.Footnote 48 The rehabilitation of the portraits of Nero and Poppea also represents a relevant case of rehabilitation under Otho and Vitellius, as documented by ancient sources.Footnote 49
The 2nd c. CE distanced itself from the hostilities of the past, as, at this time, we find no evidence for recarving. During the reigns of Hadrian and the Antonines, reused portraits are not documented, despite the high level of sculptural production. Particularly telling of a change in attitudes is Antoninus Pius’s firm opposition to the senate’s request to impose memory sanctions upon Hadrian.Footnote 50 There might, however, be a technical rather than ideological explanation behind the absence: neither Julio-Claudian nor Flavian portrait heads had enough volume and marble to be turned into emperors characterized by the voluminous hairstyles and beards that had become the fashion during the 2nd c. CE. When reworking marble, any alteration necessitates a reduction in the mass of the original head, which inevitably produces anomalies in the overall proportions. Because of these technical challenges, the process is easier and more successful when the original subject’s physiognomy or hairstyle is similar to that of the new emperor. For the same reason, most portraits are reworked just once.
After Commodus’s damnatio memoriae, his portraits were destroyed or removed rather than recarved,Footnote 51 as was common during periods of crisis when different emperors came to power in quick succession. The lack of reused portraits could also have been connected with his rehabilitation under the Severans and Septimius Severus’s fictive adoption into the Antonine family, aimed at suggesting a legitimate continuity with the previous dynasty.Footnote 52 However, the reason might also concern a purely technical aspect, as portraits of Commodus lacked the necessary volume to accommodate the prominent beard of Septimius Severus.Footnote 53 Under the Severan dynasty, recarving remained very limited.Footnote 54 During this period, there were several emperors condemned to damnatio memoriae, but their portraits were generally mutilated or removed from public places rather than recarved.Footnote 55
The late Severan age marked a final stage in the tradition of recarving as a result of memory sanctions. The violence of the late 3rd-c. emperors often led to the complete destruction of their enemies’ images; however, in the middle of the century – the Gallienic period – new trends in the transformation of official images were emerging, with the development of new modes of “positive recycling” and a change in laws regarding the refurbishing of imperial images, which was no longer considered a treasonable offence.Footnote 56
In the Late Antique period, we find ample evidence for the ideological reuse of portraits,Footnote 57 especially during Constantine’s time, when there was a renewed interest in recutting portraits, particularly those of Maxentius or the good emperors of the past, highlighting the continued cultural and propagandistic implications of reworking.Footnote 58
Geographical considerations: new and recarved portraits (FB)
Imperial portraits with known provenance were divided into 13 geographical areas: Arabia, Asia Minor, Britain, Danube-Balkans, Egypt, Gaul, Germania, Greece, Iberia, Italy, North Africa, Rome, and Syria. To assess the relative numbers of new and recarved portraits in the Roman Empire, we had to consider that the latter were initially created as new sculptures before later being reworked. Thus, when the identity of the original subject could still be ascertained, the portrait was included among both recarved and new works. Portraits whose identification remains uncertain have not been included in the analysis.
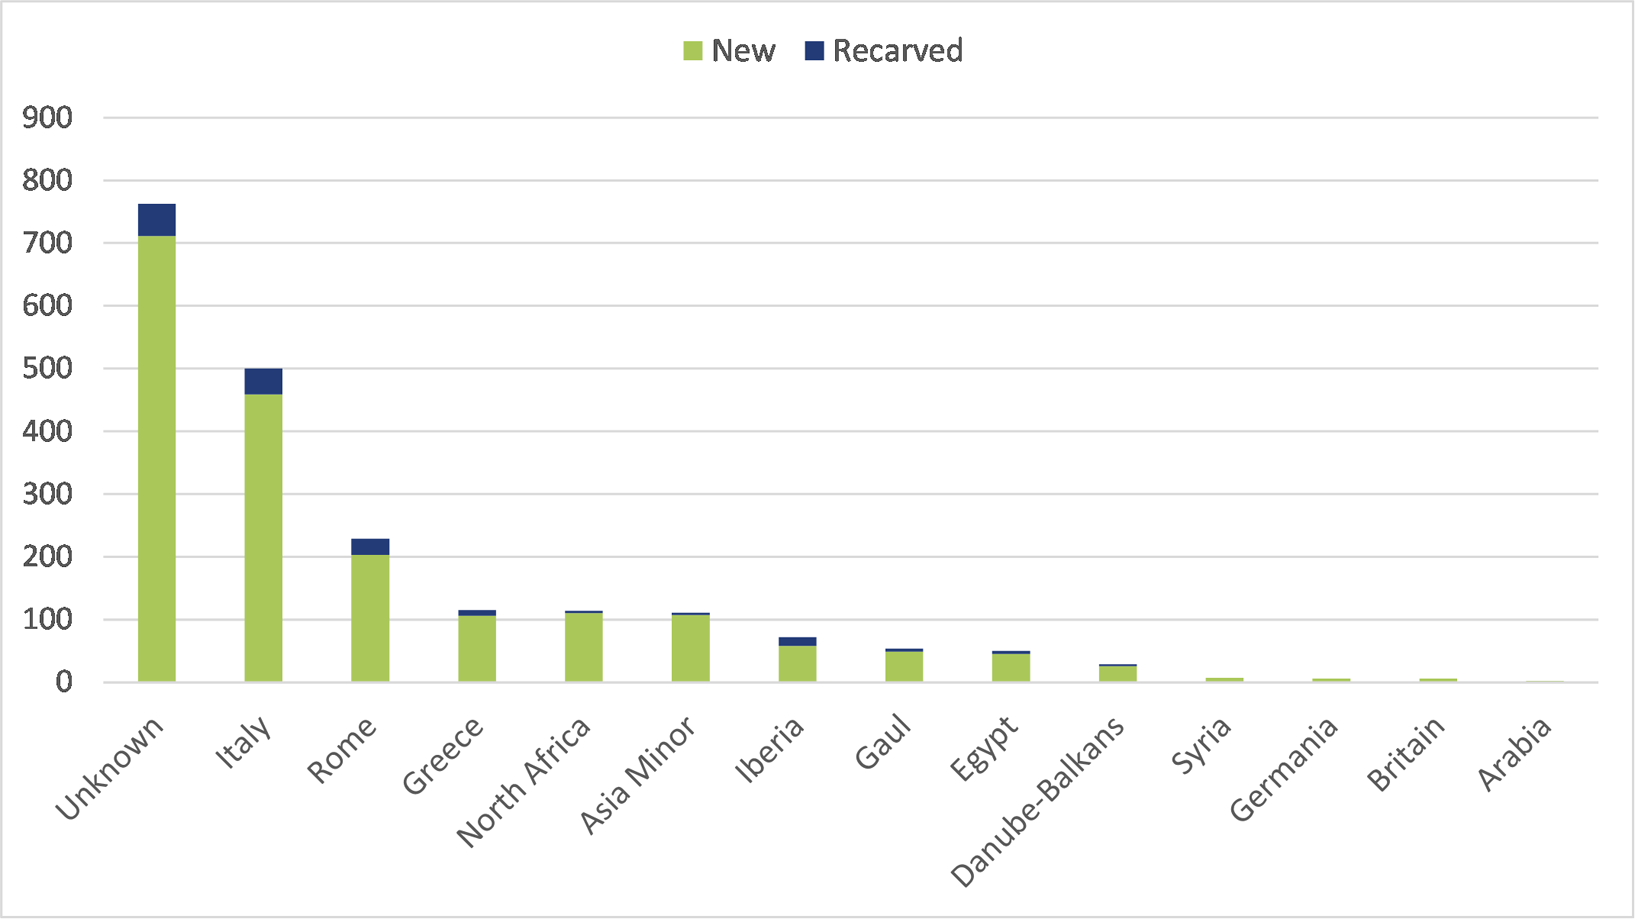
If we consider the geographical distribution of newly created portraits between 27 BCE and 285 CE (Fig. 3), we see that the areas with greater concentrations correspond to highly urbanized regions, normally characterized by the presence of important sculptural centers and a long tradition of setting up honorific statuary, namely Italy (459), Rome (203), North Africa (110), Asia Minor (107), and Greece (106). It should be noted, however, that the highest number of portraits (711) are of unknown provenance. While most of those were found in private and core collections, and thus likely came mainly from Italy and Rome, it is impossible to factor them into the analysis.
Geographical distribution of new and recarved portraits ca. 27 BCE–285 CE (n=2058). (Chart by the authors.)

Results were also organized by dividing the data according to dynasty: Julio-Claudians, Flavians, Adoptive emperors, Antonines, Severans, and Soldier emperors.Footnote 59 At first glance, the production of imperial portraits appears to have reached its peak with the Julio-Claudians, declining considerably under the Flavians, then slowly rising again in the following periods, reaching a new – but lower – peak under the Antonines, then declining again (Fig. 4). This interpretation, however, does not take into proper consideration the different lengths of the periods considered; a more weighted analysis, presenting an average of the number of portraits produced by year, results in a different picture (Fig. 5).Footnote 60 While the overall trend is similar to the one described above, both the Julio-Claudian peak and the Flavian decline are less striking. Furthermore, even though the total number of Julio-Claudian portraits is higher than that of the Antonines,Footnote 61 when factoring in the different lengths of their reigns, it becomes clear that the real peak in production was first reached under the Adoptive emperors and then surpassed under the Antonines. While average yearly production decreased under the Severans, it was still higher than what had been achieved before the Antonines. This is to say that, after a long period of experimentation under the Julio-Claudians, dedicating statues to the ruling emperors became routine and widespread throughout the Empire. There are, however, some interesting outliers to consider, showing local variation in the production and reception of imperial images. Figure 6 shows the average number of new portraits produced per year in different parts of the Empire, organized by ruling family. The chart reveals some noteworthy results when focusing on Rome, where the number of new portraits per year under the Flavians is almost equal to the figure for the Julio-Claudians, suggesting an interest in setting up statues of the new ruling family in the capital that finds no parallels in other parts of the Empire. The focus of the Flavian political agenda was clearly the city of Rome, as also evidenced by their extensive building programs.Footnote 62 Nero had profoundly shaped the urban landscape of the capital through important monumental projects, and the surviving evidence also suggests he disseminated his images within the city on a scale that surpassed his predecessors, including Augustus.Footnote 63 In their effort to rebuild Rome after the ravages of the civil war, the Flavians had to confront and match the legacy of the last Julio-Claudian emperor.Footnote 64 In Greece and Asia Minor, we see a considerable increase in the yearly production of new portraits under the Adoptive emperors rather than the Antonines, yet this is far from surprising if we consider Hadrian’s special relationship with the cities of Achaia and Asia.Footnote 65 In Iberia, we see two peaks in yearly production, under the Julio-Claudians and the Adoptive emperors. The first peak can be connected with the growing Roman presence on the Iberian peninsula following its complete conquest in the time of Augustus, as evidenced by the settling of veterans and the foundation of numerous colonies;Footnote 66 the second peak was likely influenced by Trajan and Hadrian’s local origins, as clearly evidenced by the lavish building program carried out in their hometown, Italica.Footnote 67 While the limited number of new Flavian portraits might appear surprising given Vespasian’s grant of Latin rights to all the cities of Hispania, this does not take into consideration the recarved images produced in this period, assessed in the next section. Still, the numbers remain lower than expected, an occurrence that might have been influenced by the limited economic resources of the communities that most benefited from the Flavian reform.Footnote 68 When comparing surviving portraits and epigraphic evidence for the dedication of imperial statues in the province between 138 and 235 CE, on the other hand, the two datasets show clear inconsistencies. Very few portraits of Antonine and Severan emperors survive, while we have numerous statue bases dating to the reign of Antoninus Pius and the joint rule of Marcus Aurelius and Lucius Verus, followed by a decrease that becomes particularly evident under Commodus – likely caused by his damnatio memoriae – and a new rise under the Severans.Footnote 69 The discrepancies between the numbers of portraits and bases from this period are difficult to explain but might have been caused by a gradual substitution of marble with bronze.Footnote 70 In North Africa, on the other hand, production under the Julio-Claudians is surprisingly low and only starts increasing from the Adoptive emperors onwards, when we can postulate a full adoption of Roman civic models and a close integration within the imperial orbit, especially among the local elite.Footnote 71 In Egypt, meanwhile, yearly production remained steady throughout the period under consideration.
Total number of new portraits by dynasty (n=1,895). (Chart by the authors.)

Average number of new portraits produced by year, organized by dynasty (n=1,895). (Chart by the authors.)

Geographical distribution of new portraits produced per year, organized by dynasty (n=1,895). (Chart by the authors.)

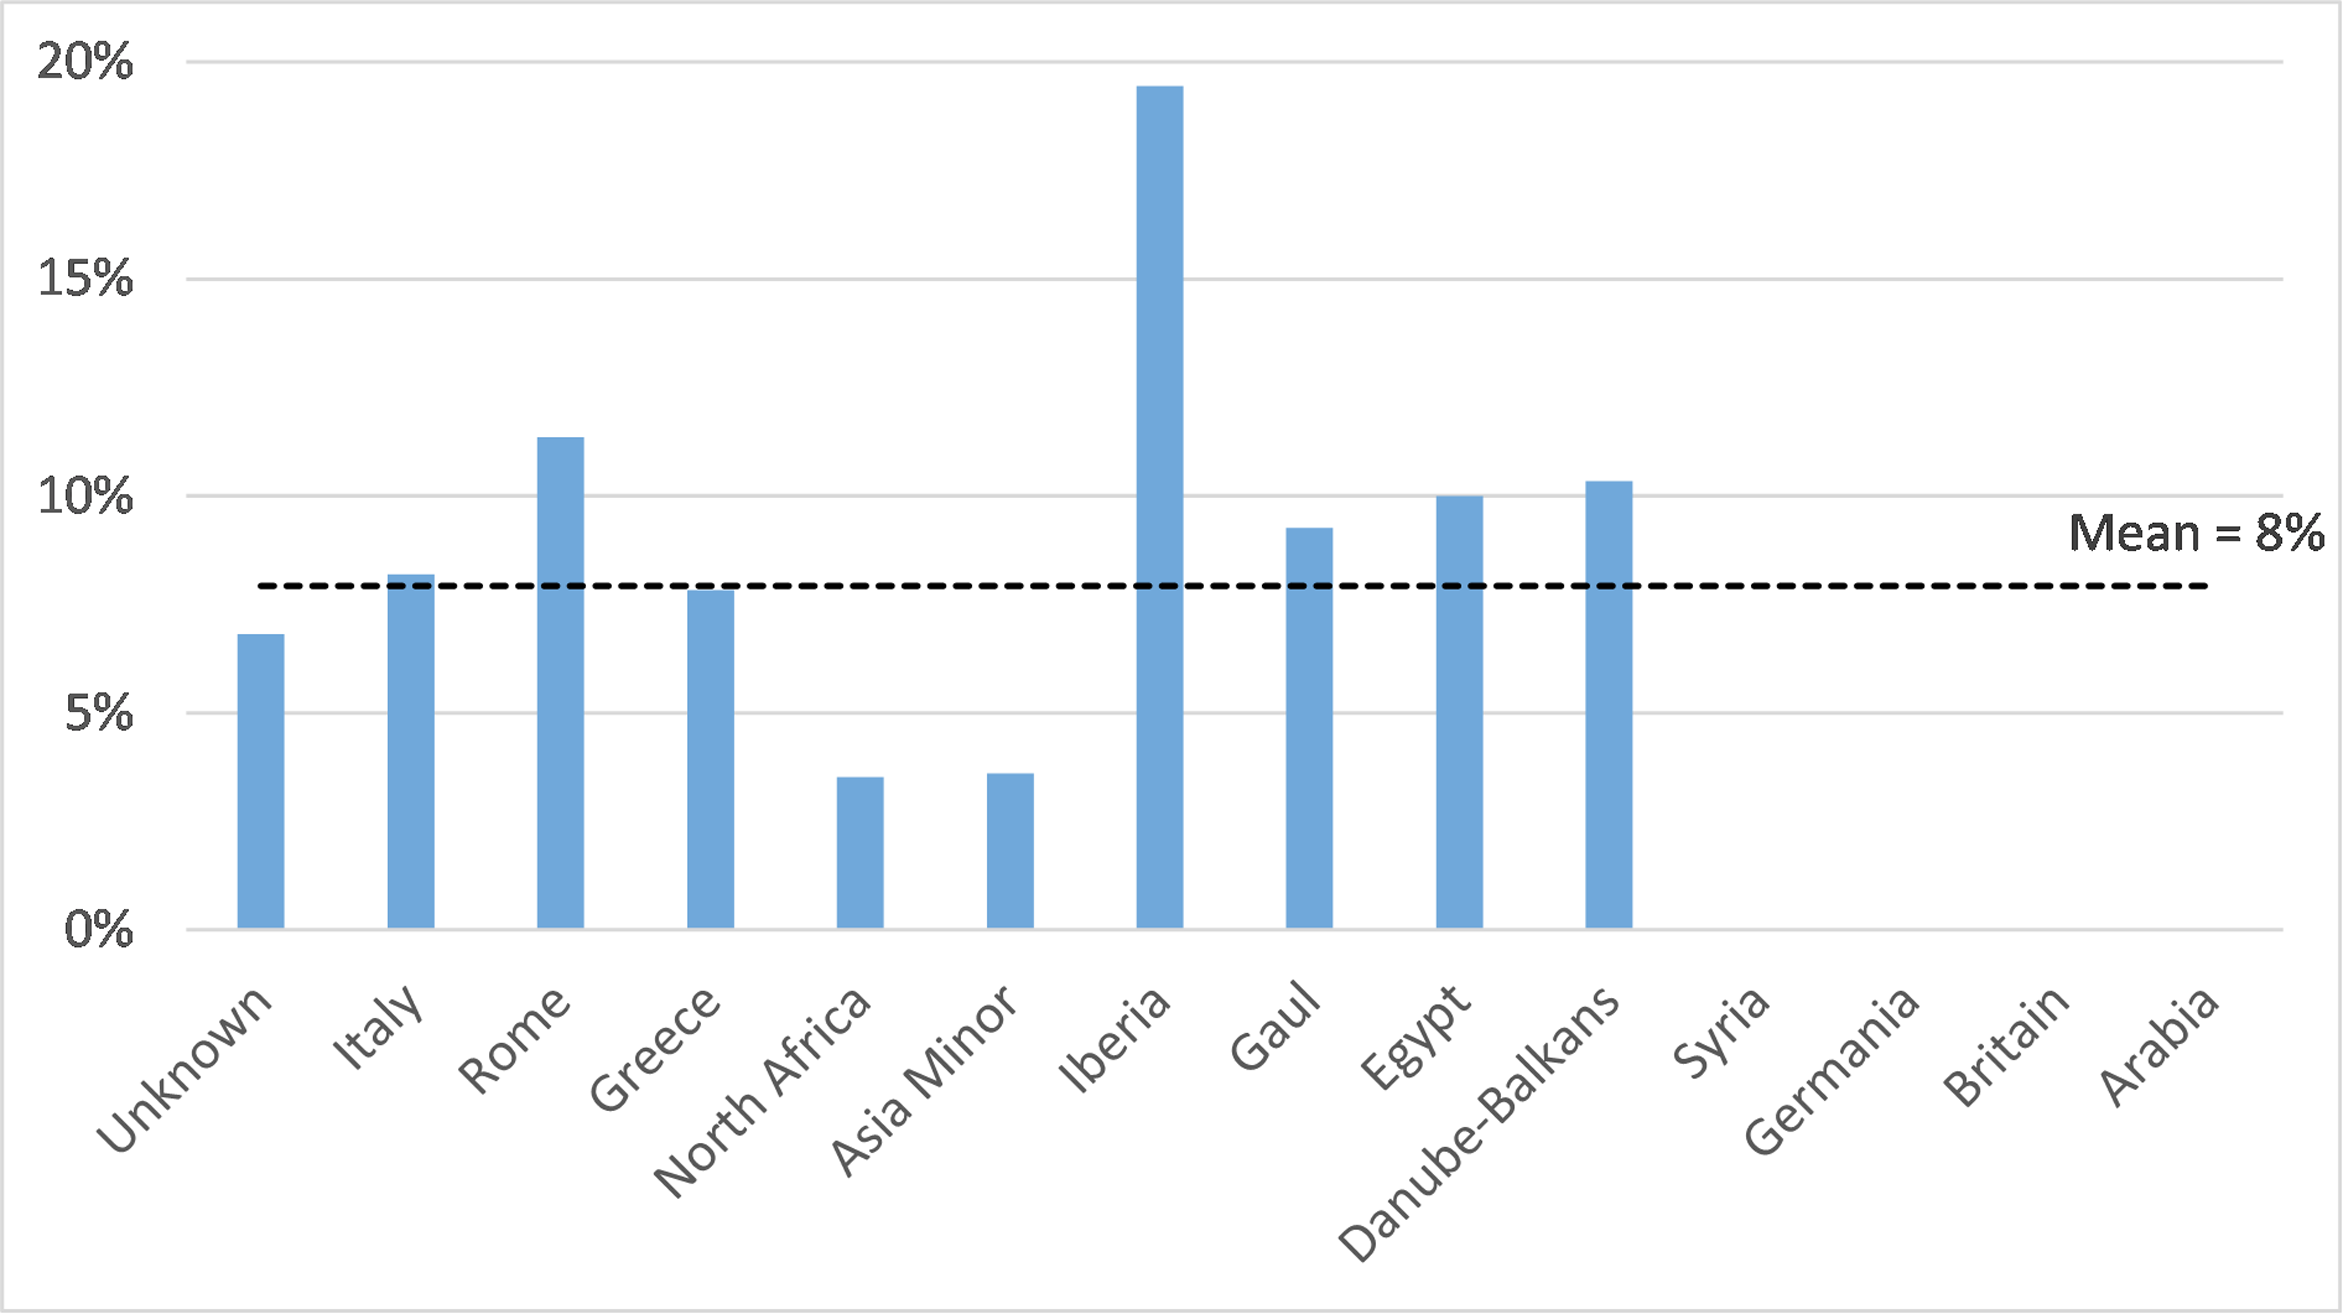
If we turn to recarved portraits and consider their geographical distribution, it becomes clear that the areas with the highest percentages of recarving do not correspond with the parts of the Empire characterized by higher production or higher survival of sculptural evidence; the phenomena are not directly correlated, and recarving shows independent geographical patterns connected with local preferences and traditions. Figure 7 shows the percentages of recarved portraits over total production, divided by region; it also includes the overall recarving average (8%), calculated on the total number of portraits included in this study. The main outliers appear to be Rome (11%) and Iberia (19%), which are well above the overall average, and North Africa (4%) and Asia Minor (4%), which are considerably below average. To better understand these trends, the data was also assessed chronologically, as shown in Figures 8–12, which present the percentage of recarving in all regions for each ruling family, as well as the period average. As previously noted, there is no evidence of recarving under the Antonines, and, thus, they will not be discussed. The chronological breakdown allows us to appreciate local fluctuations in the practice of recarving, highlighting both geographical and chronological trends. The number of sculpted portraits from the Danube-Balkans, Britain, Germania, Syria, and Arabia is so low that it is difficult to draw any significant conclusions; therefore, they will not be discussed.
Percentage of recarved portraits over total production ca. 27 BCE–285 CE (unknown n=763; Italy n=500; Rome n=229; Greece n=115; North Africa n=114; Asia Minor n=111; Iberia n=72; Gaul n=54; Egypt n=50; Danube-Balkans n=29; Syria n=7; Germania n=6; Britain n=6; Arabia n=2). (Chart by the authors.)

Percentage of recarved portraits of Julio-Claudian emperors (unknown n=228; Italy n=160; Rome n=55; Greece n=39; North Africa n=19; Asia Minor n=44; Iberia n=41; Gaul n=25; Egypt n=21; Danube-Balkans n=6; Syria n=0; Germania n=1; Britain n=2; Arabia n=0). (Chart by the authors.)

Percentage of recarved portraits of Flavian emperors (unknown n=61; Italy n=26; Rome n=28; Greece n=9; North Africa n=6; Asia Minor n=5; Iberia n=6; Gaul n=2; Egypt n=3; Danube-Balkans n=4; Syria n=0; Germania n=0; Britain n=1; Arabia n=0). (Chart by the authors.)

Percentage of recarved portraits of Adoptive emperors (unknown n=91; Italy n=110; Rome n=29; Greece n=33; North Africa n=23; Asia Minor n=24; Iberia n=16; Gaul n=7; Egypt n=6; Danube-Balkans n=5; Syria n=3; Germania n=0; Britain n=2; Arabia n=0). (Chart by the authors.)

Percentage of recarved portraits of Severan emperors (unknown n=136; Italy n=92; Rome n=43; Greece n=8; North Africa n=27; Asia Minor n=11; Iberia n=1; Gaul n=9; Egypt n=8; Danube-Balkans n=6; Syria n=1; Germania n=3; Britain n=1; Arabia n=0). (Chart by the authors.)

Percentage of recarved portraits of Soldier emperors (unknown n=24; Italy n=14; Rome n=24; Greece n=2; North Africa n=0; Asia Minor n=3; Iberia n=1; Gaul n=2; Egypt n=1; Danube-Balkans n=1; Syria n=0; Germania n=1; Britain n=0; Arabia n=1). (Chart by the authors.)

In Rome, we find very limited evidence of recarved Julio-Claudian portraits − 4%, which is well below the average of 11% − and a significant increase under the Flavians, when 50% of the surviving portraits appear to have been recarved from the likenesses of previous emperors.Footnote 72 While the percentage of recarving is generally high under the Flavians (see Fig. 9), in Rome, it is well above average, its figures only surpassed by Iberia.Footnote 73 These numbers confirm what has already been shown when assessing new Flavian portraiture in Rome, highlighting once again the importance of the capital in contemporary imperial propaganda and the dissemination of imperial images. While the Flavians reigned for a shorter period than the other dynasties being considered, this alone does not explain the concentration of imperial portraits in Rome: the need to consolidate power and legitimacy in the capital after almost a century of Julio-Claudian rule was the main driver. We do not find a similar reaction in the rest of the Empire, but it is difficult to establish whether this was because of limited responsiveness among local populations or because the emperors focused their efforts on Rome. Recarving remained high in the capital in the following periods as well, confirming the reactiveness of the emperors and metropolitan elite when it came to − literally − reshaping the appearance of the city to align it with the new ruling family. It was only under the Soldier emperors that things changed and, for the first time, the percentage of recarving in Rome became lower than in Italy, while the production of new portraiture remained higher than in the rest of the Empire, an occurrence that highlights the continued importance of the capital even during this prolonged period of crisis (Fig. 12).Footnote 74
Overall, recarving in Italy and Greece aligns with the general average. While Italy is normally in line with the period average, Greece shows some fluctuations, namely low evidence for Julio-Claudian recarving and a slightly higher rate for the Adoptive emperors. The latter related only to Trajan, 4 out of whose 11 securely identified portraits were recarved. This is easily explained from a technical point of view: while it was easy to turn a portrait of Domitian or a Julio-Claudian emperor into Trajan, it was nearly impossible to allow for Hadrian’s voluminous hairstyle and beard.
It has already been noted that Iberia exhibits a considerable production of Julio-Claudian and Adoptive portraits; recarving is also consistently high in the region at this time, only to disappear in the following periods. During the Julio-Claudian period, Caligula’s portraits were reworked into those of Augustus (RIPD 38, 44, 74, 200), Tiberius (RIPD 250), and Claudius (#11, RIPD 471), attesting to a high responsiveness among the Iberian elite to changes in power. It is interesting to note, however, that most of Caligula’s portraits were recarved into the likeness of Augustus rather than Claudius, as was more common.Footnote 75 The Iberian population – but most likely the local elite – continued to hold in high esteem the first Julio-Claudian, who strongly influenced the socio-political and cultural milieu of the peninsula. The majority (67%) of surviving imperial portraits dating to the Flavian period were recarved, always from those of Nero. Recarving remained slightly above average under the Adoptive emperors, but newly produced portraits were more common. Most imperial portraits from Gaul were found in Gallia Narbonensis, and almost half of them came from the Roman villa of Chiragan. This concentration has already been identified by Emmanuelle Rosso, who linked it to higher urbanization in the area and its early annexation by Rome, with many cities coming to enjoy legal privileges under Augustus.Footnote 76 In Gaul, the average yearly production of imperial portraiture appears to have remained stable between the 1st and 3rd c. CE, except for during the Flavian period, when we find an almost negligible amount of portraiture, often reworked.Footnote 77 With the exception of the bust of Septimius Severus found at Chiragan (RIPD 1655),Footnote 78 there is no evidence for recarving from the Adoptive emperors onwards, possibly suggesting a preference for the destruction of the images of damned emperors rather than their reworking by local artisans.Footnote 79
Recarving in Egypt was mainly limited to the Julio-Claudian period, when the heads of two – possibly three – Hellenistic kings were reworked into the likeness of Augustus (RIPD 57, 91, 185). To them, we can add three portraits of Nero recarved into Augustus (RIPD 1), possibly Titus (RIPD 589), and Gallienus (RIPD 1952).Footnote 80 In Egypt, damnatio memoriae was already practiced during the Pharaonic period – especially the New Kingdom – and under Ptolemaic rule. While the usurpation of monuments and statuary was more commonly achieved by simply erasing the name of the former ruler and substituting it with that of the new pharaoh, the facial features and bodies of royal statues were occasionally reworked.Footnote 81 In Ptolemaic times, the practice continued, as evidenced by three portraits of the usurper Ptolemy X reworked into the likeness of his elder brother Ptolemy IX.Footnote 82 Given these precedents, it is not surprising to find continued evidence of recarving in Roman times; however, the absence of portraits of Caligula – either new or recarved – is peculiar, suggesting that some of the statues tentatively identified with Augustus might instead represent this youthful emperor, or that some of the portraits allegedly recarved from Nero originally represented Caligula instead.
Both North Africa and Asia Minor show a very low level of recarving throughout the period under analysis, likely for contrasting reasons. While official sculpture was mainly imported into North Africa due to the lack of local white marble, or produced by foreign sculptors,Footnote 83 in Asia Minor, sculptural workshops flourished from the Hellenistic period onwards thanks to the presence of multiple marble quarries.Footnote 84 Neither situation favored the practice of recarving: in one case, due to the lack of expertise; in the other, because it was likely quicker – if not more economical – to sculpt an entirely new portrait. The picture becomes clearer when we consider the degree to which imperial portraits were reworked, as assessed in the next section.
Level of recarving (FB)
To evaluate geographical and chronological patterns in recarving practices, reworked imperial portraits were classified using a numerical system (3 to 0). While it was occasionally possible to assess the materials in person, for the most part, the classification was based on photographs and the work of previous scholars.Footnote 85 The highest level of recarving (3) was assigned to portraits where the sculptor obliterated (almost) completely the likeness of the previous emperor on all sculpted sides. That was the case for the head of Vespasian from Carthage at the British Museum (RIPD 560), where Nero’s long locks were erased entirely even on the back of the head, as evidenced by the grooves left by the chisel, visible on the neck just below the newly created hairline (Fig. 13).Footnote 86 Exceptions were made for portrait heads whose backs had not been carved to begin with and for capite velato statues, where the back and sides did not require any work. If traces of recarving could be found on all the remaining sides, the portraits were assigned to group 3, as the sculptor operated on every available surface. Level 2 was used to classify portraits where the front was reworked but the less visible parts of the head were not touched. The latter include the sides and back, but also the top of the head, including the hair above the fringe, as it was nearly invisible to viewers observing the statue from below. The portrait of Claudius at Centrale Montemartini (RIPD 456), which retains much of Caligula’s hairstyle, belongs to this group (Fig. 14).Footnote 87 Another good example is offered by a portrait head of Vespasian from Ecija, now in Seville (RIPD 581). While the front was carefully recarved, the hair on the top and sides of the head was only summarily executed, and the back shows signs of the use of a point chisel and drill to erase Nero’s coiffure, which was left entirely untouched in places (Fig. 15). Level 1 was assigned to those portraits showing clear traces of the former subject on all sides, including the front. A perfect example is offered by the Vatican Nero (RIPD 516), where the distinctive fringe of Gaius Caesar is still obviously visible (Fig. 16).Footnote 88 Level 0 portraits are those that show no traces of reworking other than changing the name of the emperor on the base. The only instance of this for the period under consideration is a bust of Caracalla, renamed as Constantine, in the Skikda Museum (RIPD 1746). We could potentially add to this the surviving portraits of Geta produced between 205 and 209 CE (2. Thronfolgertypus), which were almost indistinguishable from those of his brother Caracalla.Footnote 89 By simply altering or replacing the statue base, the image of the damned emperor could be turned into that of the ruling one, thus avoiding destruction. Some portraits presented clear signs of attachments, made of either marble or plaster, which were applied over the hair of the former subject (e.g., RIPD 424, Fig. 17). Even though the previous hairstyle had not been smoothed out and removed, it was completely obliterated from view and, thus, it was considered reworked. The advantage of this classification system is that it is entirely based on the agency of the sculptors behind the reworkings, focusing on those areas they operated on. The system was devised to avoid subjective considerations based on the “quality” of the finished work and to make allowance for the necessary technical limitations sculptors incurred. Where a portrait was placed must have also influenced the level of recarving, with statues that could be viewed in the round more likely to be reworked on all sides, while those placed in a niche required more limited intervention. Since we are unable to reconstruct the original context of the vast majority of surviving imperial portraits, it is difficult to fully assess its impact on reworking practices.Footnote 90 It is interesting to note, however, that the only recarved portraits to come from private buildings (RIPD 639, 658, 1655) were found in wealthy villas, believed to have been owned by the emperor himself or someone closely connected to the imperial family.Footnote 91 While the data is extremely limited, it suggests, not too surprisingly, that the practice of reworking was limited to the public sphere, and only employed by private individuals in their residences as an extreme sign of allegiance to the imperial propaganda.
Example of recarving level 3. Vespasian recarved from a portrait of Nero. London, British Museum, inv. 1850,0304.35 (© The Trustees of the British Museum.)

Example of recarving level 2. Claudius recarved from a portrait of Caligula. Rome, Musei Capitolini, Centrale Montemartini, inv. 2443. (D-DAI-ROM-41.2566 and D-DAI-ROM-41.2568, All rights reserved.)

Example of recarving level 2. Vespasian recarved from a portrait of Nero. Sevilla, Museo Arqueológico, inv. CE2006/5. (© JUNTA DE ANDALUCÍA. Consejería de Cultura y Deporte. Photos by Martín García and Pablo Quesada.)

Example of recarving level 1. Nero recarved from a portrait of Gaius. Rome, Musei Vaticani, Museo Pio Clementino, Sala dei Busti, inv. 591. (D-DAI-ROM-96Vat.2173, All rights reserved.)

Claudius recarved from a portrait of Caligula. Hannover, Museum August Kestner, inv. 1978.15. (© Museum August Kestner.)

The majority (52%) of surviving recarved portraits belong to level 2, showing that, in most cases, it was deemed enough to intervene only on the most visible parts of the head rather than working every side (Fig. 18). If we divide the data by dynasty, it appears that the lower level of recarving (1) can only be detected on Julio-Claudian and Flavian portraits, while the higher percentage of level 3 recarving is found under the Adoptive emperors (Fig. 19). This suggests an evolution in the practice of recarving, with a more tentative and possibly rushed approach in the Early Imperial period. The more thorough reworking we witness during the reigns of Nerva and Trajan was likely influenced by a desire to completely remove the image of Domitian, whose portraits were widespread throughout the Empire. The fact that under the Flavians we normally find a lower level of reworking, even though they were driven by the same need to erase Nero’s portraiture and remained in power for a comparable number of years, suggests a change in attitudes, one that required a more thorough intervention on the statues of damned emperors. Under the Severans, the number of recarved portraits dropped significantly,Footnote 92 and we find an even distribution between level 2 and level 3 recarving. While the number of recarved portraits under the Soldier emperors is considerably lower than in the 1st and 2nd c. CE, it is interesting to note how the majority of them are reworked on all sides (level 3), even though in a more cursory way than what was observed in previous periods, especially in the less visible areas. Rather than intervening on the statues of their direct predecessors, sculptors mainly reworked portraits of Hadrian and Julio-Claudian emperors to produce images of Gordian III and Gallienus. It is possible that the style of those earlier portraits appeared too different from the current one, leading sculptors to operate on every side of the head so that the finished work was not too jarring to its viewers.
Level of recarving (n=162). (Chart by the authors.)

Level of recarving by dynasty (Julio-Claudians n=68; Flavians n=49; Adoptive emperors n=30; Severans n=8; Soldier emperors n=7). (Chart by the authors.)

In terms of geographical distribution (Fig. 20), the most interesting outliers occur in Asia Minor and North Africa, again showing almost opposite trends. In Asia Minor, there is no evidence for the highest level of recarving, as we find only a very limited number of level 2 and 1 portraits.Footnote 93 Since the area was famous for its sculptural workshops, this can hardly be explained in terms of a lack of expertise; rather, we can postulate a local preference for producing new statuary rather than reworking portrait heads in the round. Considering their skills and the availability of marble, sculptors could likely have produced a new head for insertion – or a whole statue if necessary – in a relatively short time. This was also confirmed by the analysis in the previous section, which highlighted the limited evidence for recarving in the region.Footnote 94 North Africa also presents a low percentage of recarved imperial portraits; interestingly, they all show the highest reworking level. As already discussed, official marble sculpture in the area was often imported or produced by migrant sculptors hired for a particular commission; thus, it is possible that, on the very few occasions when a portrait was reworked rather than destroyed,Footnote 95 this was done thoroughly, possibly even by hiring a specialist. The other regions where we find no evidence of low-level recarving are Greece, Gaul, and Egypt, all areas with local sculptural traditions and/or close artistic links with Rome. Along the Danube and in the Balkans, we also find only high levels of recarving, but the evidence is very limited (RIPD 215, 587, 821) and always from the fora of main urban centers.
Level of recarving, geographical distribution (unknown n=52; Italy n=41; Rome n=26; Greece n=8; North Africa n=4; Asia Minor n=4; Iberia n=14; Gaul n=5; Egypt n=5; Danube-Balkans n=3). (Chart by the authors.)

Conclusions (FB, RB)
The Roman practice of reworking imperial portraiture, far from being simply the expression of a lack of time and resources, was a complex phenomenon characterized by the interaction of technical and ideological processes. It stemmed from opposite impulses: either the necessity to obliterate the memory of a ruler who had incurred damnatio memoriae, or the desire to reuse the images of honorable emperors for propagandistic purposes (translatio memoriae). While the former scenario was the norm during the first three centuries CE, occasionally even in the form of retrospective reconfigurations, the latter became more common in the 4th c. CE. The practice of recarving was temporarily abandoned under the Antonines for mainly technical reasons, as the surviving portraits of damned Julio-Claudian and Flavian emperors could not be reworked to depict the voluminous hairstyles and beards that were in fashion in the 2nd c. CE. Moreover, recarving was almost absent during periods of crisis, when the quick succession of different claimants to power, each discrediting their opponents, did not allow the necessary time to rework the portraits that survived destruction and mutilation, the first reactions to any form of memory sanction.
From a geographical point of view, it is not surprising to see that, after an initial period of experimentation under the Julio-Claudians, Rome reacted quickly to changes in power, having a particularly high percentage of recarved portraits from the Flavians onwards, which only dropped off during the time of the Soldier emperors, when the capital started to lose its pre-eminent position. Asia Minor and North Africa are interesting outliers: while they show a consistently low percentage of recarved portraits, they do so for contrasting reasons, as also evidenced by the level of recarving. While the availability of skilled sculptors and resources in Asia Minor led to a local preference for creating new sculptures rather than reworking existing ones, the opposite was true in North Africa. On the other hand, the evidence from Iberia highlights how regional loyalties towards individual emperors or ruling families could influence sculptural production.
We also observe general trends in how thoroughly imperial portraits were recarved, especially in terms of which parts of the head sculptors operated on. While in the Early Imperial period, recarving was normally limited to the most visible parts of the face, occasionally leaving traces of the previous emperor even on the front, in later times, portraits were often recut on all sides. While this occurrence could be partly justified by the obvious similarities among members of the Julio-Claudian family, meaning limited intervention was needed to turn one into the other, it raises some interesting questions about the reception of these reworked images by ancient viewers.
Galinsky argues that traces of the original portrait were intentionally maintained to preserve the memory of both honorable and dishonorable predecessors and inspire comparisons with current rulers.Footnote 96 While we have literary and material evidence for the active participation of the population in the acts of obliteration and mutilation that immediately followed official memory sanctions,Footnote 97 we can hardly claim such direct involvement in the long term, nor that ancient audiences could always fully grasp the transformation undergone by recarved statues. The reception of imperial images was mediated by their context: portrait heads did not exist in a vacuum, but were inserted into statues that, because of their placement, size, and attributes, were immediately identified as representing an emperor. Inscriptions further facilitated the identification, and the sculptures were normally placed on a plinth or at such a height that their facial features could be difficult to perceive. Studies on imperial portraiture have already highlighted how some portraits could deviate considerably from official types, especially in the provinces, casting doubt on the idea that rulers were supposed to be identified exclusively thanks to their appearance.Footnote 98 Recarving was an act that required the combined agency of local elites and sculptors, first to commission the refashioning of a statue and then to decide how to operate on it, yet the effect this intervention had on viewers is difficult to grasp fully, as it was influenced by different variables. While a senator in Rome would likely have recognized the traces of the reworked emperor and understood the transformative process the portrait had undergone, the same was probably not true for a member of the lower classes, especially outside the capital. Time is another element to consider: people might remember what statues used to be erected, removed, and reworked during their lifetime, but the memory would necessarily have faded over the years. The reception of reworked imperial statues was both nuanced and layered, and talking about ancient viewers as if they were a monolithic entity negates this complexity.
At the same time, the lack of clear epigraphical evidence makes it difficult to assess who commissioned recarved portraits. Jakob Højte masterfully tracked local and chronological variations in the identities of those who dedicated imperial statues,Footnote 99 but we cannot assume that these trends necessarily applied to the reworking of these portraits. The case studies offered by Asia Minor and North Africa show how opposite dedication practices could lead to similar recarving patterns: in Asia Minor, the majority of statue bases were dedicated by local communities and their executive bodies, while North Africa has one of the higher percentages of statues dedicated by private individuals,Footnote 100 yet in both regions recarving is low. On the other hand, in Iberia, where the number of private dedicants surpasses any other part of the Empire, we find a high percentage of recarving from the Julio-Claudians to the Adoptive emperors, but none in the following periods. The identity of the dedicators had no direct impact on recarving practices, which appear to have followed specific local and chronological trends instead. Emperors were clearly aware that images of their predecessors could be recarved or reused, but it remains unclear to what degree they intervened to constrain or encourage this practice. The evidence is limited, yet it appears to suggest that, at least publicly, the former was true: Tiberius was upset upon learning that the praetor of Bithynia, Granius Marcellus, had been accused of replacing the head of a statue of Augustus with that of Tiberius,Footnote 101 while Marcus Aurelius and Lucius Verus sent clear instructions not to recast the silver images of former emperors into their likenesses, even when they were worn and difficult to identify.Footnote 102 Still, a change in attitudes might already have emerged by the first half of the 3rd c. CE, when it became an accepted practice to restore the statues of previous emperors that had been corrupted by the passage of time.Footnote 103 Our current understanding of the practice of recarving does not allow us to grasp fully its socio-political implications; thus, while we might identify general trends, it often remains difficult to understand why a specific portrait was recarved at a given time and who exactly were the actors involved in an apparently small act that could, however, reshape the spaces they lived in and, by extension, the perception of their history.
Supplementary material
The supplementary materials contain a complete list of the imperial portraits used for the analysis presented in this article. The list includes portraits of Roman emperors from Augustus to Carinus (c. 27 BCE–285 CE), documenting their provenance, current location, and whether they were recarved or not. To view the supplementary materials for this article, please visit https://doi.org/10.1017/S104775942610066X.
Acknowledgments
This paper is published under the project RESP (The Roman Emperor Seen from the Provinces), which receives funding from the European Research Council (ERC) under the European Union’s Horizon 2020 research and innovation program (GA no. 101002763). The project is based at the University of Verona in partnership with King’s College London and the Warwick University Manufacturing Group: https://cordis.europa.eu/project/id/101002763. We want to express our gratitude to the members of the RESP research team, Dario Calomino, Julia Lenaghan, Giorgia Cafici, Will Wootton, Lee Ann Riccardi, Hristina Ivanova-Anaplioti, Nisan Lordoğlu, and Francesca Lam-March, for their help and comments. We also thank the project’s Advisory Board members, Barbara E. Borg, Andrew Burnett, Matteo Cadario, Jane Fejfer, Ralph von den Hoff, and Bernhard Woytek.


 Open access