

The worldwide prevalence of metabolic diseases such as type 2 diabetes mellitus (T2DM) is rapidly increasing, especially in China and Southeast Asia( Reference Hu 1 ). Consequently, there is considerable public health and consumer interest in taking steps to reduce the risk of these diseases. Repeated exposures to high postprandial glucose (PPG) and insulin (PPI) responses are implicated in pre-diabetes and T2DM( 2 ). There is evidence that reducing PPG reduces progression from pre-diabetes to T2DM and risk of CVD, as is shown in studies with the α-glucosidase inhibitor Acarbose or low glycaemic index/glycaemic load diets( Reference Chiasson, Josse and Gomis 3 – Reference Blaak, Antoine and Benton 6 ).
Carbohydrate-rich staple foods are interesting candidates for reducing PPG and PPI exposures, because of their widespread and frequent consumption( Reference Lafiandra, Riccardi and Shewry 7 ). The two most common carbohydrate-rich staple foods in South Asia are rice and wheat-based flatbreads( Reference Henry and Kaur 8 ), the latter generally prepared at home from commercially manufactured whole-wheat flour mixes (‘atta’). Therefore, cost-effective feasible approaches to further reduce the PPG and PPI response to these staple foods are of interest.
Soluble fibres, especially soluble viscous fibres, can lower PPG( Reference Jenkins, Kendall and Axelsen 9 ). An increased viscosity delays gastric emptying( Reference Marciani, Gowland and Spiller 10 ) and inhibits the propulsive and mixing effects of intestinal contractions( Reference Blackburn, Redfern and Jarjis 11 , Reference Edwards, Johnson and Read 12 ), resulting in a lower PPG( Reference Woerle, Albrecht and Linke 13 ). In addition, legume flours, such as chickpea flour (CPF), are known to give a lower PPG response than wheat flours( Reference Goñi and Valentín-Gamazo 14 ). We observed that viscous guar gum (GG) added to flatbread flour in combination with CPF dose dependently lowered PPG and PPI responses( Reference Boers, MacAulay and Murray 15 , Reference Boers, MacAulay and Murray 16 ). It is assumed that viscous gums mainly affect PPG by reducing rates of glucose absorption( Reference Ekstrom, Bjorck and Ostman 17 – Reference Wolf, Wolever and Lai 20 ), but testing this hypothesis would require a determination of glucose fluxes. The PPG response profile is the net result of the rate of appearance of glucose from food in the peripheral circulation (rate of appearance of exogenous glucose (RaE); tissue disposal (rate of disappearance of total glucose (RdT); disposal of all glucose to the tissues); and hepatic glucose production (endogenous glucose production (EGP); rate of glucose production by the liver)( Reference Eelderink, Moerdijk-Poortvliet and Wang 21 ). RaE is a surrogate for glucose absorption in the gut, though slightly different because it does not take account of liver glucose uptake on first pass metabolism and metabolism of glucose in enterocytes. The dual stable isotope technique is often applied to distinguish RaE from other glucose flux parameters( Reference Beysen, Hellerstein and Turner 22 ). For example, this technique has previously demonstrated that differences in the glycaemic responses to some starch-rich foods reflect changes in post-absorptive events more than (as might be assumed) differences in digestibility and absorption( Reference Eelderink, Schepers and Preston 23 ).
The present research was therefore carried out in the context of the general question of how (soluble) fibres in foods influence glucose fluxes. More specifically, we wished to establish this for a commercially feasible combination of soluble viscous fibre and legume flour in a popular southeast Asian staple food. The primary objective of this study was to determine the effect of incorporation of GG and CPF in flatbreads on the rate of exogenous glucose uptake, expressed as the time to reach 50 % absorption of exogenous glucose (T 50 %abs). Other objectives, which contribute to getting an overall picture of glucose metabolism, were to: (1) estimate the main kinetic parameters, viz. RaE, rate of appearance of total glucose (RaT), RdT and EGP, and (2) assess the possible involvement of incretins (glucagon-like peptide 1 (GLP-1) and glucose-dependent insulinotropic peptide (GIP)) as contributors directly to the observed PPI and indirectly to the PPG responses (because of their potential effects on PPI and gastric emptying). In addition, the glucose clearance rate (GCR), the rate of plasma volume being cleared of glucose, was estimated.
Methods
Subjects
A total of fifteen healthy men were recruited locally for screening from an existing database of potential participants of Quality Performance Service Netherlands B.V. (Groningen, The Netherlands), a clinical research organisation (CRO), where the study was executed. A total of twelve subjects were planned to be randomised and three subjects were available in case a subject became ill or did not eat at least 95 % of the weight of the test meal in the first test period. Subjects who met all the inclusion criteria and had none of the exclusion criteria were considered for participation (see online Supplementary Table S1). The study was conducted according to the principles of Good Clinical Practice, the Declaration of Helsinki (2008) and according to applicable local laws and regulations concerning studies conducted on human subjects. Ethical approval was obtained from the Medical Ethics Committee of the ‘Beoordeling Ethiek Biomedisch Onderzoek’ Foundation (Assen, The Netherlands). Each participant provided written informed consent for the study. The trial was registered at clinicaltrialsgov.com as NCT01734590.
Experimental design
This study used a double-blind, randomised, controlled, full cross-over (within-subject) design. Treatment orders were balanced according to a Williams-type design, and a randomised schedule for allocation to treatment orders was generated with SAS software (version 9.4; SAS Institute Inc.) by a statistician not involved with subject contact or subsequent data analyses. A representative of Unilever who was not involved in the analyses randomly assigned a product (flour mix) to a product code (A/B/C) and randomly assigned a product code sequence to a subject number (001–012). The CRO randomly assigned a subject to a subject number using a computer-generated sequence. All persons involved in the study were blinded as to the nature of the test products until after the blind data review. One password-protected memory stick with the personal code-treatment combination was prepared and provided to the study coordinator of the CRO, to be accessed only if de-blinding of the study was necessary. The code was not broken during the study.
Subjects attended the initial screening day followed by 3 test days, at least 1 week apart. Participants were instructed to minimise changes in their habitual diet and activity during the study period. The subjects were asked to refrain from consuming 13C-enriched foods such as maize, pineapple, Quorn, cane sugar, millet, purslane, tequila and some fishes (trout, haddock, tuna, whiting), for 3 d preceding the experiments and from exercise and alcohol consumption the day before each test day. A standardised evening meal consisting of pasta with vegetables, sauce and meat, a dessert (yogurt, fruit yogurt or custard) (3912 kJ (935 kcal), 24 percent energy (en%) protein, 43 en% carbohydrate, 33 en% fat and 13·5 g dietary fibre) and mineral water was provided at the research facility, where the subjects stayed overnight. All participants fasted overnight (from 19.30 hours until consumption of the test product) but were allowed to drink water ad libitum.
In the evening, a venous catheter was inserted in each subject’s forearm for blood collection and for infusion of D-[6,6-2H2] glucose (98 % 2H atom percent excess (APE)) (Isotec). In the morning (t=−120 min), a priming dose of 2H-labelled glucose (deuterated glucose) (80×0·07 mg/kg body weight (bw)) was administered as a bolus in 2 min in 26·7 ml of water followed by a continuous infusion of 0·07 mg/kg bw per min in 0·33 ml/min for 8 h. At 2 h after the start of the infusion (t=0) each morning of each test day, subjects consumed three freshly made flatbreads (105 g flour total) with 250 ml of mineral water as breakfast, and completed this within a 15-min period at every visit at the same time and day of the week. A 5 % deviation in consumption of the standard test product quantity (measured in weight) was allowed. Subjects were allowed to drink up to 150 ml of water every subsequent hour, to be consumed after venous blood drawings. The volume of water consumed was recorded on the 1st test day and the same volume of water was consumed on subsequent test days.
Test product and preparation
The composition of the test products is given in Table 1. For the flour mix with 2 % GG (GG2), a small amount of barley flour (BF) was added to improve the sensory quality as a prototype of a commercially acceptable formulation. On the basis of our previous results( Reference Boers, MacAulay and Murray 15 , Reference Boers, MacAulay and Murray 16 ), the flour mix with 4 % GG (GG4) was used as a positive control and therefore no BF was added. For the control product (C) a refined wheat flour was used, because this is the widely used market standard product in India. The coarse flour was chosen for the experimental product because it also has a higher dietary fibre content. This was intended to be a test of an optimised, realistic potential ‘healthier’ commercial product relative to the current market standard – hence the use of this coarse flour and also BF in the experimental product (along with CPF and GG). Our previous research showed PPG responses to the ‘standard’ and higher fibre atta bases did not differ( Reference Boers, MacAulay and Murray 16 ), and it seems unlikely the small amount of BF would have had much impact. Nevertheless, results are reflecting the total product formulation and cannot be definitively assigned to any single component.
Composition of test flatbreads and all components in weight (g) with the exception of water in w/w% and APE (%)Footnote *
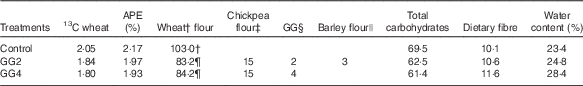
GG, guar gum; GG2, 2 % GG; GG4, 4 % GG.
* To prepare the flatbreads 2·5 g of wheat flour was initially needed to avoid sticking. The amount of 13C-labelled wheat flour is based on this extra 2·5 g of wheat flour. However, in practice, it was found that 5 g of flour was needed. Although the amount of 13C wheat flour in the flatbread was not corrected for this change in the amount of extra wheat flour.
† Flour mix Annapurna Atta (100 % refined wheat flour; Hindustan Unilever Ltd).
‡ Chickpea flour (99 % passing through 420 μm; Cardin Healthcare Pvt. Ltd).
§ GG (creamish white powder, 93 % passing through 200 mesh; P.D. Bros).
|| Barley flour (dehulled) (99 % passing through 420 μm; Cardin Healthcare Pvt. Ltd).
¶ Flour mix Annapurna Atta with traditional coarse whole-wheat flour (Hindustan Unilever Ltd).
Viable wheat seeds (Triticum aestivum L. cv. ‘Sharbati C306’) were obtained from the Centre for Genetic Resources (Wageningen, the Netherlands). After germination, the plant was grown in IsoLife’s labelling facility and continuously labelled for 15 weeks until maturity in an atmosphere containing 13CO2 (>97 atom % 13C). After harvesting, the uniformly 13C-labelled seeds (97·1 atom % 13C) were milled (Meneba) according to the same specifications (particle size, ash content and starch damage) as the non-enriched Sharbati whole-wheat flour from India, obtained from the same cultivar as the 13C-labelled wheat. After mixing the enriched with non-enriched flour, all test products obtained a final 13C-enrichment of approximately 2 % APE (values for GG2, GG4 and C were 1·97, 1·93 and 2·17 %, respectively).
All test flour mixes were formulated in the kitchen of the Consumer Centre of Unilever R&D (Vlaardingen, the Netherlands), and flatbreads were prepared fresh at the test site in a tortilla roti maker (Jaipan Jumbo Roti Maker; Jaipan Kitchen Appliances). For each single test serving, 100 g of flour (+5 g for kneading) was kneaded to a soft and uniform consistency with the addition of approximately 77 ml of water and allowed to rest for 30 min, and then divided into three equal balls of each 53 g and rolled. More water was added and absorbed when fibres or legume flour was incorporated (see Table 1). Flatbreads were subsequently baked for 15 min and kept warm until consumption within 10 min after preparation. The 13C abundance of the 13C-labelled wheat flour was verified at 97·05 atom% with isotope ratio MS, and this was used for the calculation of the kinetic parameters.
Sample collection
Blood samples were collected according to the scheme in the online Supplementary Table S2. At each time point, blood was collected in two different blood collection tubes (BD Vacutainer): NaF-tubes (0·9 ml plasma) and K2-EDTA-tubes (1·35 ml plasma), the latter containing dipeptidyl peptidase-IV inhibitor for GLP-1 and GIP preservation (BD Diagnostics). After blood collection, tubes were directly mixed by inversion (eight to ten times) and placed on ice. Within 30 min, the tubes were centrifuged at 1300 g for 10 min at 4°C. The resulting plasma was frozen in 2-ml aliquots at −20°C until analysis.
Isotopic analysis of plasma glucose
To ensure proper calculation of the kinetic parameters (RaE, RaT, GCR, EGP and RdT), fractional enrichments of orally and intravenously administered D-[U-13C] glucose and D-[6,6-2H2] glucose tracers were determined in the plasma samples at the time points indicated in the online Supplementary Table S2. Samples were deproteinised by adding 400 μl of ice-cold ethanol to 40 μl of plasma and placing on ice for 30 min. This mixture was centrifuged for 10 min and the supernatant collected for further analysis. A volume of 200 μl of the supernatant was transferred to a Teflon-capped reaction vial and dried at 60°C under a stream of N2. To convert glucose to its pentaacetate derivative, 100 μl of pyridine and 200 μl of acetic anhydride were added to the residue, and this mixture was incubated for 30 min at 60°C. The solution was evaporated at 60°C under a stream of N2 and the residue re-dissolved in 200 μl of ethyl acetate. The solutions were transferred into injection vials for analysis by GC-MS. The derivatives were separated on AT-1701 30 m×0·25 mm internal diameter (0·25-μm-film thickness) capillary column. Mass spectrometric analyses were performed using positive chemical ionisation with ammonia, with ions monitored for mass:charge ratio (m/z) ranging from m/z 331 to 337 (m 0–m 6).
Calculation of glucose kinetics
The first step in data analysis was the adjustment of the fractional distribution of glucose isotopologues as measured by GC/MS (m 0–m 6) for the natural abundance of 13C atoms (m 0–m 6), using the method of Lee et al.( Reference Lee, Bergner and Guo 24 ). Calculations were performed using the non-steady-state equations of Steele et al.( Reference Steele, Wall and De Bodo 25 ) as modified by De Bodo et al.( Reference De Bodo, Steele and Altszuler 26 ). We used an approach suggested by Radziuk( Reference Radziuk 27 ), including the assumption that the clearance rates of all glucose isotopologues, that is, tracers and tracee, are identical. Furthermore, the volume of glucose distribution was considered to be 200 ml/kg and the pool fraction 0·75( Reference Tissot, Normand and Guilluy 28 ). The non-steady-state elimination rate of the infused tracer was initially calculated and used to determine the GCR. Next, from the GCR and glucose concentrations, the disposal rates of all glucose isotopologues (RdT), as well as the disposal rates of glucose that was absorbed from the meals (RdE), can be calculated. Using the non-steady-state equations, the rates of appearance (RaT and RaE) can be calculated from these disposal rates. Finally, the difference between RaT and RaE reflects the EGP rate, that is, EGP.
The primary outcome measure T 50 %abs was calculated using the Wagner–Nelson deconvolution method( Reference Sanaka and Nakada 29 ). The percentage of 13C-glucose absorbed at time t (F(t)) was calculated as follows: F(t)=(AUC(0–t)+glucose(t)/elim.rate)/AUC(0–inf). AUC(0–inf) was the sum of the actually measured AUC(0–360) and the extrapolated AUC(360–inf) based on the elimination rate of 13C-glucose in the terminal phase. AUC(360–inf) was calculated by 13C-glucose predicted at t=360 min divided by the elimination rate.
Measurement of plasma glucose, insulin, glucagon-like peptide 1 and glucose-dependent insulinotropic peptide
Plasma glucose concentrations were measured on a Roche/Hitachi Modular automatic analyser (Roche Diagnostics) using a glucose hexokinase method. Insulin was measured by a chemiluminescent microparticle immunoassay (The ARCHITECT® insulin assay; Abbott Laboratories). GIP was determined by a RIA( Reference Krarup, Madsbad and Moody 30 ), based on an antibody that fully reacts with the primary metabolite GIP3-42. The plasma concentration of GLP-1 was also analysed by RIA( Reference Orskov, Rabenhoj and Kofod 31 ), which measured the sum of the intact GLP-1 and its primary metabolite GLP-1 9-36amide.
Statistical methods
All statistical analyses were performed with SAS version 9.4.
T 50 %abs was the primary outcome. A power calculation indicated that a minimum of twelve subjects would be needed for 80 % power to detect a mean change in T 50 %abs of 20 min at two-sided significance level of 0·05. This estimation was based on research from Eelderink et al.( Reference Eelderink, Moerdijk-Poortvliet and Wang 21 ) who used similar techniques to compare wheat bread with pasta, and observed a 38-min difference (sd 11 min) in T 50 %abs. We proposed about half that effect size as a reasonable basis for power in the current study (20 min).
The responses were summarised as areas under the curve (AUC(t0–t120 min)) over a period of 120 min. The AUC was calculated using the trapezoidal rule( 32 , Reference Allison, Paultre and Maggio 33 ). Values obtained before consumption of the meal (T=−60, −30 and −5 min) were averaged and used as the baseline.
For glucose, the positive incremental AUC (+iAUC(t0–t120 min)) was calculated by subtracting 120×baseline glucose value from the AUC 2 h. For RaE, RdT and GCR, +iAUC was calculated by subtracting 120×baseline values from the AUC(t0–t120 min). For EGP, a decremental AUC (dAUC(t0–t120 min)) was calculated by subtracting the AUC 2 h from 120×baseline EGP. Similar calculations were also used to derive the data values over a period of 240 min.
The cross-over design aspect of the study was taken into account when statistically assessing the difference between the meals for log-transformed AUC, +iAUC or dAUC using a linear mixed model with subjects as random effect. The model included the meal, baseline characteristics and visit number as fixed effects.
The results based on least squares means were expressed as a percentage change and its 95 % CI via back transformation using the control meal as a reference.
Only the primary objective (T 50 %abs) underwent pre-planned statistical hypothesis testing with P<0·05 as the criterion for statistical significance. A Dunnett adjustment was made to correct for the proposed multiple comparisons using control as a reference. For other secondary and exploratory objectives, there was no pre-planned hypothesis testing and the data are described by the means and 95 % CI. For ease of interpretation, we have, however, used the convention of describing these results as ‘significant’ where the 95 % CI does not include 0.
Results
Subjects
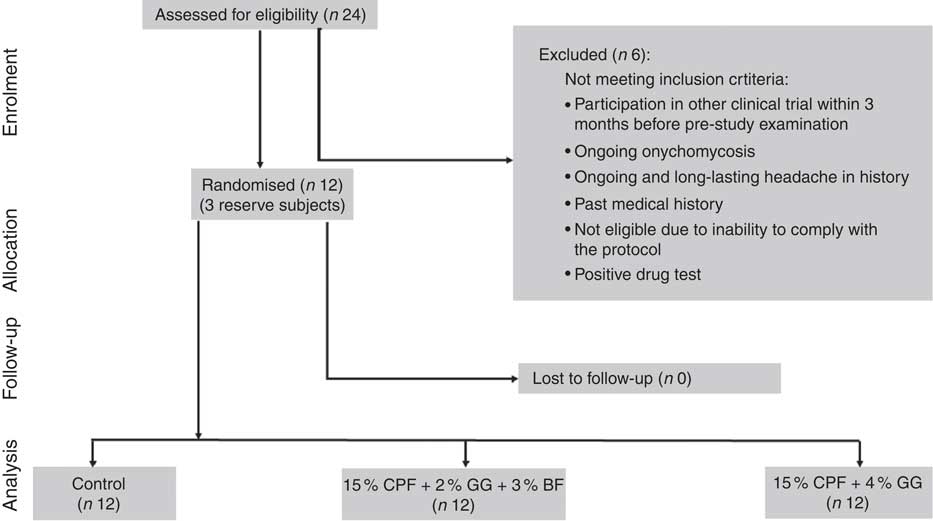
From twenty-four male subjects screened for participation, six were not eligible for the study. In all, eighteen subjects were eligible for the study and sixteen subjects were selected by lot as potential participants, one of whom cancelled his participation for personal reasons before the first intervention. In total, fifteen subjects including three reserve subjects were available, of whom twelve started and completed the study, with no dropouts or missing visits (Fig. 1). One subject arrived ill at the 1st intervention day and was replaced by a reserve subject. The baseline characteristics of participants were as follows: mean age, 23·0 (sd 2·0) years; height, 186·1 (sd 8·1) cm; bw, 78·7 (sd 8·8) kg; BMI, 22·6 (sd 1·0) kg/m2; fasting plasma glucose, 5·0 (sd 0·4) mmol/l; and glycosylated Hb (HbA1c), 30·7 (sd 3·7) mmol/mol. As blind review identified only trivial deviations from protocol, only the results of the per protocol analysis are shown and discussed here.
Flow diagram of participants throughout the study. CPF, chickpea flour; GG, guar gum; BF, barley flour.
Postprandial glucose and insulin response
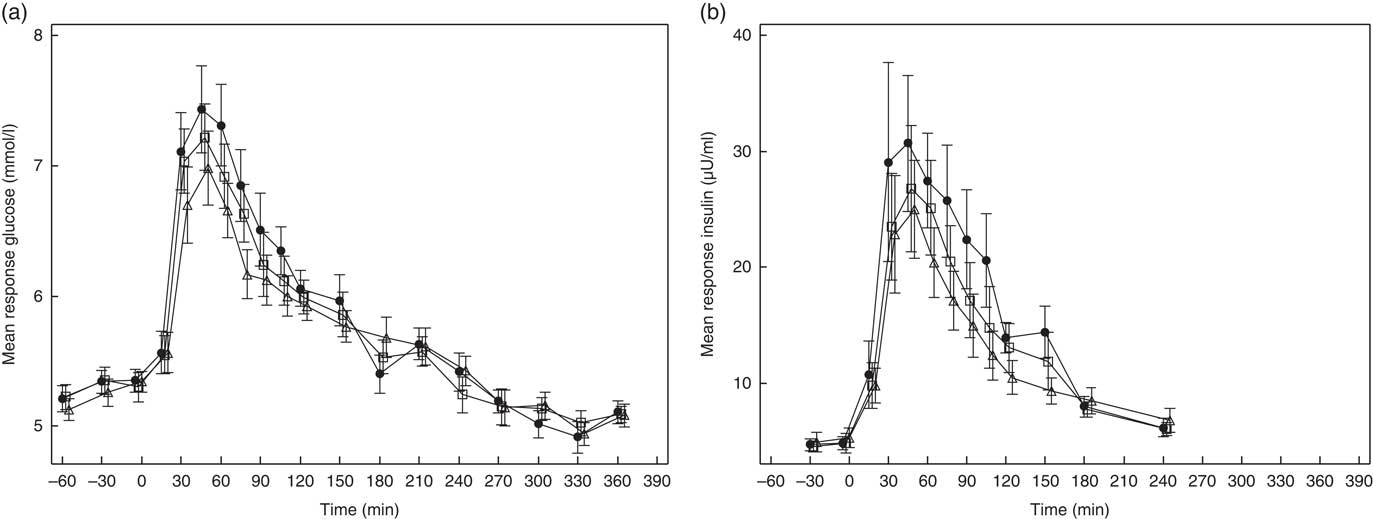
PPG and PPI response curves are shown in Fig. 2(a) and (b), respectively, and absolute values and percent differences between treatments are summarised in Table 2. Compared with C, GG2 reduced mean +iAUC(t0–t120 min) glucose by 14 % and insulin by 16 %, whereas GG4 reduced these by 26 and 23 %, respectively.
Effects of flatbread consumption with different amounts of guar gum (GG) and legume flour on plasma glucose concentration (a) and plasma insulin concentration (b). Values are means with their standard errors represented by vertical bars. ![]() , Control;
, Control; ![]() , 2 % GG;
, 2 % GG; ![]() , 4 % GG.
, 4 % GG.
Overview of results for kinetic parameters, glucose, insulin and incretin responses (Mean values and percentage differences; 95 % confidence intervals v. control)
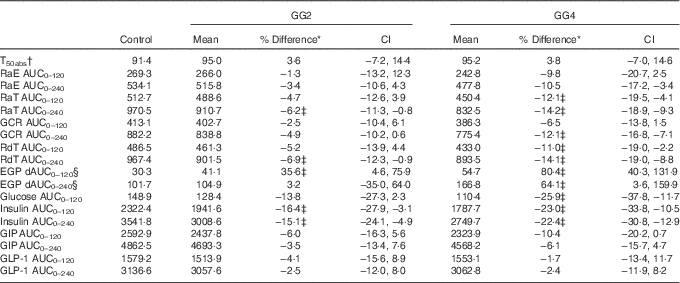
GG2, 2 % guar gum; GG4, 4 % guar gum; RaE, rate of appearance of exogenous glucose; RaT, rate of appearance of total glucose; GCR, glucose clearance rate; RdT, rate of disappearance of total glucose; EGP, endogenous glucose production; dAUC, decremental AUC; GIP, glucose-dependent insulinotropic peptide; GLP-1, glucagon-like peptide 1.
* Difference=difference v. control and expressed in % as 100×(GG2−control)/control (similar for GG4), except for T 50 %abs expressed in min and % change from control.
† Units of RaE, RaT, EGP and RdT are in mg/kg.min of GCR in ml/kg.min. Unit of glucose is mmol/l and insulin is μU/ml. Units of GLP-1 and GIP are pmol/l.
‡ Values indicate outcome where 0 is not contained within the CI.
§ Because EGP was suppressed after the test meals, the area beneath baseline was calculated as dAUC.
Glucose kinetics
The T 50 %abs values did not differ significantly between treatments (Table 2).
Glucose kinetics curves are shown for RaE, RaT, EGP and RdT in Fig. 3(a)–(d), respectively, and for GCR in the online Supplementary Fig. S1. The absolute values and percent difference for GG2 and GG4 v. C are summarised in Table 2. For all parameters, effects for GG4 were generally larger and more sustained than for GG2.
Effects of flatbread consumption with different amounts of guar gum (GG) and legume flour on rate of appearance of exogenous glucose (RaE) (a), rate of appearance of total glucose (RaT) (b), endogenous glucose production (EGP) (c) and rate of disappearance of total glucose (RdT) (d). Values are means with their standard errors represented by vertical bars. ![]() , Control;
, Control; ![]() , 2 % GG;
, 2 % GG; ![]() , 4 % GG.
, 4 % GG.
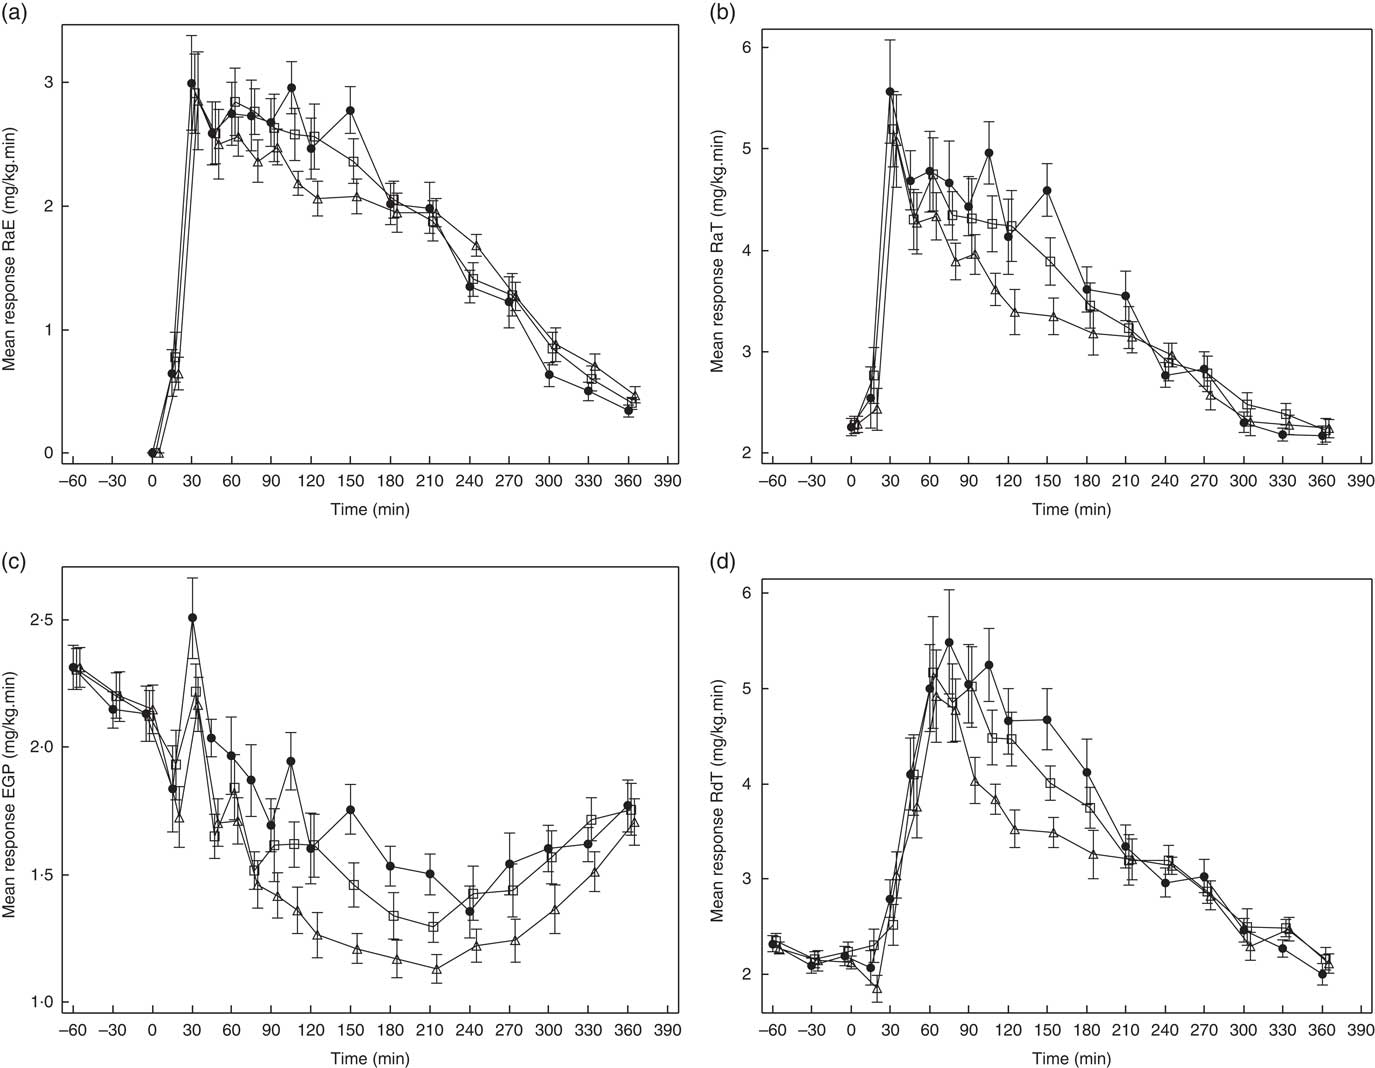
As can be seen in Fig. 3(a), from approximately 60 to 150 min, RaE was generally lower for GG2 and GG4 when compared with C, reflected in a reduction in RaE AUC(t0–t240 min) (Table 2) for both GG treatments v. C, which was significant only for GG4.
After consumption of GG2 and GG4, EGP was more suppressed compared with C (Fig. 3(c)), reflected by a significantly lower AUC(t0–t120 min) for GG2 and GG4, and a significantly lower AUC(t0–t240 min) for GG4.
RdT was similar for all treatments up to approximately 60 min, and from then up to approximately 210 min was lower for GG2 and GG4 relative to C (Fig. 3(d)). This effect was somewhat more pronounced in GG4 than in GG2, resulting in significant differences from control for both GG2 and GG4 in AUC(t0–t120 min) and in AUC(t0–t240 min) only for GG4 (Table 2).
The curves for GCR (online Supplementary Fig. S1) for all meals were similar to those for RdT. For these curves only the AUC(t0–t240 min) for GG4 was significantly different from C (Table 2).
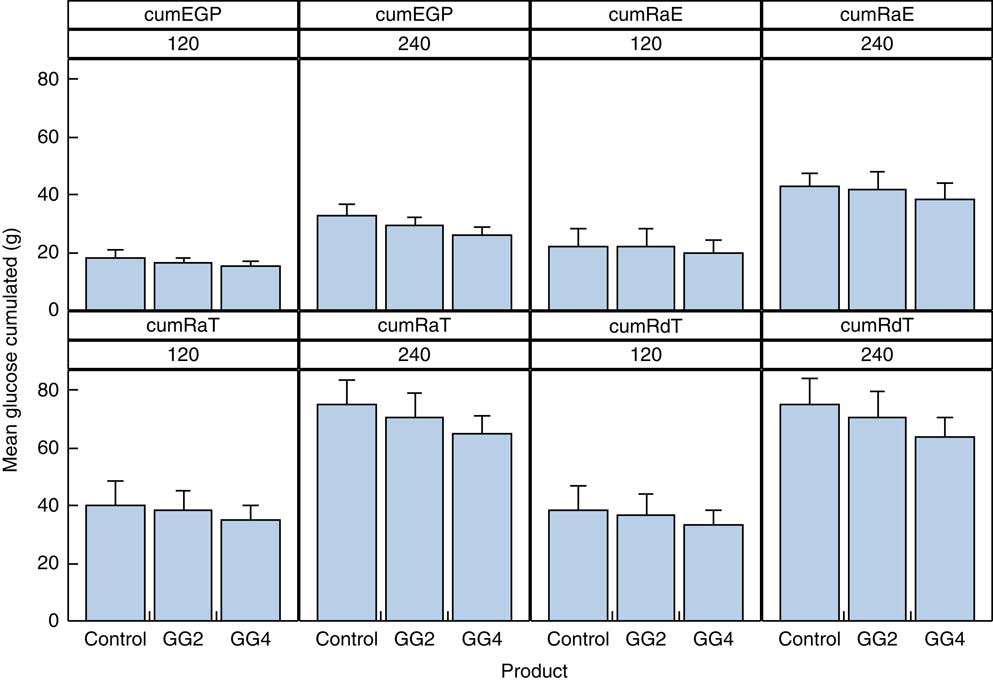
Data for the cumulative exogenous glucose appearance and disappearance can be found in Fig. 4 and the online Supplementary Table S3. The cumulative amount of glucose appearing from exogenous (RaE) and endogenous sources (EGP) for GG4 compared with C was decreased by 2·4 and 2·9 g, respectively, over 2 h, and by 4·3 and 6·4 g, respectively, over 4 h. The RdT over the 2-h period was decreased by 5·0 g for GG4, and by and 11·1 g for GG4 at 4 h, compared with C.
Cumulative appearance of total and exogenous glucose, and glucose from the liver in the peripheral circulation and cumulative disappearance of glucose from the peripheral circulation. Values are means with their standard errors represented by vertical bars. EPG, endogenous glucose production; RaE, rate of appearance of exogenous glucose; RaT, rate of appearance of total glucose; RdT, rate of disappearance of total glucose; GG2, 2 % guar gum; GG4, 4 % guar gum.
Incretin response
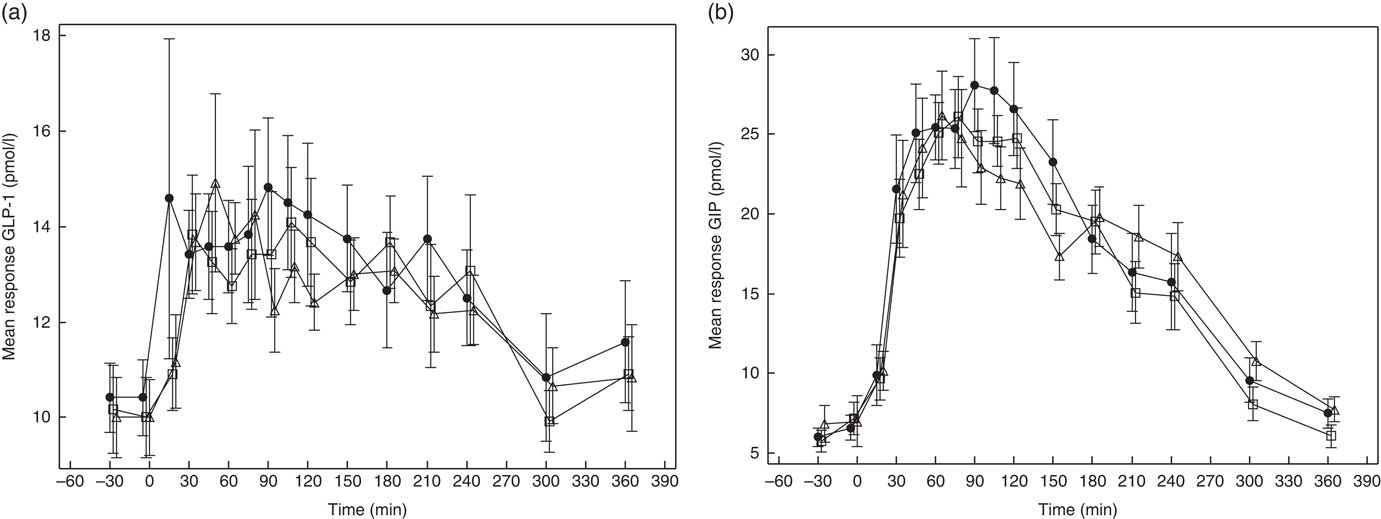
GLP-1 and GIP response curves are shown in Fig. 5(a) and (b), respectively, and the absolute values and percent difference between treatments are summarised in Table 2. Although GLP-1 did not differ among the treatments, the mean AUC(t0–t240 min) for GIP was somewhat lower after GG4 v. C.
Effects of flatbread consumption with different amounts of guar gum (GG) and legume flour on glucagon-like peptide 1 (GLP-1) (a) and glucose-dependent insulinotropic peptide (GIP) (b). Values are means with their standard errors represented by vertical bars. ![]() , Control;
, Control; ![]() , 2 % GG;
, 2 % GG; ![]() , 4 % GG.
, 4 % GG.
Discussion
Using the dual isotope technique, we found that the lower glucose response to flatbreads incorporating soluble fibre mixes was not the result of a reduced absorption rate only, as might be expected for these ingredients, but reflected a greater contribution from post-absorptive effects (RdT and EGP). The data suggest that small initial changes in RaE are part of a wider cascade of metabolic effects including somewhat reduced RdT and substantial reduction in EGP. These data confirm previous observations that changes in the rate of intestinal glucose release from carbohydrate-rich foods and its contribution to the PPG response cannot be assumed from the response profile itself( Reference Eelderink, Moerdijk-Poortvliet and Wang 21 ).
For this study, T 50 %abs was chosen a priori as the primary objective and RaE as the secondary objective. However, it appears that T 50 %abs was less sensitive than RaE as a measure of change in the rate of release of glucose from the test foods, probably because the change in T 50 %abs is based on the difference of two cumulative curves, whereas RaE is measured as percentage change.
An explanation of the modest reductions in RaE observed here may lie in the lower peak values of RaE in C as compared with previous studies. RaE for all treatments was about 3·1 mg/kg.min (range 2·3–3·4 mg/kg.min), whereas Eelderink et al.( Reference Eelderink, Schepers and Preston 23 ) reported peak values of about 3·4 mg/kg.min and 4·3 mg/kg.min for pasta and bread (50 g available carbohydrates), respectively( Reference Eelderink, Schepers and Preston 23 ). In other research, RaE reached values of about 4·3 mg/kg.min after wheat bread( Reference Priebe, Wachters-Hagedoorn and Heimweg 34 ) (50 g available carbohydrates) and of about 7·2 mg/kg.min after a large meal of either polished or parboiled rice (5 g dry mass per kg bw)( Reference Korach-André, Roth and Barnoud 35 ). Interestingly, in another study with a flatbread, RaE reached peak values of 4·0 mg/kg.min( Reference Eelderink, Noort and Sozer 36 ). The low rate of glucose influx from all flatbreads (including C) in the present study may be attributed to the denser and drier structure of the product( Reference Radhika, Sumathi and Ganesan 37 ) whereby soluble fibres and legume flours may make only a modest additional contribution towards further reducing the influx rate.
Most studies assessing glucose kinetics to foods have compared different foods (e.g. pasta v. wheat bread)( Reference Eelderink, Moerdijk-Poortvliet and Wang 21 ), rather than a change in a defined ingredients within the same food format. An exception is the study by Nazare et al.( Reference Nazare, Normand and Triantafyllou 38 ), in which adding 5 g of β-glucan to a polenta meal reduced RaE by 18 % during the first 2 h, after which this phenomenon was reversed. Eelderink et al. ( Reference Eelderink, Moerdijk-Poortvliet and Wang 21 ) observed that RaE over 2 h was about 30 % lower after pasta as compared with wheat bread.
In addition to getting insight into how the combination of GG and legume flour in flatbread could influence the influx of glucose into the circulation, this study was designed to understand the extent to which absorptive processes and metabolic handling play a role in total blood glucose and insulin response. The post-meal glucose and insulin responses in the current study were in line with our previous results( Reference Boers, MacAulay and Murray 15 , Reference Boers, MacAulay and Murray 16 ), which were powered for PPG as a primary outcome. Other studies( Reference Eelderink, Moerdijk-Poortvliet and Wang 21 , Reference Schenk, Davidson and Zderic 39 ) have shown similar PPG responses for different treatments, yet a difference in the RaE, or vice versa. Eelderink et al.( Reference Eelderink, Moerdijk-Poortvliet and Wang 21 ) found that the glycaemic response did not differ between pasta and bread, although the RaE was 30 % lower for pasta compared with bread, and this was compensated by a lower RdT( Reference Eelderink, Schepers and Preston 23 ). In contrast, Schenk et al.( Reference Schenk, Davidson and Zderic 39 ) observed a pronounced difference in PPG response to two breakfasts with a similar RaE. In that study, the difference was explained by a difference in RdT. In the current study, the differences in PPG, especially between GG4 and control, were not only due to a lower RaE but also due to concurrent, larger reductions in EGP and RdT. Nazare et al.( Reference Nazare, Normand and Triantafyllou 38 ) also found that β-glucan added to polenta not only lowered PPG and RaE but also inhibited EGP to a greater extent. Similarly, Péronnet et al.( Reference Péronnet, Meynier and Sauvinet 40 ) found that the exchange of extruded cereals (low slowly digestible starch (SDS) content) for biscuits (high SDS content) slowed down the availability of glucose and RaE, and also reduced RdT, whereas the reduction of EGP was lower( Reference Péronnet, Meynier and Sauvinet 40 ). This shows that both absorptive processes (reflected in RaE) and perhaps even more prominently metabolic handling (reflected in RdT and EGP) can all contribute to the effect of changing carbohydrate type on PPG response. It underscores that the observation of lower glycaemic responses (glycaemic index) cannot be interpreted as indicative of or attributable to significantly reduced rates of release from the food matrix, without additional evidence.
The postprandial increase in RdT was generally reduced by GG2 and GG4 in the current study, which would tend to dampen effects on PPG from their lower RaE. Indeed, it has been shown that a reduced RaE leads to a decreased direct glucose stimulation of the β-cells and to a low GIP response, both contributing to a lower insulin response and resulting in a lower RdT( Reference Proietto, Nankervis and Aitken 41 ). The quantitative cumulative reductions in glucose influx were largely matched by reductions in glucose disappearance (Fig. 3(a)), resulting in little net effect on the overall PPG response. Therefore, the reduction in PPG responses for GG2 and GG4 reflects the additional suppression of EGP. Given that suppression of EGP is an important action of insulin, it is of interest to note that the suppression of EGP by GG4 in particular occurred over a period when insulin levels were also relatively reduced. This apparent paradox was also seen in previous studies by Eelderink et al.( Reference Eelderink, Schepers and Preston 23 ) and Priebe et al.( Reference Priebe, Wachters-Hagedoorn and Heimweg 34 ), in which EGP was more suppressed together with reduced PPI after both pasta compared with wheat bread( Reference Eelderink, Schepers and Preston 23 ) and wheat bread compared with glucose( Reference Priebe, Wachters-Hagedoorn and Heimweg 34 ). In addition, Nazare et al.( Reference Nazare, Normand and Triantafyllou 38 ) found that the addition of β-glucan to a polenta meal resulted in no differences in plasma insulin levels for the 1st hour compared with the polenta meal without β-glucan, together with an enhanced inhibition of EGP. Other mechanisms for suppression of EGP could be involved, such as inhibition of glucagon secretion, decrease in release of NEFA and glycerol from adipose tissue or to a lesser extent gluconeogenic amino acids from skeletal muscles( Reference Cherrington, Moore and Sindelar 42 ); however, all these mechanisms are also influenced by insulin. There might also be a direct effect of plasma glucose concentration suppressing glucose efflux from the liver via the hepatic glucose-sensing system( Reference Oosterveer and Schoonjans 43 ). There might also be a contribution from production of SCFA by small intestinal fermentation of fibres( Reference Pantophlet, Wopereis and Eelderink 44 ), stimulating hepatic AMP-activated protein kinase, which controls liver glucose homoeostasis mainly through the inhibition of gluconeogenic gene expression and hepatic glucose production( Reference Hu, Chen and Xu 45 ). Den Besten et al.( Reference Den Besten, Havinga and Bleeker 46 ) indeed showed in mice that the SCFA uptake fluxes inversely correlated with genes involved in gluconeogenesis. However, studies concerning the relationship between SCFA and liver glucose homoeostasis in humans are lacking( Reference Byrne, Chambers and Morrison 47 ).
To obtain more information about possible underlying mechanisms, we also measured the hormones GIP and GLP-1. These hormones have been shown to affect insulin production and hepatic glucose production (via glucagon) and could therefore indirectly influence glucose kinetics( Reference Seino, Fukushima and Yabe 48 , Reference Jin and Weng 49 ). In addition, GLP-1 has been shown to delay gastric emptying, which also influences PPG response( Reference Horowitz, Edelbroek and Wishart 50 , Reference Marathe, Rayner and Jones 51 ). We did not see any effect on GLP-1 in this study, and a small effect on GIP only for GG4. The negligible effect on GLP-1 suggests that delivery of glucose to the GLP-1-producing cells (L-cells) in the distal part of the small intestine or colon was similar for all treatments. A recent review has concluded that fibres in general do not increase GLP-1 concentrations compared with control in the acute intake situation( Reference Klosterbuer, Greaves and Slavin 52 ) and possibly longer-term consumption of particular fermentable fibres (e.g. fructo-oligosaccharide) is needed to increase GLP-1 secretion( Reference Cani, Lecourt and Dewulf 53 ). The lower GIP is likely explained by the slower digestion rate of the flatbreads with the fibre/flour mix, as reflected by the lower RaE, and as such slower delivery to GIP-producing K-cells in the duodenum and jejunum( Reference Pilichiewicz, Chaikomin and Brennan 54 – Reference Trahair, Horowitz and Rayner 56 ). In other studies comparing slowly and rapidly absorbed carbohydrates, there was a strong correlation shown between GIP and RaE( Reference Eelderink, Schepers and Preston 23 , Reference Eelderink, Noort and Sozer 36 , Reference Péronnet, Meynier and Sauvinet 40 , Reference Wachters-Hagedoorn, Priebe and Heimweg 57 ).
Lowering insulin and GIP are generally seen as beneficial physiological effects. In the longer term, regular consumption of diets with a low PPI response is supposed to improve pancreatic β-cell function owing to the lower strain on the β-cells, especially in individuals with impaired first-phase insulin secretion( Reference Laaksonen, Toppinen and Juntunen 58 ). A lower GIP response may prevent an unhealthy fat distribution independent of insulin( Reference Moeller, Vistisen and Færch 59 ).
A limitation of the present study is that the amount of carbohydrates differed slightly between treatments; however, these small differences would not realistically explain the differences in postprandial glucose, insulin and the different fluxes( Reference Brouns, Bjorck and Frayn 60 ). Furthermore, the amount of carbohydrates was very similar for GG2 and GG4, yet GG4 was much more effective. Another limitation is the number of subjects, which is underpowered for statistical comparison of PPG, but considered sufficient for estimating flux parameters( Reference Brouns, Bjorck and Frayn 60 ). While the dual tracer method is suitable for measuring the different glucose fluxes, it is suggested that a triple tracer methodology can provide a more accurate assessment of the EGP, RaE and glucose disposal following ingestion of a carbohydrate-containing meal( Reference Rizza, Toffolo and Cobelli 61 ). A study assessing the accuracy of both techniques conformed that the triple tracer technique tends to slightly outperform the dual tracer technique, but the latter benefits from reduced experimental and computational complexity( Reference Haidar, Elleri and Allen 62 ).
The main conclusion of this work is that incorporating GG and CPF in flatbread only slightly reduced the influx of glucose, but more substantially affected postprandial disposal, as well as hepatic glucose production, in healthy subjects. Future research could test other putative ‘slow-release’ carbohydrates for their effects on RaE and other flux parameters. At present, these studies are also quite resource-intense, especially if they require growing 13C-labelled substrates, and the future development of alternative methods that do not require this would be advantageous. Another important research question is how these flux parameters differ in individuals with (pre-) diabetes, and also whether effects on the different flux parameters contribute to explaining the associations of different dietary patterns with disease risk. Last, glucagon should also be measured in future flux studies, because the ratio between levels of insulin and glucagon determines EGP and RdT( Reference Kalra and Gupta 63 ).
Acknowledgements
The authors are grateful to Quality Performance Service, Groningen (The Netherlands), for executing the clinical study. We are also grateful to Jeroen Sterken, Anton Porcu (Unilever Clinicals Vlaardingen), for facilitating the clinical study, to Ramitha K., Suman Majumder and Chandrika Mohanan and her design team at Unilever Bangalore for providing the flours and to Jack Seijen ten Hoorn for formulating the different flatbreads. The authors thank Pieter van der Pijl (Unilever Research & Development Vlaardingen) for his help in adapting the glucose kinetic calculations for this particular food format. The authors thank Ton Gorissen, Isolife (Wageningen, The Netherlands), for providing 13C-enriched wheat kernels.
This research was funded by Unilever.
H. M. B., M. G. P. and H. P. F. P. designed the research; M. G. P. and A.-R. H. facilitated execution of the study; T. H. v. D. executed the calculation of the glucose kinetics. H. H. performed statistical analysis. H. M. B. wrote the manuscript with significant contributions from D. J. M., M. G. P., T. H. v. D. H. H., H. P. F. P., A.-R. H. and R. J. V. H. M. B., M. G. P., R. J. V. and D. J. M. had primary responsibility for final content. All authors read and approved the final manuscript.
H. M. B., H. H., A.-R. H., D. J. M. and H. P. F. P. are employees of Unilever, which manufactures and markets consumer food products, including the flour used for the flatbreads in this study.
Supplementary material
For supplementary material/s referred to in this article, please visit https://doi.org/10.1017/S0007114517002781


