


TNF-α is a multi-functional cytokine involved in inflammation and immune response, and in cellular communication, differentiation and death( Reference Brenner, Blaser and Mak 1 ). Although a fundamental part of the immunological response, TNF-α also has an important role in the context of metabolic diseases, as this cytokine impairs insulin signalling( Reference Arner 2 ), promotes lipolysis( Reference Grant and Stephens 3 ) and inhibits differentiation and lipogenesis in adipocytes( Reference Cawthorn and Sethi 4 ). It is strictly associated with metabolic diseases like obesity, type 2 diabetes (T2D), CVD, non-alcoholic fatty liver disease (NAFLD), atherosclerosis and the metabolic syndrome (MetS)( Reference Lumeng and Saltiel 5 , Reference Esser, Legrand-Poels and Piette 6 ), a condition known as chronic low-grade inflammation.
Along with TNF-α, others inflammatory biomarkers are also related with chronic diseases. In obesity, for example, overload adipocytes and infiltrated macrophages secrete soluble monocyte chemoattractant protein 1 (sMCP-1) and cytokines such as TNF-α, IL-1β, IL-6 and IL-8( Reference Lafontan 7 ), affecting others tissues such as the pancreas, liver, heart, skeletal muscle and brain, and disrupting the metabolic homoeostasis( Reference Saltiel and Olefsky 8 ). Increasing IL-6 levels induce C-reactive protein (CRP) production in liver, a risk marker for CVD. In this context, intercellular adhesion molecule 1 (ICAM-1), which participates in monocyte adhesion straightening, spreading and transendothelial migration, and vascular cell adhesion molecule 1 (VCAM-1), responsible for the slow rolling of monocytes and participates in the initial steps of recruitment to atherosclerotic lesions( Reference Mestas and Ley 9 ), are markers of endothelial dysfunction( Reference Salazar, Martinez and Chavez 10 ). IL-12 is released by monocytes, macrophages, dendritic cells and natural killers and influences the development of T helper 1 cells with proinflammatory and proatherogenic roles( Reference Galkina and Ley 11 ). On the other hand, IL-10 as well as adiponectin have anti-inflammatory effects, with improvement in insulin sensitivity and with anti-atherogenic roles( Reference Osborn and Olefsky 12 – Reference Cheng, An and Jiang 14 ).
Dietary fatty acids (FA) can modulate inflammation, depending on their chemical structure and classifications. SFA have been shown to activate inflammatory pathways( Reference Santos, Oliveira and Lopes 15 , Reference Santos, Oliveira and Casal 16 ) and increase T2D risk( Reference Forouhi, Koulman and Sharp 17 ). For example, lauric acid (C12 : 0) readily activates Toll-like receptor-4, triggering the inflammatory response via NF-κB and increasing the expression of inflammatory biomarkers in target genes( Reference Rocha, Caldas and Oliveira 18 ). Regarding unsaturated FA, the intake of dietary MUFA is associated with reduction in all-cause mortality, cardiovascular mortality and CVD( Reference Schwingshackl, Hoffmann and Schwingshackl 19 ), and with decreased T2D and CVD risks( Reference Schwingshackl, Strasser and Hoffmann 20 – Reference Schwingshackl and Strasser 22 ), although the protective effects of MUFA remain controversial( Reference Schwingshackl and Strasser 22 , Reference Cho, Baek and Kim 23 ). PUFA have been extensively studied, in particular n-3 PUFA, with beneficial effects on inflammation( Reference Flachs, Rossmeisl and Bryhn 24 , Reference Wang and Huang 25 ) and in several chronic diseases( Reference Sanders 26 – Reference Endo and Arita 28 ). It should be noted that meta-analysis has shown the effects of n-3 PUFA on metabolic diseases. The effects on overweight and obesity were observed with supplementation of n-3 PUFA with significant reduction in waist circumference isolated( Reference Zhang, Liu and Zhao 29 ) and when is combined with life-style intervention( Reference Du, Jin and Fang 30 ) compared with placebo. Replacement of dietary total SFA or total carbohydrate with total PUFA had improvements in fasting glucose levels, glycosylated Hb, homeostasis model assessment for insulin resistance (HOMA-IR) and acute insulin response( Reference Imamura, Micha and Wu 31 ). Elevated blood pressure (BP)( Reference Yang, Shi and Li 32 ), heart failure( Reference Wang, Xiong and Huang 33 ), NAFLD( Reference He, Wu and Chen 34 ) and T2D( Reference Zhang, Picard-Deland and Marette 35 ) also can benefit from marine n-3 PUFA.
SNP at inflammatory biomarker genes have been associated with plasma inflammatory biomarker levels and with chronic inflammatory diseases. For TNF-α SNP, -308A, -238A, -857T and -1031C allele carriers are associated with higher TNF-α production( Reference Kamizono, Yamada and Kimura 36 – Reference Nascimento, Vieira and Coimbra 40 ). In addition, these SNP are associated with several diseases such as CHD( Reference Hernández-Díaz, Tovilla-Zárate and Juárez-Rojop 41 , Reference Asifa, Liaquat and Murtaza 42 ), ischaemic stroke (IS)( Reference Kumar, Misra and Kumar 43 ), obesity( Reference Sookoian, González and Pirola 44 – Reference Yu, Ha and Park 46 ), T2D and insulin resistance (IR)( Reference Valenti, Fracanzani and Dongiovanni 47 ) and NAFLD( Reference Valenti, Fracanzani and Dongiovanni 47 , Reference Tokushige, Takakura and Tsuchiya-Matsushita 48 ).
Although FA and SNP are associated with inflammation, the interaction among them can modify outcome. This approach is of interest in nutrigenetics studies. As an example, the study of De Luis et al.( Reference De Luis, Aller and Izaola 49 ) found different metabolic responses to 3-month-hypoenergetic diets in obese subjects with the TNF-α -308GG genotype compared with -308A allele-carrying obese subjects, where GG homozygous individuals had better metabolic response, with decrease in weight, BMI, free fatty mass, BP, insulin and leptin concentrations.
Given that both FA and TNF-α polymorphisms can influence inflammation and chronic diseases, and that SNP and FA can interact among them, the aim of the present study was to investigate the relationship of TNF-α -238G/A, -308G/A, -857C/T and -1031T/C polymorphisms with inflammatory biomarkers and plasma FA, and the interaction among them in a population-based, cross-sectional study conducted in São Paulo, Brazil.
Methods
Subject population
Data were derived from the population-based survey Health Survey-São Paulo (HS-SP), a cross-sectional study of health and living conditions among a representative sample of individuals living in São Paulo, southeastern Brazil, for which data collection took place between 2008 and 2011 and has been described elsewhere( Reference Selem, Carvalho and Verly-Junior 50 , Reference Verly-Jr, Steluti and Fisberg 51 ). This secondary study followed the sample size of the original study that defined eight study domains as follows: <1-year old (both sexes); 1–11 years old (both sexes); and three more age groups for each sex, females and males aged 12–19 years (adolescents), 20–59 years (adults) and 60 years or over (elderly adults). A minimum sample size of 300 in each of the eight study domains was estimated to be needed based on a prevalence of 0·5 with a se of 0·07 at a 5 % significance level and a design effect of 1·5( Reference Selem, Carvalho and Verly-Junior 50 , Reference Verly-Jr, Steluti and Fisberg 51 ).
For the present study, all individuals from whom a blood sample was collected who were aged >19 years and <60 years (301) at the time of blood collection were considered. Individuals in use of anti-inflammatory medication, fat absorption inhibitors or antiretroviral therapy were excluded from the study (n 20).
The study protocol (protocol no. 2001) was reviewed and approved by the Research Ethics Committee of the School of Public Health, University of São Paulo. All participants signed the informed consent form.
Data collect ion and processing
Information related to food intake, demographics, socioeconomic status and anthropometric and BP measurements was obtained using structured questionnaires. Additional questions on smoking habits and alcohol consumption were used to classify respondents as current smokers or non-smokers and drinkers or non-drinkers of alcohol. The International Physical Activity Questionnaire – long form was applied to collect data on physical activity and calculate the metabolic equivalent task (MET) min/week (MET-min/week), allowing classification of level of physical activity as low (<6000 MET-min/week), moderate (≥6000 and <3000 MET-min/week), or high (≥3000 MET-min/week). Anthropometric measurements for weight, height, waist circumference and BP were collected using standardised protocols. Weight was measured with automatic scales and waist circumference was measured at the midpoint between the iliac crest and rib cage. Height was measured using a fixed stadiometer, with head, shoulders, buttocks and heels pressed back against the wall. BMI was calculated as weight (kg)/height2 (m). BP was determined as the mean of two consecutive measurements, on the right arm, taken with an automatic device (Omron model HEM-712C; Omron Health Care).
Biochemical measurements
Blood samples were obtained by peripheral venepuncture after 12 h of overnight fasting and then centrifuged, aliquoted and stored in a freezer at −80 °C until analysis. Plasma high-sensitivity CRP levels were measured by kinetic turbidimetry using the IMMAGE® immunochemistry system kit (Beckman Coulter Inc.). Plasma IL-1β, IL-6, IL-8, IL-10, TNF-α, IL-12p70, adiponectin, sMCP-1, soluble ICAM-1 (sICAM-1) and soluble vascular cell adhesion molecule 1 (sVCAM-1) levels were measured using a Multiplex immunoassay (Milliplex; Merck Millipore). Assays were completed in duplicate according to manufacturer’s instructions (IL-1β CV 6·37 %, IL-6 CV 4·65 %, IL-8 CV 1·62 %, IL-10 CV 6·06 %, TNF-α CV 4·61 %, IL-12p70 CV 4·47 %, sICAM-1 CV 8·65 %, sVCAM-1 CV 5·27 %, monocyte chemoattractant protein 1 (MCP-1) CV 8·97 %, adiponectin CV 4·86 %). Plasma TAG, total cholesterol (TC), HDL-cholesterol and LDL-cholesterol levels were measured on a Roche Modular Auto Analyzer using an enzymatic colorimetric assay (Roche Diagnostics GmbH).
Plasma fatty acid determination
Total plasma lipids were extracted by a mixture of methanol–chloroform chromatographic solution (2:1, v/v) and FA were converted to FA methyl esters using a modified sodium methoxide method( Reference Huang, Wang and Crenshaw 52 ). Subsequently, the FA profile was measured using flame-ionization GC on a device (CG-2010; Shimadzu) equipped with a DB-FFAP capillary column (15 m×0·100 mm×0·10 µm; J&W Scientific from Agilent Technologies). Individual peaks were quantified as the area under the peak and results expressed as percentages of the total area of all FA peaks. The inter-assay CV was 8·81 %.
A total of twelve FA were identified and summarised under six groups as follows: SFA (myristic acid, C14 : 0+palmitic acid, C16 : 0+stearic acid, C18 : 0), MUFA (palmitoleic acid, C16 : 1n-7+oleic acid, C18 : 1n-9), total PUFA (n-6 PUFA+n-3 PUFA), n-6 PUFA (linoleic acid, 18 : 2n-6+dihomo-γ-linoleic acid, 20 : 3n-6+arachidonic acid, 20 : 4n-6), n-3 PUFA (α-linolenic acid (ALA), 18 : 3n-3+n-3 HUFA), n-6 PUFA:n-3 PUFA ratio and n-3 highly unsaturated fatty acid (HUFA) (EPA, 20 : 5n-3+DPA, 22 : 5n-3+DHA, 22 : 6n-3). Desaturase activities were also estimated using product:precursor ratios of individual plasma FA according to the following: stearoyl-CoA desaturase (SCD) activity index (SCD-16, 16 : 1n-7/16 : 0 or SCD-18, 18 : 1n-9/18 : 0); Δ-5-desaturase (D5D), 20 : 4n-6/20 : 3n-6 and Δ-6-desaturase, 20 : 3n-6/18 : 2n-6.
DNA extraction and genotyping
DNA extraction was conducted on frozen blood samples using the salting out method described elsewhere( Reference Miller, Dykes and Polesky 53 ). DNA integrity was observed using a 1 % agarose gel whereas DNA concentration was measured using a Nanodrop 8000 spectrophotometer (Thermo Scientific). The genotyping of TNF-α gene polymorphisms was performed by the TaqMan Open Array (Applied Biosystems), according to the manufacturer’s instructions. The analysed SNP were: -238G/A (rs361525; C___2215707_10), -308G/A (rs1800629; C___7514879_10), -857C/T (rs1799724; C__11918223_10) and -1031T/C (rs1799964; C___7514871_10). The real-time PCR was conducted on an OpenArray NT Cycler (BioTrove Inc.) in the following conditions: 95°C for 10 min and forty cycles of 95°C for 15 s and 60°C for 1 min. Genotype success rates ranged from 98·0 to 100·0 %, and genotyping accuracy was 97 %, obtained by randomly regenotyping 20 % of selected samples, from two to four times each.
Statistical analysis
The χ 2 test with continuity correction was used to determine whether genotype frequencies followed the Hardy–Weinberg (HW) equilibrium and pairwise linkage disequilibrium was performed using Haploview software version 4.2 (Broad Institute). Individuals with inflammatory biomarkers above the 99th percentile of distribution were considered outliers and excluded from the study. A natural logarithmic transformation was applied for plasma FA myristic acid, MUFA, palmitoleic acid, oleic acid, n-3 PUFA, ALA, EPA, DPA, DHA, n-3 HUFA, CRP, IL-6, IL-8, IL-12, adiponectin, IL-1β, BMI and TAG levels to normalise the distribution of data. Continuous variables with normal distribution were expressed as mean and standard deviation else as median and interquartile range. Categorical variables were expressed as absolute frequency and percentage. The recessive genotype was pooled with heterozygotes due to sample size and all analyses were tested with the dominant model. Crude data were compared by applying Student’s t test whereas the χ 2 test was applied for categorical variables. Differences between FA profile and inflammatory biomarkers by SNP genotypes were tested by multiple regression adjusted for confounding variables. To test interaction between TNF-α SNP and FA (as continuous variable), a multivariate cluster analysis was used to identify inflammatory patterns and then used as a dependent variable. K-means was performed on the normalised data and used to group individuals according to eleven plasma inflammatory biomarker levels. Distances were sorted and observations taken at constant intervals. Patients were separated into two groups based on their similarities, representing inflammatory (INF) and non-inflammatory (NINF) levels of inflammation. Multiple logistic regression was used to test the interaction, adjusted for the variables age and smoking habits.
All tests were considered significant when P<0·05 and performed using Stata version 13.1 (StataCorp LP) and Statistica version 9.0 (StatSoft, Inc.).
Results
Frequencies of the TNF-α genotypes for the total population (n 301) are shown in Table 1. All genotypes were in HW equilibrium and none were in linkage disequilibrium (r 2<0·19).
Frequency of TNF-α SNP alleles and genotypes (Numbers and percentages)
Anthropometric, clinical and biochemical parameters by TNF-α SNP genotype are shown in Table 2. On the adjusted multiple linear regression model, plasma IL-12 levels were lower (P=0·001) and plasma sVCAM-1 levels higher (P=0·031) in carriers of the -857T allele. Carriers of the TC+CC genotype for TNF-α -1031T/C SNP had higher BMI (P=0·015) than CC genotype individuals, and -308A allele carriers had higher plasma CRP levels (P=0·042). TNF-α -238A allele carriers had higher plasma TNF-α (P=0·033), IL-6 (P=0·013), IL-1β (P=0·037), IL-10 (P=0·010) and IL-12 (P=0·048) levels than GG homozygous individuals.
Clinical, biochemical and life-style characteristics of subjects by TNF-α genotype (Mean values with their standard errors; numbers and percentages)
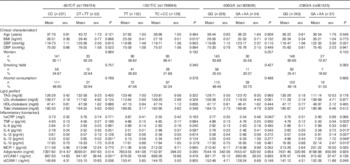
SBP, systolic blood pressure; DBP, diastolic blood pressure; hsCRP, high-sensitivity C-reactive protein; MCP-1, monocyte chemoattractant protein 1; sVCAM-1, soluble vascular cell adhesion molecule 1; sICAM-1, soluble intercellular adhesion molecule 1.* P<0·05.
† P values for clinical characteristics and lipid profile variables were obtained using Student´s t test for continuous variables and χ 2 test for categorical variables. To convert TAG to mmol/l, multiply by 0·0113; to convert cholesterol to mmol/l, multiply by 0·0259.
‡ P values for inflammatory biomarkers were obtained using multiple linear regression adjusted for age, BMI, sex, smoking, alcohol consumption and metabolic equivalent task categories.
Statistically higher plasma levels of stearic acid were found for TNF-α -1031 C carriers compared with TT homozygous subjects (Table 3; P=0·038), on the adjusted multiple regression model. Carriers of TNF-α -308A allele had statistically lower levels of total MUFA (P=0·014), palmitoleic acid (P=0·009), oleic acid (P=0·039), SCD-16 (P=0·007) and SCD-18 (P=0·020) and higher levels of PUFA (P=0·046) and DHA (P=0·044).
Plasma fatty acid (%) by TNF-α genotypeFootnote † (Mean values with their standard errors)
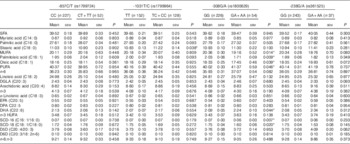
DGLA, dihomo-γ-linoleic acid; HUFA, highly unsaturated fatty acids; SCD, stearoyl-CoA desaturase; D6D, Δ-6-desaturase; D5D, Δ-5-desaturase.
* Statistically significant: P<0·05.
† P values were obtained using multiple linear regression adjusted for TAG, BMI, age, sex, alcohol consumption, smoking and metabolic equivalent task categories.
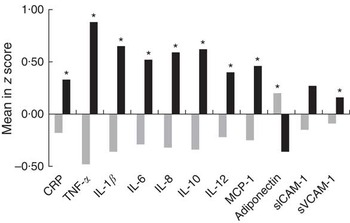
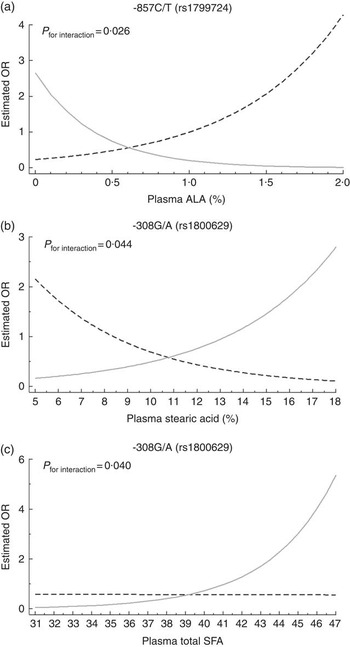
Multivariate cluster analysis allowed stratification of individuals into two groups based on similarities and differences in inflammatory biomarkers (Fig. 1). Plasma CRP, TNF-α, IL-1β, IL-6, IL-8, IL-10, IL-12, MCP-1, adiponectin and sVCAM-1 levels were higher in the INF group, clearly representing individuals with a proinflammatory profile. Differences between INF groups for clinical, biochemical and FA profile characteristics have been published elsewhere( Reference Oki, Norde and Carioca 54 ). In brief, the INF group had the MetS feature (higher age, waist circumference, systolic and diastolic arterial pressure, and TAG) and higher levels of plasma palmitic acid, estimated SCD-18 activity and lower levels of total PUFA, ALA, arachidonic acid and D5D. No associations were observed between clusters and TNF-α genotype (data not shown; χ 2>0·05). Multiple logistic analysis to test TNF-α SNP-FA interactions (Fig. 2) revealed that TNF-α -857 C/T interacted with ALA (P=0·026). On the analysis stratified by genotype, T allele individuals had increasing OR at each plasma ALA level (OR 4·29; 95 % CI 1·25, 14·78). Interactions were also observed between TNF-α -308 G/A and stearic acid (P=0·046) where GG genotype carriers had decreasing OR at each stearic acid level (OR 0·80; 95 % CI 0·66, 0·98), and also between TNF-α -308 G/A and total SFA (P=0·041) with A allele carriers having increased OR at each plasma total SFA level (OR 1·32; 95 % CI 1·02, 1·71).
Differences in plasma inflammatory biomarker concentrations between inflammatory groups. Values are means standardised by z score. Comparison of means was carried out using Student’s t test. CRP, C-reactive protein; MCP-1, monocyte chemoattractant protein 1; sICAM-1, soluble intercellular adhesion molecule 1; sVCAM-1, soluble vascular cell adhesion molecule 1; ![]() , non-inflammatory group;
, non-inflammatory group; ![]() , inflammatory group. * P<0·05 was considered statistically significant.
, inflammatory group. * P<0·05 was considered statistically significant.
Interactions between polymorphisms of the TNF-α gene and plasma fatty acids belonging to inflammatory group. Multiple logistic analysis adjusted for age and smoking habits was performed. Curves depict the OR of belonging to inflammatory group for each genotype at different plasma fatty acid levels. (a) Interaction between rs1799724 genotypes and plasma α-linolenic acid (ALA), (b) interaction between rs1800629 and plasma stearic acid and (c) interaction between rs1800629 and plasma total SFA. a: ![]() , CC (n 227);
, CC (n 227); ![]() , CT+TT (n 52); b and c:
, CT+TT (n 52); b and c: ![]() , GG (n 243);
, GG (n 243); ![]() , GA+AA (n 37).
, GA+AA (n 37).
Discussion
We investigated four TNF-α polymorphisms in association with inflammatory biomarkers, plasma FA and the interaction between TNF-α SNP and plasma FA on inflammatory profile. As chronic diseases are associated with inflammatory response, a multivariate cluster analysis was performed with eleven inflammatory biomarkers to stratify individuals into two groups (INF and NINF), using this classification as the outcome of the interaction analysis between TNF-α SNP and FA profile. The INF group showed the MetS features consistent with low-grade chronic-inflammatory status( Reference Welty, Alfaddagh and Elajami 55 ).
TNF-α -857T allele carriers had lower plasma IL-12 and higher sVCAM-1 compared with the CC genotype. The -857T allele has previously been associated with transcriptional activation in the RAW264.7 cell line in response to lipopolysaccharide stimulation( Reference Lv, Chen and Cai 56 ) and with higher TNF-α mRNA expression and protein level( Reference Kimura, Takayanagi and Yokoyama 39 ) than the major -857C allele. In the present study, T allele carriage was not associated with TNF-α, but carriers had lower IL-12, a proinflammatory cytokine involved in innate and adaptive immune responses( Reference Trinchieri 57 ). It should be noted that TNF-α suppresses IL-12p70 production in both murine and human macrophages( Reference Hodge-Dufour, Marino and Horton 58 , Reference Ma, Sun and Papasavvas 59 ), and in the present study, T allele carriers had lower plasma IL-12 level, reflecting a possible mechanism involving TNF-α -857 SNP. VCAM-1 is an adhesion molecule expressed in large and small blood vessels that facilitates the transmigration of leucocytes( Reference Stoner, Lucero and Palmer 60 ). Some studies suggest an association between the minor allele of --857C/T and CVD( Reference Hernández-Díaz, Tovilla-Zárate and Juárez-Rojop 41 , Reference Asifa, Liaquat and Murtaza 42 ). TNF-α --857C/T and sVCAM-1 might be involved in this context, but further studies are required to confirm this relationship.
Besides the association with inflammatory biomarkers, TNF-α -857 C/T also interacted with ALA, where T allele carriers had a decreasing OR of belonging to the INF group with increasing ALA levels. The interaction with this FA is of particular interest because ALA is an essential FA derived from the diet( Reference Welch, Shakya-Shrestha and Lentjes 61 ), and therefore the endogenous biomarker may represents dietary intake of ALA. In nineteen global consortium studies, plasma and phospholipid ALA was associated with lower risk of fatal CHD( Reference Del Gobbo, Imamura and Aslibekyan 62 ), although some investigations failed to find an association between plasma ALA levels and coronary disease outcomes( Reference Chowdhury, Warnakula and Kunutsor 63 ). In other studies on dietary ALA, this FA was associated with lower risk of total and non-cardiovascular mortality in older adults( Reference Fretts, Mozaffarian and Siscovick 64 ) and of CHD( Reference Pan, Chen and Chowdhury 65 ). Despite these contradictory results, in the present study plasma ALA was associated with decreased odds of having a more proinflammatory profile in -857T allele carriers, suggesting that higher consumption of ALA could be protective for these individuals.
TNF-α -238A allele carriers had higher IL-1β, IL-6, TNF-α, IL-12 and IL-10, when compared with -238G allele carriers. Both alleles have been reported with different outcomes. The -238G allele was associated with higher mRNA and soluble TNF-α in knee osteoarthritis patients( Reference Muñoz-Valle, Oregón-Romero and Rangel-Villalobos 66 ), and with overweight/obesity in a Korean population( Reference Yu, Ha and Park 46 ), whereas -238A allele carriage was associated with higher production of TNF-α in peripheral blood mononuclear cells( Reference Silkov, Sennikova and Goreva 38 ) and with subjects that had NAFLD( Reference Wang, Feng and Li 67 ). In a study involving 8 h metabolic profile tests after the consumption of mixed meals, -238A allele subjects had increased free fatty acids (FFA) compared with individuals with the GG genotype( Reference Fontaine-Bisson, Wolever and Chiasson 68 ). From meta-analysis investigating the association between -238G/A and vascular diseases, heterozygous (AG) and AA+AG genotypes were associated with, respectively, elevated risk of IS in Asian adults( Reference Hong, Chao and Yuan 69 ) and in Caucasians compared with Asians studies( Reference Kumar, Misra and Kumar 43 ). No associations were observed with coronary artery disease risk( Reference Hua, Zhang and Kwong 70 ) and with CHD( Reference Pulido-Gómez, Hernández-Díaz and Tovilla-Zárate 71 ). Although most of the inflammatory biomarkers increased in the A allele are related to atherosclerosis( Reference Tousoulis, Oikonomou and Economou 13 ), blood lipids, another cardiovascular risk factors, not differed between genotypes.
In the present study, -238A allele carriers had a more proinflammatory profile than subjects with the GG genotype, but IL-10 was also higher in -238A subjects. IL-10, an anti-inflammatory cytokine, is commonly decreased in metabolic diseases( Reference Chang, Chang and Chien 72 ). Nehete et al.( Reference Nehete, Magden and Nehete 73 ) found elevated plasma inflammatory biomarkers, such as IFN-γ, IL-6, IL-12p40, TNF, sCD40L and IL-β, but also higher anti-inflammatory IL-4, IL-10, IL-13 and IL-RA in overweight and obese chimpanzees. Esposito et al.( Reference Esposito, Pontillo and Giugliano 74 ) also found higher circulating levels of IL-6, CRP and IL-10 in obese women, and speculated that elevated IL-10 attempt to inhibit continued proinflammatory cytokine. Based on the results of the present study, -238G/A may also play a role in increasing IL-10 against proinflammatory cytokines.
In the present study, we observed that carriers of the -308A allele had higher CRP levels than individuals with the GG genotype. This is in accordance with a study of asymptomatic Brazilian individuals showing significant association with CRP levels particularly in individuals >48y( Reference Araújo, Pereira and Mota 75 ). Although TNF-α level did not differ between genotypes, A allele carriers were reported to exhibit higher levels of plasma TNF-α ( Reference Louis, Franchimont and Piron 37 , Reference Silkov, Sennikova and Goreva 38 , Reference Nascimento, Vieira and Coimbra 40 ), obesity and comorbidities( Reference Sookoian, González and Pirola 44 , Reference Fontaine-Bisson, Wolever and Chiasson 68 , Reference Wen, Wang and Zhang 76 ).
TNF-α, in addition to its key role in inflammation, performs an important function in lipid metabolism regulation. TNF-α stimulates de novo lipogenesis (DNL), lipolysis, regulates cholesterol metabolism and adipokine synthesis, suppresses FFA uptake, and inhibits some lipid-metabolism-related enzyme activity( Reference Chen, Xun and Chen 77 ). Consequently, polymorphism of the TNF-α gene could alter circulating FA levels. Except for the higher level of stearic acid in C allele carriers of TNF-α -1031T/C, most of the plasma FA differences were found in TNF-α -308 G/A. Interestingly, -308GG genotype carriers had lower levels of the MUFA family and its related enzymes, whereas -308A allele carriers had a higher level of the PUFA family. SCD-16 and SCD-18 are related to the SCD-1 enzyme that converts FA derived from DNL, such as palmitic and stearic acid, into palmitoleic acid and oleic acid, respectively( Reference Hodson and Fielding 78 ). Circulating palmitoleic acid is obtained mainly by SCD-1 conversion, because food rich in palmitoleic acid is typically not consumed in Western diets, whereas oleic acid is obtained both endogenously and from the diet( Reference Hodson and Karpe 79 ). Lower levels of palmitoleic and oleic acids in -308A allele subjects is due, in part, to the decreased activity of estimated SCD-16 and SCD-18, respectively. Elevated activity of SCD-1 is associated with cancer, IR, atherosclerosis and obesity( Reference Liu, Strable and Ntambi 80 , Reference Li, Brennan and McNulty 81 ), whereas palmitoleic acid is associated with CRP, the MetS, impaired fasting glucose( Reference Cho, Baek and Kim 23 ), and some studies show that oleic acid has beneficial effects( Reference Schwingshackl, Hoffmann and Schwingshackl 19 ).
In addition, -308A allele carriers had higher PUFA and DHA levels than GG homozygous subjects. DHA is a precursor of D’ series resolvins, protectins and maresins, which promote inflammation resolution, and are associated with protection against ischaemia/perfusion injury, atherosclerosis, insulin sensitivity and hepatic steatosis in vivo and in vitro ( Reference Endo and Arita 28 , Reference Serhan and Petasis 82 ). DHA was able to reduce circulating inflammatory biomarker in humans, but not all studies reported the same results, probably due to low dose or short duration of studies( Reference Kelley and Adkins 83 ). In line with these results, -308A allele carriers also had lower levels of CRP, a marker of CVD risk, and had no associations with blood lipids. With regard to total PUFA, reports have shown that replacing SFA with PUFA has benefits for CVD( Reference Mozaffarian, Micha and Wallace 84 – Reference Farvid, Ding and Pan 86 ), and the supplementation of PUFA, particularly n-3 PUFA, has beneficial effects in decreasing CRP levels, as observed in meta-analysis from randomised controlled trials( Reference Li, Huang and Zheng 87 , Reference Lin, Shi and Li 88 ). Thus, the -308A allele presented a more beneficial profile than the GG genotype.
We also observed an interaction of TNF-α -308 G/A with stearic acid and with total SFA. In both cases, -308A allele carriers were associated with an increased OR of belonging to the INF group with increasing plasma stearic acid and SFA levels. Stearic acid can be obtained from the diet but is also synthesised endogenously by DNL( Reference Wenjie, Wu and Wang 89 ). High intake of alcohol and carbohydrates, especially fructose and simple carbohydrates, can induce DNL and its products( Reference Ameer, Scandiuzzi and Hasnain 90 , Reference Zong, Zhu and Sun 91 ). In a large prospective cohort, stearic acid was associated with BMI, waist circumference, TAG and HOMA-IR at baseline and also with diabetes risk in prospective association( Reference Wenjie, Wu and Wang 89 ). The association of SFA intake with CVD has been questioned because in a recent meta-analysis SFA were not associated with cardiovascular outcomes, and the association between SFA and low-grade inflammation, lipid blood and CVD depends on many other non-dietary factors( Reference Ruiz-Núñez, Dijck-Brouwer and Muskiet 92 ). In this sense, the interaction between -308G/A and SFA could play a role in low-grade inflammation and CVD, increasing the odds of having a more proinflammatory profile depending on the SNP allele.
This study has some limitations. Owing to its cross-sectional design, the temporal sequence of the associations could not be established. The use of plasma FA profile as a dietary biomarker has some limitations because it constitutes a mixture of all plasma lipid fractions, where changes in one or more lipoprotein can alter plasma FA concentrations; it is a short-term biomarker and has an enzymatic elongation and desaturation FA process( Reference Hodson, Skeaff and Fielding 93 ), and therefore cannot be used as a dietary recommendation which is of interest to Nutrigenetics. This study considered only one cytokine gene, but several others genes and lifestyles may interact with FA and modulate the association with low-grade inflammation.
In summary, polymorphisms of the TNF-α gene had different FA profiles and inflammatory biomarkers between genotypes. Also, -308G/A interacts with plasma stearic acid and total SFA, whereas -857C/T interacts with plasma ALA, modifying the association with inflammatory profile. This study contributes knowledge on gene–FA interactions, with particular importance to the Brazilian population, but further studies are necessary to confirm these results in other populations.
Acknowledgements
The authors are grateful to all volunteers involved in this research and the funding bodies for the financial support. Furthermore, the authors also thank the School of Public Health of University of São Paulo for the structural resources that enabled the development of this study.
This study had financial support for research from the Fundação de Amparo à Pesquisa do Estado de São Paulo (FAPESP; grant nos 2009/15831-0 and 2012/20401-7), and had no role in the design, analysis or writing of this article. E. O., M. N. N. and A. A. F. C. received scholarships from FAPESP (grant nos 2013/01741-4, 2013/01740-8 and 2014/16347-2, respectively).
E. O. was responsible for the design of the present study, interpretation, writing the manuscript and primarily responsible for the final version. M. N. N. participated at the design of the present study, statistical analysis and interpretation. E. O., J. M. P. S. and I. A. C. were responsible for statistical analysis. E. O., M. N. N. and A. A. F. C. performed the plasma fatty acid analysis. D. M. L. M. and R. M. F. were responsible for the design of the HS-SP study, organised data collection and provided consultation for data interpretation. M. M. R. was responsible for reviewing the manuscript and every steps of the study.
The authors declare that there are no conflicts of interest.


