


I. Introduction
Pinot Noir (also known as Blauer Burgunder in Austria, Pinot Crni in Croatia, Spätburgunder in Germany, Pinot Nero in Italy and Serbia, Modri Pinot in Slovenia, and Blauburgunder in Switzerland) is the most ethereal of noble winegrape varieties, according to both consumers and producers of fine wine. It is also famous for being very difficult to produce well. Yet that has not stopped its share of the global vineyard bearing area from rapidly increasing: its rank rose from the 27th most-planted winegrape variety in the world in 1990 to 10th since 2010 (Anderson et al., Reference Anderson, Nelgen and Puga2025). In crush volume terms, it may be ranked lower because of its typically below-average yields, but in value terms, this cultivar may be ranked even higher than 10th, if its above-average price more than offsets its below-average yields.
This rise in ranking has been driven by relative growth in consumer demand for both sparkling wines (for which Pinot Noir is commonly blended with Chardonnay) as well as for fine still wines (for which Pinot Noir is typically bottled as a single variety). According to Wine-Searcher’s wine director David Allen, the number of searches on their website by consumers for Pinot Noir rose between 2016 and 2024 from 10.5% to 15.5% of all searches, to make it second only to “Bordeaux blends” (whose share fell from 22% in 2016 to 17% in 2024). So far that apparent growth in demand has outstripped growth in Pinot Noir offers by sellers on the Wine-Searcher website, which rose from 9.5% to only 11.5% of all offers over those 8 years (Wine-Searcher, 2025).
As part of their expanding presence, Pinot Noir grapes are being grown in an increasing number and wider climatic range of regions. Some of those new plantings of the variety are in regions much less well suited to its production, as reflected in the lower prices for their grapes as compared with those from the most suitable regions. (France’s Burgundy and Champagne are the world’s quintessential Pinot Noir-dominated regions, but equally cool regions of other countries also produce relatively high-priced Pinot Noir grapes.)
Before turning to empirical data, beginning with where Pinot Noir grapes are grown globally, it is helpful to keep in mind several distinctive features of this noble variety. They include:
1. The optimal climate for growing high-quality Pinot Noir grapes is cooler than that for most other mainstream red varieties but, being cooler, such regions typically produce lower yields and higher production costs per hectare and thus need a relatively high price if grape growing there is to be profitable.
2. As the world warms, one should expect Pinot Noir plantings to emerge in new regions that were previously too cool for winegrape growing. This will be further encouraged as the warmest Pinot Noir regions become even warmer and if that means its vignerons are less able to produce their traditional wine styles and qualities.
3. As demand for this variety grows, one might expect regions other than cool ones to consider planting it. But to the extent warmer regions are tempted to grow this variety, their grapes will be lower quality and so will attract lower prices than in cooler regions, hence higher yields than in cool regions will be required to ensure their profitability.
With the above in mind, this article seeks first to track the changes in Pinot Noir plantings over the past 35 years. It does so initially by country, and then by key Pinot Noir regions within the main countries producing this variety. Second, the article also examines winegrape production, prices, and yields, to get a sense of the economics of Pinot Noir production in the different environments of some of those regions. Specifically, annual time series data have been compiled recently on crush volumes and values in addition to bearing areas for the various Pinot Noir regions of a range of New World countries. That makes it possible to present the estimates of variations over time in regional yields (tonnes/ha), grape prices (US$/tonne), and thus also gross revenue per hectare (yield times price, so US$/ha) and to show the inverse correlation across regions between price and yield (and growing season temperature (GST)). To the extent that higher yields offset lower prices in less-suitable (typically warmer) Pinot Noir growing environments, so Pinot Noir plantings cover a more diverse range of climates than Jones et al. (Reference Jones, Reid, Vilks and Dougherty2012) suggest is optimal for this variety from a quality perspective. To finish, the article discusses the relative importance of physical aspects of terroir versus profitability in determining the location of Pinot Noir grape growing.
II. Trends in national and regional bearing areas of Pinot Noir
Even though Pinot Noir accounts for only 3% of the global winegrape area and even less of the crush volume, it attracts a far larger share of attention in the wine world. This is undoubtedly because it is the key variety for the world's most expensive still and sparkling wines. With the premiumization of wine consumer tastes this century, and a rapidly expanding interest of the wealthiest (especially Asian) consumers in iconic wines, that attention has grown steadily.
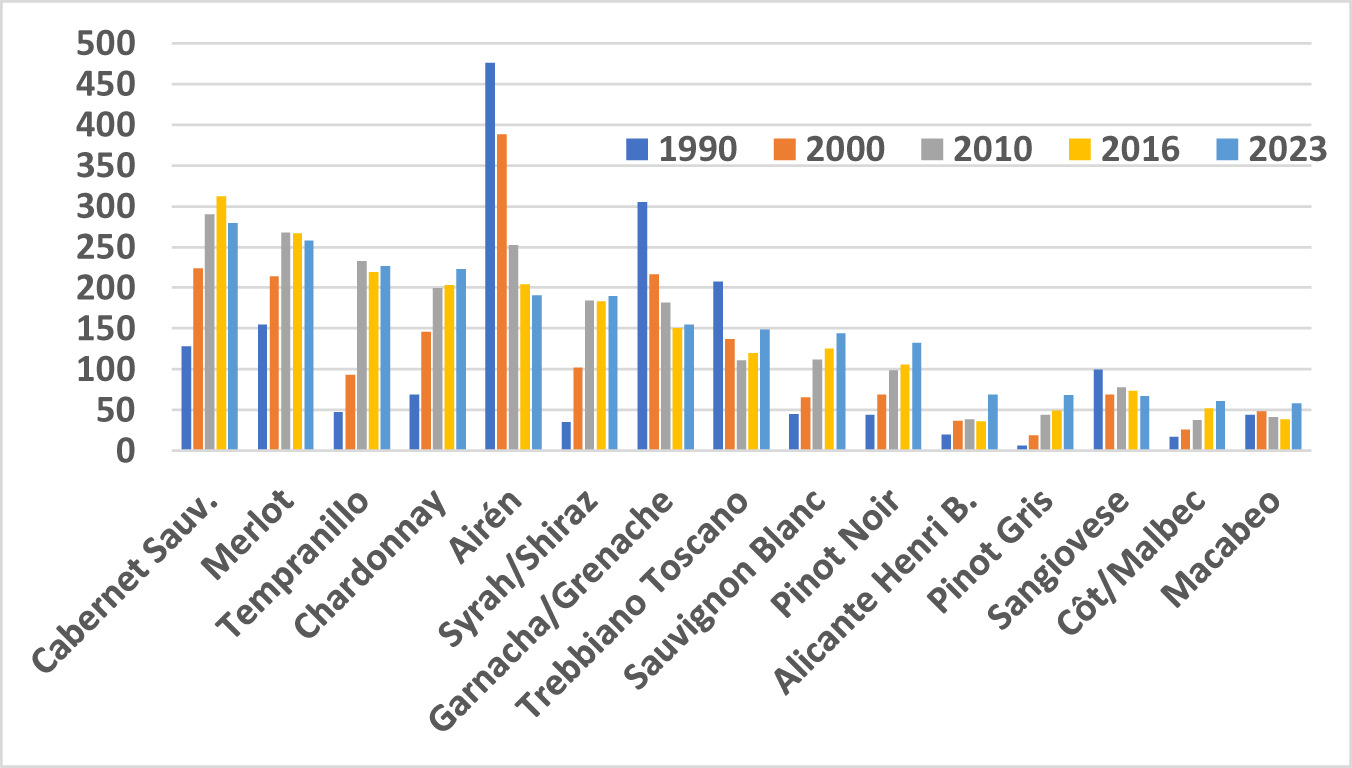
Presumably as a consequence, Pinot Noir has been since 2000 the third most rapidly expanding of the world’s top 25 red winegrape varieties (after Tempranillo and Côt/Malbec and slightly faster than Syrah/Shiraz). Its share of the global total bearing area of winegrapes has quadrupled since 1990, from 0.78% to 1.6% in 2000, 2.3% in 2010, 2.6% in 2016, and 3.1% in 2023 (or from 44,000 to 132,000 ha, see Figure 1, having been less than 20,000 ha in 1970). By that criterion, Pinot Noir rose from being ranked the 27th most-planted winegrape variety in the world in 1990 to being 13th in 2000 and 10th since 2010 (Anderson, Reference Anderson2014; Anderson et al., Reference Anderson, Nelgen and Puga2025). It’s true that many French varieties have become more important over that period, but in aggregate their area has risen considerably less than that of Pinot Noir (150% vs 200%).
Bearing areas of the world’s top 15 winegrape varieties in 2023, compared with earlier years (‘000 ha).

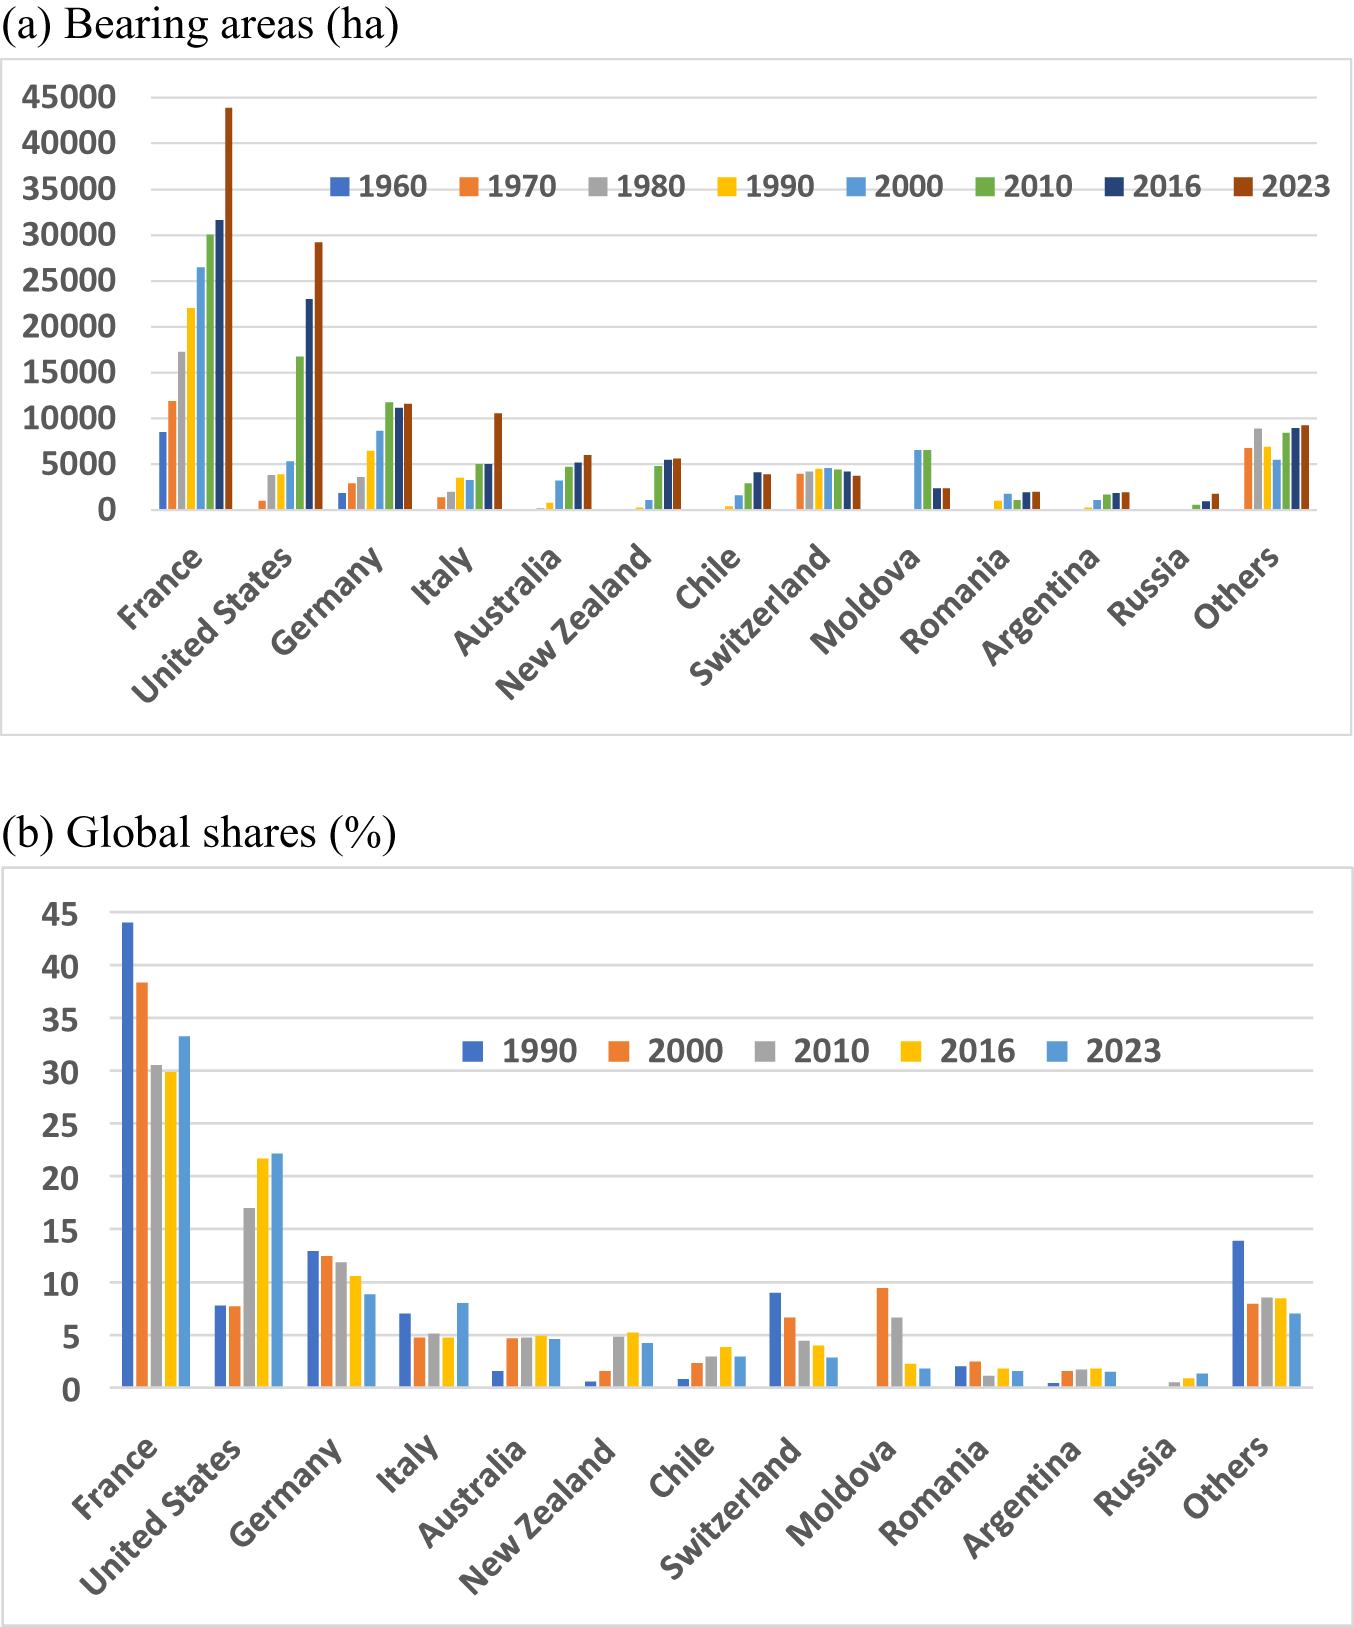
Many countries have increased their bearing area of Pinot Noir, but at quite different rates and outside as well as inside Europe (Figure 2(a)). France has always had the largest area planted to Pinot Noir, accounting for more than 40% of the world’s hectares in the 20th century. But despite the area of Pinot Noir still rising in France, that country’s global share has fallen by one-quarter this century (Figure 2(b)). This is not unlike France’s trend for other French winegrape varieties, thanks to globalization and the expansion of wine production in so-called New World countries based on noble French varieties (Anderson and Nelgen, Reference Anderson and Nelgen2021).
The variety’s bearing area in the United States by 2023 was almost two-thirds that of France. As well, Italy’s area now almost matches Germany’s, New Zealand’s now almost matches Australia’s, and Chile’s now is slightly ahead of Switzerland's area (Figure 2).
World’s top dozen Pinot Noir countries’ bearing areas and global shares of Pinot Noir vineyards, 2023 compared with earlier years. (a) Bearing areas (ha) and (b) global shares (%).

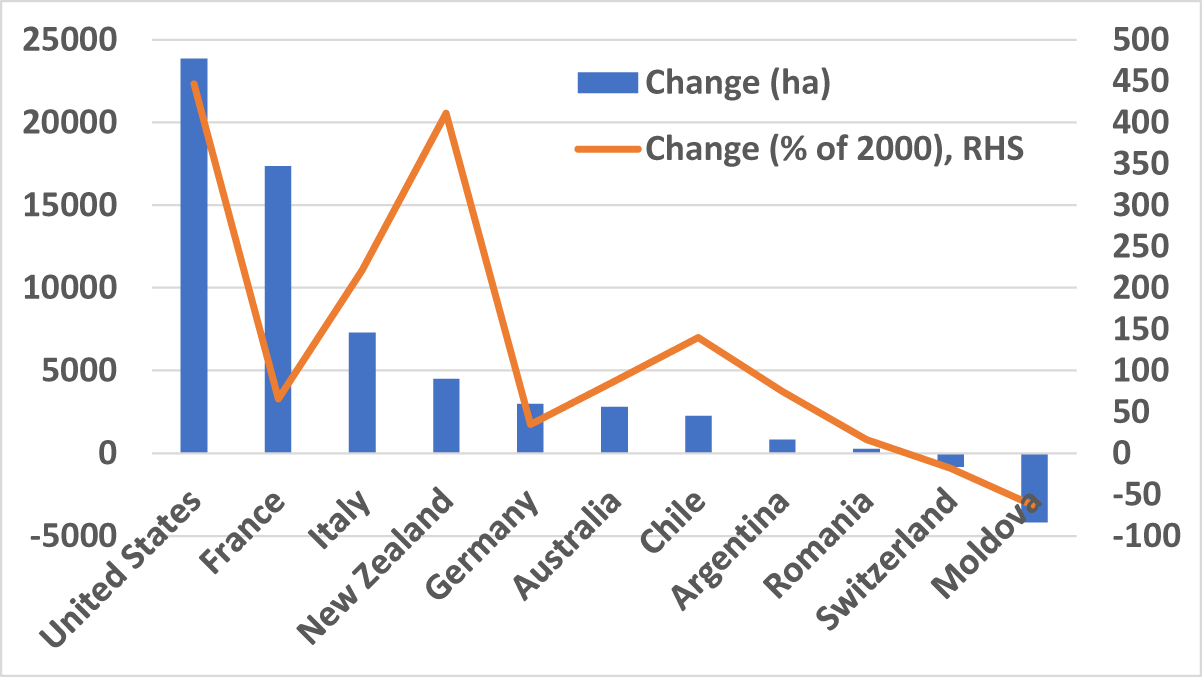
By far the largest national change in terms of hectares has been in the United States, but the percentage change from 2000 to 2023 is almost as large in New Zealand. Both countries saw a more than fourfold increase in their Pinot Noir areas over that quarter-century, or seven times the proportional rise in the rest of the world (Figure 3).
Change in national Pinot Noir bearing areas from 2000 to 2023 (ha and %).

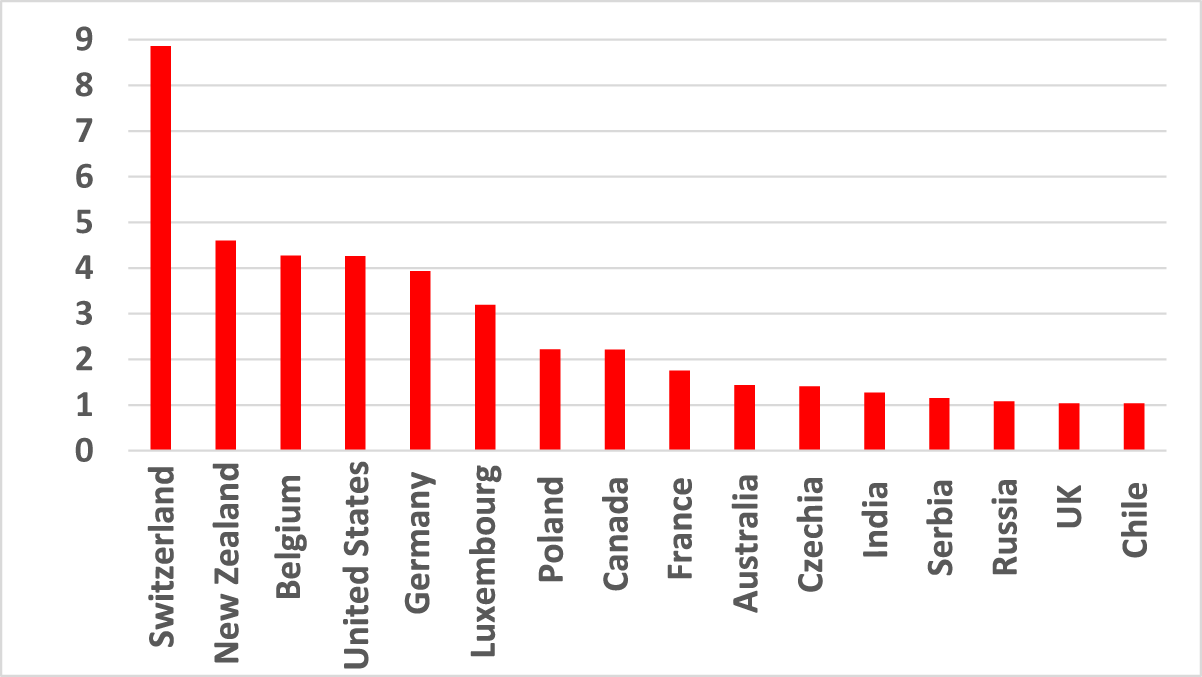
There are 16 countries whose share of Pinot Noir hectares in their national winegrape bearing area exceeded that variety’s global average share in 2023. The most outstanding is Switzerland, which is almost nine times as concentrated on this variety compared with the world as a whole. New Zealand, Belgium, the United States, and Germany are the next most intense, at around four times the global average. That intensity index for France, by contrast, is only 1.8 (Figure 4).
National indexes of intensitya of Pinot Noir plantings, 2023.

In 2023, Bourgogne and Champagne had 32% and 38% of their bearing area planted to Pinot Noir (and 51% and 31% to Chardonnay), respectively (Anderson et al., Reference Anderson, Nelgen and Puga2025). But the most Pinot Noir-intensive regions are Central Otago in New Zealand and the North Willamette Valley in the US state of Oregon, with 81% and 71% of their area planted to Pinot Noir, respectively, in 2023. Others with very high shares in 2023 are Neuchâtel in Switzerland (55%), Wairarapa in New Zealand (48%), Australia’s Mornington Peninsula, Tasmania and Yarra Valley (55%, 47%, and 40%, respectively), and Freiburg in Germany (38%).
III. Trends in the economics of Pinot Noir grape production in Australia and California
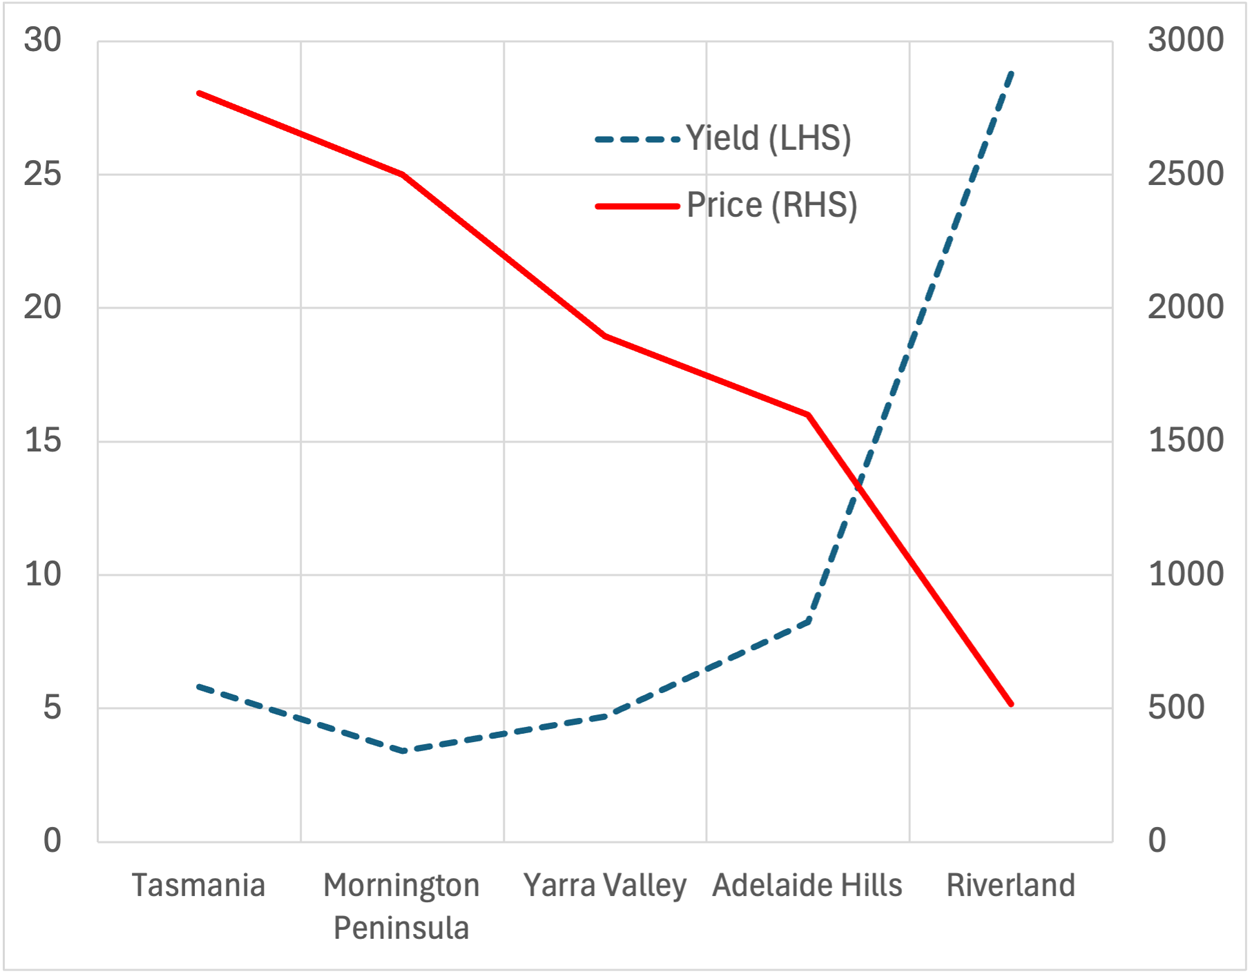
The conventional wisdom is that the highest-quality Pinot Noir grapes are grown in cool wine regions, the ultimate benchmark being Côte d'Or in Burgundy. There, Dijon has had an average GST of 15.6°C and an average of 1190 growing degree days (GDD) during the growing season over the period 1958–2019. Australia has only one significant wine region that is cooler than that, namely Tasmania (GST: 14.4, GDD: 918). Australia's other big Pinot Noir regions have higher and very similar GSTs (16.8–17.0) and GDDs (1430–1482), while hot inland regions such as the Riverland (GST: 21.0, GDD: 2333) are far warmer but have ample irrigation to boost yields—and they choose to grow some Pinot Noir. That spread shows up as a clear divergence in the price and yield lines when Australia's five main Pinot Noir regions are ranked from coolest to warmest (Figure 5). More generally, across all Australia's regions, there is a negative correlation between Pinot Noir's price and yield (correlation coefficient, −0.43) and between Pinot Noir's price and GST (correlation coefficient, −0.59) and a positive correlation between GST and yield (correlation coefficient, 0.43) over the 2001–2023 period, according to data in Anderson and Puga (Reference Anderson and Puga2023).
Average yield and price of Pinot Noir grapes in select Australian wine regions, 2001–2023 (t/ha, A$/t).

In Australia’s key Pinot Noir regions, yields are only slightly lower for that variety than for other varieties in the coolest three regions and are higher than for other varieties in the Adelaide Hills and especially the irrigated Riverland region. However, prices were up to 16% higher for that variety than for all other varieties in each of the cool regions and 22% higher in the Riverland (Table 1). Hence, as one might expect, gross revenues per hectare during 2001–2023 averaged higher than for other varieties, except in Mornington Peninsula where they averaged 15% lower. In the Riverland, the premium was 56%, so it has been first or second to Tasmania in terms of gross revenues/ha (Figure 6). Mornington Peninsula is characterized by small vineyards, some of which are hobby farms owned by wealthy nearby Melburnians in love with Pinot Noir. In the more-remote inland Riverland region, by contrast, varietal choice is strongly influenced by straightforward economic considerations (profitability).
Gross revenue per hectare from Pinot Noir grape production in selected Australian wine regions, 2001–2023 (A$’000/ha).

Characteristics of Pinot Noir (and all varieties’) grape production in select Australian wine regions, averages over 2001–2023 (current US$)

a GST is the average growing season temperature, and GDD is the growing degree days during the growing season, both averaged over the period 1958–2019 (Anderson and Nelgen, Reference Anderson and Nelgen2020).
b The varietal intensity index (VII) is defined as the share of the region's winegrape bearing area that is devoted to Pinot Noir divided by that variety's share of the national bearing area of all winegrape varieties.
c Each region’s varietal comparative advantage index (RVCA) is gross revenue per ha of Pinot Noir divided by gross revenue per ha of all winegrape varieties produced in that region.
Source: Compiled from Anderson and Puga (Reference Anderson and Puga2023).
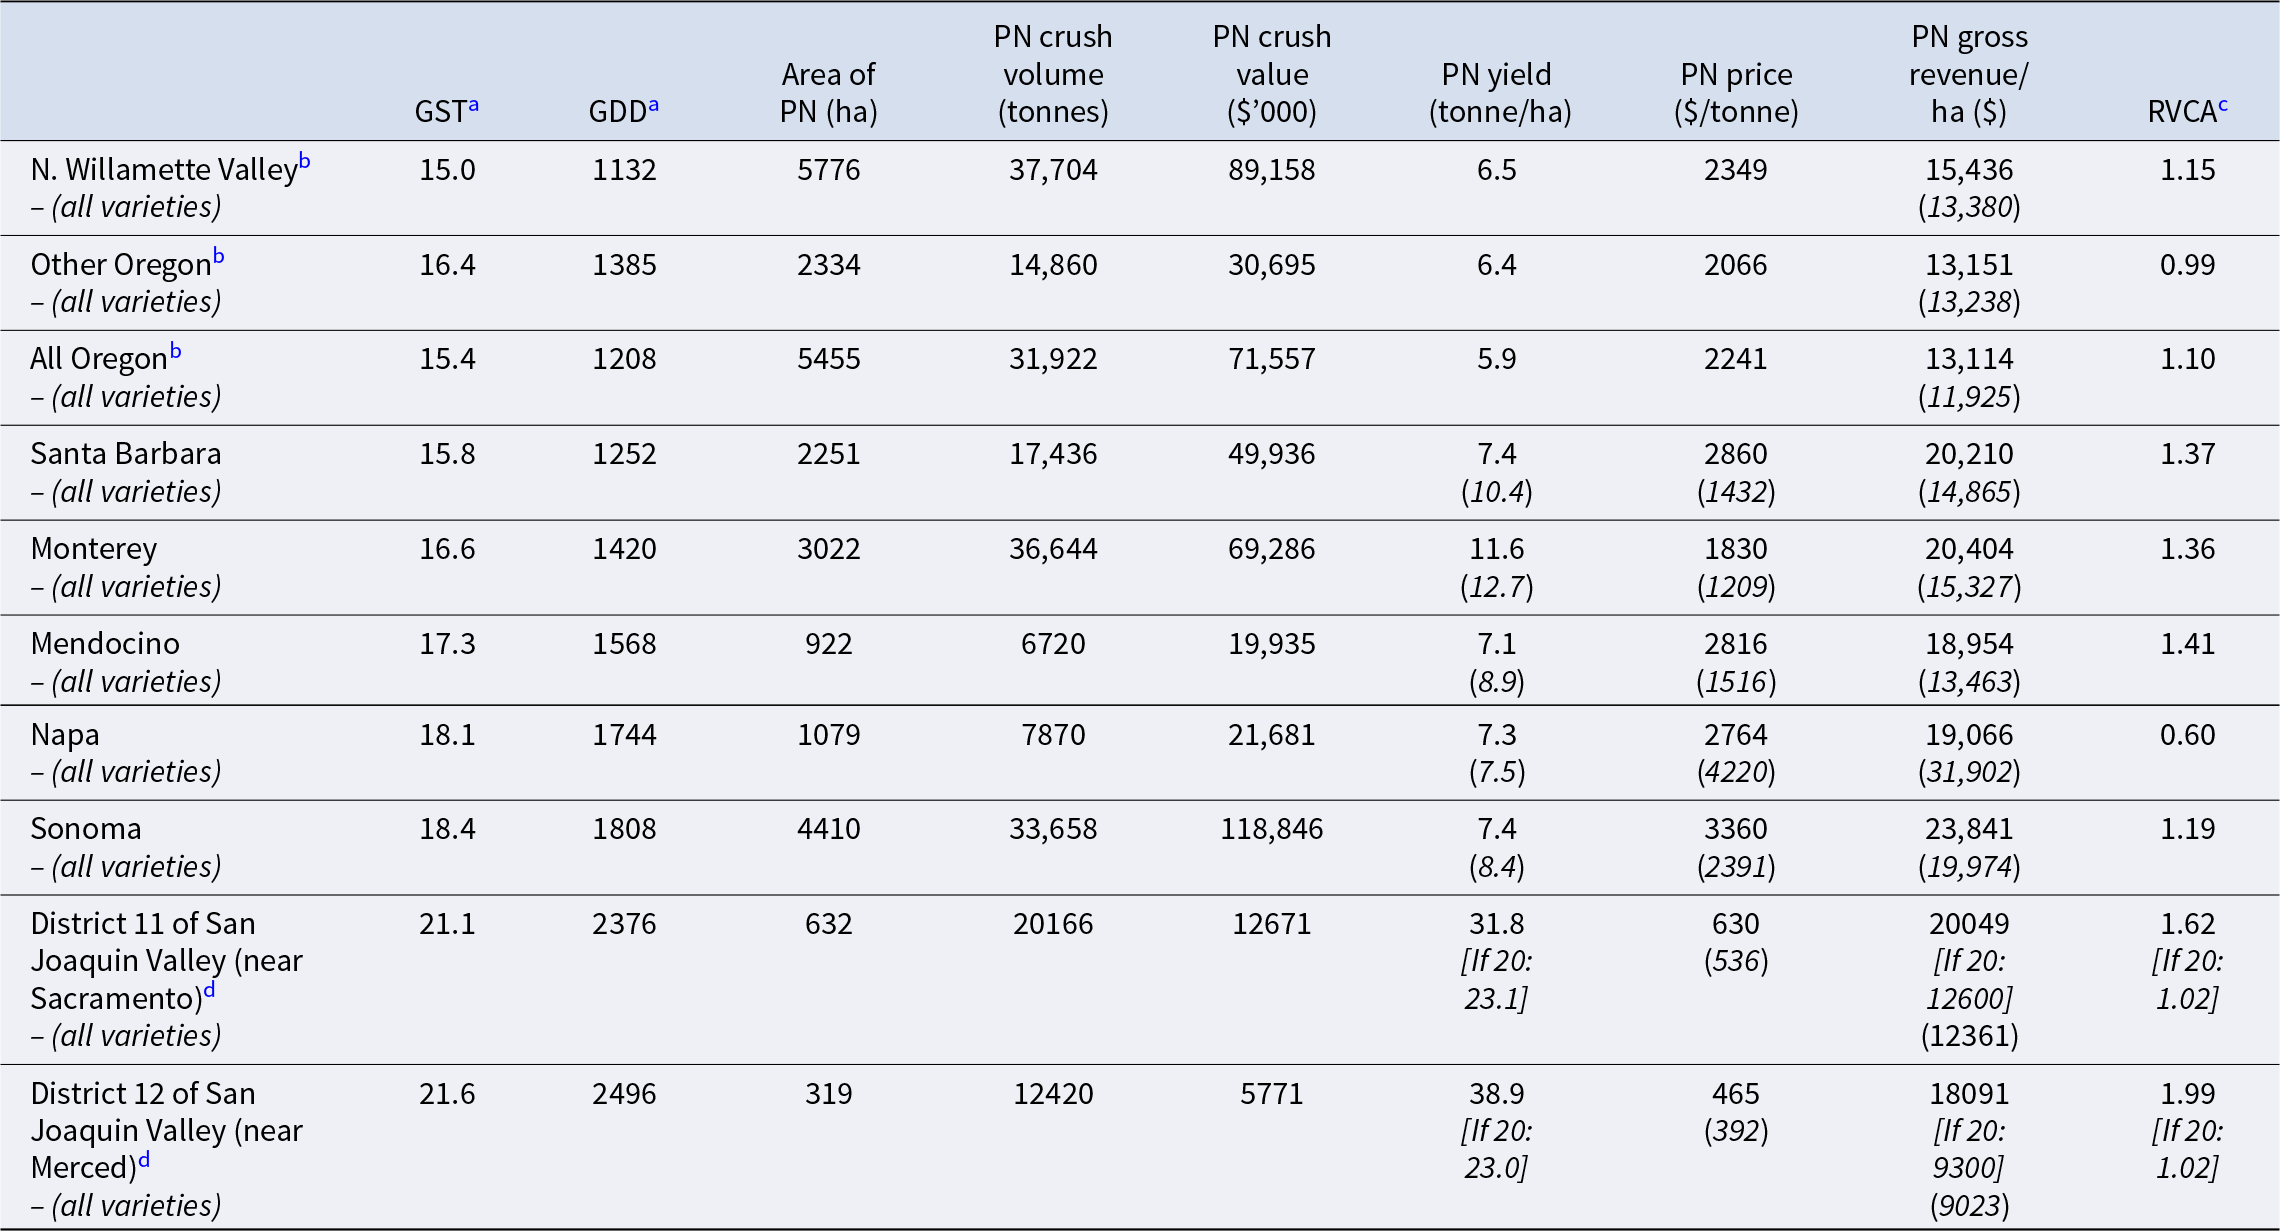
Similar data for the United States (Table 2) reveal that in Oregon, the growing of Pinot Noir this century has earned 10% higher gross revenue per hectare than that for other varieties. More than 70% of that State’s Pinot Noir area is in North Willamette Valley, where over the 2014–2023 period, the price for Pinot Noir averaged 15% above that in the rest of that State, and its average yield also was slightly above that for the rest of Oregon (6.5 vs 6.4 t/ha). Pinot Noir provided a 15% higher gross return per hectare than other varieties in North Willamette Valley but offered no higher return in Other Oregon.
Characteristics of Pinot Noir (and all varieties’) grape production in select US wine regions, averages over 2001–2023b (current US$)

a GST is the average growing season temperature, and GDD is the growing degree days during the growing season, both averaged over the period 1958–2019 (Anderson and Nelgen, Reference Anderson and Nelgen2020).
b The North Willamette Valley and Other Oregon data are just for 2014–2023; All Oregon data are for 2001–2023. The GST and GDD are the total crush-weighted averages (all varieties) of the State’s Other Oregon winegrape regions, which accounted in the past decade for a little under 30% of Oregon’s total winegrape vineyard area and its crush.
c Each region’s varietal comparative advantage index (RVCA) is gross revenue per ha of Pinot Noir divided by gross revenue per ha of all winegrape varieties produced in that region.
d Only two of the hot inland irrigated parts of the San Joaquin Valley region (Districts 11 and 12, near Sacramento and Merced, respectively) have a significant area of Pinot Noir. Each Pinot Noir area may be understated though, as otherwise they imply yields of >30 t/ha. Were their yields to be “only” 20 t/ha, their estimated RVCA would be just 1.02 instead of >1.60 (see the two italicized rows), implying a very similar return to the average variety in those parts of that hot region.
Source: Compiled from Anderson and Puga (Reference Anderson and Puga2024a) and the authors’ similarly compiled data for Oregon (from https://industry.oregonwine.org).
In California, as in Australia, two of the hot inland districts within the San Joaquin Valley region (Districts 11 and 12, near Sacramento and Merced, respectively) grow Pinot Noir. That is presumably because gross revenue per hectare there is more than 60% higher for Pinot Noir than for the average variety grown in those two regions, if the data in Anderson and Puga (Reference Anderson and Puga2024a) are correct. However, the Pinot Noir area data may be understated there, as otherwise they imply yields of more than 30 t/ha. Were their yields to be “only” 20 t/ha, they would have a very similar gross return to the average variety in those parts of that hot region. Even then it would suggest very high yields are more than compensating for a low price for Pinot Noir there relative to the cooler Californian regions—even though the Pinot Noir price in those two hot counties averaged one-sixth above that for all other varieties. At the other extreme, the growing of Pinot Noir earns a gross revenue per hectare well below the average variety in Napa. As in Australia’s Mornington Peninsula, perhaps it is nonetheless grown there in some cases by wealthy Pinot-loving vignerons including urbanites in the San Francisco/Silicon Valley area.
IV. Conclusion: the relative importance of terroir versus profitability
Clearly, Pinot Noir plantings cover a more diverse range of climates than Jones et al. (Reference Jones, Reid, Vilks and Dougherty2012) suggest is optimal for this variety from a quality perspective. In both Australia and California, Pinot Noir is grown profitably also in hot inland regions where its price is low compared with in cooler regions but high compared with other varieties grown in those irrigated, high-yielding hot regions. Thus, standard economic factors (profitability) may be enough to explain Pinot Noir production in those hot regions.
If the regional ranking of net revenue parallels that of gross revenue per hectare, profitability may not be enough to also explain varietal choice in the cooler regions of Australia’s Mornington Peninsula and California’s Napa. Evidently, there are producers in those latter two regions who are willing to tolerate the relatively low returns per hectare earned with this variety compared with others grown there.
If the retail prices of Pinot Noir-based wine reflect the winegrape prices in the various regions reviewed above, might the very wide range of the latter—from less than US$500 to more than $3300 per tonne when averaged over the past two decades—suggest that in those two countries at least, younger/less-affluent wine consumers are able to enjoy an earlier exposure to the variety than would otherwise be the case? Some of them may well become the buyers of high-priced Pinot Noir in the future. Perhaps that is why a leading Pinot Noir producer in New Zealand’s Central Otago region wants to distance his firm from the “fine wine” category, believing it inhibits new and younger consumers from trying their wines (see https://www.thedrinksbusiness.com/2025/02/leading-nz-producer-to-move-away-from-fine-wine/).
The above economic analysis is limited to Australia, California and Oregon simply because we are unaware of the necessary data being available for any other jurisdiction, apart from Argentina. But Pinot Noir accounts for less than 1% of that nation's bearing area (see Anderson and Puga, Reference Anderson and Puga2024b). Even so, it is worth noting that share has doubled this century, and the price and gross revenue per hectare for Pinot Noir grapes have averaged 60% and 90%, respectively, above those for other varieties. Time will tell as to whether Pinot Noir will become a significant variety in Argentina in the years ahead, especially as vignerons there explore more the terroir in the nation’s cooler high-altitude regions.
Acknowledgements
The authors are grateful for helpful comments from two anonymous referees and the Editor, Karl Storchmann. The paper was presented at the 16th International Conference of the Academy of Wine Business Research, Adelaide, February 3–6, 2026.
Funding statement
This work was supported financially by Wine Australia and Adelaide University’s School of Agriculture, Food and Wine, its College of Business and Law, and its Office of the Deputy Vice-Chancellor (Research).



 Open access

