





Introduction
Weed management in conventional viticulture, directly adjacent to and under the vines, predominately relies on herbicide use (Tucker et al. Reference Tucker, Dumitriu and Teodosiu2022). However, overdependence on herbicides leads to ecological (e.g., biodiversity loss) and evolutionary (e.g., herbicide resistance) consequences, resulting in a negative public perception regarding chemical use (Slaven et al. Reference Slaven, Koch and Borger2023; Tucker et al. Reference Tucker, Dumitriu and Teodosiu2022). Alternative weed control tactics in viticulture include mechanical methods like tillage, mowing/slashing/grazing, or rotary weeding, as well as mulching (Devetter et al. Reference Devetter, Dilley and Nonnecke2015; Kreiser et al. Reference Kreiser, Bryson and Usnick2004; Pradel et al. Reference Pradel, de Fays and Seguineau2022; Reiser et al. Reference Reiser, Sehsah, Bumann, Morhard and Griepentrog2019; Tucker et al. Reference Tucker, Dumitriu and Teodosiu2022). However, use of tillage is declining, as environmental concerns (especially related to soil health and structure) have encouraged producers to adopt conservation agriculture practices (Kesser et al. Reference Kesser, Cavagnaro, De Bei and Collins2023; Tucker et al. Reference Tucker, Dumitriu and Teodosiu2022). Electric weed control offers an alternative weed management tactic, and in recent years, a range of technologies have been commercially released for electric weed control in agriculture or non-crop areas (Lehnhoff et al. Reference Lehnhoff, Neher, Indacochea and Beck2022; Slaven et al. Reference Slaven, Koch and Borger2023).
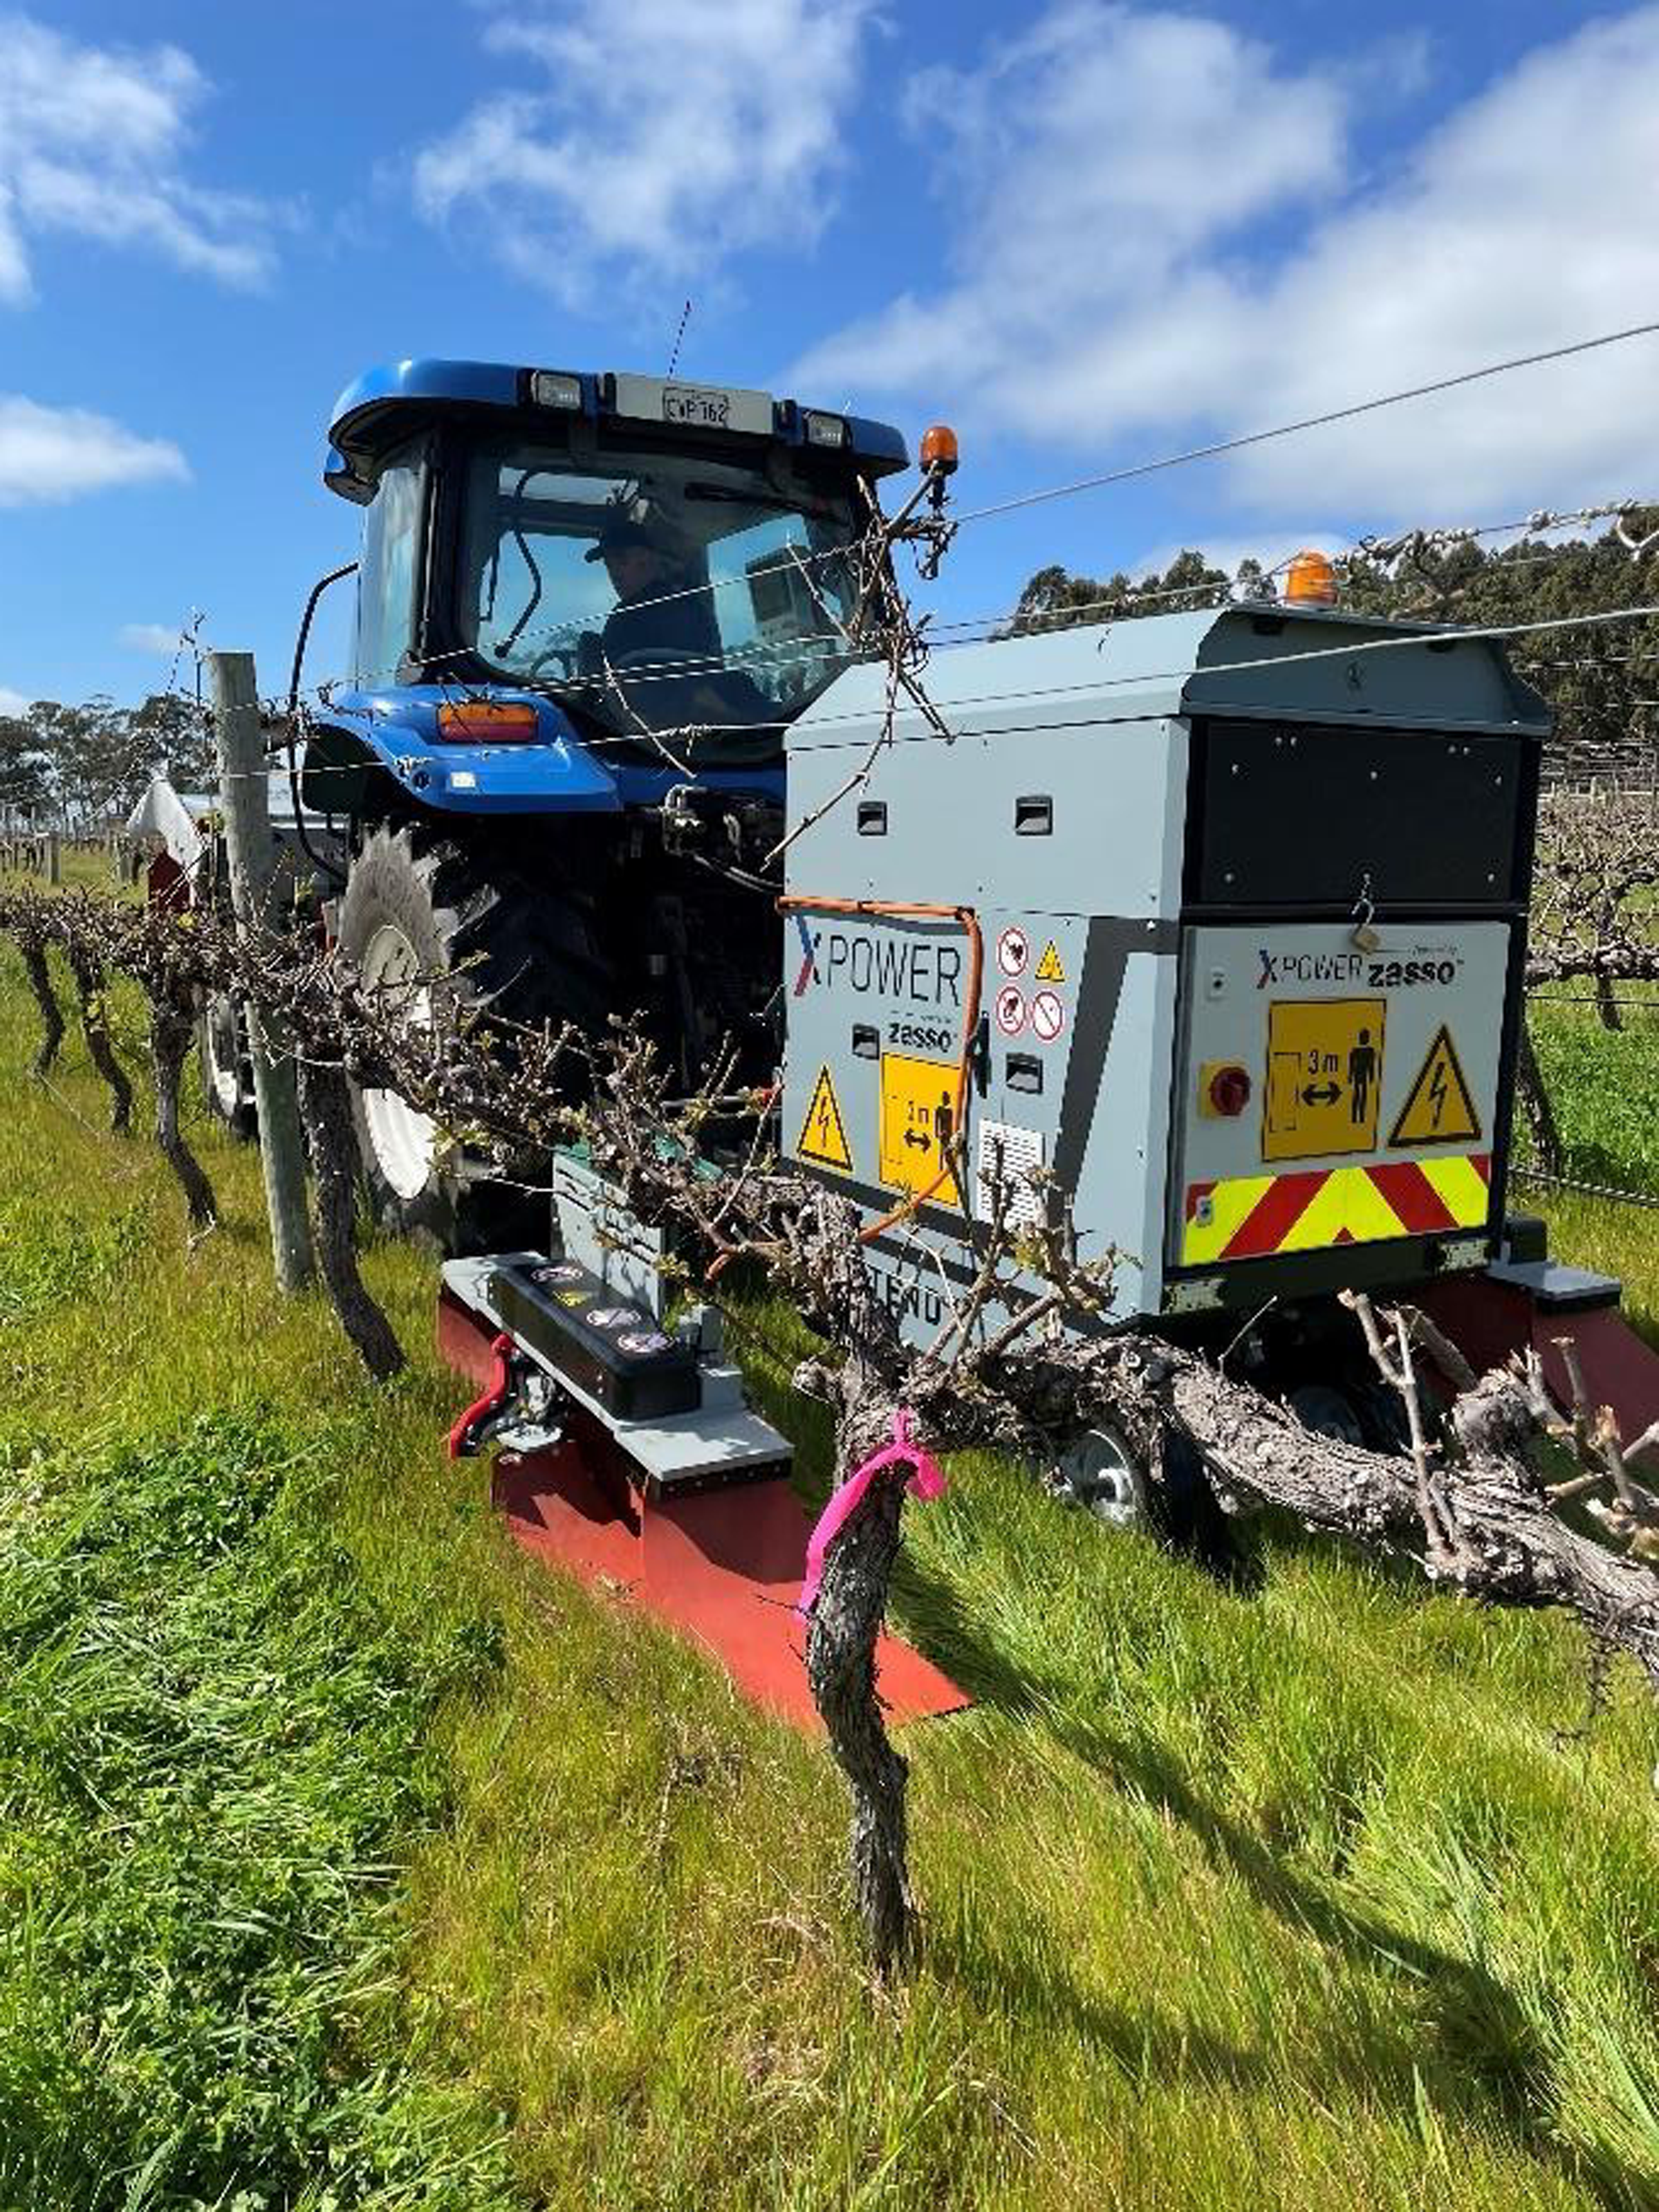
Advantages of electric weed control compared with herbicides include no chemical residues in the environment or food, no rainfast period after application, no restrictions on use in windy conditions due to drift, no chemical resistance, and no off-target impacts on neighboring vegetation or waterways (Borger and Slaven Reference Borger and Slaven2024b; CNH 2023; Slaven et al. Reference Slaven, Koch and Borger2023). Disadvantages include slow application speed and high fuel usage (Slaven and Borger Reference Slaven and Borger2024; Slaven et al. Reference Slaven, Koch and Borger2023). The XPower (ZassoTM, Zug, Switzerland) is one example of commercially available technology for electric weed control that has applicability in viticulture using the XPS applicator (CNH 2023; Figure 1). This technology uses the continuous electrode–plant contact method, whereby the electrode contacts the weed, and an electrical current is transferred through the plant into the roots and soil. The circuit is then closed by returning the current to the machine via a ground-contact device (Slaven et al. Reference Slaven, Koch and Borger2023).
Tractor with an XPower electric weed control machine (Zasso™). The power supply unit is on the rear linkage, and the XPS applicators are on each side of the supply unit, with front and rear static electrode arrays and center electrode array on a retractable arm. The electrode arrays are shielded by red rubber mats to contain sparks.
Electric weed control efficacy is likely to be affected by plant species, plant age, soil type, and weather conditions during application. However, there are few data on the extent to which these factors influence efficacy and few data to indicate the effectiveness of this technology within vineyards (Slaven and Borger Reference Slaven and Borger2022). Species and plant morphology likely affect weed control because, as stated, this technology relies on physical contact with the electrodes to pass a current through the plant and roots. In a large plant, there may not be sufficient current passing through to achieve full control (i.e., the “dose” of current may be too low). Large, branching species like dicotyledonous weeds or monocotyledonous weeds that spread via stolons or rhizomes are likely to be less susceptible to electric weed control. Monocotyledonous tussock (bunching) grass species or dicotyledonous species with a single stem and taproot will have high susceptibility (Diprose and Benson Reference Diprose and Benson1984; Lang et al. Reference Lang, Kurz, Löbmann, Klauk, Petersen and Petgen2022; Slaven et al. Reference Slaven, Koch and Borger2023). Plant age is likely to affect electric weed control, as mature plants have a greater cellulose and lignin content in the cell walls and more hair or wax on the epidermis, increasing resistance to electric voltage (Bauer et al. Reference Bauer, Marx, Bauer, Flury, Ripken and Streit2020; Vigneault et al. Reference Vigneault, Benoit and McLaughlin1990). Therefore, seedlings are likely to be easier to control than mature plants, and annual weeds may be easier to control than perennial species. Mature plants are also likely to shield smaller plants from contact (Lang et al. Reference Lang, Kurz, Löbmann, Klauk, Petersen and Petgen2022; Slaven et al. Reference Slaven, Koch and Borger2023). Seedling size itself has little impact on efficacy, as the individual electrodes are flexible metal strips and achieve good contact with small plants, even where the soil surface is uneven (Figure 2). Soil type will impact dispersal of the current from the plant roots into the surrounding soil and will likely be influenced by factors such as organic matter, electrical conductivity, and soil moisture. It is not known whether the dispersing current in the soil can move to the roots of neighboring plants (Slaven et al. Reference Slaven, Koch and Borger2023). However, research indicates that electric weed control has no impact on non-target plants (Borger and Slaven Reference Borger and Slaven2024b). Weather will likely affect weed control, as it is hypothesized that water on the plant epidermis in wet conditions will cause the electric current to disperse. A proportion of the current will pass through the water on the epidermis (remain on the exterior of the plant) rather than entering the plant to cause the required damage to plant cells (Bauer et al. Reference Bauer, Marx, Bauer, Flury, Ripken and Streit2020; Koch et al. Reference Koch, Tholen, Drießen and Ergas2020). However, it should be noted that herbicide performance is also affected by plant species, age, soil type, and meteorological conditions (Duke et al. Reference Duke, Powles and Sammons2018).
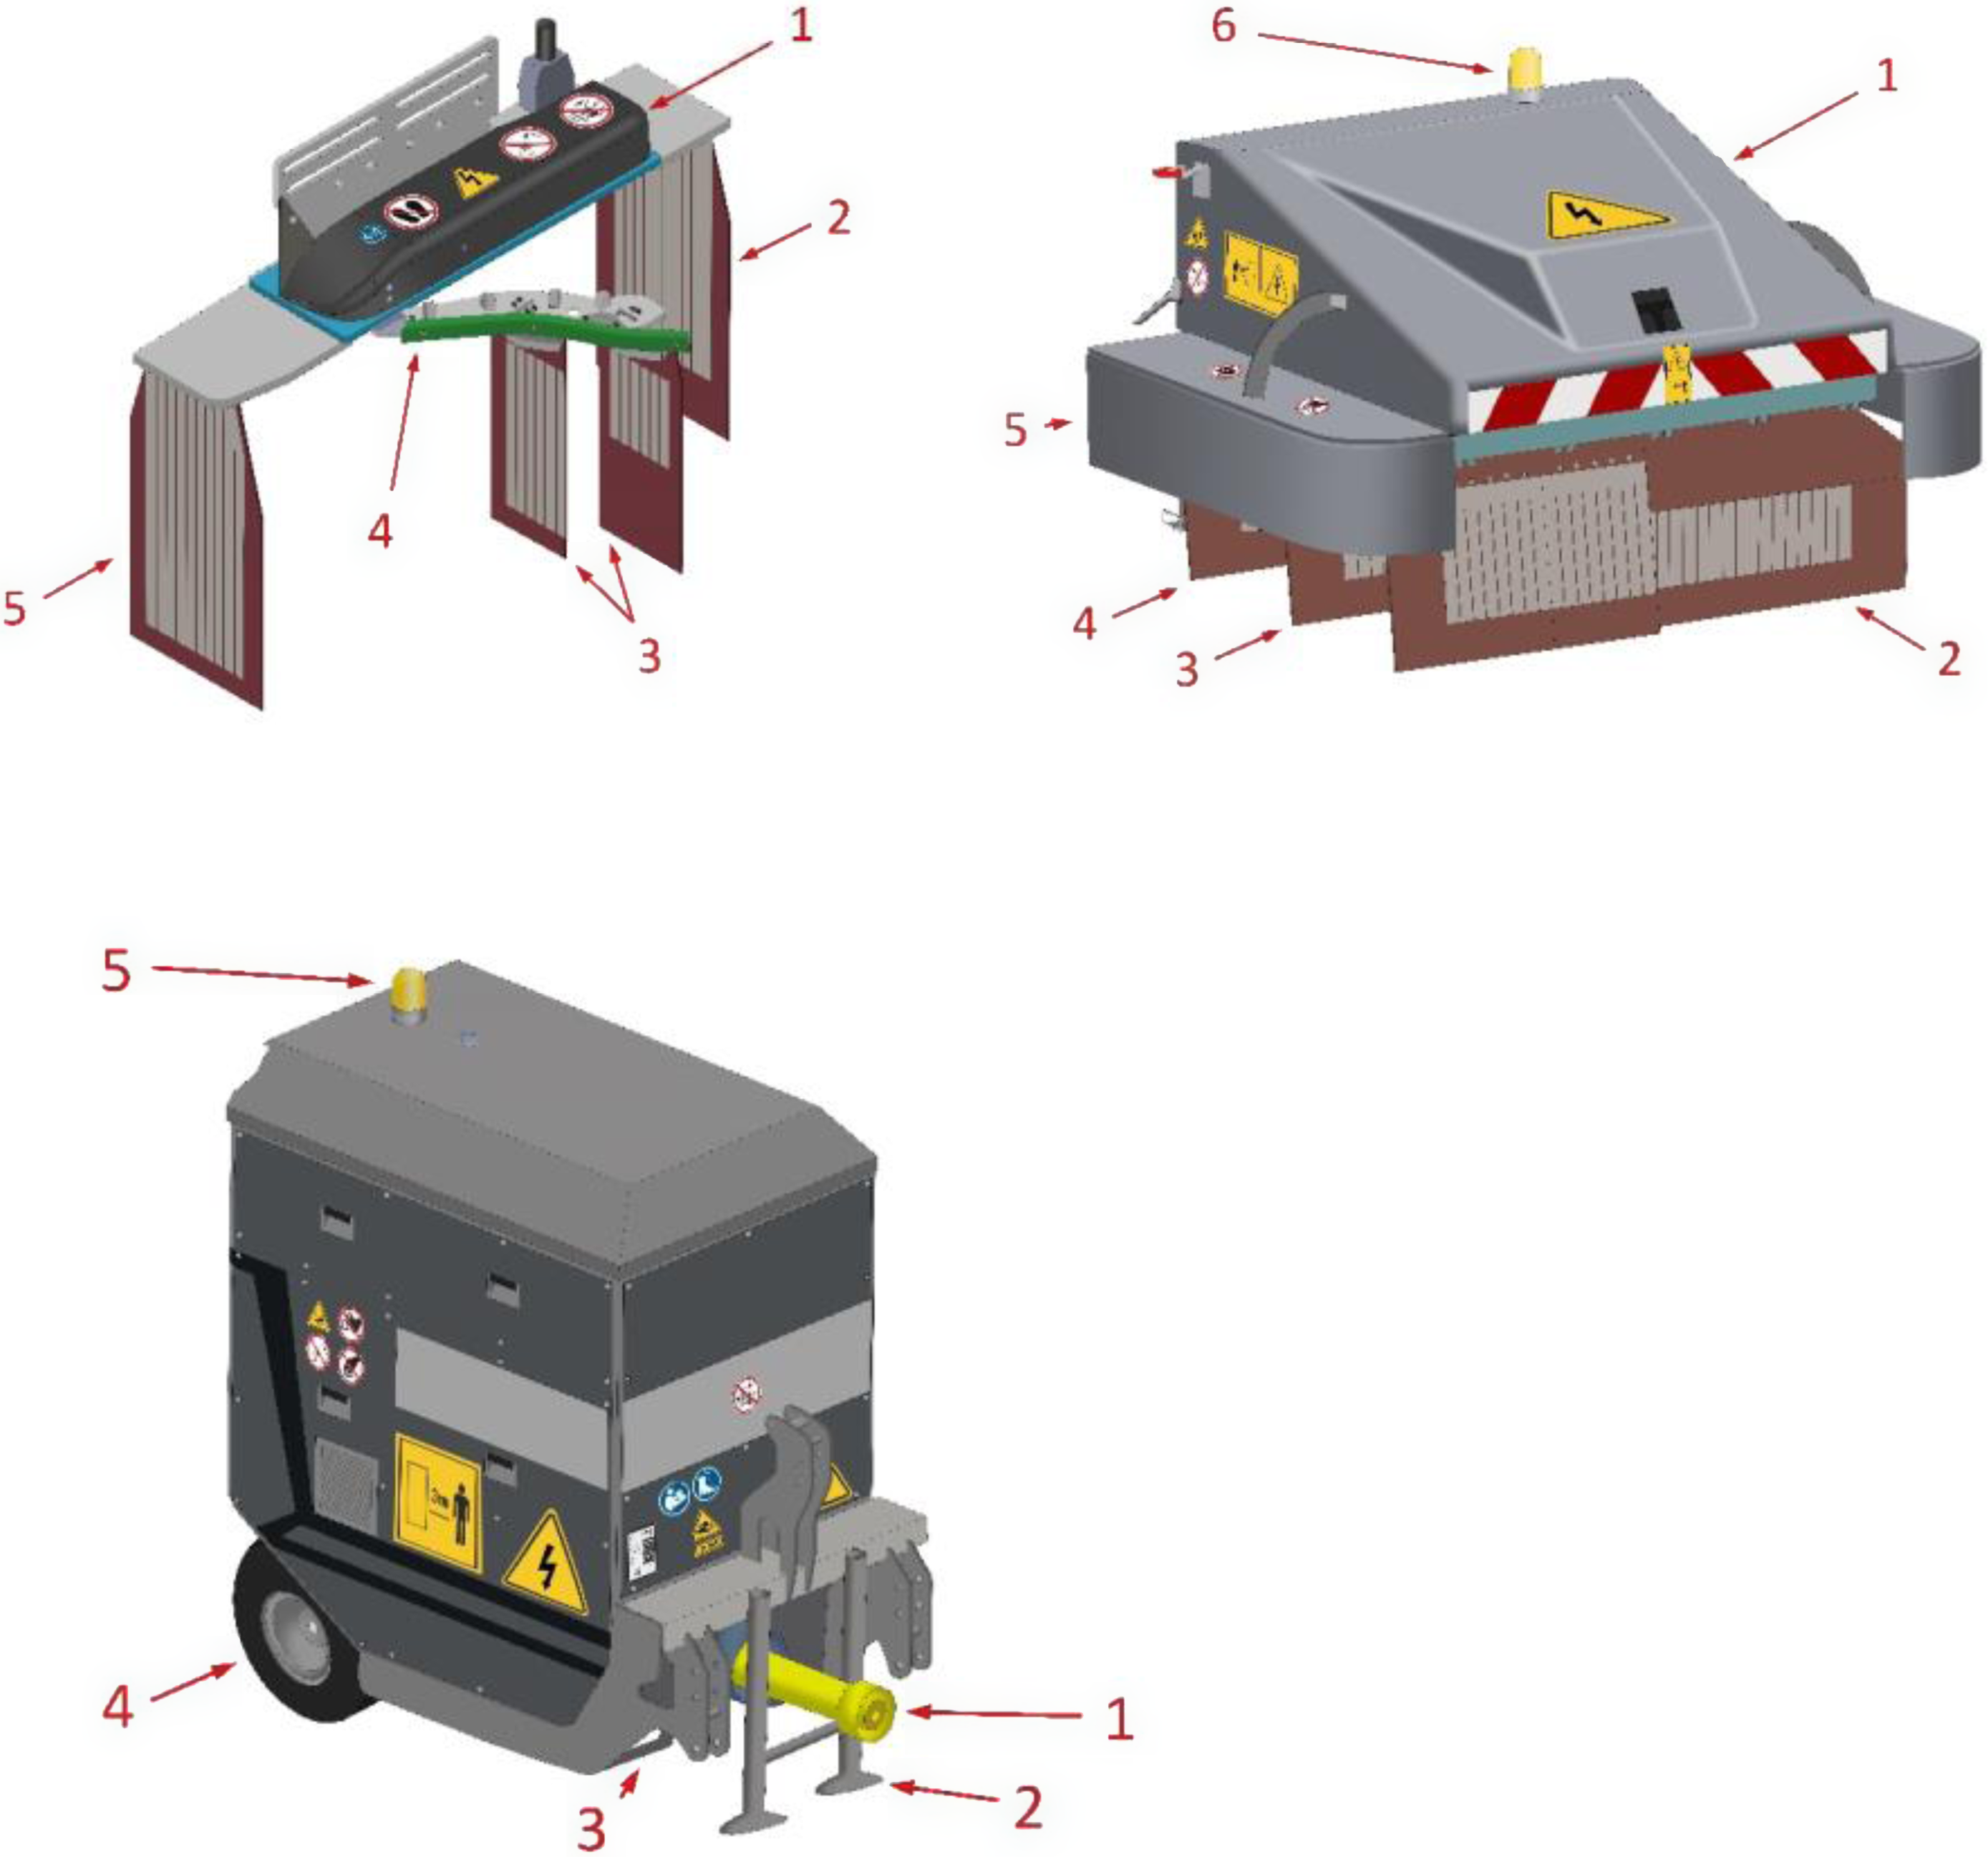
Line drawings of the XPS unit (top left) showing hood (1), positive electrodes (2 and 5), negative electrodes (3), and retractable arm (4), and the XPU unit (top right) showing hood (1), positive electrodes (2 and 4), negative electrodes (3), side protection cover (5), and warning light (6). Applicators can be mounted on a front or rear linkage. A line drawing of a rear-mounted power supply unit (bottom) showing power takeoff shaft (1) leading to the internal modular high-frequency voltage transformer, feet (2), forklift passages (3), adjustable wheel set (4), and warning light (5). Note that images are line drawings (courtesy of Sina Nouraei, University of Western Australia) to give an approximation of the equipment and are not to scale.
Meteorological conditions influence not just the efficacy of weed control, but also the fire risk resulting from electric weed control application. In the Mediterranean climate, weed management in viticulture is predominantly performed directly before budbreak in spring or shortly afterward, although herbicides may be applied throughout the year (Nordblom et al. Reference Nordblom, Penfold, Whitelaw-Weckert, Norton, Howie and Hutchings2021). However, summer and autumn in this environment are hot and dry, and in the southern half of Australia, climate change has led to higher average temperatures, longer heat waves, and more frequent bushfires over summer (Harris et al. Reference Harris, Remenyi, Rollins, Love, Earl and Bindoff2020). Fires in this environment are common, with the level of risk related to characteristics of the dry plant residue on the ground (i.e., total amount, type, and residue moisture level) and meteorological conditions (i.e., temperature, relative humidity, wind speed, and rainfall) (Hollis et al. Reference Hollis, Matthews, Anderson, Cruz, Fox-Hughes, Grootemaat, Kenny and Sauvage2024). Electric weed control applied at times of the year other than winter or spring may present a fire risk, due to the generation of sparks when the electric current arcs from the target plant to the electrode (Lehnhoff et al. Reference Lehnhoff, Neher, Indacochea and Beck2022; Slaven et al. Reference Slaven, Koch and Borger2023). However, fire risk from electric weed control has not been quantitatively assessed.
Even though electric weed control machinery is available for use in a range of agroecological systems, there are comparatively few data on electric weed control efficacy, and assessment of the fire risk is lacking. It is important to assess both to allow growers and the industry to determine the value of this technology. The current research aims to determine the suitability of the XPower with XPS applicator for electric weed control in viticulture systems within a Mediterranean environment. We tested the hypothesis that electric weed control efficiency will be comparable to mechanical (mowing) or chemical (herbicide) weed control. This research further aims to quantify the fire risk from electric weed control in this environment, to test the hypothesis that electric weed control would pose a fire risk in dry conditions.
Materials and Methods
Viticulture Experiment Design
Vineyard trials were conducted in Yallingup, Western Australia, in spring of 2022 and 2023 (Table 1). Selected sites had mature, deep-rooted vines on their own roots (non-grafted). A visual estimate of percent ground cover was used to assess weed species at each site (Table 2). Visual estimation was used rather than a canopy cover algorithm, as some species were shielding others due to height differentials. At all sites, weed species were consistently spread over the area, and total ground cover was 97% to 100%. Weed height was 10 to 25 cm. Species density could not be quantitatively assessed before treatment, as (1) the grass or forb species that spread via stolons could not be visually divided into individual plants and (2) tussock grass species were mature (at anthesis or grain fill) and densely clustered. The site histories indicated no prior weed control during the year, which is common for the region, as most weed control in vineyards occurs during spring.
Details of the viticulture sites used in the experiments, including location, vine characteristics (cultivar, age, growth stage, spacing), dry residue below the weeds, soil moisture, rainfall, and soil characteristics.
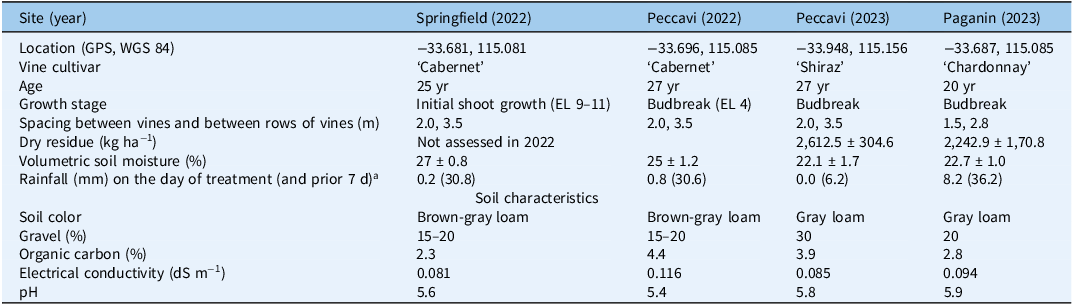
a Rainfall data were collected from Jindong station (009978), approximately 12.5 km away from the sites (Bureau of Meteorology 2023).
The weed species found at each site, as well as percent cover, developmental stage, and growth habit.

Viticulture Experiment Treatments
Treatments included electric weed control at 36-kW or 24-kW power supply, mowing, regionally appropriate herbicide, and an untreated control. At each site, four rows of vines were identified. Plots of 1 m by 10 m (6 individual vines), or 1 m by 9 m (7 vines) at Paganin, were established on the rows (i.e., the row of vines was in the center of the 1-m-wide plot). Note that vine spacing was not consistent between sites, resulting in different plot lengths (Table 1). There was a buffer of approximately 6 m between plots. All treatments started and ended in the buffer area, to ensure consistent results over the 10-m plot span. Experiments were established as a randomized block design with four replications (with each row of vines acting as a replication).
To apply electric weed control, a tractor (New Holland TS100A, CNH Australia, NSW, Australia) was fit with a Zasso™ XPower electric weed control machine (Figure 2). This consisted of a rear-mounted XPower 36-kW power supply unit (with power transmitted from the power takeoff) and a 55-cm-wide XPS applicator mounted on either side of the supply unit (CNH 2023). Each applicator included three arrays of electrodes. The front and rear electrode arrays on each applicator are static, with a 30-cm width. The center array of electrodes is on a 25-cm-wide retractable arm. The applicators have a total application width of 1.1 m, that is, two 55-cm-wide applicators. They receive power from 12 inverters (6 for each 55-cm applicator) that deliver a maximum of 3 kW of power each (i.e., 36 kW total). The unit is designed to control weeds directly adjacent to a row of vines, while the retractable arms extend under the vines and then fold in when the unit passes a vine trunk or post (Figure 1). Note that the retractable arm folds around the vines gently; there is no damage to the plants when the arm contacts the trunks.
Electric weed control treatments (36-kW or 24-kW treatment) were applied to each side of the row of vines by switching on the XPS applicator on one side of the power supply unit to drive down each side of the row without impacting the adjacent rows. Therefore, for the 36-kW treatment, six inverters in the single applicator were used to deliver a total of 18 kW to the 55-cm width. To apply the 24-kW treatment, two of the six high-voltage inverters on the applicator were switched off to leave four inverters delivering a maximum of 12-kW power (i.e., half of 24 kW; CNH 2023). During operation, the tractor engine was at 63 Hz (optimal operating power level). Manufacturer recommendations are for a speed of 1 to 3 km h−1 for control of grass weeds, but also state that control will be reduced if weeds are dense, mature, or wet (all three conditions occurred in the current experiments). Slower speed ensures greater contact time on each plant, delivering a higher dose of electrical current. As a result of suboptimal conditions, a low application speed was selected (1.1 to 1.4 km h−1; Table 3). The supply unit records speed and power output by each inverter each second of operation. For each experiment, speed was monitored, and power delivered per second was averaged over the six inverters of each XPS applicator (Table 3). While maximum power output was 36 or 24 kW, actual power drawn through the applicator depends on weed cover and density, and power applied to large dense weeds is greater than that applied to small, sparse plants (CNH 2023).
The details of the electric weed control application at each site, including speed and average power output operating at 24 or 36 kW.

Mowing was performed with a four-stroke lawn mower with a catcher on the rear (Honda, Building Supplies and Hire Dunsborough, Dunsborough, WA, Australia) at a height of 5 cm, at approximately 3 km h−1. Herbicide treatment was glyphosate 1,296 g ai ha−1 (Crucial, 600 g ai L−1, Nufarm SL, Northam, WA, Australia) plus amitrole/ammonium thiocyanate 720/634 g ai ha−1 (Amitrole T, 250/220 g ai L−1, Nufarm SL) applied in 240 L water ha−1. No adjuvants were added, as the Crucial formulation of glyphosate contains surfactants (Nufarm Australia 2023). Herbicides were applied using a boom (0.5 m above the ground) on a four-wheel motorbike (2022) or a 20-L backpack sprayer (2023) with a nozzle spacing of 50 cm (Airmix Agrotop, low-pressure, low-drift, air-induction 110-01 nozzle, SprayLine, Welshpool, WA, Australia) at 4 km h−1.
In the first year, electric weed control and mowing treatments were applied on September 15 to 16, 2022 (18.2 to 19.4 C maximum temperature, wind speed <10 km h−1). The day experienced a very light, intermittent rainfall, and electric weed control treatments were timed to be applied when it was not raining. Herbicide treatments were delayed until September 21, 2022 (19.5 C maximum temperature, wind speed <10 km h−1), due to intermittent light rainfall events making the weeds wet in the preceding week. In the second year, treatments were applied to Peccavi on September 12, 2023, and Paganin on September 14, 2023 (18.7 and 19.1 C maximum temperature, wind speed < 20 km h−1), with all herbicides applied on September 14, 2023. Volumetric soil moisture was high at all sites due to rainfall on the day of treatment or in the preceding week (Table 1).
Viticulture Experiment Assessments and Analysis
The first measurements were taken at the time of weed control treatment (September 15 to 16, 2022, or September 12 to 14, 2023). Soil moisture to a depth of 12 cm was recorded once in each plot (HydroSense II Handheld Soil Moisture Sensor, Campbell Scientific Australia, Garbutt, QLD, Australia). Weather data were obtained from the nearest weather station (Jindong station 009978; Bureau of Meteorology 2023). Soil characteristics were assessed by taking 20 soil cores to a depth of 10 cm with a 4-cm auger in a “W” transect through each site, bulking the sample, and sending it for analysis (CSBP Soil and Plant Analysis Laboratory, Bibra Lake, WA, Australia). A visual assessment of weed species incidence (percent cover of each species) was taken from each plot. A normalized difference vegetation index (NDVI; GreenSeeker handheld crop sensor, Trimble Agriculture, Canning Vale, WA, Australia) assessment of the vines was taken once in each plot, using a white sheet to provide a uniform background behind the vines, as a standard method of determining vine health (Mazzetto et al. Reference Mazzetto, Calcante and Mena2009). The second measurements were taken on September 27 to 28, 2022, and September 20 to 21, 2023, and included NDVI of the vines, as for the first measurement time. The NDVI of the weeds was also assessed three times in each plot by holding the unit directly over the ground (and weeds) at a height of 1 m. Because the ground was almost entirely covered in weeds at each site, NDVI was used to assess plant senescence, as this value indicates the level of green on a patch of land (i.e., the spectral reflectance measurements acquired in the red and near-infrared regions) and has previously been correlated with plant biomass (Meng et al. Reference Meng, Du and Wu2011). It was expected that plant green biomass would change at 1 wk and 5 wk after the application of weed management techniques due to plant senescence. The third measurements were taken on October 19 to 20, 2022, and October 17 to 18, 2023, and again included vine and weed NDVI. At the third measurement time, when weed senescence was complete, weed aboveground biomass was assessed from two quadrats (25 cm by 50 cm) per plot, dried at 60 C in an oven for 3 d, and weighed. Weed biomass was not assessed at the second measurement time, because plant senescence via glyphosate or electric weed control was unlikely to be complete at 2 wk after application (CNH 2023; Nufarm Australia 2023). A visual assessment of weed species incidence (percent ground cover) was also taken at the third measurement time.
An ANOVA was used to analyze the experiments in GenStat (VSN International 2024), using general ANOVA, with an appropriate treatment structure and block structure for each data set (with treatment and block structure specified here as the code applied in GenStat). For the weed biomass analysis, the treatment structure for the general ANOVA was experiment*treatment and the block structure was experiment.replication/treatment/quadrat sample. However, due to the magnitude of the variation in biomass between sites, a one-way ANOVA was also applied to each site, using treatment as the factor and replication as the block structure. For the general ANOVA applied to the vine NDVI values, the treatment structure was experiment*treatment*time and the block structure was experiment.replication/treatment/time. For weed NDVI values, a joint analysis between sites was not valid due to high variance. NDVI values are affected by the color of the soil, which varied between sites. The amount of soil visible was also variable between the first and second assessment times, due to plant senescence following weed control treatments. While this affected the weed measurements, it was not relevant to the vine NDVI measurements, as they were taken against a uniform backdrop (Mazzetto et al. Reference Mazzetto, Calcante and Mena2009). As a result, weed NDVI values were analyzed separately across sites and measurement times, using treatment as the treatment structure and replication/treatment/sample as the block structure within the general ANOVA. For all analyses, residual plots were used to confirm a normal distribution of the data, and no data transformation was necessary. Means were separated by least significant difference (P < 0.05) and letters after means were added to indicate significant differences. The visual biomass assessment could not be subject to valid analysis, as the non-dominant weed species at each site were at low density, and distribution was irregular.
Fire-Risk Experiment
To assess the potential fire risk of electric weed control, two experiments were established as a split-plot design, with application speed as the main plot factor and dry plant biomass weight as the subplot factor, with three replications. The experiments were conducted at the same time at the Department of Primary Industries and Regional Development Northam (31.6523°S, 116.6938°E). The first experiment used barley (Hordeum vulgare L.) straw and the second experiment used oat (Avena sativa L.) hay (Avon Valley Stockfeed & Landscaping Supplies, Northam, WA, Australia). Barley straw consisted of plant stems after harvest. Oat hay consisted of biomass from the entire aboveground plant biomass, including plant stems and seed husks. The weight of the biomass samples was 50, 250, 450, and 650 g m−2 (i.e., 500 to 6,500 kg biomass ha−1). Each biomass sample was evenly spread over a bare 1-m2 plot. The biomass samples were dry at the time of use (i.e., harvested dry and then stored in an un-air-conditioned glasshouse). The weight of the biomass samples was selected to mimic dry residue levels found in a cropping system (Borger et al. Reference Borger, Riethmuller, Ashworth, Minkey and Hashem2015). However, biomass was low enough that the samples were all lying flat on the ground and not creating a “heaped” pile of biomass where some biomass would be shielded and not have contact with the electrodes on the applicator. The samples were spread by a team of three staff members, one replication at a time, directly before electric weed control treatment, to ensure minimal time between placing samples in the field and treating samples. This ensured that biomass samples were still dry at treatment and did not have opportunity to absorb moisture from the environment. An XPower with XPU applicator was driven over the biomass at a speed of 1, 3, or 5 km h−1 (August 5, 2022). The XPU applicator delivers the same power output as the XPS applicator (with the same 12 inverters delivering a maximum of 3 kW each) used in the earlier experiment, but has a single 1.2-m-wide applicator, rather than two separate 55-cm applicators (as for the XPS applicators) (Figure 2).
During the electric weed control applications, visual assessment of the dry biomass in real time was used to count the number of burning points in the 1-m2 area, including smoldering biomass with smoke evident or open flames. There was no other vegetation around the dry biomass samples to ensure a clear visual assessment of the biomass (and burning points). Samples were observed for 20 s after application, but no other fires started beyond those caused by the initial application (i.e., physical contact between the electrodes and the straw). All fires went out naturally and very quickly due to the damp soil. Although the biomass samples were dry at the time of application, the topsoil was wet due to 11.9 mm of rainfall in the 24 h before the experiment. At the time of application, ambient temperature was 14.5 C and relative humidity was 69% (climatic data obtained from Northam, WA, weather station 10111; Bureau of Meteorology 2023). The experiment was conducted in cold conditions after rainfall to ensure that any fires in the dry biomass samples could not spread beyond the 1-m2 plots. Power output averaged over the 12 inverters and speed of operation were recorded by the XPower machine.
Data from the two trials were analyzed collectively, using general ANOVA. The treatment structure included biomass type, speed of application, and biomass weight and a block structure of biomass type*replication/speed/biomass weight. Average power or average number of burning or smoldering points in the biomass were the response variables. Means were separated by least significant difference (P < 0.05), and residual plots were used to assess the distribution of the data (a data transformation was unnecessary). Letters after means were added to indicate differences where treatment effects were significant.
Assessment of Dry Plant Biomass Surface Area
A dry sample of plant biomass was taken from each experiment. For “Weed Control in Viticulture,” this included three samples predominately containing rigid ryegrass (Lolium rigidum Gaudin) or kikuyugrass (Pennisetum clandestinum Hochst. ex Chiov.) in 2022 and longflowered veldtgrass (Ehrharta longiflora Sm.) or California burclover (Medicago polymorpha L.) and L. rigidum in 2023. For “Fire-Risk Experiment” this included three samples of the barley straw or oat hay. The subsamples of 1.72 g (50 g m−2) of each plant biomass type were placed in trays of 24.3 cm by 14.2 cm and scanned using Epson Perfection V850 Pro (Epson, Macquarie Park, NSW, Australia). Scans were analyzed using ImageJ (University of Wisconsin, Madison, WI, USA) to determine the total surface area of the biomass in each sample. The sample size was restricted to 50 g m−2 to coincide with the smallest biomass treatment within “Fire-Risk Experiment.” In a larger sample (i.e., 250 to 650 g m−2 in “Fire-Risk Experiment” or field values obtained in 2023 of “Weed Control in Viticulture”), the plant residue overlaps, and it is not possible to conduct an accurate assessment of biomass surface area. The means were compared using an unpaired two-sample t-test.
Results and Discussion
Weed Control in Viticulture
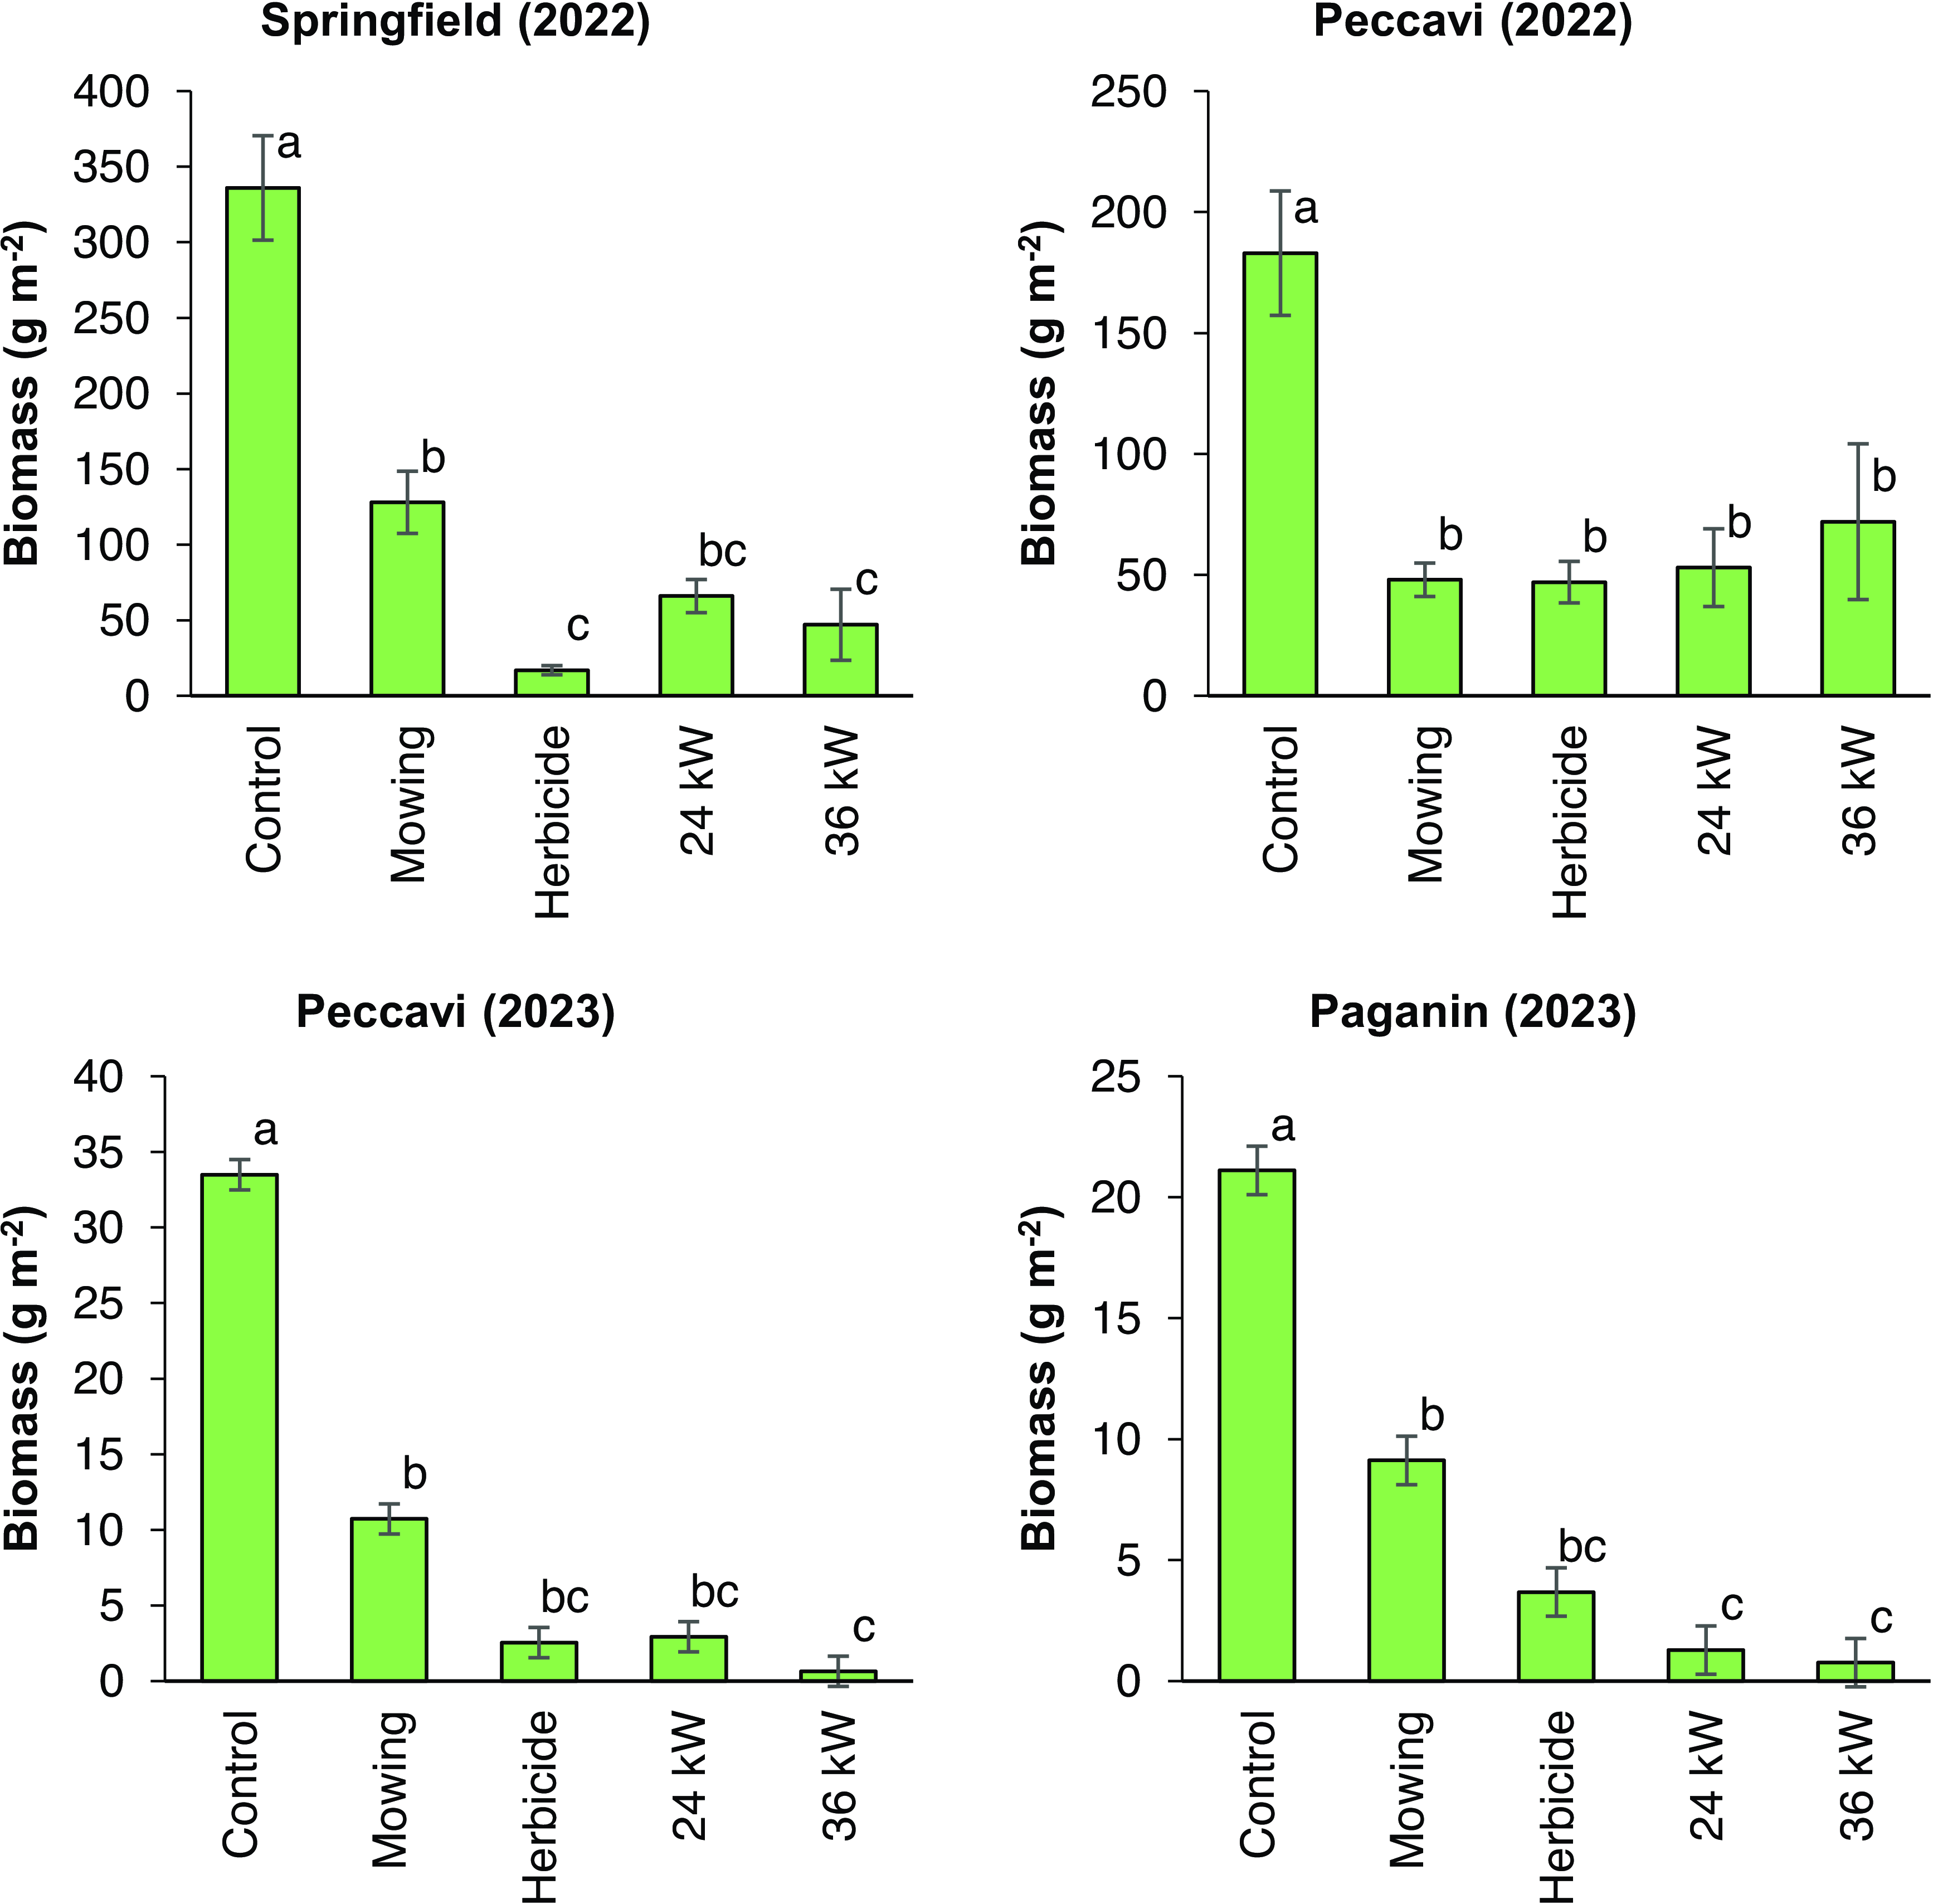
At all sites, weed biomass was significantly reduced following the application of the weed control treatments compared with the control, and weed biomass was equivalent for electric weed control or herbicide treatments (Figure 3). There was a significant effect of site, as Springfield had greater average biomass than the other three sites (118.7, 80.5, 80.5, and 57.5 g biomass m−2 at Springfield 2022, Peccavi 2022, Peccavi 2023, and Paganin 2023, respectively, P = 0.007, LSD = 30.2). Treatment was highly significant (P < 0.001, LSD = 36.9) as the biomass was generally higher in the control plots (239.0 g m−2), followed by mowing (83.5 g m−2), with similar biomass in the 24-kW, 36-kW, and herbicide treatments (38.3, 32.4, and 28.2 g m−2). There was a significant interaction between site and treatment (P = 0.027, LSD = 71.2; Figure 3), with regrowth after mowing greatest at Springfield 2022. The predominant species at Springfield 2022, P. clandestinum, has a perennial growth habit and spreading stolons and rhizomes that allow it to resprout more easily than the tussock grasses or broadleaf species following mowing or grazing (Castillo Sierra et al. Reference Castillo Sierra, Cerón-Souza, Avellaneda Avellaneda, Mancipe Muñoz and Vargas Martínez2023; Table 2).
Weed biomass (taken at the third measurement time) following application of mowing, herbicide, or electric weed control at 24 or 36 kW at Springfield 2022 (P < 0.001, LSD = 75.8), Peccavi 2022 (P = 0.008, LSD = 74.3), Peccavi 2023 (P < 0.001, LSD = 8.36), and Paganin 2023 (P < 0.001, LSD = 7.24), where vertical lines indicate the SE of eight replications and different letters indicate means that are significantly different.
The visual assessment (data not presented) indicated that treatments controlled all weed species indiscriminately, with no individual species surviving to a greater extent than others. At those sites where weeds regrew after mowing, both grass and broadleaf species resprouted, except at Springfield, where only the P. clandestinum resprouted. There were no sites with 100% weed control (i.e., zero biomass), even after herbicide application, because the high plant density allowed some plants to be shielded by others. All weed control techniques would have higher efficiency against younger weeds or less dense vegetation, but as stated, spring is the most common time to apply weed control in vineyards in southern Australia, and the treatments (i.e., herbicide or mowing/grazing) applied were common industry practice in the region (Nordblom et al. Reference Nordblom, Penfold, Whitelaw-Weckert, Norton, Howie and Hutchings2021). The potential differences in efficacy of electric weed control against different species that were raised in the “Introduction” were not observed in the current research. As stated, a slow application speed was selected, according to manual specifications, to allow control of mature grass species. Therefore, if the speed of application was faster (i.e., delivering a lower dose of electrical current), there might have been a difference in control between individual species. Further research is required to determine the efficacy of electric weed control against different species at varying application speeds (Slaven et al. Reference Slaven, Koch and Borger2023).
In 2022, herbicide application was later than electric weed control, evident in the higher weed NDVI values at the second assessment time (Tables 4 and 5). At the third assessment, the NDVI assessments of weed growth indicated that all treatments had fewer weeds than the control. There was no significant difference between electric weed control at 24 kW or 36 kW and herbicide at Peccavi, although the herbicide treatment at Springfield had a lower NDVI than the 24-kW electric treatment. Mowing at both sites had higher weed NDVI than electric weed control or chemical treatments.
The normalized difference vegetation index (NDVI) values for the weeds at the second and third measurement time, in 2022 (following application of mowing, herbicide, or electric weed control at 24 or 36 kW).a
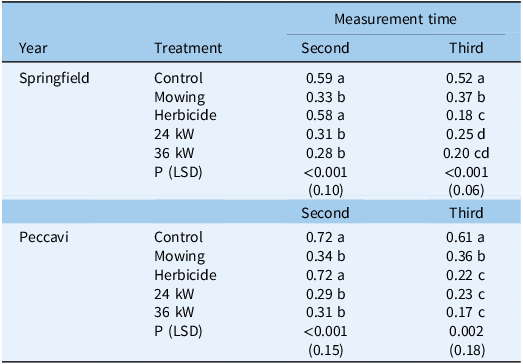
a The probability and least significant difference (LSD) values from the analysis are presented (letters are included for means separation).
The normalized difference vegetation index (NDVI) values for the weeds at the second and third measurement time, in 2023 (following application of mowing, herbicide or electric weed control at 24 or 36 kW).a
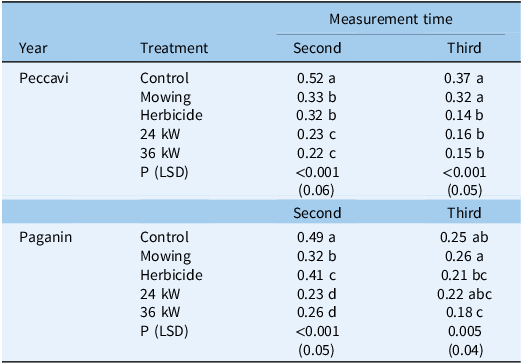
a The probability and least significant difference (LSD) values from the analysis are presented (letters are included for means separation).
In 2023, after 1 wk, the NDVI assessments of weed growth indicated that all treatments had fewer weeds than the control (Tables 4 and 5). Significantly lower NDVI values were observed in the electric weed control treatments compared with the herbicide and mowing applications. At 5 wk, the NDVI of the weeds in the control and mowing treatments were statistically similar at both sites, likely due to regrowth after the mowing treatments. However, the electric weed control treatment at 24 kW at Paganin was also similar to the control. At this sampling time, electric weed control at 36 kW and the herbicide treatment offered the greatest reduction in NDVI compared with the control.
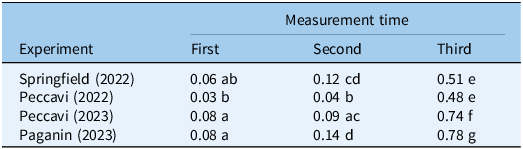
The NDVI assessments of the vines indicated a significant impact of site and time, with a significant interaction between these factors, as values increased with each measurement time. As stated, vines were at budbreak to initial shoot growth at the time of treatment, so initial NDVI values were very low (i.e., very little green biomass on the plants). As the foliage developed from assessment time 1 to 3, all sites exhibited increased NVDI values (Table 6). Treatment did not significantly impact NDVI at any site or at any measurement time (P = 0.732; Table 7).
The normalized difference vegetation index (NDVI) values for the vines at the first (day of weed control treatment), second, and third measurement times, for each experiment (P < 0.001, LSD = 0.031, letters are included for means separation).
The normalized difference vegetation index (NDVI) values for the vines at the first (day of weed control treatment), second, and third measurement times following application of mowing, herbicide, or electric weed control at 24 or 36 kW, in 2022 and 2023.a
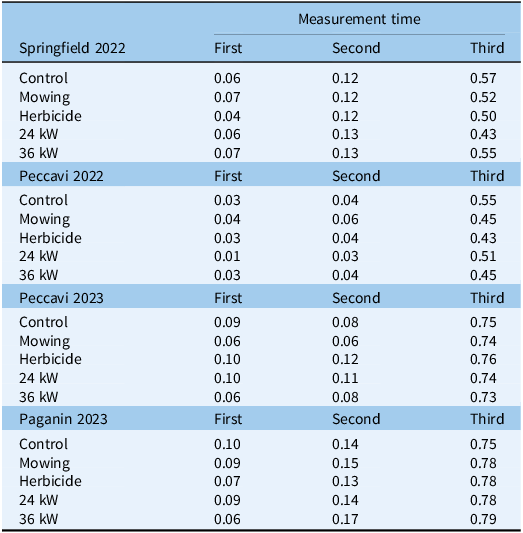
a There were no significant differences between treatments.
Electric weed control has not previously been assessed by the scientific literature in comparison to other weed control techniques in spring vineyards, but it provided weed control efficiency comparable to that of other chemical and mechanical control tactics commonly used in these systems. Further, there was no evidence of damage to the vines. Electric weed control will be a beneficial tactic within weed management programs. It will be of particular importance for those vineyards where herbicide resistance is increasingly problematic and for organic growers, with 6.2% of global viticulture under organic production in 2019 (Slaven et al. Reference Slaven, Koch and Borger2023; Tucker et al. Reference Tucker, Dumitriu and Teodosiu2022). Tesic et al. (Reference Tesic, Keller and Hutton2007) compared a range of vineyard floor management tactics (i.e., management of the soil under the vines). They found that cover cropping in vineyards affected soil moisture and vine yield in the long term (i.e., the third and fourth years of the experiment), particularly in hot, dry conditions (i.e., Mediterranean climates). By comparison, bare ground following herbicide application or partial cover by mowing three to four times per season had higher yield, higher cluster number, and higher berry weight. The bare ground treatment also had faster shoot growth and increased shoot length, and vines had denser canopies compared with the cover cropping or partial cover treatments (Tesic et al. Reference Tesic, Keller and Hutton2007). They found that bare ground using systemic herbicides was the best way to preserve soil moisture and yield. The electric weed control treatments in the current experiments had the advantage of reducing biomass similar to a herbicide treatment, but the current research did not have the capacity to assess vine yield or potential long-term damage from the weed control treatments as completed by Tesic et al. (Reference Tesic, Keller and Hutton2007), and further research is required. Vine yield can be highly variable, and plots of lengths >10 m would be required for accurate assessment.
As stated, plants and surface soil were moist in both years (22% to 27% volumetric water content), to the extent that the rainfall delayed application of the herbicide treatment in 2022 (Table 1). It has been theorized that high surface soil moisture levels would reduce electric weed control efficiency. When soil moisture increases, the soil’s resistance decreases, making it easier for the electric current to dissipate out of the roots of the target plant in contact with the electrodes (Bauer et al. Reference Bauer, Marx, Bauer, Flury, Ripken and Streit2020). This may potentially reduce damage to the targeted weed and maximize any potential harm to roots of surrounding (non-target) vegetation or soil biota (Bauer et al. Reference Bauer, Marx, Bauer, Flury, Ripken and Streit2020; Slaven et al. Reference Slaven, Koch and Borger2023; Vigneault and Benoit Reference Vigneault, Benoit, Vincent, Panneton and Fleurat-Lessard2001; Vigneault et al. Reference Vigneault, Benoit and McLaughlin1990). However, at the selected speed of 1.1 km h−1, there was no evidence of either reduced weed control or damage to vines. In both years, the leaf development (NDVI values of the vines) after electric weed control was similar to that of the control. Weed control was comparable to that achieved by the other, regionally appropriate weed control tactics. It was not the purpose of this research to assess the impact of varying levels of soil moisture on electric weed control. Alternative studies have noted an impact of soil moisture on electric weed control, with optimal results in dry conditions (Lati et al. Reference Lati, Rosenfeld, David and Becharb2021; Mizuno et al. Reference Mizuno, Tenma and Yamano1993; Vigoureux Reference Vigoureux1981). However, these studies use much earlier versions of commercially available electric weed control devices (Vigoureux Reference Vigoureux1981) or experimental prototypes (Lati et al. Reference Lati, Rosenfeld, David and Becharb2021; Mizuno et al. Reference Mizuno, Tenma and Yamano1993). Borger and Slaven (Reference Borger and Slaven2024a) noted reduced L. rigidum control in conditions of high soil moisture, which may have resulted from the dispersal of the current. However, it is also possible that reduced weed control in moist soil occurs because it is easier for weeds in moist soil to recover from management tactics or resprout (Borger and Slaven Reference Borger and Slaven2024a). Further research is required on the impact of soil moisture on electric weed control, which will likely be affected by soil type, water-holding capacity, and plant water content (Slaven et al. Reference Slaven, Koch and Borger2023).
As stated, the selected application speed of 1.1 km h−1 provided control comparable to that of other weed control tactics. It was not the purpose of this research to investigate weed control at greater application speeds; the unit was used according to the manufacturer’s recommendations (CNH 2023). Power output was greater at both 36- and 24-kW treatments in 2022 than in 2023. However, power drawn through the applicator relates to weed size and density, and weed biomass was greater in the control plots of the 2022 sites than in the 2023 sites (Slaven and Borger Reference Slaven and Borger2024; Figure 3). It is possible that commercially acceptable control could have been achieved at application speeds of 2 or 3 km h−1, and more research is required into the interaction between application speed and weed species, age, and density. Regardless, the maximum potential application speed is low compared with the application speed for herbicide or mowing/slashing. However, a wide range of autonomous machines have been introduced to agriculture, both to reduce the human labor component and improve sustainability due to greater precision of pest control (Yuan et al. Reference Yuan, Ji and Feng2023). In the viticulture industry, autonomous vehicles for pest control are being trialed, including autonomous robots designed for “over the row” vineyard floor management, mowing, and green on green weed detection sprayer systems (Nordestgaard Reference Nordestgaard2020). Further, autonomous tractors with the three-point rear linkage required by the XPower supply unit with XPS applicators have already been introduced to the viticulture industry (Nordestgaard Reference Nordestgaard2020). The use of autonomous tractors in conjunction with electric weed control will partially negate the disadvantage of slow application speeds (Nordestgaard Reference Nordestgaard2020; Yuan et al. Reference Yuan, Ji and Feng2023).
Weed Control Fire Risk and Dry Plant Biomass Surface Area
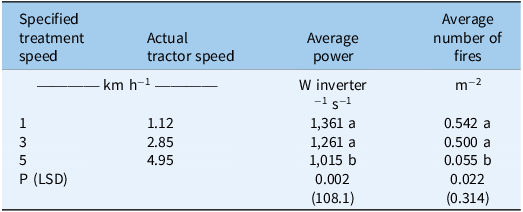
The average power delivered by the unit decreased with increasing speed of operation (as greater speed equates to a lower dose of electrical current due to reduced electrode contact time; Table 8). Power output was not affected by the biomass type or weight. There was an overall average of 0.365 incidences of smoke/open flames m−2 in the dry biomass plots. The number of fires diminished with increasing speed of operation (Table 8) but, as for power output, was not affected by biomass type or biomass weight.
Average speed of the tractor for each treatment, average power output per inverter, and total number of fires, averaged over plant biomass type.a
a The probability and LSD values from the analysis are presented (letters are included for means separation).
The assessment of biomass indicated that most residue types had a similar total surface area (Table 9). The exception was E. longiflora biomass samples taken from the Peccavi 2023 experiment, which had a greater surface area than the barley straw (P = 0.004; Table 9), oat hay (P = 0.006), and L. rigidum (P = 0.011) from the Peccavi 2022 experiment.
The experiment (“Fire-Risk Experiment” or each of the sites from “Weed Control in Viticulture”), type of residue, and average total surface area (with SE) of the residue sample.
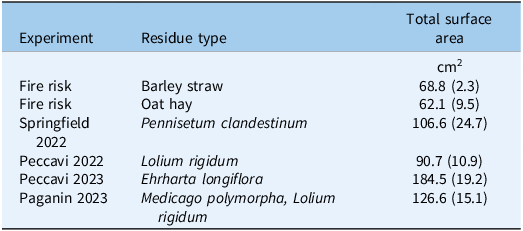
Electric weed control poses a significant risk of fire when operating on dry plant biomass, as is commonly found covering the ground during autumn weed control in the Mediterranean climate of southern Australia. Other studies have raised the potential of fire risk for electric weed control without investigating likelihood (Lehnhoff et al. Reference Lehnhoff, Neher, Indacochea and Beck2022). This is the first study quantifying fire risk, but it should be noted that in every field experiment in spring (September), there were zero fires, and this is the most common time of year for viticulture weed management. Therefore, operation in winter or spring poses minimal fire risk. Fire risk was not related to total plant biomass weight or type, but rather to speed of operation and the resulting contact time with electrodes. However, in the current study, the oat hay and barley straw had similar total surface areas (62.1 and 68.8 cm2, respectively). The senesced remains of the weeds from the Peccavi 2023 experiments had a higher surface area (182.4 cm2) than other residue types, and fire risk may be higher when operating at this site in dry conditions. Further research is needed to confirm the impact of residue type, but generally the surface areas of the weeds found in the trial sites were comparable to those of the barley straw and oat hay tested in the current experiment and likely have similar fire risk when dry. It is the recommendation of this study that electric weed control is suitable for use in winter/spring weed management within the Mediterranean climate but not for control of summer or autumn weeds.
Here we show for the first time that electric weed control in viticulture has efficiency comparable to that achieved by herbicides. This is also the first study to quantitively assess the fire risk from electric weed control. More research is required on the impact of soil moisture on electric weed control. Research is likewise required on the control of varying weed species at diverse developmental stages and densities and at greater application speeds. However, with the spread of herbicide resistance and the increasingly negative public perception of herbicide use, it is likely that electric weed control will provide a viable alternative weed management tactic for the viticulture industry and other horticultural or agricultural industries. This tactic cannot solve all weed management issues, and as highlighted, some species will likely be more susceptible to electric weed control than others. Overreliance on electric weed control or any other strategy may result in a shift to those species with higher natural tolerance or may result in existing species adopting those traits or growth habits that increase resistance (Slaven et al. Reference Slaven, Koch and Borger2023). Therefore, integrated weed management strategies remain best practice, and further research is required to determine how electric weed control will be integrated with other control practices in a weed management program.
Acknowledgments
This research resulted from the project “What Is the Best Fit for Electric Weed Control in Australia?” and represents a collaboration between Department of Primary Industries and Regional Development Western Australia and CNH (working with ZassoTM), Grains Research and Development Corporation, Wine Australia, Cotton Research and Development Corporation, and AHA Viticulture. The authors are grateful to the owners of the viticulture estates, Dave Nicholson and Nerys Wilkins (DPIRD, experimental support), Andrew van Burgel (DPIRD, biometrics support), Alex Douglas and Richard Fennessy (DPIRD) for reviewing the paper, and Sina Nouraei (University of Western Australia) for creating images of the power supply unit and applicators.
Funding statement
The project was funded by Department of Primary Industries and Regional Development Western Australia (funding from Royalties for Regions Science Partnerships), CNH, Grains Research and Development Corporation, Wine Australia and Cotton Research and Development Corporation.
Competing interests
CNH (working with ZassoTM) provided machinery to be used in this research. CNH did not direct research aims or edit/restrict research findings.


 Open access

