


Introduction
Developing methods to measure the small-scale mechanical behavior of materials at high strain rates would be highly beneficial to a broad range of technical applications. These include providing improved mechanical properties as input for crash simulations, the development of new types of armor and impact-resistant materials, and enhancing the properties of cutting tools and materials used under extreme machining conditions such as forming, cutting, and piercing. Small-scale, high-rate testing would also allow for the selective characterization of coatings and individual material phases, which are too small for the reference macroscopic methods (split Hopkinson pressure bar [Reference Kolsky1, Reference Lindholm2, Reference Chen and Song3], Taylor cylinder impact [Reference Taylor4], and pressure-shear plate impact [Reference Klopp, Clifton and Shawki5]). From a scientific point of view, small-scale measurements could also be used to experimentally validate atomistic simulations since they are inherently restricted to small volumes and high strain rates [Reference Brandl, Derlet and Swygenhoven6, Reference Amodeo, Begau and Bitzek7, Reference Houllé, Walsh, Prakash and Bitzek8].
Although most nanoindentation testing to date has been performed at strain rates below about 0.1 s−1, a great deal of research activity has recently focused on extending the technique to high strain rates [Reference Phani and Oliver9, Reference Guillonneau, Mieszala, Wehrs, Schwiedrzik, Grop, Frey, Philippe, Breguet, Michler and Wheeler10, Reference Zehnder, Bruns, Peltzer, Durst, Korte-Kerzel and Möncke11, Reference Zehnder, Peltzer, Gibson and Korte-Kerzel12, Reference Wheeler, Dean and Clyne13, Reference Beake, Smith and García14, Reference Somekawa and Schuh15, Reference Kermouche, Grange and Langlade16, Reference Wheeler and Gunner17]. A significant part of that research makes use of impact testing, which produces ballistic strain rates (≥1000 s−1) at the time the indenter makes initial contact with the sample [Reference Zehnder, Peltzer, Gibson and Korte-Kerzel12, Reference Wheeler, Dean and Clyne13]. However, these strain rates are not sustained throughout the indentation process, and as a result, indentation deformation and plasticity take place under varying strain rate conditions. This then means that the apparent measured hardness represents a combination of strength experienced at different strain rates, making interpretation of experimental data rather complex.
To address this issue, the work presented here seeks to extend the range over which nanoindentation measurements of hardness can be made under constant indentation strain rate conditions (CSR). The focus will be on indentations made with geometrically self-similar indenters like the Berkovich triangular pyramid often used in nanoindentation experiments. For these indenters, the indentation strain rate is conveniently defined as  $\dot \varepsilon = {{\dot h} \mathord{\left/ {\vphantom {{\dot h} h}} \right. \kern-\nulldelimiterspace} h}$, where $\dot h$ is the indenter velocity and h is the depth of penetration of the indenter into the specimen [Reference Lucas and Oliver18]. Usually, CSR experiments rely on dynamic measurement capabilities of the nanoindentation system, also referred to as the “continuous stiffness measurement” (CSM) method. In this technique, a small sinusoidal oscillation is applied to the force and the displacement oscillation at the same frequency that is monitored by a lock-in amplifier [Reference Hay, Agee and Herbert19]. This technique makes it possible to measure the stiffness, and hence the hardness, continuously as the indenter is pushed deeper and deeper into the material while maintaining a constant indentation strain rate. This is of great advantage compared with quasi-static stiffness measurements from peak unloading, which occur under varying strain rates and can affect the hardness evaluation [Reference Leitner, Maier-Kiener and Kiener20]. Unfortunately, CSM measurements are currently limited to strain rates of about 1 s−1 because of the recently reported “plasticity error”—a measurement error that develops when the rate of loading is so fast that a significant portion of the deformation in one oscillation cycle of the CSM measurement is plastic [Reference Merle, Maier-Kiener and Pharr21, Reference Merle, Higgins and Pharr22]. This is a significant problem since current methods of analysis of CSM data to extract the hardness, H, and elastic modulus, E, are based on the assumption that deformation during the small CSM oscillation is entirely elastic. Thus, to achieve higher strain rates while retaining constant strain rate conditions, new measurement schemes are required.
Here, we explore one such scheme that is based on a prior knowledge of the reduced elastic modulus of the material. In most circumstances, this is not an obstacle because the reduced modulus can be easily measured by standard nanoindentation methods. Knowing the modulus eliminates the need for CSM measurements of stiffness, which in turn facilitates CSR measurements to much higher strain rates. The method is described and explored by nanoindentation testing of fused silica, nanocrystalline nickel, coarse-grained aluminum, and superplastic Zn22Al at indentation strain rates up to 100 s−1. At rates greater than this, other issues related to the operation of the testing system limit the applicability of the method for reasons that are also documented and discussed.
Results
A new method for high strain rate hardness measurements
The basic principle underlying the new method is simple: if the reduced elastic modulus of the material is known, then the basic equations used to extract hardness from nanoindentation load–displacement data obtained under constant strain rate loading conditions can be used to continuously measure the hardness without CSM measurements of the contact stiffness. To be precise, the elastic property needed for this purpose is the reduced elastic modulus, E r, defined as
 $${1 \over {E_{\rm{r}} }} = {{1 - \nu ^2 } \over E} + {{1 - \nu _{\rm{i}}^2 } \over {E_{\rm{i}} }}\quad ,$$
where E and ν are Young's modulus and Poisson's ratio for the sample, respectively, and E i and νi are the same quantities for the indenter [Reference Oliver and Pharr23]. Preliminary knowledge of the reduced modulus is hardly ever an obstacle, as it is independent of the applied strain rate and can therefore be easily measured by conventional nanoindentation techniques.
With a known reduced modulus, E r, the method follows directly from the standard Oliver–Pharr [Reference Oliver and Pharr23, Reference Oliver and Pharr24] equations that are routinely used to relate the contact stiffness, S, and the contact depth, h c, to the indentation load, P, and the indenter displacement, h:
 $$S = 2 \cdot \beta \cdot E_{\rm{r}} \cdot \sqrt {{{A_{\rm{c}} } \over \pi }} \quad ,$$
 $$h_{\rm{c}} = h - \varepsilon {P \over S}\quad .$$
Here, A c is the tip area function, defined as,
 $$A_{\rm{c}} \left( {h_{\rm{c}} } \right) = m_0 h_{\rm{c}}^2 + m_1 h_{\rm{c}} + m_2 h_{\rm{c}}^{{1 \mathord{\left/ {\vphantom {1 2}} \right. \kern-\nulldelimiterspace} 2}} + m_3 h_{\rm{c}}^{{1 \mathord{\left/ {\vphantom {1 4}} \right. \kern-\nulldelimiterspace} 4}} + \cdots + m_n h_{\rm{c}}^{2^{1 - n} } = \sum\limits_{i = 0}^n {} m_i h_{\rm{c}}^{2^{1 - i} } \quad ,$$
where β and ε are constants dependent on the indenter geometry, with values close to 1.0 and 0.75, respectively. In practice, three terms in the area function usually ensure sufficient accuracy and limit the complexity of the following computations. Combining Eqs. (2) and (3) so as to eliminate the contact stiffness, S, inserting Eq. (4) and using the permutation  $h_x = h_{\rm{c}}^{2^{1 - n} }$ yields
 $$\sum\limits_{i = 0}^n {\left( {m_i h_x^{2^n + 2^{n - i} } - 2m_i hh_x^{2^{n - 1} + 2^{n - i} } + m_i h^2 h_x^{2^{n - i} } } \right)} - {{\pi \varepsilon ^2 P^2 } \over {4\beta ^2 E_{\rm{r}} ^2 }} = 0\quad .$$
 This polynomial equation of degree 2n+1 can be solved numerically by, for instance, calculating the eigenvalues of the companion matrix or using a Newton–Raphson algorithm. The root associated with  $h_{\rm{c}} = h_x^{2^{n - 1} }$ closest to and lower than h is the desired solution. Other forms of the area function can be used, and in the case that the tip function consists of only a single term $m_0 h_{\rm{c}}^2$, the solution can be calculated analytically as
 $$h_{\rm{c}} = {1 \over 2}\left( {h + \sqrt {h^2 - {{2\varepsilon \cdot \sqrt \pi \cdot P} \over {\beta \cdot E_{\rm{r}} \cdot \sqrt {m_0 } }}} } \right)\quad .$$
In either case, once the contact depth h c is known, the experimental contact area at that point in the indentation process can be calculated by evaluating the area function at this depth, and the hardness follows from
 $$H = {P \over {A_{\rm{c}} }} = {P \over {\sum\limits_{i = 0}^n {m_i h_{\rm{c}}^{2^{1 - i} } } }}\quad .$$
If required, the value of the contact stiffness, S, can be obtained from Eq. (2).
Validation of contact depth calculation
To validate the proposed method, CSM measurements at moderate indentation strain rates of 0.05–0.2 s−1 were performed in fused silica and nanocrystalline nickel. A constant indentation strain rate was achieved by conducting the experiments at constant  ${{\dot P} \mathord{\left/ {\vphantom {{\dot P} P}} \right. \kern-\nulldelimiterspace} P}$, which produces constant indentation strain rates $\dot \varepsilon = {{\dot h} \mathord{\left/ {\vphantom {{\dot h} h}} \right. \kern-\nulldelimiterspace} h} = {{\dot P} \mathord{\left/ {\vphantom {{\dot P} {2P}}} \right. \kern-\nulldelimiterspace} {2P}}$ as long as the hardness does not vary significantly with depth [Reference Lucas and Oliver18], as is the case for both materials investigated here [Reference Oliver and Pharr23, Reference Feldner, Merle and Göken25]. The contact depth was subsequently evaluated by the standard Oliver–Pharr procedure based on the CSM stiffness data, as well as the new method [Eqs. (5)–(7)] using the P–h data alone and a reduced modulus from separate CSM measurements (see section “Methodology > Materials and equipment”). As shown in Fig. 1, the two methods of measurement agree extremely well (to within 0.1%) for both materials. The small irregularities visible in Fig. 1(a) correspond to the usual experimental noise in the CSM stiffness data and are not related to the new analysis procedure.
Comparison of the contact depth calculated from Eq. (5) with a direct CSM measurement for fused silica (a) and nanocrystalline nickel (b). The measurements were performed at moderate indentation strain rates of 0.05–0.2 s−1 so that the CSM plasticity error is not significant [Reference Merle, Maier-Kiener and Pharr21].

High strain rate hardness measurements
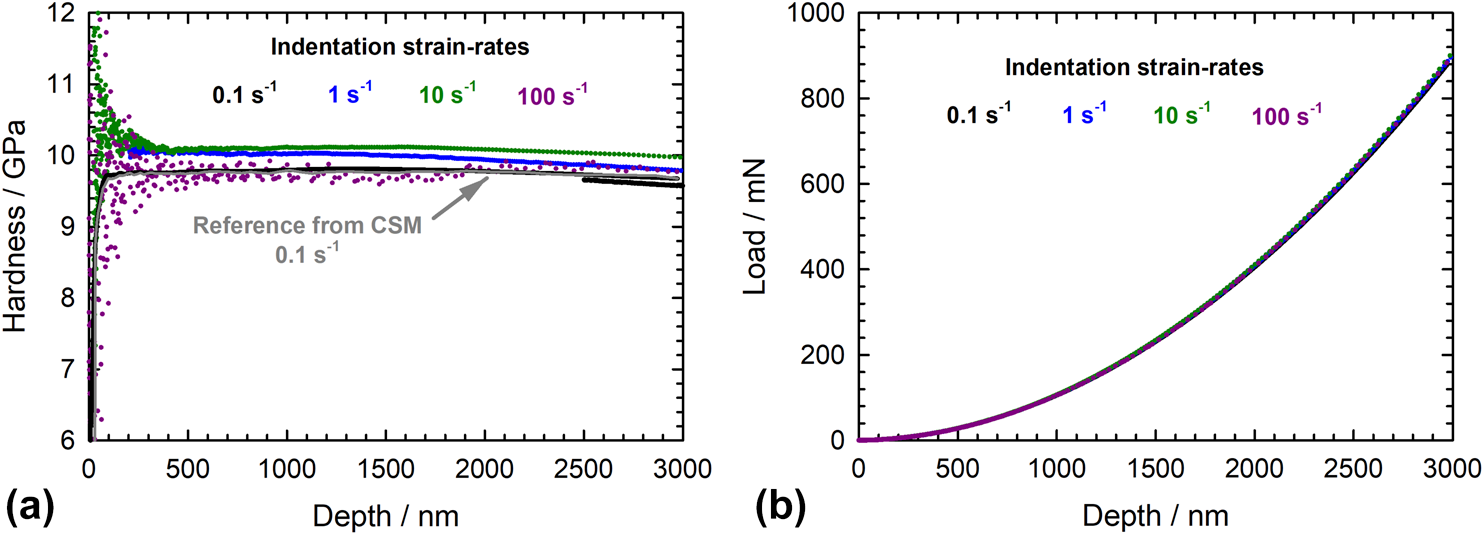
The new procedure was applied to fused silica, which is generally considered a strain rate insensitive amorphous material. The sample was indented at constant indentation strain rates between 0.1 s−1 and 100 s−1 with an iMicro nanoindentation system (KLA, Inc.) using an InForce1000 actuator head (1000 mN force capacity) and a very high data acquisition rate of 100 kHz to record the raw load and displacement signals. The load data were corrected for inertial and damping forces (see section “Methodology > Damping and inertial forces”) and filtered by a Savitzky–Golay [Reference Savitzky and Golay26] procedure to reduce the noise. As expected, the data shown in Fig. 2(a) reveal only limited hardness variations between strain rates of 0.1 s−1 and 100 s−1. These variations do not follow any clear trend and must be related to dynamic machine effects. More importantly, the hardness at large depths (>2000 nm) always remains within 5% of the reference value measured by separate conventional CSM measurements at the standard strain rate of 0.1 s−1. The only clear effect of increasing the strain rate is a larger scatter within the data of a given test. At strain rates greater than 100 s−1, the scatter and noise increase to the point that accurate measurements are not possible. This behavior results from hardware limitations that are documented in the next section. Apart from this, the experiments on fused silica validate the new hardness calculation approach at high strain rates.
(a) Hardness of fused silica from individual CSR experiments between 0.1 s−1 and 100 s−1, evaluated from Eq. (7) using the 100 kHz load–displacement data and the known reduced modulus; (b) the raw P–h data filtered by the Savitzky–Golay procedure before the hardness evaluation.

Following the validation in fused silica, the new approach was applied to a set of representative metallic materials. The first one was a coarse-grained aluminum specimen from a previous publication [Reference Merle, Higgins and Pharr22] in which it was shown that conventional CSM measurements of hardness break down and produce unrealistically high hardness values at strain rates of about 1 s−1 and higher, due to the CSM plasticity issue. In sharp contrast, the data in Fig. 3(a) show that the new approach yields almost constant values of hardness up to a strain rate of 100 s−1. This is in agreement with the general expectation that coarse-grained face-centered cubic metals are hardly strain rate sensitive [Reference Maier, Merle, Göken and Durst27]. The new method also allows for valid measurements on strain rate sensitive materials, such as the superplastic alloy Zn22Al and nanocrystalline Ni. The Zn22Al data—shown in Fig. 3(b)—exhibit a progressive hardness saturation at strain rates greater than approximately 1 s−1, which is in agreement with a gradual decrease of its strain rate sensitivity in the regime 3 of classical superplasticity [Reference Langdon28, Reference Feldner, Merle and Göken29]. The data on nanocrystalline nickel are slightly noisier [see Fig. 3(c)]. This is possibly a consequence of local porosity inside the sample, which also affects CSM tests at conventional strain rates. Nonetheless, the measurements show a marked slowdown of the strengthening rate above 1 s−1. A similar trend is apparent in the micropillar compression data recently published by Guillonneau et al. [Reference Guillonneau, Mieszala, Wehrs, Schwiedrzik, Grop, Frey, Philippe, Breguet, Michler and Wheeler10].
Hardness of coarse-grained aluminum (a), superplastic Zn22Al alloy (b), and nanocrystalline nickel (c) samples. The values determined by the new calculation approach (based on the P–h data and the known reduced modulus) are compared with classical CSM-based measurements. The CSM data are flawed at high strain rates because of the plasticity error [Reference Merle, Maier-Kiener and Pharr21, Reference Merle, Higgins and Pharr22]. All hardness values were averaged between 2000 and 3000 nm indentation depth.

Discussion
Strengths and limitations of the new method
One of the main challenges associated with high strain rate hardness measurements is connected to the evaluation of the indentation contact depth, h c, from the measured force and displacement data. In the past, several empirical methods have been used to assess the amount of sink-in and subsequently subtract it from the total indentation depth to establish the contact depth. For instance, in one investigation, the pile-up/sink-in coefficient was assumed to be constant for the indented material with its magnitude determined from a slower experiment [Reference Phani and Oliver9], and in another, it was evaluated from finite element simulations [Reference Su, Herbert, Sohn, LaManna, Oliver and Pharr30]. For nanoindentation impact testing, models have been developed to assess the contact depth and hardness from the successive rebounds, with reportedly different outcomes [Reference Zehnder, Peltzer, Gibson and Korte-Kerzel12, Reference Wheeler, Dean and Clyne13, Reference Somekawa and Schuh15, Reference Wheeler and Gunner17]. The largest benefit of the new method is that the analysis is strictly performed along the lines of the Oliver–Pharr method [Reference Oliver and Pharr23, Reference Oliver and Pharr24], which implies that: (i) the magnitude of the sink-in is calculated independently of any assumption, so that a possible change in behavior with increasing strain rate is taken into account; and (ii) the results can be directly compared with existing values from the literature without need for any scaling correction. As a result, nanoindentation offers a broader strain rate range than almost any other mechanical characterization technique. As a matter of fact, the experiments reported in Fig. 3 span five orders of magnitude (10−3 to 102 s−1).
This is not the first time the Oliver–Pharr equations with a known elastic modulus have been used to achieve specific measurement goals. Indeed, as early as 1990, Joslin and Oliver noted that independent knowledge of the modulus allows one to eliminate the tip area function from the calculation procedures and make hardness measurements that fully account for pile-up [Reference Joslin and Oliver31]. These same ideas were later used by McElhaney et al. to carefully establish the indentation size effect in copper, i.e., the hardness as a function of indentation depth, in a manner that fully accounts for pile-up and sink-in [Reference McElhaney, Vlassak and Nix32]. However, to the best of our knowledge, this is the first time the approach has been used to circumvent the need for stiffness measurement. It should be noted that because the method depends on the contact depth determined via Eq. (3), which is based on an elastic solution in which material sinks in at the contact periphery, it will suffer from the same inaccuracies as the standard Oliver–Pharr method when the material piles up rather than sinks in [Reference Bolshakov and Pharr33]. Critical pile-up issues are, fortunately, restricted to the few materials combining a high E/H ratio and limited work hardening. Finally, because it is based on measurements of absolute load and displacement, it is not advisable to apply the new procedures in very slow deformation experiments (i.e., creep), which could be susceptible to thermal drift [Reference Maier, Merle, Göken and Durst27]. In this case, conventional CSM measurements are better suited.
Some care should be taken that the tip area function used in the calculations is monotonic over the indentation depth range, lest the mathematical inversion procedure return several likely values of the contact depth and hence the stiffness. In practice, tip area functions are usually sound as long as a reasonable number of terms are used in Eq. (4). Based on experience, about three terms and coefficients are usually sufficient for accurately describing the geometry of the tip, while limiting the complexity of the numerical back-calculation needed to determine the contact depth. If more coefficients are needed, it may be desirable to assure that all of them are positive so as to obtain a physically sound, monotonically increasing area function.
Strain rate limitations
In theory, the methodology described here for making continuous nanoindentation hardness measurements at high strain rates under constant strain rate conditions should hold at any strain rate. However, in practice, there are limits on the upper value based on limitations of the hardware of the nanoindentation testing system. Among the potentially important issues are the rate at which load and displacement data can be measured and recorded, the inherent time lag in the application of force and measurement of displacement due to the electronic and physical time constants of the instrument (as well as inertial and damping effects), and the discretization of electronic command signals by digital-to-analog converters (DACs). Here, we discuss how these factors limit the indentation strain rates that can be achieved in practice, focusing on the testing system used in this study—a KLA iMicro nanoindentation system with InForce 1000 (1000 mN capacity) and InForce 50 (50 mN capacity) actuator heads. These actuators are inherently force controlled, with constant indentation strain rates achieved by holding  ${{\dot P} \mathord{\left/ {\vphantom {{\dot P} P}} \right. \kern-\nulldelimiterspace} P}$ constant by means of electronics in the system. However, it is notable that the integrated circuit that controls these forces functions with a clock that operates at 1 kHz, and as will be shown shortly, this is the weak link in the system that ultimately limits the strain rates that can be achieved. To illustrate the capabilities and limitations of the iMicro, we will compare its performance characteristics to the older KLA G200 system.
Data acquisition rate
Very high strain rate measurements are possible only if the testing system allows for rapid measurement and recording of load and displacement data. This is not a limiting issue with the iMicro because recent modifications provide data acquisition rates up to 100 kHz, compared with 500 Hz for the G200. The data presented here were mostly obtained at a data rate of 100 kHz, meaning that data are recorded at 10 μs increments.
Measurement time constants
At least as important are the dynamic characteristics of the sensors and actuators used in the different nanoindenters (the capacitance gauge that measures displacement and the coil and magnet assembly that applies the force). For first-order linear time-invariant components, they are usually characterized by a time constant T c, which corresponds to the time needed to reach 1 − 1/e ≈ 63.5% of the steady-state value on exposure to a step stimulus [Reference Phani and Oliver9]. The time constants provided by the manufacturer for the iMicro and G200 are given in Table I. It is seen that the iMicro exhibits significantly smaller time constants than the older G200.
Dynamic properties, time constants, and processing rates of the measurement heads used in the iMicro and G200 nanoindentation testing platforms at Texas A&M University and Friedrich-Alexander-University Erlangen-Nürnberg (FAU).

To what extent the displacement time constant limits the experimentally achievable strain rates can be easily determined for the case of CSR indentation, which exhibits an exponential rise of the true displacement h true (see details in previous publication [Reference Merle, Higgins and Pharr22]) given by
 $$h_{{\rm{true}}} \left( t \right) = B \cdot {\rm{e}}^{\dot \varepsilon \cdot t} \quad .$$
Assuming that the displacement sensors of the investigated nanoindenters are first-order sensors (simple sensors incorporating one energy storage component), the values of the measured displacement h and actual displacement h true are related by the constitutive equation [Reference Fraden34]:
 $$T_{\rm{c}} \cdot \dot h\left( t \right) + h\left( t \right) = h_{{\rm{true}}} \left( t \right)\quad .$$
Combining with Eq. (8) and solving the resulting differential equation provides an assessment of how much the measured displacement signal h(t) is underestimated or lags behind the actual displacement h true(t) during CSR indentation:
 $$h\left( t \right) = \left( {1 - {\rm{e}}^{ - \left( {\dot \varepsilon + {1 \over {T_{\rm{c}} }}} \right)t} } \right) \cdot {1 \over {\dot \varepsilon \cdot T_{\rm{c}} + 1}}h_{{\rm{true}}} \left( t \right)\quad ,$$
which can be approximated by
 $$h\left( t \right) \approx {1 \over {\dot \varepsilon \cdot T_{\rm{c}} + 1}}h_{{\rm{true}}} \left( t \right)\quad .$$
Based on the latter equation, the displacement errors were assessed as a function of the strain rate for both the iMicro and G200 and are plotted in Fig. 4. Assuming a tolerable error of 2.5% in displacement, corresponding to about 5% in hardness, the considerably shorter time constant of the iMicro ensures that measurements can be reliably performed up to a strain rate of at least 1250 s−1, compared with about 0.25 s−1 for the older G200 platform with a standard time constant of 100 ms. For the G200, a faster time constant of 1 ms can be selected by the user, which in theory could increase the achievable strain rate to 25 s−1. In practice, however, the limited data acquisition rate of the G200 makes measurements faster than about 1 s−1 essentially meaningless because only a few data points would be recorded during such an experiment.

In a manner similar to the time lag in the displacement gauge, the force actuator in a nanoindenter cannot instantly reach its prescribed setpoint value. Each time the controller updates the load setpoint, the actual force in the coil P true changes only progressively from its previous value P initial to the new setpoint value P setpoint. Assuming a first-order system, the solution to the constitutive equation [similar to Eq. (9)] is
 $$P_{{\rm{true}}} \left( t \right) = P_{{\rm{initial}}} \cdot {\rm{e}}^{ - {t \over {T_{\rm{c}} }}} + P_{{\rm{setpoint}}} \left( {1 - {\rm{e}}^{ - {t \over {T_{\rm{c}} }}} } \right)\quad .$$
Although T c in the iMicro is much larger for the load than for the displacement (see Table I), its effects are not critical because they can be adequately mathematically modeled by Eq. (12) and used to correct the load data for any loading condition. In fact, with the new 2019 software release, the manufacturer of the iMicro system has provided an accurate estimate of the load at any time of the experiment based on Eq. (12) (or similar).
To illustrate the utility of this relation, an experiment was performed in the iMicro in which a Berkovich indenter was loaded into a specimen of fused silica and held for about 2000 μs at a load of about 850 mN and then abruptly completely unloaded according to the command signal in the system (see Fig. 5). During such an unloading, the specimen would presumably elastically recover almost instantaneously, but as shown in Fig. 5, the load time constant of 300 μs applied to compute the true load on the sample shows that the load falls off over an extended period of time, given by the red curve in Fig. 5. Also shown in the figure as black data points are estimates of the force versus time based on the measured indenter displacements converted to forces using Sneddon's theory of elastic contact applied to the effective indenter shape [Reference Pharr and Bolshakov35, Reference Merle, Maier, Göken and Durst36]. The oscillations in these data are experimental noise caused by resonances and “ringing” in the system. Despite the oscillations, the overall decay in the actual force calculated from the displacement data closely follows the estimate based on the 300 μs time constant, thus verifying that there is a decay of the actual load over a period of approximately 1 millisecond (three to five times T c). The takeaway message is that since the load corrections based on Eq. (12) seem to work well, they currently do not pose a severe limit on analyzing the strain rates that can be achieved in a nanoindentation test.
Step load unloading on fused silica with an iMicro/InForce 1000 system. A close agreement is found between the prediction of the manufacturer [similar to Eq. (12)] and an indirect measurement based on the displacement data and Sneddon's theory. The overlapped oscillations are measurement artifacts related to resonances in the system. The data were recorded at a 100 kHz acquisition rate.

Controlling hardware
Rather, what does currently limit the upper value of the strain rate in the iMicro is the 1 kHz internal clock rate of the InQuest controller. In this system, the force setpoint is discretely updated every 1 ms based on the force needed to maintain constant strain rate conditions, and this produces discrete fluctuations in the load and displacement signals and all data derived from them [see Fig. 6(a)]. As shown in Fig. 6(b), one consequence is large fluctuations in the true indentation strain rate  ${{\dot h} \mathord{\left/ {\vphantom {{\dot h} h}} \right. \kern-\nulldelimiterspace} h}$ as determined from differentiation of the displacement–time data. Only at one order of magnitude slower, i.e., at 100 s−1, is the loading profile still a reasonable approximation of the exponential loading required by the CSR condition [see Fig. 6(c)]. Referring to Fig. 2(a), the hardness as a function of indentation depth measured at a strain rate of 100 s−1 is reasonably well behaved, but when the rate approaches 1000 s−1, the scatter becomes too great to make reliable measurements. Thus, measuring strain rates in the ballistic range (≥1000 s−1) by the methods proposed here is currently not possible because of hardware issues. It should also be noted that when ballistic rate measurements are made, the influences of inertial and damping forces in the nanoindentation testing system may become dominant. An assessment of when and how these forces become significant is given in the section “Methodology > Damping and inertial forces.”
Limitation of achievable CSR strain rate by the 1 kHz internal loop of the controller: (a) Discrete load profile at nominally 1000 s−1. (b) Corresponding strain rate  ${{\dot h} \mathord{\left/ {\vphantom {{\dot h} h}} \right. \kern-\nulldelimiterspace} h}$, showing oscillations around the setpoint. (c) In comparison, the load profile at 100 s−1 is a reasonably smooth approximation of an exponential function.

Last, it should be noted that other mechanisms of loading could prove useful in testing at higher rates. For example, the piezo-based technology used by Guillonneau et al. appears to be very promising, as these researchers have reported success in achieving stable indentation strain rates as high as 1000 s−1 when indenting a nickel sample [Reference Guillonneau, Mieszala, Wehrs, Schwiedrzik, Grop, Frey, Philippe, Breguet, Michler and Wheeler10]. It is not clear from their publication what feature of their system allowed them to reach this high rate, but we infer that the feedback loop in their control system operates at the high rate of 50 kHz, the same as their data acquisition rate. If this is the case, then using systems with hardware optimized for high rate data acquisition and control along with the analysis procedures developed here could make constant strain rate nanoindentation hardness measurements at ballistic strain rates more accessible in the near future.
Summary and conclusions
Making nanoindentation hardness measurements by methods that employ the continuous stiffness measurement technique (CSM) is not practical at high indentation strain rates because of problems caused by the recently reported plasticity error [Reference Merle, Maier-Kiener and Pharr21, Reference Merle, Higgins and Pharr22]. To circumvent this, a modified Oliver–Pharr evaluation scheme of analyzing nanoindentation data was developed that does not require direct measurement of the contact stiffness, and hence CSM. Instead, the new method uses only the load and displacement data acquired in a nanoindentation test conducted under constant indentation strain rate conditions. Although this requires a prior knowledge or an independent measurement of the reduced modulus, E r, this is easily obtained by simple and straightforward nanoindentation measurements. In theory, the new evaluation scheme applies to any strain rate, but in practice, its application is limited by testing system hardware. In particular, high strain rate nanoindentation requires small time constants in the systems that measure and/or control the displacement and load and a high data acquisition rate. In this context, the iMicro nanoindentation system used in the current study was found to be suitable for measurements up to around 100 s−1 (up to 3000 nm depth), but obtaining accurate data at higher rates was limited by the internal loop frequency of the force controller (1 kHz), which at higher rates does not provide the smooth exponential loading needed to meet the constant strain rate conditions. Using the methods of analysis developed here and more advanced hardware, nanoindentation tests at ballistic strain rates of 1000 s−1 and greater may be routinely achievable in the near future.
Methodology
Materials and equipment
All nanoindentation experiments were performed with an iMicro nanoindentation testing system (KLA, USA), equipped with an InForce 1000 head. For comparison, the performance of this instrument (also operated with an InForce 50 head) is compared and benchmarked relative to the G200 nanoindenter (KLA, USA) equipped with XP and DCM2 heads. The main properties and specifications of the instruments are listed in Table I. The mass and damping of the indenter columns were measured from free oscillations in the air according to the procedure described in Ref. [Reference Hay, Agee and Herbert19], whereas the other specifications were provided by the manufacturer.
The fused silica and coarse-grained aluminum specimens used for testing were provided with the iMicro as reference standards. The nanocrystalline nickel sample was produced by pulsed electro-deposition and previously characterized in [Reference Maier, Merle, Göken and Durst27, Reference Maier, Durst, Mueller, Backes, Höppel and Göken37]. The Zn22Al sample was produced by water quenching of the melt and subsequent heat treatment, as described in [Reference Feldner, Merle and Göken29], which resulted in a mean grain size of 1.25 µm. The Ni and Zn22Al specimens were ground and subsequently polished with a 1 µm-diamond suspension and an oxide polishing suspension (Struers, Germany). The Ni sample was finally electropolished with an aqueous solution of sulfuric and acetic acid. The respective reduced moduli of the materials were determined from a set of conventional CSM tests. The corresponding values (fused silica: 69.98 GPa, aluminum: 81.79 GPa, nickel: 200.40 GPa, Zn22Al alloy: 62.68 GPa) were subsequently used for evaluating the hardness at high strain rates of the samples with the new method.
Damping and inertial forces
At very high velocities, the mass and damping of the indenter column can significantly affect measurements. Following the suggestions of Phani and Oliver [Reference Phani and Oliver9], their influences can be simply quantified using Newton's laws. Assuming indentation at a constant strain rate (CSR) and a characteristic depth, h, the inertial force F m is given by
 $$F_{\rm{m}} = m \cdot \ddot h = m \cdot \dot \varepsilon ^2 \cdot h\quad ,$$
and the damping force F d by
 $$F_{\rm{d}} = d \cdot \dot h = d \cdot \dot \varepsilon \cdot h\quad ,$$
where m is the mass of the indenter column, d its damping coefficient,  $\dot h$ its velocity, and $\ddot h$ its acceleration. These equations were used to assess the influence of mass and damping on nanoindentation measurements at a typical depth of 2000 nm for the iMicro and G200 indentation platforms, based on the input data shown in Table I. The corresponding estimates, provided in Fig. 7, reveal that for CSR indentations on typical metals and ceramics, inertia and damping are not likely to be an issue, and do not need to be corrected for, up to strain rates of around 10 s−1, even when using the highest load head (considering an acceptable error of 0.1 mN at 2000 nm depth).
Influence of mass (a) and damping (b) on the load for different measurement heads during CSR indentation. The calculations were made for a typical indentation depth of 2000 nm.

At higher strain rates, the effect of damping and inertia on the measured load on the sample can be accounted for by Eqs. (13) and (14), based on experimental measurements of the velocity and acceleration. However, doing so can introduce a significant degree of noise in the load data, which in turn results in a large scatter in the hardness evaluated by the new method [Eqs. (5)–(7)]. An extreme example is shown in Fig. 8 (gray symbols), corresponding to a single CSR indentation at 100 s−1 on fused silica. To alleviate this issue, the damping and inertia corrected load and displacement signals were filtered by a Savitzky–Golay algorithm [Reference Savitzky and Golay26] before evaluating the hardness. This approach is much more efficient than filtering the hardness data after evaluation from the noisy raw load signal. Note that filtering is applied to a single measurement, i.e., it is not necessary to repeat indentations to calculate an averaged value. The remarkable improvement in the signal-to-noise ratio of the evaluated hardness is illustrated in Fig. 8.
Reduction in scatter in the measured hardness of fused silica at a strain rate of 100 s−1 with an iMicro/Inforce 1000: (a) by Savitzky–Golay filtering of the noisy load and displacement signals and (b) from a single CSR indentation after filtering.

Acknowledgments
BM is indebted to Zhiyuan Liang, Yvonne Dieudonné, and Christopher Walker for their kind support during his research stay at Texas A&M University. The Zn22Al sample was provided by Patrick Feldner (FAU). BM acknowledges funding from the German Research Foundation (DFG) through grant ME-4368/7. This research used resources from the Center for Nanoanalysis and Electron Microscopy (CENEM) and the Interdisciplinary Center for Nanostructured Films (IZNF) at Friedrich-Alexander University Erlangen-Nürnberg (FAU). WHH and GMP's contributions to this work were supported by the U.S. Department of Energy, National Nuclear Security Administration, under Award No. DE-NA0003857.


 Open access