A higher consumption of fruits and vegetables is associated with a reduced risk of several chronic diseases, including CVD and certain cancers. This association is attributed, in part, to the phytochemical content of plant foods (e.g. isoflavones in soya, flavonols in citrus fruits and isothiocyanates in cruciferous vegetables)(Reference Navarro, Saracino and Makar1). By necessity, the majority of dietary intervention studies have been restricted to the evaluation of known or hypothesised pathways involved in the disease process being studied and rely on a limited number of biomarkers and disease-related outcomes. Metabolomic profiling, measuring large numbers of metabolites not selected a priori, is an alternative approach to characterising dietary response(Reference Li, Wacholder and Hunter2–Reference Edmands, Beckonert and Stella4). Untargeted metabolomic profiling of urine by liquid chromatography (LC)–tandem MS (LC–MS/MS) can be used to assess differences in a wide variety of chemical species to describe detailed biochemical responses of cellular systems in response to dietary exposures(Reference Brennan5–Reference Walsh, Brennan and Pujos-Guillot7). In addition to proposed pathways, these profiles, in which a broad range of metabolites in a biosample are measured, allow for the discovery of previously unrecognised mechanisms through which dietary factors affect disease risk. Application of metabolomics in the context of controlled dietary studies can also be used to identify new biomarkers for the intake of specific foods (e.g. cruciferous vegetables), which can then be used for the evaluation of dietary intake and the association with disease risk in an observational setting.
The aims of the present study were twofold. First, we intended to characterise intervention-induced changes in untargeted urinary metabolomic patterns in response to a 2-week controlled high-phytochemical diet including specific fruits and vegetables compared with a fruit- and vegetable-free basal diet, and to identify metabolites that differed between the two interventions. Second, we compared the metabolites affected by the dietary intervention with the metabolites observed in high- and low-fruit and vegetable diets based on 3 d food records (3DFR) and FFQ in a cross-sectional, observational study of free-living individuals. All raw LC–MS/MS data, datasets derived from the present analyses and computational tools for creating metabolomic profiles using the msInspect software suite (Fred Hutchinson Cancer Research Center)(Reference Bellew, Coram and Fitzgibbon8) are provided (for access instructions, see the Supplementary material, available online) to allow the research community to further mine the data from the present experiments.
Methods
Study design
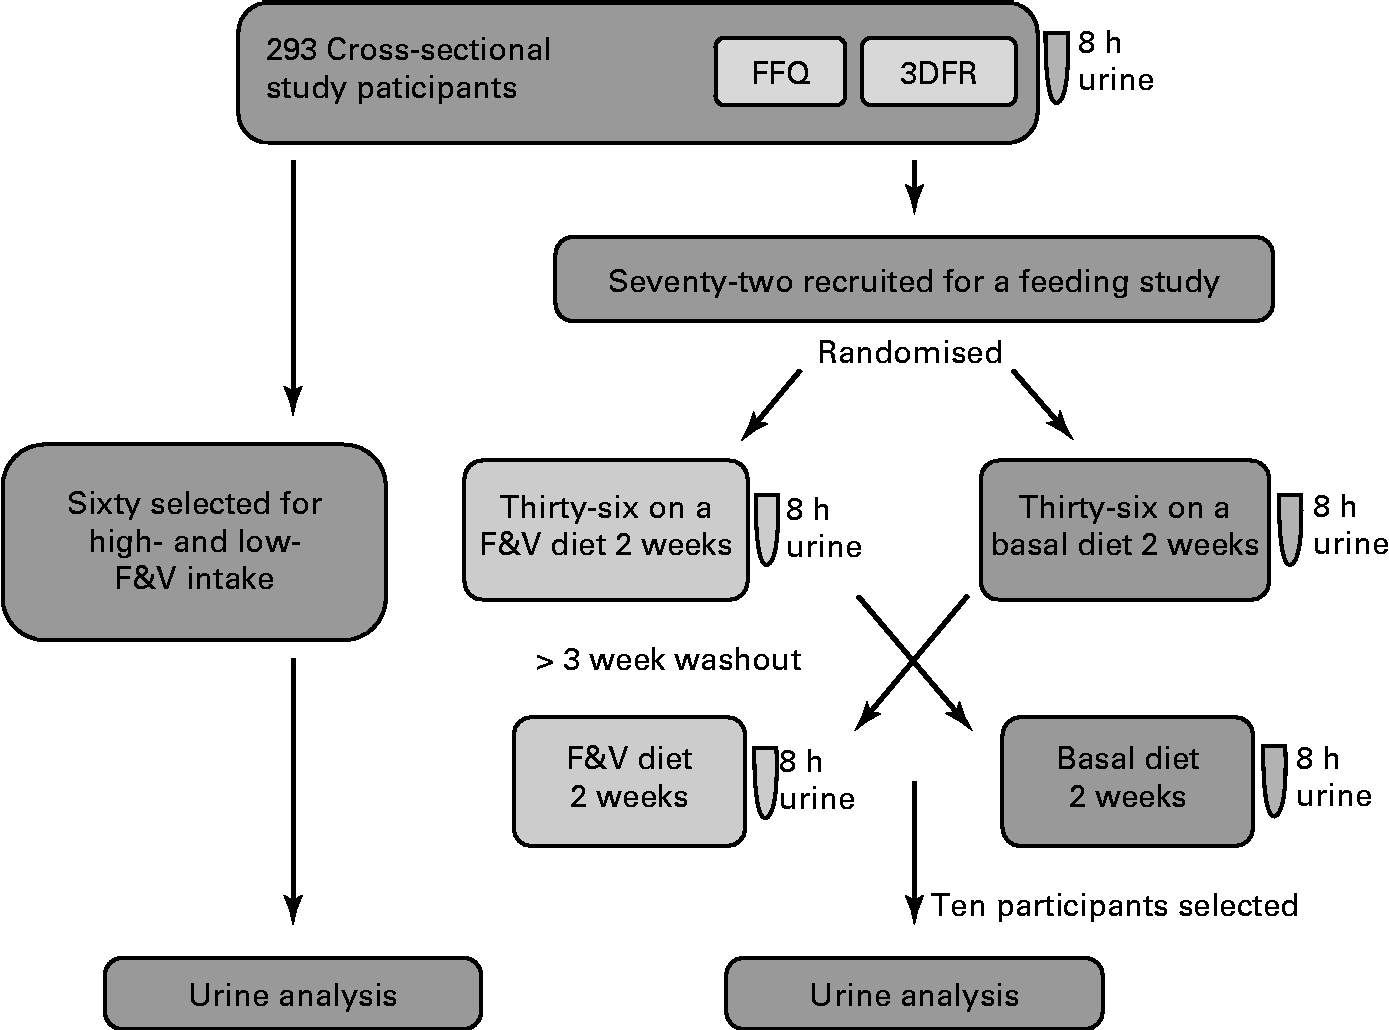
Biological samples and participant information were from a completed study, ‘Dietary Influences on Glucuronidation Study’. The Dietary Influences on Glucuronidation Study was a two-tiered study comprising a cross-sectional study from which subjects were recruited for participation in a randomised, controlled cross-over feeding trial comparing 2 weeks of a diet rich in fruits and vegetables (F&V) with 2 weeks of a fruit- and vegetable-free (basal) diet(Reference Chang, Bigler and Schwarz9, Reference Saracino, Bigler and Schwarz10). For the present analysis, 8 h urine samples from both the cross-sectional and the feeding intervention studies were used. The Institutional Review Board at the Fred Hutchinson Cancer Research Center, Seattle, Washington, approved the study, and all participants gave informed written consent. The study design is summarised in Fig. 1.
Study design and general analysis workflow. 8 h urine, FFQ and 3 d food records (3DFR) were collected from 293 cross-sectional study participants. Of these, sixty were selected for analysis based on the high- and low-fruit and vegetable (F&V) intake. A total of seventy-two were recruited for a feeding study; half of these were randomised to a F&V intervention diet and half to a basal (fruit- and vegetable-free) diet for 2 weeks and 8 h urine collected. After a 3-week washout, participants switched the diets and a second 8 h urine was collected. Samples from ten of these participants were used in the present analysis.

Participants
In the cross-sectional study, healthy, non-smoking men and women aged 21–45 years were recruited from the greater Seattle area as described previously(Reference Saracino, Bigler and Schwarz10). Briefly, exclusion criteria included chronic disease, current use of over-the-counter or prescription drugs or alcohol intake >2 drinks/d. Participants were asked to discontinue use of all dietary supplements 1 week before the start of the study. For the present analysis, urine samples for sixty of the 293 individuals in the cross-sectional study (thirty from the highest tertile of total fruit and vegetable intake and thirty from the lowest tertile, based on FFQ data) were selected for LC–MS/MS analysis.
A subset of individuals from the cross-sectional study were contacted and invited to participate in the feeding study on the basis of their UDP-glucuronosyl transferase genotype in relation to the aims of the parent study(Reference Saracino, Bigler and Schwarz10). In all, seventy-two participants were randomised. Day 11 urine samples from ten individuals in the feeding study (five men and five women, chosen at random) were used to characterise differential metabolite abundances between the basal and F&V diets (Fig. 1).
Study diets
Participants consumed two different diets: a basal, low-phytochemical diet, devoid of fruit and vegetables, and the basal diet supplemented with cruciferous vegetables (broccoli, cabbage and daikon radish sprouts), soya foods (soya milk, soya cheese slices, tofu and roasted soya nuts) and citrus fruits (grapefruit and orange juices, orange/grapefruit segments and dried orange peel), dosed on a g/kg body-weight basis to minimise confounding by body weight between the sexes. Weight was checked daily and energy adjusted so that participants remained weight stable throughout the study. Each diet was consumed for 14 d with at least a 3-week washout period between the diets. Participants were instructed to consume only the food and beverages provided to them during both diet periods, maintain their usual physical activity and not to use any type of medication, vitamins or other dietary supplements. Based on the 24 h urinary analysis of total isothiocyanates and isoflavone excretion and daily food check-off forms, participant compliance to the study was excellent, with the consumption of non-study food items being less than 1 % of the study design(Reference Chang, Bigler and Schwarz9). Additional diet details have been published elsewhere(Reference Chang, Bigler and Schwarz9).
Dietary assessment
FFQ
Participants in the cross-sectional study completed a FFQ reporting their dietary intake within the past 3 months. FFQ details have been described previously(Reference Navarro, Saracino and Makar1, Reference Saracino, Bigler and Schwarz10). Total fruit and vegetable intake was used for tertile summation. Line items in each botanical category used for crucifer, citrus and soya tertile summation included: broccoli, cauliflower, cabbage, Brussels sprouts and coleslaw, for cruciferous vegetables; oranges and orange juice, grapefruit and grapefruit juice, and tangerines for citrus; and tofu, tempeh, products such as soy hot dogs and burgers, soya cheese and miso soup for soya. FFQ with incomplete information or data that suggested biologically implausible daily energy intakes ( < 2510 kJ (600 kcal) or >16 736 kJ (4000 kcal) for women or < 3347 kJ (800 kcal) or >20 920 kJ (5000 kcal) for men) were excluded (a modification from Willett(Reference Willett11)), providing a total of fifty-seven samples for the analysis of total fruit and vegetable intake, and forty-eight for combined crucifer, citrus and soya intake (fewer samples were available for analysis by botanical families, as samples were chosen for LC–MS/MS analysis based on total fruit and vegetable intake).
Food records
Participants also completed 3DFR on three consecutive days after receiving training by a registered dietitian(Reference Saracino, Bigler and Schwarz10). The 3DFR were analysed to estimate intake by botanical families based on standard serving sizes(Reference Horner, Kristal and Prunty12). Botanical families used for tertile summation included Cruciferae (i.e. cruciferous vegetables), Rutaceae (i.e. citrus fruits) and Leguminosae (i.e. soya, beans and pulses). Although this last category contained beans and pulses in addition to soya, intake from soya alone tracked similarly (data not shown). 3DFR completed >10 d from the time of urine collection were excluded, providing a total of thirty-six participants in the 3DFR analyses.
Urine collection
For the present analyses, 8 h fasting urine collected overnight after a standard aspirin dose (650 mg) was used(Reference Navarro, Saracino and Makar1). The protocol was the same across all treatments (both diet periods in the intervention study and the cross-sectional study). Urine was collected within an average of 5·5 d (range 0–48 d) of completing the FFQ and 3·3 d (range 0–10 d) of completing the 3DFR for the cross-sectional study, and on day 11 of each 14 d controlled diet period for the feeding study. On the evening of the aspirin challenge, participants were instructed to void and consume aspirin before retiring, and collect all of their urine for the next 8 h (in most cases, this was a single void after waking). Urine specimens were stored at 4°C until delivery to the Fred Hutchinson Cancer Research Center in the morning after collection. The total volume and initial pH of urine samples were recorded; samples were aliquoted and stored at − 80°C.
Urine sample preparation for MS/MS analysis
For each urine sample, 100 μl acetonitrile was added to an equal volume of urine and stored overnight at − 20°C. After centrifugation for 10 min at 16 000 g in an Eppendorf 5415D table-top centrifuge, 10 μl of 1 % trifluoroacetic acid were added to the supernatant and dried in a speed-vacuum centrifuge. The sample was dissolved in 25 μl of 2 % acetonitrile with 0·1 % formic acid; 5 μl were used for each analysis.
LC–MS/MS sample analysis
LC–MS/MS analysis was performed using a linear trap quadrupole Fourier transform mass spectrometer (Thermo Fisher Scientific) with an electrospray ion source. The LC system was a NanoLC 2D (Eksigent) connected to an Inertsil® ODS-SP reverse-phase column (0·5 × 150 mm, 3 μm particle size; GL Sciences, Inc.). The urine samples were loaded onto the column, and chromatographic separation was performed using a two-mobile-phase solvent system consisting of 0·1 % formic acid in water (A) and 0·1 % formic acid in acetonitrile (B) over a 42 min gradient from 5 to 95 % solvent B at 8 μl/min. The mass spectrometer operated in a positive-ion mode (chosen based on success in prior urine experiments), in a data-dependent MS/MS mode over the m/z range 100–650. For each cycle, the three most abundant ions from each MS scan were selected for MS/MS analysis using 35 % normalised collision energy. Resolution and the automatic gain control target were 100 000 and 2 000 000, respectively. The selected ions were dynamically excluded for 30 s. Though LC–MS and MS/MS scans were acquired for the entire run time, including column washing and equilibration, all data from the high-organic phase (after 40 min) were excluded from the analysis. Samples were run in random order in duplicate, with a control every eight samples.
LC–MS/MS data extraction and analytic dataset creation
Complete details of all data analysis steps, data, software and instructions necessary to recreate the analytic datasets described below are provided in the Supplementary material (available online). In brief, msInspect(Reference Bellew, Coram and Fitzgibbon8), a freely available suite of software and algorithms for analysing profiles from high-resolution LC–MS/MS data, was extended to accurately detect and quantify small-molecule ion features. These improvements, which include optimised handling of relative peak abundances, among others, are now released as part of the open-source distribution and provided in conjunction with this publication. Ion features were extracted from each LC–MS/MS run, and a mass filter was applied to eliminate ions with fractional masses, indicating that they were unlikely to represent organic molecules(Reference Dettmer, Aronov and Hammock13). Duplicate sample runs were combined by aligning ions by m/z and retention time(Reference Bellew, Coram and Fitzgibbon8, Reference May, Pan and Crispin14), and the union of features was retained. Ion intensities were quantile normalised(Reference Bellew, Coram and Fitzgibbon8, Reference Wang, Tang and Fitzgibbon15) and then aligned by m/z and retention time to create an analytic dataset (an ion array) whose columns represented samples and whose rows represented ions; values were ion intensities (averaged across duplicate runs where applicable) or missing values for ions not detected in a particular sample.
To evaluate the overall effect of diet on the metabolite profile, we used principal components (PC) analysis on the ln intensities of features observed in at least three participants. The PC analysis was applied without regard to the pairing of samples; this provides a conservative approach to evaluating the global effect of diet, as the diet effect must be strong enough to overcome the similarity of the two profiles from each individual. Downstream analyses were conducted on ln ratios (F&V:basal) for each participant. Missing data are characteristic of LC–MS/MS profiling data(Reference Bellew, Coram and Fitzgibbon8, Reference Wang, Tang and Fitzgibbon15), and missing values in a sample can result from either an ion being low abundance (i.e. falling below the detection limit of the instrument) or high abundance but missing owing to analytic errors. Under the assumption of missingness due to falling below the level of detection, the following statistically conservative procedures were used to calculate ln ratios when an ion was observed in only one of the diets from an individual: a pseudo-background level was estimated separately for each sample run as the first percentile of ion intensities in the run, and ln pseudo-ratios were calculated using this background for missing values. Because these imputed ln pseudo-ratios naturally contained a disproportionate number of large absolute values (i.e. outliers), we reduced their influence on the analysis by shrinking their quantiles towards the quantiles of the ratios calculated from fully observed ions. This strategy was based on an assumption that true ratios from ions with one missing value were not systematically different from ratios from ions with no missing values. A one-sample t test applied to the ln ratios was used to calculate P values based on the null hypothesis that mean ln ratio = 0, and false discovery rates (q values) were derived(Reference Storey and Tibshirani16) for all ions having four or more ratios across the samples. Analyses were carried out using the R statistical environment (R Foundation for Statistical Computing)(17).
To investigate the cross-sectional study data, a separate ion array was created using the method described previously. Analyses were performed separately to evaluate combined crucifer, citrus and soya consumption defined by 3DFR and FFQ, and also, separately, on combined fruit and vegetable consumption defined by FFQ, by comparing the participants in the first and third tertiles of consumption. For each ion observed in at least five samples in both tertiles, ln intensities were compared, adjusting for participants' BMI using the Limma R package (Bioconductor) for differential expression analysis(Reference Gentleman, Carey and Dudoit18), and P and q values were calculated.
Metabolite annotation
As others have noted(Reference Dettmer, Aronov and Hammock13, Reference Wishart, Knox and Guo19), identifying metabolites in the untargeted profiling of biosamples without reference standards is a difficult process. We took a multi-step approach, assigning putative annotations to ions by mass-matching, and then, for ions of interest that separated the two groups under investigation, supporting those annotations with MS/MS evidence where possible. For each compound in the Human Metabolome Database (HMDB) version 2.5(Reference Wishart, Knox and Guo19), a separate theoretical mass value was calculated for four ion types: the [M+H]+ and [M+Na]+ ions and the dimeric [2M+H]+ and [2M+Na]+ ions. Each row of every ion array was matched by the mean mass value to these ion masses; all matches within 5 parts per million were retained. For each ion of interest (q< 0·1), further evidence of molecular identity was garnered by examining MS/MS scans. In each sample in which the ion was observed, the most abundant fragment ions from all nearby MS/MS scans were combined into a single list of the most abundant fragments (see the Supplementary material, available online). For ions annotated as dimeric compounds, abundant fragment ions matching the [M+H]+ or [M+Na]+ monomeric ions, appropriately, provide a small amount of additional support. For monomers, the fragment list was compared with the available literature documenting the fragmentation of the same compounds by MS/MS in a positive-ion mode (for references see Tables S1 and S2, available online). Ion annotations both with and without this MS/MS support are ‘putatively annotated compounds’, as described by the Metabolomics Standards Initiative Chemical Analysis Working Group(Reference Sumner, Amberg and Barrett20). Metabolite functions and pathway information were determined by searching the HMDB, Kyoto Encyclopedia of Genes and Genomes, PubChem and PubMed.
Results
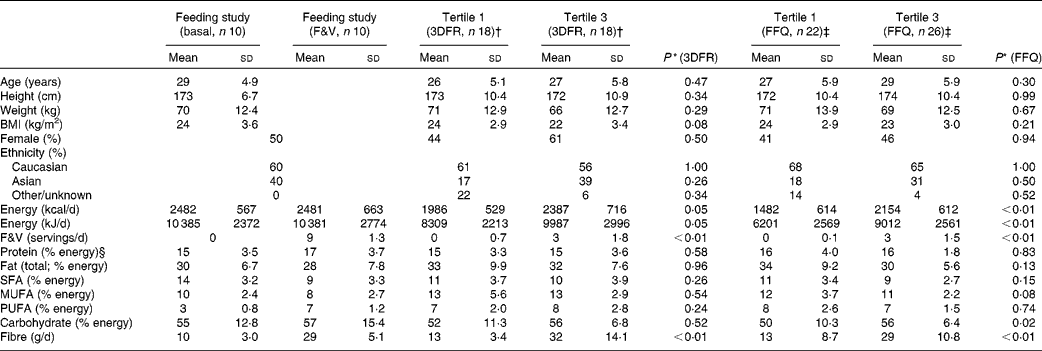
Participant and dietary characteristics for the feeding and cross-sectional studies are given in Table 1. There were no significant differences in participant characteristics between the tertiles of crucifer, citrus and soya intake; however, the overall energy intake was higher among individuals in the highest tertile of intake in the cross-sectional study. On average, 3763 ions (range 2378–5065) passing the filtering criteria were located in each of the 160 LC–MS/MS runs of the eighty samples run (twenty for the feeding study and sixty for the cross-sectional study). After the combination of ions across the duplicate runs, an average of 4790 ions (range 3155–6575) were detected per sample. The median CV of ln ion intensities between the duplicate runs was 0·104 (range 0·082–0·195).
Characteristics of the randomised, cross-over, dietary intervention and cross-sectional study participants and diet components (Mean values and standard deviations)
F&V, fruits and vegetables; 3DFR, 3 d food records.
* P value using Mann–Whitney tests for significant differences between the first and third tertiles in the cross-sectional study based on 3DFR and FFQ; sex and ethnicity were tested with a proportion test.
† First and third tertiles of crucifer, citrus and soya intake among the cross-sectional study participants, as calculated based on 3DFR.
‡ First and third tertiles of crucifer, citrus and soya intake among the cross-sectional study participants, as calculated based on FFQ.
§ Percentages may not add up to 100 due to rounding.
Feeding study
Data summary
A total of 7382 ions were observed in at least three samples across both diets. To analyse global differences in ion abundance between the diets (without the background-level estimation of unobserved ions), we used the PC analysis on these ions. The ln ion intensity variation in PC dimensions 1 and 2 explained 26 % of the variance between the samples. PC1 was not associated with the diet, but PC2 systematically separated the diets with high accuracy: PC2>0 correctly classifies nine of ten samples from each diet (Fig. 2). Experimental measurements fell into two distinct groups along PC1; interestingly, pairs of measurements from the same individual cluster together, with both members of each pair always having PC1 < 0 or PC1>0. The meaning of these clusters has not been identified; they are not associated with age, diet order, sex, BMI or other known factors. Analysed by a t test on an ion-by-ion level, a total of 2857 ions were determined to be significantly higher or lower in the F&V v. basal diet with q< 0·1 (1360 more abundant in the F&V diet; 1497 in the basal diet).
Principal component 1 (PC1) and 2 (PC2) scores for ten basal diet (‘B’) and ten fruit and vegetable intervention diet (‘F’) samples, calculated using the observed ln ion intensities from all features observed in at least three of twenty samples. Grey lines connect the basal and intervention diet samples from the same participant.

Annotated compounds
A total of 3666 ions observed in one or more samples were assigned putative annotations by mass-matching to the HMDB. Of these mass-matched ions, 423 were among the above-mentioned 2857 ions significantly differentially abundant in the F&V v. basal diet with q< 0·1 (179 more abundant in the F&V diet; 244 in the basal diet). Of these, 195 had at least one match to a dimeric ion of a compound ([2M+H]+ or [2M+Na]+). Although 102 dimeric ions had MS/MS scans nearby in both retention time and m/z, only twelve such MS/MS scans contained the expected major fragment ion representing the ionised monomeric compound ([M+H]+ or [M+Na]+). Due to this high proportion of presumed false dimeric ion mass-matches, dimeric annotations were discarded for ions with no available MS/MS scans. A literature survey, a necessarily subjective process, was performed for each remaining putatively annotated, differential ion with a nearby MS/MS scan. Putative annotations were discarded when the literature was available that indicated consistent observation of fragment ions, using similar instrumentation, that conflicted with our observed fragment ions, leaving 223 annotations of differentially abundant ions. Of these putative ion annotations distinguishing the two diets, forty-six had some support available from MS/MS fragment ions; the remaining 177 annotations of significantly differentially abundant ions (seventy-six more abundant in the F&V diet; 101 in the basal diet) were unsupported, lacking adjacent MS/MS scans or available literature describing the expected MS/MS fragment ions.
Because urine samples collected after a standard aspirin dose, in relation to the parent study's aims, were used for the present analysis, acetyl salicylic acid and other aspirin metabolites were evaluated to ensure that they did not differ between the diet treatments or between the tertiles of intake in the cross-sectional comparison. From all groups, both in the feeding study and in the cross-sectional study, two aspirin metabolites (salicylic acid and salicyluric acid) were detected in the urine, but were not statistically significantly different between the groups (e.g. F&V v. basal, and third v. first tertile of intake via the 3DFR and FFQ; data not shown).
Compounds more abundant in the fruit and vegetable diet
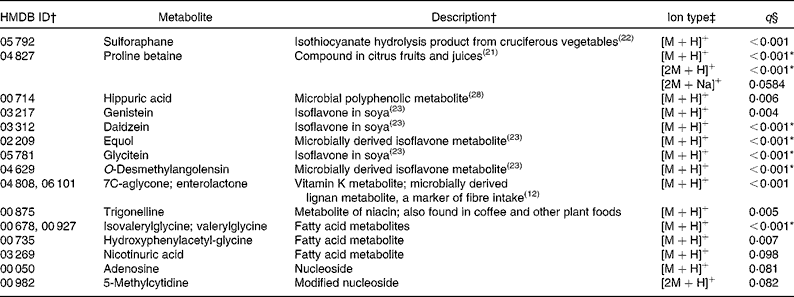
Of the ninety-three annotated compounds significantly more abundant in the F&V diet (q< 0·1), seventeen were supported by MS/MS fragment ions from the literature (Table 2). These metabolites were mainly markers associated with F&V consumption, e.g. metabolites of cruciferous vegetables, citrus and soya. The seventy-six unsupported metabolites, although in many cases putatively matched to several compounds, can be roughly grouped into the following categories: plant-derived metabolites (n 10); vitamins (n 8); steroids and steroid conjugates (n 8); hormones (n 8); a number of miscellaneous compounds (n 42; Table S1, available online).
Metabolites with supporting MS/MS fragment ions more abundant in the fruit and vegetable (F&V) diet
HMDB, Human Metabolome Database; ID, identity.
* Ions that were differentially abundant at α = 0·1 with Bonferroni correction.
† ID numbers and descriptions are from the HMDB if not otherwise referenced; more than one ID indicates that multiple compounds match to the observed ion.
‡ Multiple ion types indicate that more than one ion type was observed with q< 0·1. Ion types with q values >0·1 are not reported here, but are included in Table S1 (available online).
§ q values represent false discovery rate.
Compounds more abundant in the basal diet
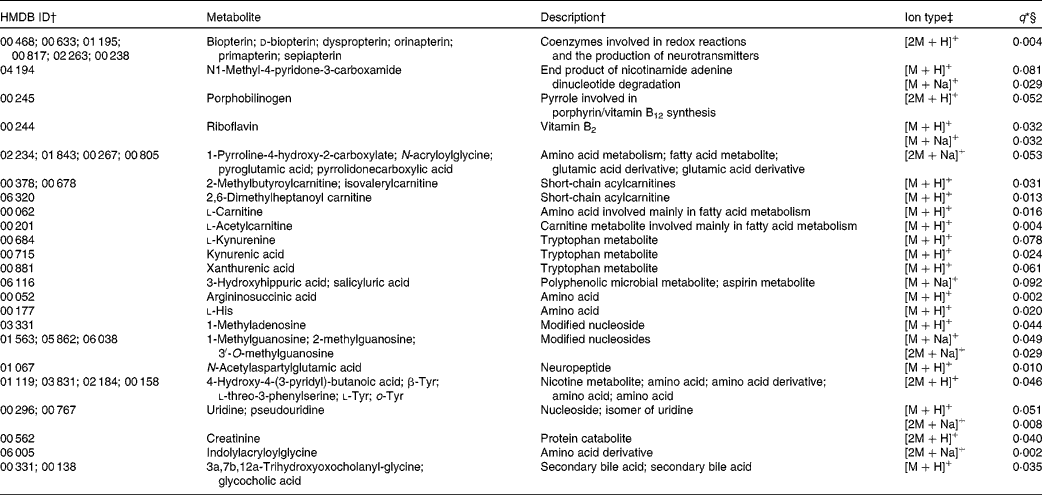
Of the 130 annotated compounds more abundant in the basal diet, twenty-nine had some level of MS/MS fragment ion support (Table 3). These included a number of vitamins and their metabolites (n 6), compounds related to fatty acid metabolism (n 6), amino acid metabolism (n 5) and several other miscellaneous compounds (n 12). The 101 unsupported compounds can be roughly classified into the following categories: compounds involved in fatty acid (n 13), amino acid (n 22) and carbohydrate (n 6) metabolism; eicosanoids and PG (n 10); vitamins and vitamin metabolites (n 6); plant compounds (n 4) and a number of miscellaneous compounds (n 40). A total of twenty-one ions were putatively annotated as carnitines, seventeen of which were more abundant in the basal diet. We investigated the abundance ratios of these twenty-one carnitines via a t test; as a group, the observed carnitines were significantly more abundant in the basal diet (P= 0·002). The [M+H]+ ion of l-acetylcarnitine (an annotation strongly supported by MS/MS fragment ion evidence) was observed in all samples in both diets, but was significantly more abundant in the basal diet (q= 0·019). A putatively annotated dimeric [2M+H]+ ion for l-acetylcarnitine was also observed in nine of the ten basal samples, but was not present in any of the F&V samples.
Metabolites with supporting MS/MS fragment ions more abundant in the basal diet
HMDB, Human Metabolome Database; ID, identity.
* No ions were differentially abundant at α = 0·1 with Bonferroni correction.
† ID numbers and descriptions are from the HMDB; more than one ID indicates that multiple compounds match to the observed ion.
‡ Multiple ion types indicate that more than one ion type was observed with q< 0·1. Ion types with q values >0·1 are not reported here, but are included in Table S1 (available online).
§ q values represent false discovery rate.
Cross-sectional study
3 d Food records
The ion array created using thirty-six samples from the first and third tertiles of crucifer, citrus and soya consumption based on the 3DFR data contained 6580 ions observed in at least two samples in one or both of the tertiles compared. There were four ions with putative annotations whose abundance distinguished the third from the first tertile with q< 0·1; the only such ion supported by MS/MS fragments was proline betaine (more abundant in the third tertile; P= 0·0001, q= 0·050).
Putative annotations of thirteen carnitines were made in at least ten samples in the first tertile and ten samples in the third tertile of crucifer, citrus and soya consumption. All thirteen of these carnitines were more abundant in the first tertile, and, as a group, were significantly more abundant in the first tertile of crucifer, citrus and soya consumption than in the third tertile (P< 0·0001 via a t test on the ln ratios of mean abundance within each tertile).
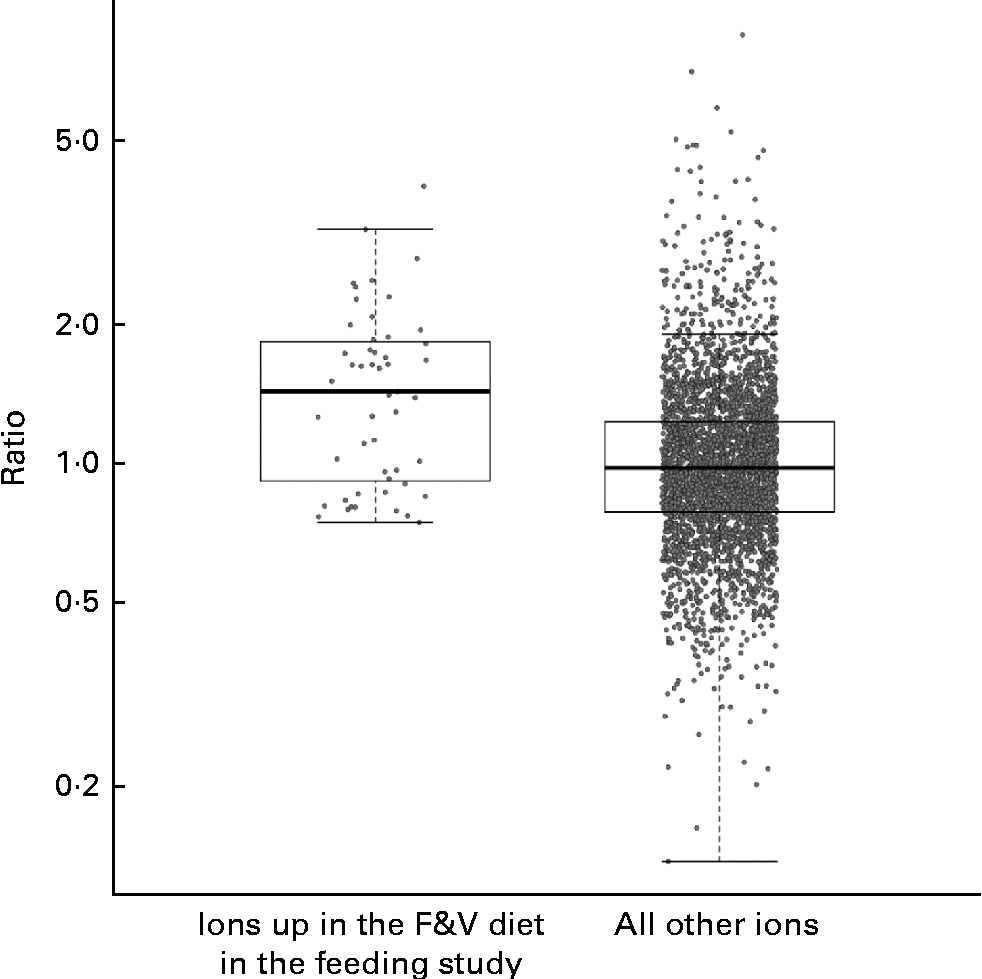
We compared the behaviour of ions across both the feeding and cross-sectional studies, examining the cross-sectional study ions observed in at least five samples from each tertile. A total of fifty-one feeding study ions (some with and without putative annotations) that were significantly more abundant in the F&V diet v. the basal diet (q< 0·1) fit these criteria in the cross-sectional study (Fig. 3); as a group, these ions were significantly more abundant in the third v. first tertile of crucifer, citrus and soya consumption based on the 3DFR (P< 0·0001; two-sample t test). The ions significantly more abundant in the basal diet also had a higher mean intensity in the first v. third tertile based on the 3DFR, but this difference was not statistically significant (P= 0·188).
Strip charts of geometric mean intensity ratios (third tertile plant-derived fruit and vegetables (F&V) based on 3 d food records (3DFR): first tertile) in the cross-sectional study, for ions observed in at least five samples in each tertile, y-axis on the log scale. Charts show, respectively, fifty-one ions significantly more abundant in the F&V diet in the feeding study (q< 0·1), and all other ions. As a group, ions significantly more abundant in the F&V diet were significantly more abundant in the cross-sectional 3DFR-based third tertile v. first tertile (P< 0·0001). Box plots indicate interquartile range and extremes.
FFQ
The ion array created using fifty-seven samples from the first and third tertiles of total fruit and vegetable intake based on the FFQ data contained 12 524 ions observed in at least two samples in each of the tertiles compared; the array using forty-eight samples from the first and third tertiles of crucifers, citrus and soya contained 10 898. Although many of these ions in both analyses were differentially abundant in the third v. first tertile with a P value < 0·01 by individual testing, there were no ions with q< 0·1 in either analysis.
Putative annotations of eighteen carnitines were made in at least ten samples in the first tertile and ten samples in the third tertile of total fruit and vegetable intake, and nineteen carnitines when using crucifer, citrus and soya tertiles. Overall, fifteen of the eighteen carnitines, and sixteen of the nineteen carnitines, respectively, were more abundant in the first tertile. As a group, in both comparisons, carnitines were significantly more abundant in the first tertile of intake than in the third tertile (P= 0·0017 and P= 0·0002, respectively).
As a group, the fifty-three ions observed in the feeding study to be significantly more abundant in the F&V diet than in the basal diet, and also observed in at least five samples in both the first and third FFQ-based tertiles of total fruit and vegetable intake, were significantly more abundant in the third v. first v. third tertile (P< 0·0001; two-sample t test). For the equivalent comparison based on crucifer, citrus and soya tertiles, the fifty-three ions were also significantly more abundant in the third v. first tertile (P< 0·0001).
Discussion
In the present untargeted metabolomic analysis, we found forty-six putatively annotated ions, with MS/MS fragment ion support, that were differentially abundant between the two intervention diets (F&V and basal). As expected, many of the metabolites found in greater abundance in the F&V (high-phytochemical) diet were associated with the intervention foods consumed (see Table 2 for a complete list). For example, proline betaine, a marker of citrus consumption(Reference Lloyd, Beckmann and Fave21), was observed in four different ionic forms; three supported by MS/MS fragment ions ([M+H]+, [2M+H]+ and [2M+Na]+) and a fourth (putatively [M+Na]+) unsupported. Sulforaphane is a hydrolysis product of glucosinolate glucoraphanin found in cruciferous vegetables(Reference Navarro, Li and Lampe22). Several isoflavones and their metabolites were also more abundant in the F&V diet(Reference Atkinson, Newton and Stanczyk23). Another ion mass-matched to two different metabolites, 7C-aglycone and enterolactone, with the literature supporting the fragment ions observed as derived from 7C-aglycone and no available literature for enterolactone. Either compound is feasible in a high-plant food diet. 7C-aglycone is a vitamin K metabolite, while enterolactone is a microbial metabolite of plant lignans and is associated with fibre intake(Reference Horner, Kristal and Prunty12).
Other compounds more abundant in the F&V diet relative to the basal diet matched to fatty acid metabolites (isovalerylglycine or valerylglycine and hydroxyphenylacetyglycine); nicotinuric acid and trigonelline, compounds involved in niacin metabolism; adenosine, involved in energy transfer; and 5-methylcytidine, a modified base. These metabolites have not previously been associated with the dietary components used in the present intervention. It is not clear whether the presence of these urinary metabolites indicates differential metabolism between the diets or not. The higher abundance of particular fatty acids may simply reflect the difference in the major fat sources between the diets. Although the overall total fat content of the diets was very similar, the F&V diet was higher in polyunsaturated fats, whereas the basal diet was higher in saturated fat. The higher concentration of niacin metabolites does not appear to be related to dietary niacin content, as the mean intake between the two diets was only marginally different (23 v. 24 mg/d for the basal and F&V diets, respectively), but tryptophan, a precursor of niacin, was slightly higher (94 v. 84 mg/d for the basal and F&V diets, respectively).
A greater relative abundance of 5-methylcytidine was observed in the F&V diet relative to the basal diet, whereas more abundant 1-methyladenosine and methylguanosine were observed in the basal diet. Modified bases are typically considered markers of DNA damage(Reference Loft, Hogh Danielsen and Mikkelsen24). As these compounds were putatively annotated in both diets, their relationship with the present dietary intervention, if there is one, is not clear. In addition to the compounds listed above, there were several other differentially abundant ions with annotations lacking MS/MS fragment ion support (Table S1, available online).
Many ions more abundant in the basal diet, with some level of annotation support, mass-matched to more than one metabolite. For the most part, they fell into similar categories, e.g. amino acid or pterin metabolites, etc. Only one of the metabolites appears to reflect the specific diet components consumed. Riboflavin, which is fortified in refined grains and therefore higher in the refined basal diet, was relatively more abundant in the urine after consumption of the basal diet.
Compared with the F&V diet, five ions putatively annotated as carnitines or acylcarnitines were significantly more abundant (four supported with MS/MS fragment information, and a fifth that was not) after consumption of the basal diet. Further, the twenty-one putatively annotated carnitines and derivatives, as a group (both those that were significantly different between the diets and those that were not), were significantly more abundant in the basal diet overall. Carnitines serve as shuttles for long-chain fatty acids into the mitochondria for energy production via β-oxidation(Reference Corso, D'Apolito and Garofalo25). Higher concentrations of carnitines are found in meat and dairy foods(Reference Rebouche26). While meat was not a part of our protocol for either diet, dairy products were fed on the basal diet in place of soya given on the F&V diet, and may partly explain the higher excretion of carnitines.
Carnitines also prevent potentially toxic accumulation of fatty acyl moieties by removing these metabolites from the mitochondria, followed by urinary excretion as carnitine conjugates(Reference Corso, D'Apolito and Garofalo25, Reference Brass and Hiatt27). The higher relative abundance of acylcarnitines may be in response to a build-up of acyl-CoA intermediates and the incomplete oxidation of fatty acids. Whereas long-chain acylcarnitines transport fatty acids into the mitochondria, short- to medium-chain acylcarnitines move acyl groups out of the cell(Reference Brass and Hiatt27). Strikingly, all but one of the seventeen acylcarnitines observed in higher relative concentrations after consumption of the basal diet were short- and medium-chain species, suggesting an increase in energy production via β-oxidation and, thus, an accumulation of acyl-group by-products. Several amino acids and their derivatives, as well as TCA-cycle substrates and intermediates, were also observed in higher abundance after consumption of the basal diet. The greater accumulation of these metabolites coupled with acylcarnitines suggests that there may be a shift in energy metabolism towards β-oxidation, and potentially an overall reduction of energy production via the TCA cycle with consumption of a diet devoid of fruit and vegetables compared with a diet high in these plant foods. The remainder of urinary metabolites that were relatively more abundant after consumption of the basal diet does not appear to reflect the perturbation of any particular pathways.
Ion arrays and putatively annotated compounds (e.g. biomarkers) from the intervention study were used to make comparisons with metabolite excretion in the cross-sectional study. When looking at 3DFR, four ions statistically significantly distinguished the highest from the lowest tertile of crucifer, citrus and soya intake; however, proline betaine was the only compound annotated with MS/MS support. Proline betaine, a biomarker of citrus intake(Reference Lloyd, Beckmann and Fave21), was also found among individuals after consumption of the F&V diet in the feeding study. Similarly to what we have found in the intervention study, thirteen carnitines were observed in greater relative abundance among individuals in the lowest tertile of crucifer, citrus and soya intake. No ions were significantly differentially abundant between the first and third tertiles of total fruit and vegetable intake, or crucifer, citrus and soya, specifically, based on FFQ. However, as a group, carnitines were again significantly more abundant among individuals in the lowest v. the highest tertile of total fruit and vegetable intake. Overall, these findings – specific compounds in the feeding study, but only general trends in the cross-sectional study – are in agreement with what is commonly observed for biomarkers and other validation methods of dietary intake in a controlled setting v. recall of habitual diet.
In addition to reporting these results, we have provided all raw LC–MS/MS data, extracted ions from each machine run and datasets derived from our analyses. In addition, we have released a new version of the freely available, open-source msInspect software suite containing the optimisations for small-molecule analysis that we have described. This will allow the community to freely mine our data and reproduce the present results. Access instructions for all data and software are provided in the Supplementary material (available online).
To our knowledge, this is the first metabolomic study to assess the untargeted urinary excretion of compounds after a longer-term consumption of a high compared with a low (fruit- and vegetable-free) phytochemical diet in human subjects. The strengths of the present study include the controlled feeding study design, the evaluation of components from three botanical families associated with decreased cancer and other chronic disease risk, the 2-week duration of each study period and the cross-over study design that allowed each participant to act as his/her own control. Additionally, as the fruits and vegetables on the intervention diet were given on a g/kg body-weight basis, the present data provide variability that would be typical with a range of intakes, providing greater generalisability to the general population. A novel aspect of the study is the comparison of the compounds annotated in the intervention study with the cross-sectional data via 3DFR and FFQ, providing real-world context for the potential biomarkers identified.
There are also several limitations that should be noted. In analysing only the LC–MS/MS positive-ion mode data, we are necessarily missing groups of compounds that are unlikely to be observed in this manner. In order to be as complete as currently possible, a metabolomic profile of urine would need to include both positive- and negative-mode LC–MS/MS analysis, as well as GC–MS and NMR analysis. However, running the samples in duplicate and keeping the union of ions detected across replicates allowed us to recover more low-abundance ions than a single run would have allowed, and to analyse the reproducibility of ion intensity measurements. Although values were missing for a large percentage of ions, imputation of these values allowed for the discovery of many more differentially abundant ions, without biasing the analysis. Additionally, while the detection and annotation of many plant-food metabolites in the F&V diet lends confidence that many of the annotations in the present study are accurate, standards were not run in order to generate definitive MS/MS fragment spectra for these compounds on our instrument. As a result, the identification of any single compound, with or without MS/MS fragment ion evidence, must be treated as a putative annotation.
One of the most challenging issues in metabolomics remains in the identification of metabolites and the determination of specific pathways influenced by a particular set of metabolites. Although the HMDB is currently one of the richest resources for metabolite information, there are some shortcomings associated with its use in the context of nutrition research. First, many ions present in the urine are not present in the HMDB or other databases, or are modified versions of compounds in the HMDB, making identification difficult. Second, the database is enriched for drugs and other exogenous compounds, leading to some improbable annotations. In several instances, ions mass-matched to several potential metabolites, in very disparate classes of compounds. Finally, although some information pertaining to pathway involvement for each metabolite is provided, it is broad and not intended to make connections between the metabolites observed.
In summary, proline betaine, sulforaphane and several isoflavones were robust biomarkers of intake in the present feeding study for citrus, crucifers and soya, respectively. However, only proline betaine was annotated in the urine based on 3DFR from individuals who were high v. low consumers of the same three plant foods, and there were no metabolites that significantly separated groups based on FFQ. This speaks to the inability of these biomarkers, which are quickly metabolised and excreted, to adequately distinguish high v. low consumers of these plant foods in free-living individuals. Several compounds were putatively annotated that have not previously been associated with fruit and vegetable consumption, highlighting the utility of untargeted metabolomics in nutrition intervention studies. The relative increase in the urinary excretion of shorter-chain acylcarnitines and TCA-cycle intermediates suggests that there may be a change in energy utilisation from glucose to fat with diets low in fruit and vegetables. Further studies are needed to replicate these findings. The consistent finding of acylcarnitines present in greater abundance in the diets of lower fruit and vegetable intake is novel and warrants further evaluation.
Supplementary material
To view supplementary material for this article, please visit http://dx.doi.org/10.1017/S000711451300127X
Acknowledgements
The present study was supported by grants R01CA142695, R56CA70913, R25CA94880 and P30CA015704 from the National Institutes of Health, National Cancer Institute. Partial funding for the linear trap quadrupole Fourier transform mass spectrometer used in the study was provided by the M.J. Murdock Charitable Trust.
The authors' contributions are as follows: J. W. L. and M. W. M. designed the research; Y. S., L. L. and J. W. L. conducted the research; J. H. and Y. O. performed the assays; D. H. M., I. R., L. L., T. H. and M. W. M. analysed the data; S. L. N. and J. W. L. interpreted the data; D. H. M., S. L. N., J. W. L. and M. W. M. wrote the manuscript; J. W. L. had primary responsibility for the final content. All authors read and approved the final manuscript.
The authors have no conflict of interest.