





1. Introduction
Buoyancy-driven convection in porous media spans diverse applications, scales and flow regimes (Kong & Saar Reference Kong and Saar2013; Nield & Bejan Reference Nield and Bejan2017; Hewitt Reference Hewitt2020; Wood, He & Apte Reference Wood, He and Apte2020; De Paoli Reference De Paoli2023), including geothermal energy systems (Kohl et al. Reference Kohl, Evans, Hopkirk, Jung and Rybach1997; Saar Reference Saar2011; Scott, Driesner & Weis Reference Scott, Driesner and Weis2016), thermal energy storage (Mabrouk et al. Reference Mabrouk, Naji, Benim and Dhahri2022) and advanced high-temperature gas-cooled reactors (Bu et al. Reference Bu, Li, Ma, Sun, Zhang and Chen2020). Horton–Rogers–Lapwood convection (HRLC), the porous medium equivalent of Rayleigh–Bénard convection, describes the basic phenomenon of a porous medium bounded by a hot bottom surface and a cold top surface, as shown in figure 1(a) (Horton & Rogers Jr Reference Horton and Rogers1945; Nield & Bejan Reference Nield and Bejan2017). The HRLC has been extensively studied across scales, from Darcy to non-Darcy regimes, through numerical simulations (Liu et al. Reference Liu, Jiang, Chong, Zhu, Wan, Verzicco, Stevens, Lohse and Sun2020; Korba & Li Reference Korba and Li2022; Zhu et al. Reference Zhu, Fu and De Paoli2024) and laboratory experiments (Elder Reference Elder1967; Kladias & Prasad Reference Kladias and Prasad1991; Keene & Goldstein Reference Keene and Goldstein2015; Ataei-Dadavi et al. Reference Ataei-Dadavi, Chakkingal, Kenjeres, Kleijn and Tummers2019; Bavandla & Srinivasan Reference Bavandla and Srinivasan2025). However, direct observation of buoyancy-driven convection at field scales remains challenging, often relying on indirect methods such as magnetotelluric imaging of high-conductivity zones (Samrock et al. Reference Samrock, Grayver, Eysteinsson and Saar2018).
Numerous studies use Darcy-scale governing equations to describe the macroscopic dynamics of HRLC, averaging model properties (e.g. thermo-physical properties, porosities and permeabilities) over a representative elementary volume (REV) (Whitaker Reference Whitaker2013; Nield & Bejan Reference Nield and Bejan2017; De Paoli Reference De Paoli2023). These models simplify domain geometry and the dynamics by spatially averaging properties relevant to momentum and heat transfer, typically assuming thermal equilibrium, inertia-free conditions. Despite strong convection, many models reduce to Darcy–Oberbeck–Boussinesq (DOB) equations, neglecting inertial terms and the sub-REV dynamics at small Darcy numbers (Hewitt, Neufeld & Lister Reference Hewitt, Neufeld and Lister2012; Korba & Li Reference Korba and Li2022). To address situations where inertial effects are non-negligible, extensions of the DOB framework incorporate Brinkman and Forchheimer terms (Nield & Bejan Reference Nield and Bejan2017) or local thermal non-equilibrium models (Bear Reference Bear2013; Karani & Huber Reference Karani and Huber2017). These approaches allow for more accurate representation of velocity and temperature fields in regimes where Darcy’s assumptions begin to break down. In parallel, to represent sub-REV processes within the REV-scale framework, closure models – such as dispersion tensors (Bear Reference Bear2013) – are introduced into the governing equations. These additions help capture the effects of microscale heterogeneities and mixing that are otherwise averaged out in traditional Darcy-scale models. The reliability and applicability of such models are typically assessed via laboratory experiments and direct numerical simulations (DNS), which, despite offering valuable insights, are constrained by spatial resolution, computational cost and the persistent challenge of upscaling microscale processes to the REV scale.
To characterise the HRLC dynamics across scales, key dimensionless groups serve as fundamental model inputs, derived via dimensional analysis (Nield & Bejan Reference Nield and Bejan2017). The dimensionless fluid Rayleigh number (Ra $_{\mkern -2mu f}$
), defined as
$_{\mkern -2mu f}$
), defined as
 \begin{equation} \textit {Ra}_{\mkern -2mu f} = \frac {g \beta _{\mkern -2mu f} \Delta \textit{TH}^3}{\alpha _{\mkern -2mu f} \nu }, \end{equation}
characterises buoyancy-driven flow in the absence of a porous medium, where $g$
$g$ $(\text{L}\,\text{T}^{- 2})$
is gravitational acceleration,
$(\text{L}\,\text{T}^{- 2})$
is gravitational acceleration, $\beta _{\mkern -2mu f}$ $(\text{K}^{-1})$
the fluid thermal expansion coefficient,
$(\text{K}^{-1})$
the fluid thermal expansion coefficient, $\Delta T = T_{\mkern -2mu H} - T_{\mkern -2mu C}$ $(\text{K})$
the temperature difference between the hot and cold boundaries,
$(\text{K})$
the temperature difference between the hot and cold boundaries, $H$
$H$ $(\text{L})$
the domain height,
$(\text{L})$
the domain height, $\alpha _{\mkern -2mu f}$ $(\text{L}^2\,\text{T}^{- 1})$
the fluid’s thermal diffusivity and
$(\text{L}^2\,\text{T}^{- 1})$
the fluid’s thermal diffusivity and $\nu$
$\nu$ $(\text{L}^2\,\text{T}^{- 1})$
its kinematic viscosity. Here, Ra
$(\text{L}^2\,\text{T}^{- 1})$
its kinematic viscosity. Here, Ra $_{\mkern -2mu f}$
quantifies the competition between buoyancy forces and the combined damping effects of viscosity and thermal diffusion.
$_{\mkern -2mu f}$
quantifies the competition between buoyancy forces and the combined damping effects of viscosity and thermal diffusion.
In the presence of porous media, buoyancy-driven flow is typically characterised by the so-called Darcy–Rayleigh number ( $Ra^*$
), which incorporates the intrinsic permeability
$Ra^*$
), which incorporates the intrinsic permeability $K$
$K$ $(\text{L}^2)$
of the porous medium under laminar flow conditions. It is defined as (Combarnous & Bories Reference Combarnous and Bories1975)
$(\text{L}^2)$
of the porous medium under laminar flow conditions. It is defined as (Combarnous & Bories Reference Combarnous and Bories1975)
 \begin{equation} \textit {Ra}^* = \frac {g \beta _{\mkern -2mu f} (T_{\mkern -2mu H} - T_{\mkern -2mu C}) \textit{KH}}{\alpha _{\mkern -2mu m} \nu _{\mkern -2mu }} = \textit {Ra}_{\mkern -2mu f} \, \textit {Da} \, \frac {k_{\mkern -2mu f}}{k_{\mkern -2mu m}}, \end{equation}
where Da is the dimensionless Darcy number, given by $\textit {Da} = K / H^2$
, and
$\textit {Da} = K / H^2$
, and $k_{\mkern -2mu f} / k_{\mkern -2mu m} = \lambda$
is the ratio of fluid to effective thermal conductivities of the porous medium. The Darcy number relates the medium’s permeability to the characteristic length scale of the system, providing a measure of how strongly the porous structure constrains fluid flow. A decreasing Darcy number indicates that the porous medium becomes a porous continuum, assuming the intra-porous dynamics is effectively averaged out on the characteristic length scale, as demonstrated in figure 16. Since the effective diffusivity
$k_{\mkern -2mu f} / k_{\mkern -2mu m} = \lambda$
is the ratio of fluid to effective thermal conductivities of the porous medium. The Darcy number relates the medium’s permeability to the characteristic length scale of the system, providing a measure of how strongly the porous structure constrains fluid flow. A decreasing Darcy number indicates that the porous medium becomes a porous continuum, assuming the intra-porous dynamics is effectively averaged out on the characteristic length scale, as demonstrated in figure 16. Since the effective diffusivity $\alpha _{\mkern -2mu m} = ( {k_{\mkern -2mu m}}/{(\rho c_p)_f})$
is an output of the system’s geometry, studies typically use the solid-to-fluid thermal conductivity ratio (
$\alpha _{\mkern -2mu m} = ( {k_{\mkern -2mu m}}/{(\rho c_p)_f})$
is an output of the system’s geometry, studies typically use the solid-to-fluid thermal conductivity ratio ( $ k_{\mkern -2mu r} = k_{\mkern -2mu s} / k_{\mkern -2mu f}$
) and the volumetric heat capacity ratio (
$ k_{\mkern -2mu r} = k_{\mkern -2mu s} / k_{\mkern -2mu f}$
) and the volumetric heat capacity ratio ( $ \sigma = (\rho c_{\mkern -2mu p})_{\mkern -2mu s} / (\rho c_{\mkern -2mu p})_{\mkern -2mu f}$
) as input parameters. Note that
$ \sigma = (\rho c_{\mkern -2mu p})_{\mkern -2mu s} / (\rho c_{\mkern -2mu p})_{\mkern -2mu f}$
) as input parameters. Note that $\alpha _{\mkern -2mu m}$
is expressed with
$\alpha _{\mkern -2mu m}$
is expressed with $(\rho c_p)_f$
in the denominator, because the advective heat transport in the porous energy equation is carried solely by the fluid phase, while the solid enters only through conduction and storage terms. Here,
$(\rho c_p)_f$
in the denominator, because the advective heat transport in the porous energy equation is carried solely by the fluid phase, while the solid enters only through conduction and storage terms. Here, $\rho$
(ML
$\rho$
(ML $^{-3}$
) is the density,
$^{-3}$
) is the density, $c_p$
(L
$c_p$
(L $^2$
T
$^2$
T $^{-2}$
K
$^{-2}$
K $^{-1}$
) is the isobaric heat capacity.
$^{-1}$
) is the isobaric heat capacity.
The dimensionless fluid Prandtl number ( $\textit{Pr}_{\mkern -2mu f}$
) is defined as
$\textit{Pr}_{\mkern -2mu f}$
) is defined as
 \begin{equation} \textit{Pr}_{\mkern -2mu f} = \frac {\nu _{\mkern -2mu }}{\alpha _{\mkern -2mu f}}, \end{equation}
and quantifies the ratio of momentum to thermal diffusivity, describing the fluid’s relative viscous and thermal transport behaviour.
Wang & Bejan (Reference Wang and Bejan1987) proposed that under strongly convective conditions in porous media, the buoyancy force is balanced by the inertial resistance described by the Forchheimer term, leading to the relation
 \begin{equation} \left | c_{\mkern -2mu F} \frac {U^2}{K^{1/2}} \right | \sim | g \beta _f \Delta T|, \end{equation}
where $c_{\mkern -2mu F}$
is the dimensionless form drag coefficient of the porous matrix. Based on this balance, they introduced a new dimensionless group, the porous-medium Prandtl number (
$c_{\mkern -2mu F}$
is the dimensionless form drag coefficient of the porous matrix. Based on this balance, they introduced a new dimensionless group, the porous-medium Prandtl number ( $\textit{Pr}_{\mkern -2mu p}$
), defined as
$\textit{Pr}_{\mkern -2mu p}$
), defined as
 \begin{equation} \textit{Pr}_{\mkern -2mu p} = \frac {\textit{Pr}_{\mkern -2mu f}}{c_{\mkern -2mu F} \sqrt {\textit {Da}}} \frac {k_{\mkern -2mu f}}{k_{\mkern -2mu m}}, \end{equation}
which accounts for the permeability, form drag and the ratio of thermal diffusivities of the fluid and the porous medium.
A key output of natural convection studies is the heat transfer efficiency, quantified by the dimensionless Nusselt number ( $\textit{Nu}$
) that represents the ratio of total heat transfer (convective + conductive) to purely conductive transfer
$\textit{Nu}$
) that represents the ratio of total heat transfer (convective + conductive) to purely conductive transfer
 \begin{equation} \textit {Nu} = \frac {q_{\textit{tot}}}{q_{\textit{cond}}}. \end{equation}
Elder (Reference Elder1967) experimentally studied HRLC in uniform granular porous media and a Hele-Shaw (HS) cell. Convective heat transport was examined via the $\textit{Nu}$
–
$\textit{Nu}$
– $Ra^*$
relationship. Convection onset occurred at
$Ra^*$
relationship. Convection onset occurred at $Ra$
$Ra$ $^{*}\approx 40$
(
$^{*}\approx 40$
( $\pm$
10 %), closely matching the theoretical prediction of
$\pm$
10 %), closely matching the theoretical prediction of $4\pi ^2$
from linear stability analysis of a steady Darcy-scale system (Nield & Bejan Reference Nield and Bejan2017). Beyond onset,
$4\pi ^2$
from linear stability analysis of a steady Darcy-scale system (Nield & Bejan Reference Nield and Bejan2017). Beyond onset, $\textit{Nu}$
was shown to scale with
$\textit{Nu}$
was shown to scale with $Ra^*$
. For media of larger grains, the
$Ra^*$
. For media of larger grains, the $\textit{Nu}$
–
$\textit{Nu}$
– $Ra^*$
trend flattened between
$Ra^*$
trend flattened between $Ra^* = 10^2$
and
$Ra^* = 10^2$
and $Ra^* = 10^3$
, indicating a breakdown of the inertia-free assumption as the boundary layer (BL) approaches the porous-medium scale. Buretta & Berman (Reference Buretta and Berman1976) experimentally showed that a Rayleigh number based on fluid-saturated bed properties effectively correlates data across permeable beds, provided that the pore size remains below the BL thickness. Kladias & Prasad (Reference Kladias and Prasad1991) extended earlier findings by examining the influence of porosity (fluid volume fraction,
$Ra^* = 10^3$
, indicating a breakdown of the inertia-free assumption as the boundary layer (BL) approaches the porous-medium scale. Buretta & Berman (Reference Buretta and Berman1976) experimentally showed that a Rayleigh number based on fluid-saturated bed properties effectively correlates data across permeable beds, provided that the pore size remains below the BL thickness. Kladias & Prasad (Reference Kladias and Prasad1991) extended earlier findings by examining the influence of porosity (fluid volume fraction, $ \varphi$
(–), fluid Prandtl number
$ \varphi$
(–), fluid Prandtl number $ \textit{Pr}_{\mkern -2mu f}$
, Darcy number
$ \textit{Pr}_{\mkern -2mu f}$
, Darcy number $ Da$
, and relative thermal conductivity ratio
$ Da$
, and relative thermal conductivity ratio $ \lambda = k_{\mkern -2mu f}/k_{\mkern -2mu m}$
. Their results are consistent with the Darcy–Brinkman–Forchheimer (DBF) model, showing increased heat transfer with larger
$ \lambda = k_{\mkern -2mu f}/k_{\mkern -2mu m}$
. Their results are consistent with the Darcy–Brinkman–Forchheimer (DBF) model, showing increased heat transfer with larger $ Da$
(
$ Da$
( $ Da = \textit {O}(10^{-6})$
–
$ Da = \textit {O}(10^{-6})$
– $\textit {O}(10^{-4})$
), higher modified Rayleigh numbers
$\textit {O}(10^{-4})$
), higher modified Rayleigh numbers $ Ra^*$
(
$ Ra^*$
( $ Ra^* = \textit {O}(10^{0})$
–
$ Ra^* = \textit {O}(10^{0})$
– $\textit {O}(10^{6})$
) and elevated
$\textit {O}(10^{6})$
) and elevated $ \textit{Pr}_{\mkern -2mu f}$
(e.g. comparing water and glycerol). However, their measurements suggest that the DBF model underestimates the stabilising effect of highly conductive solid matrices, resulting in lower Nusselt numbers than predicted. Regarding the asymptotic, inertial regime, Keene & Goldstein (Reference Keene and Goldstein2015) report in a packed-bed experiment a scaling of
$ \textit{Pr}_{\mkern -2mu f}$
(e.g. comparing water and glycerol). However, their measurements suggest that the DBF model underestimates the stabilising effect of highly conductive solid matrices, resulting in lower Nusselt numbers than predicted. Regarding the asymptotic, inertial regime, Keene & Goldstein (Reference Keene and Goldstein2015) report in a packed-bed experiment a scaling of $ \textit{Nu} \propto Ra_{\mkern -2mu f}^{0.298}$
in the classical regime, and
$ \textit{Nu} \propto Ra_{\mkern -2mu f}^{0.298}$
in the classical regime, and $ \textit{Nu} \propto (Ra^*)^{0.319}$
using the Darcy–Rayleigh scaling at
$ \textit{Nu} \propto (Ra^*)^{0.319}$
using the Darcy–Rayleigh scaling at $ Da = \textit {O}(10^{-5})$
. Bavandla & Srinivasan (Reference Bavandla and Srinivasan2025) experimentally examined the effect of
$ Da = \textit {O}(10^{-5})$
. Bavandla & Srinivasan (Reference Bavandla and Srinivasan2025) experimentally examined the effect of $\lambda$
on HRLC at Darcy numbers (
$\lambda$
on HRLC at Darcy numbers ( $Da = \textit {O}(10^{-8})$
–
$Da = \textit {O}(10^{-8})$
– $\textit {O}(10^{-7})$
) in a packed bed with
$\textit {O}(10^{-7})$
) in a packed bed with $\lambda \leqslant \textit {O}(10^{-2})$
. To account for inertial effects, they use the porous-medium Prandtl number (
$\lambda \leqslant \textit {O}(10^{-2})$
. To account for inertial effects, they use the porous-medium Prandtl number ( $\textit{Pr}_{\mkern -2mu p}$
) and observe that the transition to inertial HRLC occurs when
$\textit{Pr}_{\mkern -2mu p}$
) and observe that the transition to inertial HRLC occurs when $Ra^* \sim \textit{Pr}_{\mkern -2mu p}$
. Deviations from this criterion are attributed to violations of the porous-continuum assumption at large Darcy numbers.
$Ra^* \sim \textit{Pr}_{\mkern -2mu p}$
. Deviations from this criterion are attributed to violations of the porous-continuum assumption at large Darcy numbers.
(a) Fully saturated porous domain with solid inclusions (black) selected to study HRLC. Relevant geometric scales are indicated and presented in table 2. (b) Benchmark model used in § 2.2 after Merrikh & Lage (Reference Merrikh and Lage2005). The domain hosts 16 unit cells (dotted), each unit cell has length $a + 2b$
with
$a + 2b$
with $a = 3b$
and
$a = 3b$
and $b = 12$
lattice nodes.
$b = 12$
lattice nodes.

Direct numerical simulations have significantly advanced the understanding of natural convection by allowing controlled exploration of parameter spaces. Merrikh & Lage (Reference Merrikh and Lage2005) analysed solid geometry effects on convection using a two-dimensional model with square rods in a regular array. Their configuration applied a temperature gradient perpendicular to gravity, as illustrated in figure 1(b), deviating from the classic HRLC set-up shown in figure 1(a). They showed that heat transfer is strongly influenced by the number of blocks and resulting permeability, affecting the Darcy number ( $Da$
). In models similar to figure 1(b), Raji et al. (Reference Raji, Hasnaoui, Naïmi, Slimani and Ouazzani2012) investigated porosities (
$Da$
). In models similar to figure 1(b), Raji et al. (Reference Raji, Hasnaoui, Naïmi, Slimani and Ouazzani2012) investigated porosities ( $ \varphi$
) from 90 % to 58 %, Darcy numbers (
$ \varphi$
) from 90 % to 58 %, Darcy numbers ( $ Da$
) of
$ Da$
) of $ \textit {O}(10^{-5})$
–
$ \textit {O}(10^{-5})$
– $ \textit {O}(10^{-6})$
and conductivity ratios (
$ \textit {O}(10^{-6})$
and conductivity ratios ( $ k_{\mkern -2mu r}$
) ranging from
$ k_{\mkern -2mu r}$
) ranging from $ 10^{-3}$
to
$ 10^{-3}$
to $ 10^{3}$
, focusing on solid block fragmentation and thermal transport. For
$ 10^{3}$
, focusing on solid block fragmentation and thermal transport. For $10^{-1} \leqslant k_{\mkern -2mu r} \leqslant 10^{1}$
,
$10^{-1} \leqslant k_{\mkern -2mu r} \leqslant 10^{1}$
, $\textit{Nu}$
decreased significantly with increasing
$\textit{Nu}$
decreased significantly with increasing $k_{\mkern -2mu r}$
. For
$k_{\mkern -2mu r}$
. For $ k_{\mkern -2mu r} \in (-\infty , 10^{-2}] \cup [10^{2}, \infty )$
,
$ k_{\mkern -2mu r} \in (-\infty , 10^{-2}] \cup [10^{2}, \infty )$
, $\textit{Nu}$
remained largely insensitive to
$\textit{Nu}$
remained largely insensitive to $k_{\mkern -2mu r}$
. Karani & Huber (Reference Karani and Huber2017) performed DNS of HRLC at the onset of convection in a square block array with porosity
$k_{\mkern -2mu r}$
. Karani & Huber (Reference Karani and Huber2017) performed DNS of HRLC at the onset of convection in a square block array with porosity $\varphi = 50\,\%$
, and compared the results with Darcy-scale simulations using the DOB model, incorporating both local thermal equilibrium and local thermal non-equilibrium formulations. For Ra
$\varphi = 50\,\%$
, and compared the results with Darcy-scale simulations using the DOB model, incorporating both local thermal equilibrium and local thermal non-equilibrium formulations. For Ra $^* \leqslant 200$
, convection onset deviated from
$^* \leqslant 200$
, convection onset deviated from $4\pi ^2$
when
$4\pi ^2$
when $k_{\mkern -2mu r} \neq 1$
. For
$k_{\mkern -2mu r} \neq 1$
. For $k_{\mkern -2mu r} = 1/13$
, the onset occurs earlier (
$k_{\mkern -2mu r} = 1/13$
, the onset occurs earlier ( $\sim 35$
) and
$\sim 35$
) and $\textit{Nu}$
increases more steeply than in homogeneous models (
$\textit{Nu}$
increases more steeply than in homogeneous models ( $k_{\mkern -2mu r} = 1$
). In contrast, for
$k_{\mkern -2mu r} = 1$
). In contrast, for $k_{\mkern -2mu r} = 50$
, convection sets in later, and
$k_{\mkern -2mu r} = 50$
, convection sets in later, and $\textit{Nu}$
exhibits a more gradual increase. When
$\textit{Nu}$
exhibits a more gradual increase. When $k_{\mkern -2mu r} = 1$
, their results matched the Darcy-scale simulations at the onset of convection. In a follow up study, Karani et al. (Reference Karani, Rashtbehesht, Huber and Magin2017) introduced a fractional-order derivative model in the heat equation to refine Darcy-scale simulations and align them with pore-scale results. The fractional-order model characterises the intermediate behaviours between advective and diffusive regimes and accounts for macroscopic thermal dispersion effects. Liu et al. (Reference Liu, Jiang, Chong, Zhu, Wan, Verzicco, Stevens, Lohse and Sun2020) highlight the effect of porosity on heat transfer, driven by competing effects of flow coherence and porous resistance. They simulated the transition from pure Rayleigh–Bénard convection (RBC) to porous convection in square arrays, 45° rotated arrays and random porous media at
$k_{\mkern -2mu r} = 1$
, their results matched the Darcy-scale simulations at the onset of convection. In a follow up study, Karani et al. (Reference Karani, Rashtbehesht, Huber and Magin2017) introduced a fractional-order derivative model in the heat equation to refine Darcy-scale simulations and align them with pore-scale results. The fractional-order model characterises the intermediate behaviours between advective and diffusive regimes and accounts for macroscopic thermal dispersion effects. Liu et al. (Reference Liu, Jiang, Chong, Zhu, Wan, Verzicco, Stevens, Lohse and Sun2020) highlight the effect of porosity on heat transfer, driven by competing effects of flow coherence and porous resistance. They simulated the transition from pure Rayleigh–Bénard convection (RBC) to porous convection in square arrays, 45° rotated arrays and random porous media at $k_{\mkern -2mu r} = 1$
with
$k_{\mkern -2mu r} = 1$
with $\varphi \geqslant 67\,\%$
. For high porosity (
$\varphi \geqslant 67\,\%$
. For high porosity ( $\varphi \geqslant 70\,\%$
), their results showed that porous media stabilise convection cells, enhancing heat transfer by over 10 % compared with pure RBC, indicating that porous drag is not always dominant. The
$\varphi \geqslant 70\,\%$
), their results showed that porous media stabilise convection cells, enhancing heat transfer by over 10 % compared with pure RBC, indicating that porous drag is not always dominant. The $\textit{Nu}$
–
$\textit{Nu}$
– $Ra_{\mkern -2mu f}$
scaling exhibit two regimes: a lower regime (
$Ra_{\mkern -2mu f}$
scaling exhibit two regimes: a lower regime ( $\textit{Nu} \propto {Ra}_{\mkern -2mu f}^{0.65}$
at
$\textit{Nu} \propto {Ra}_{\mkern -2mu f}^{0.65}$
at $\varphi = 75\,\%$
) and an upper regime that converges to the pure RBC scaling law (
$\varphi = 75\,\%$
) and an upper regime that converges to the pure RBC scaling law ( $\textit{Nu} \propto {Ra}_{\mkern -2mu f}^{0.3}$
). They predict that the transition occurs when the thermal BL thickness (
$\textit{Nu} \propto {Ra}_{\mkern -2mu f}^{0.3}$
). They predict that the transition occurs when the thermal BL thickness ( $\delta _{\textit{th}}$
) equals the pore-throat length (
$\delta _{\textit{th}}$
) equals the pore-throat length ( $l_{\textit{pore}}$
), calculated as
$l_{\textit{pore}}$
), calculated as $\delta _{\textit{th}} = H / (2\textit{Nu})$
under the assumption of a perfectly mixed domain. Korba & Li (Reference Korba and Li2022) studied conjugate heat transfer in a square array of square-shaped porous media with porosities
$\delta _{\textit{th}} = H / (2\textit{Nu})$
under the assumption of a perfectly mixed domain. Korba & Li (Reference Korba and Li2022) studied conjugate heat transfer in a square array of square-shaped porous media with porosities $75\,\% \geqslant \varphi \geqslant 36\,\%$
, using DNS and comparing results with DOB models. They found that pore-scale parameters strongly affect the
$75\,\% \geqslant \varphi \geqslant 36\,\%$
, using DNS and comparing results with DOB models. They found that pore-scale parameters strongly affect the $ \textit{Nu}$
–
$ \textit{Nu}$
– $ Ra^*$
scaling, with DNS yielding
$ Ra^*$
scaling, with DNS yielding $ \textit{Nu} \propto (Ra^{*})^{0.319}$
at high
$ \textit{Nu} \propto (Ra^{*})^{0.319}$
at high $ Ra$
, while the DOB model predicts a steeper scaling of
$ Ra$
, while the DOB model predicts a steeper scaling of $ \textit{Nu} \propto (Ra^{*})^{0.9}$
. This discrepancy is likely attributed to the small Darcy number assumption in the DOB model, which ensures that
$ \textit{Nu} \propto (Ra^{*})^{0.9}$
. This discrepancy is likely attributed to the small Darcy number assumption in the DOB model, which ensures that $ Ra^* \ll \textit{Pr}_{\!p}$
across all cases, thereby justifying the exclusion of inertial effects.
$ Ra^* \ll \textit{Pr}_{\!p}$
across all cases, thereby justifying the exclusion of inertial effects.
In the context of pure hydrodynamics in porous media composed of cylinder arrays, Khalifa, Pocher & Tilton (Reference Khalifa, Pocher and Tilton2020) used DNS to investigate the transition from laminar to inertial flows. For staggered configurations, they examined porosities ranging from 90 % to 30 % and identified two asymptotic dynamical regimes: laminar flow at low Reynolds numbers (Darcy regime) and vortex shedding at high Reynolds numbers, using the cylinder diameter as the characteristic length scale. Between these, they defined intermediate regimes referred to as the transition and Forchheimer regimes. As porosity decreases, the laminar regime extends to higher Reynolds numbers, and the transition regime broadens. However, below 40 % porosity, they observed a marked shift: the Forchheimer regime vanishes, and vortex shedding emerges directly from an early inertial regime.
Despite extensive experimental and numerical studies on HRLC, several limitations remain. Many experiments and simulations apply the Darcy–Rayleigh scaling well into the inertial regime, even though this scaling inherently arises from a force balance between porous drag and buoyancy, making it unsuitable for capturing inertial effects. While experiments of packed beds offer valuable domain-scale data, their opacity limits the direct observation of pore- to domain-scale interactions, particularly during the onset of inertial convection. Direct numerical simulations can capture these effects but are typically performed in highly porous media ( $\varphi \gt 45 \,\%$
), leaving lower-porosity cases underexplored. Furthermore, many studies use square arrays aligned with the forcing direction, which reduces tortuosity effects and introduces pure-fluid layers at the domain boundaries.
$\varphi \gt 45 \,\%$
), leaving lower-porosity cases underexplored. Furthermore, many studies use square arrays aligned with the forcing direction, which reduces tortuosity effects and introduces pure-fluid layers at the domain boundaries.
Karani et al. (Reference Karani, Rashtbehesht, Huber and Magin2017) showed that the solid-to-fluid conductivity ratio ( $ k_{\mkern -2mu r} = k_{\mkern -2mu s} / k_{\mkern -2mu f}$
) significantly affects the onset of convection. For
$ k_{\mkern -2mu r} = k_{\mkern -2mu s} / k_{\mkern -2mu f}$
) significantly affects the onset of convection. For $ k_{\mkern -2mu r} \lt 1$
, representing insulating solids, the system becomes more prone to instability, and convection initiates at lower Darcy–Rayleigh numbers. Conversely, for
$ k_{\mkern -2mu r} \lt 1$
, representing insulating solids, the system becomes more prone to instability, and convection initiates at lower Darcy–Rayleigh numbers. Conversely, for $ k_{\mkern -2mu r} \gt 1$
, heat is more efficiently conducted through the solid matrix, delaying the onset. Korba & Li (Reference Korba and Li2022) investigated the influence of both
$ k_{\mkern -2mu r} \gt 1$
, heat is more efficiently conducted through the solid matrix, delaying the onset. Korba & Li (Reference Korba and Li2022) investigated the influence of both $ k_{\mkern -2mu r}$
and the volumetric heat capacity ratio
$ k_{\mkern -2mu r}$
and the volumetric heat capacity ratio $ \sigma$
in the asymptotic, inertial regime at
$ \sigma$
in the asymptotic, inertial regime at $ Ra^* \gt 10^3$
. Wang & Bejan (Reference Wang and Bejan1987) propose a transition criterion from laminar to inertial HRLC at
$ Ra^* \gt 10^3$
. Wang & Bejan (Reference Wang and Bejan1987) propose a transition criterion from laminar to inertial HRLC at $Ra^* \sim \textit{Pr}_{\mkern -2mu p}$
.
$Ra^* \sim \textit{Pr}_{\mkern -2mu p}$
.
The objective of this study is to understand how porosity and diffusivity contrasts between the solid and fluid phases affect the transition from laminar to inertial HRLC. A central question is how local instabilities govern the global transition to an inertia-driven regime. This is achieved using a lattice Boltzmann model that resolves the Navier–Stokes–Fourier dynamics. Simulations are conducted in a square porous cavity featuring a 45° oriented staggered cylinder array, with porosity decreasing from 43 % to 33 %. Half-cylinders are placed along the cavity walls to embed the porous structure into the thermal BLs (figure 1).
The study begins by analysing purely hydrodynamic flow to understand how inertial effects emerge at the pore scale and influence domain-scale behaviour. From this, a local criterion for inertial flow is derived and applied statistically across the domain to estimate the fraction of pores required to trigger global transition. We then explore how decreasing porosity affects this transition, first in pure hydrodynamics and then in HRLC. The hydrodynamic analysis provides a controlled basis to isolate the influence of thermal conductivity contrast $ k_{\mkern -2mu r}$
on the onset of inertial convection. Finally, we examine the combined role of porosity and conductivity ratio across laminar and inertial regimes using a Darcy–Forchheimer framework. Although the geometry is idealised and isotropic, the approach captures key mechanisms governing porous convection.
$ k_{\mkern -2mu r}$
on the onset of inertial convection. Finally, we examine the combined role of porosity and conductivity ratio across laminar and inertial regimes using a Darcy–Forchheimer framework. Although the geometry is idealised and isotropic, the approach captures key mechanisms governing porous convection.
The paper is structured as follows. Section 2 introduces the porous model, governing equations and lattice Boltzmann method (LBM) implementation, along with benchmarking. Section 3 establishes a hydrodynamic and convective baseline at 43 % porosity, then analyses the transition to inertial HRLC in a homogeneous setting. Section 4 investigates how the porosity and conductivity ratio $k_{\mkern -2mu r}$
modulate inertial transitions. The combined impact of the porosity and conductivity ratio is then assessed within the Darcy–Forchheimer framework and discussed using the concept of plume-scale confinement
$k_{\mkern -2mu r}$
modulate inertial transitions. The combined impact of the porosity and conductivity ratio is then assessed within the Darcy–Forchheimer framework and discussed using the concept of plume-scale confinement $\varLambda$
(Noto, Letelier & Ulloa Reference Noto, Letelier and Ulloa2024). Section 5 concludes with the key findings and their implications for inertial porous convection.
$\varLambda$
(Noto, Letelier & Ulloa Reference Noto, Letelier and Ulloa2024). Section 5 concludes with the key findings and their implications for inertial porous convection.
2. Methods
2.1. Governing equations, Navier–Stokes–Fourier system
The governing dynamics in pore-scale HRLC is fully described by mass, momentum and energy conservation for an incompressible fluid, following the low-Mach-number assumption. We express the equations in dimensionless form under the Boussinesq approximation, which considers density variations only in the buoyancy term. To achieve this, it is necessary to define characteristic quantities, including a characteristic velocity $u_{\mkern -2mu 0}$
(L T−1), and time scale
$u_{\mkern -2mu 0}$
(L T−1), and time scale $t_{\mkern -2mu 0}$
(T). Anticipating the role of inertia, we employ a free-fall velocity scale derived from the balance between inertia and buoyancy at the system’s quasi-steady state
$t_{\mkern -2mu 0}$
(T). Anticipating the role of inertia, we employ a free-fall velocity scale derived from the balance between inertia and buoyancy at the system’s quasi-steady state
 \begin{equation} |(\boldsymbol{u} \boldsymbol{\cdot }\boldsymbol{\nabla }) \boldsymbol{u}| \sim |g \beta _{\mkern -2mu f} \Delta T|. \end{equation}
Here, $\boldsymbol{u}$
(L T−1) represents the fluid’s velocity,
$\boldsymbol{u}$
(L T−1) represents the fluid’s velocity, $\boldsymbol{\nabla}$ $(\text{L}^{-1})$
denotes the spatial gradient and
$(\text{L}^{-1})$
denotes the spatial gradient and $\Delta T$
is the imposed temperature difference between the accelerated parcel of fluid and its reference temperature. This relationship leads us to define a velocity scale as the free-fall velocity
$\Delta T$
is the imposed temperature difference between the accelerated parcel of fluid and its reference temperature. This relationship leads us to define a velocity scale as the free-fall velocity
 \begin{align} u_{\mkern -2mu 0} = \sqrt {g \beta _{\mkern -2mu f} \Delta T H}, \end{align}
where $H$
is a characteristic length of the domain. The associated convective characteristic time scale is then
$H$
is a characteristic length of the domain. The associated convective characteristic time scale is then
 \begin{align} t_{\,\mkern -2mu 0} = \sqrt {\frac {H}{g \beta _{\mkern -2mu f} \Delta T}}. \end{align}
The resulting dimensionless, incompressible system retains the essential balance between convective and diffusive transport, governed by the Rayleigh number (Ra $_{\mkern -2mu f}$
) and Prandtl number ({Pr}
$_{\mkern -2mu f}$
) and Prandtl number ({Pr} $_{\mkern -2mu f}$
), and is given by (Liu et al. Reference Liu, Jiang, Chong, Zhu, Wan, Verzicco, Stevens, Lohse and Sun2020) as follows.
$_{\mkern -2mu f}$
), and is given by (Liu et al. Reference Liu, Jiang, Chong, Zhu, Wan, Verzicco, Stevens, Lohse and Sun2020) as follows.
Continuity equation
 \begin{equation} \boldsymbol {\nabla }\boldsymbol{\cdot }\boldsymbol{u} = 0 . \end{equation}
Momentum conservation (incompressible Navier–Stokes equation)
 \begin{equation} \frac {\partial \boldsymbol{u}}{\partial t} + (\boldsymbol{u} \boldsymbol {\cdot }\boldsymbol {\nabla }) \boldsymbol{u} = -\boldsymbol{\nabla }p + \sqrt {\frac {\textit{Pr}_{\mkern -2mu f}}{Ra_{\mkern -2mu f}}} {\nabla} ^2 \boldsymbol{u} + \theta _{\mkern -2mu f} \boldsymbol{e}_z . \end{equation}
Heat conservation in fluid
 \begin{equation} \frac {\partial \theta _{\mkern -2mu f}}{\partial t} + \boldsymbol{u} \boldsymbol{\cdot } \boldsymbol{\nabla }\theta _{\mkern -2mu f} = \sqrt {\frac {1}{Ra_{\mkern -2mu f} \textit{Pr}_{\mkern -2mu f}}} {\nabla} ^2 \theta _{\mkern -2mu f} . \end{equation}
Heat conservation in solid
 \begin{equation} \frac {\partial \theta _{\mkern -2mu s}}{\partial t} = \sqrt {\frac {\alpha _{\mkern -2mu r}}{Ra_{\mkern -2mu f} \textit{Pr}_{\mkern -2mu f}}} {\nabla} ^2 \theta _{\mkern -2mu s} . \end{equation}
Here, $\theta _{\mkern -2mu f}$
and
$\theta _{\mkern -2mu f}$
and $\theta _{\mkern -2mu s}$
represent the non-dimensional temperatures in the fluid and solid, scaled by
$\theta _{\mkern -2mu s}$
represent the non-dimensional temperatures in the fluid and solid, scaled by $\Delta T$
, respectively, while
$\Delta T$
, respectively, while $\boldsymbol{\nabla }p$
denotes the non-dimensional pressure gradient, scaled by the dynamic pressure scale
$\boldsymbol{\nabla }p$
denotes the non-dimensional pressure gradient, scaled by the dynamic pressure scale $\rho _{\mkern -2mu 0} (H/t_{\mkern -2mu 0})^2$
. The dimensionless parameter
$\rho _{\mkern -2mu 0} (H/t_{\mkern -2mu 0})^2$
. The dimensionless parameter $\alpha _{\mkern -2mu r} = \alpha _{\mkern -2mu s} / \alpha _{\mkern -2mu f}$
represents the ratio of solid to fluid thermal diffusivity.
$\alpha _{\mkern -2mu r} = \alpha _{\mkern -2mu s} / \alpha _{\mkern -2mu f}$
represents the ratio of solid to fluid thermal diffusivity.
At the fluid–solid interface $ \varOmega$
, with normal vector
$ \varOmega$
, with normal vector $ \boldsymbol{n}$
, the following boundary conditions are imposed in the porous domain: (i) no slip for velocity,
$ \boldsymbol{n}$
, the following boundary conditions are imposed in the porous domain: (i) no slip for velocity, $ \boldsymbol{u} = 0$
; (ii) continuity of temperature,
$ \boldsymbol{u} = 0$
; (ii) continuity of temperature, $ \theta _{\mkern -2mu f} = \theta _{\mkern -2mu s}$
; and (iii) continuity of normal heat flux,
$ \theta _{\mkern -2mu f} = \theta _{\mkern -2mu s}$
; and (iii) continuity of normal heat flux, $ k_{\mkern -2mu f} ( {\partial \theta _{\mkern -2mu f}}/{\partial \boldsymbol{n}}) = k_{\mkern -2mu s} ( {\partial \theta _{\mkern -2mu s}}/{\partial \boldsymbol{n}})$
, where
$ k_{\mkern -2mu f} ( {\partial \theta _{\mkern -2mu f}}/{\partial \boldsymbol{n}}) = k_{\mkern -2mu s} ( {\partial \theta _{\mkern -2mu s}}/{\partial \boldsymbol{n}})$
, where $ k_{\mkern -2mu f}$
and
$ k_{\mkern -2mu f}$
and $ k_{\mkern -2mu s}$
denote the thermal conductivities of the fluid and solid phases, respectively. Additionally, the top and bottom walls are held at constant temperatures
$ k_{\mkern -2mu s}$
denote the thermal conductivities of the fluid and solid phases, respectively. Additionally, the top and bottom walls are held at constant temperatures $ T_{\mkern -2mu H}$
and
$ T_{\mkern -2mu H}$
and $ T_{\mkern -2mu C}$
, representing the hot and cold boundaries, respectively, while the lateral walls are thermally insulated (adiabatic) (figure 1).
$ T_{\mkern -2mu C}$
, representing the hot and cold boundaries, respectively, while the lateral walls are thermally insulated (adiabatic) (figure 1).
2.2. Lattice Boltzmann method
2.2.1. Methodological overview
The LBM is employed as an efficient alternative to traditional Navier–Stokes–Fourier solvers in the low-Mach regime (Krüger et al. Reference Krüger, Kusumaatmaja, Kuzmin, Shardt, Silva and Viggen2017; Succi Reference Succi2018). The LBM solves the discrete velocity Boltzmann equation (DVBE)
 \begin{equation} \frac {\partial f_k}{\partial t} + \boldsymbol{c}_k \boldsymbol{\cdot }\boldsymbol{\nabla }f_k = \varOmega _k + F_k, \end{equation}
where $f_k$
denotes the particle distribution function along discrete velocities
$f_k$
denotes the particle distribution function along discrete velocities $\boldsymbol{c}_k$
,
$\boldsymbol{c}_k$
, $\varOmega _k$
is the collision operator and
$\varOmega _k$
is the collision operator and $F_k$
represents forcing terms. By appropriate choice of velocity discretisation and collision model, the compressible Navier–Stokes and energy equations can be recovered. In this study, two coupled three-dimensional, 19-velocity (D3Q19)-LBMs are used:
$F_k$
represents forcing terms. By appropriate choice of velocity discretisation and collision model, the compressible Navier–Stokes and energy equations can be recovered. In this study, two coupled three-dimensional, 19-velocity (D3Q19)-LBMs are used: $f_k$
for mass–momentum conservation and
$f_k$
for mass–momentum conservation and $g_k$
for energy conservation (Guo & Shu Reference Guo and Shu2013). Simulations are implemented within the open-source STLBM framework (Latt, Coreixas & Beny Reference Latt, Coreixas and Beny2021), which provides out-of-the-box GPU acceleration through modern C++ paradigms (Larkin & Stulova Reference Larkin and Stulova2024), thereby greatly reducing the computational time required for the extensive parametric studies conducted in this work.
$g_k$
for energy conservation (Guo & Shu Reference Guo and Shu2013). Simulations are implemented within the open-source STLBM framework (Latt, Coreixas & Beny Reference Latt, Coreixas and Beny2021), which provides out-of-the-box GPU acceleration through modern C++ paradigms (Larkin & Stulova Reference Larkin and Stulova2024), thereby greatly reducing the computational time required for the extensive parametric studies conducted in this work.
In the context of LBMs, the simulation of hydrodynamics with natural convection and conjugate heat transfer in porous media relies on several key features, summarised below, with additional technical details available in Appendix B.
-
(i) Hydrodynamics. The LBM relies on the collide-and-stream scheme
(2.9)which is second-order accurate in space and time (He, Chen & Doolen Reference He, Chen and Doolen1998; Krüger et al. Reference Krüger, Kusumaatmaja, Kuzmin, Shardt, Silva and Viggen2017). The collision model \begin{equation} f_k(\boldsymbol{r}+\boldsymbol{c}_k\Delta t,t+\Delta t)=\varOmega _k(\boldsymbol{r},t)+F_k(\boldsymbol{r},t), \end{equation}
$\varOmega _k$
is usually approximated by the Bhatnagar–Gross–Krook (BGK) operator (Bhatnagar, Gross & Krook Reference Bhatnagar, Gross and Krook1954; Qian, D’Humières & Lallemand Reference Qian, D’Humières and Lallemand1992)(2.10)which relaxes distributions
\begin{equation} \varOmega _k = -\frac {\Delta t}{\tau } \big (f_k - f_k^{eq}\big ), \end{equation}
$f_k$
toward equilibrium
$f_k^{eq}$
with relaxation time
$\tau$
, linked to kinematic viscosity through
$\nu =c_s^2(\tau -1/2)\Delta t$
, where
$c_s$
is the speed of sound in lattice units. Density and momentum follow from the distribution moments (
$\rho = \sum _k f_k$
and
$\rho \boldsymbol{u} = \sum _k f_k\boldsymbol{c}_k$
), while buoyancy is introduced via a forcing scheme (Peng, Shu & Chew Reference Peng, Shu and Chew2003).
\begin{equation} f_k(\boldsymbol{r}+\boldsymbol{c}_k\Delta t,t+\Delta t)=\varOmega _k(\boldsymbol{r},t)+F_k(\boldsymbol{r},t), \end{equation}
$\varOmega _k$
is usually approximated by the Bhatnagar–Gross–Krook (BGK) operator (Bhatnagar, Gross & Krook Reference Bhatnagar, Gross and Krook1954; Qian, D’Humières & Lallemand Reference Qian, D’Humières and Lallemand1992)(2.10)which relaxes distributions
\begin{equation} \varOmega _k = -\frac {\Delta t}{\tau } \big (f_k - f_k^{eq}\big ), \end{equation}
$f_k$
toward equilibrium
$f_k^{eq}$
with relaxation time
$\tau$
, linked to kinematic viscosity through
$\nu =c_s^2(\tau -1/2)\Delta t$
, where
$c_s$
is the speed of sound in lattice units. Density and momentum follow from the distribution moments (
$\rho = \sum _k f_k$
and
$\rho \boldsymbol{u} = \sum _k f_k\boldsymbol{c}_k$
), while buoyancy is introduced via a forcing scheme (Peng, Shu & Chew Reference Peng, Shu and Chew2003).
-
(ii) Improved accuracy for pore-scale simulations. Here, accuracy is enhanced by the two-relaxation-time (TRT) operator (Ginzburg, Verhaeghe & d’Humieres Reference Ginzburg, Verhaeghe and d’Humieres2008), which separates symmetric and antisymmetric modes with relaxation times
$\tau _+$
and
$\tau _-$
. This operator allows independent control of kinematic viscosity, while an additional parameter
$\varLambda _{\textit{TRT}}$
is used to improve the accuracy of LBMs in under-resolved conditions (only a few points per pore) and at low Reynolds numbers (Ginzburg Reference Ginzburg2007; Krüger et al. Reference Krüger, Kusumaatmaja, Kuzmin, Shardt, Silva and Viggen2017). It is commonly set to
$3/16$
following Talon et al. (Reference Talon, Bauer, Gland, Youssef, Auradou and Ginzburg2012). -
(iii) Energy and conjugate heat transfer. A second LBM recovers the energy equation using distributions
$g_k$
with BGK collisions (Yue et al. Reference Yue, Chai, Wang and Shi2021). The equilibrium
$g_k^{eq}$
depends on
$\rho c_p T$
, velocity
$\boldsymbol{u}$
and an adjustable parameter
$A$
for stability. Thermal conductivity in each phase (
$f$
:fluid,
$s$
:solid) is related to the relaxation time via(2.11)while the temperature field is obtained from the zeroth moment,
\begin{equation} \kappa _{f,s} = A c_s^2 \!\left (\tau _{f,s}-\frac {1}{2}\right )\!\Delta t, \end{equation}
$\rho c_p T = \sum _k g_k$
. This enables direct treatment of conjugate heat transfer with distinct
$(\rho c_p)$
and
$\kappa$
in the fluid and solid domains.
-
(iv) Boundary and initial conditions. Boundaries are treated with link-wise schemes. No-slip adiabatic walls are imposed with bounce back (Krüger et al. Reference Krüger, Kusumaatmaja, Kuzmin, Shardt, Silva and Viggen2017), while Dirichlet conditions for prescribed temperatures are enforced via an anti-bounce-back scheme (Zhang et al. Reference Zhang, Shi, Guo, Chai and Lu2012). Distribution functions are initialised at equilibrium, which allows one to easily impose any macroscopic field (e.g. velocity, density or temperature) consistently with the physical phenomena of interest.


Before presenting our main results, we benchmark the numerical approach against two canonical problems: the onset of RBC (Shan Reference Shan1997) and conjugate heat transfer in a square cavity with 16 blocks (Merrikh & Lage Reference Merrikh and Lage2005; Raji et al. Reference Raji, Hasnaoui, Naïmi, Slimani and Ouazzani2012; Karani & Huber Reference Karani and Huber2015; Lu, Lei & Dai Reference Lu, Lei and Dai2017; Landl et al. Reference Landl, Prieler, Monaco and Hochenauer2023). These validations set the stage for § 3, where we analyse hydrodynamic flow and steady conduction, establish a baseline for inertial effects and subsequently investigate the transition to oscillatory HRLC.
2.2.2. Model benchmark
Our model is first benchmarked against the onset of pure-fluid RBC, following the procedure of Shan (Reference Shan1997). Convection was observed at a critical Rayleigh number of $\textit {Ra}_{cr} = 1711.2$
with a corresponding critical wavenumber
$\textit {Ra}_{cr} = 1711.2$
with a corresponding critical wavenumber $k_{\mkern -2mu c} = 3.117$
in the
$k_{\mkern -2mu c} = 3.117$
in the $x$
–
$x$
– $y$
plane, determined by measuring the exponential growth rate of the vertical velocity at the onset of convection. These values were obtained for a fluid relaxation time of
$y$
plane, determined by measuring the exponential growth rate of the vertical velocity at the onset of convection. These values were obtained for a fluid relaxation time of $\tau ^+ = 0.6$
on a mesh of
$\tau ^+ = 0.6$
on a mesh of $N_x \times N_z = 202 \times 101$
, using bounce-back boundary conditions at the top and bottom and periodic boundary conditions elsewhere. This result exhibits a 0.2 % relative deviation from the reference value of 1707.8, derived from linear stability analysis and confirmed by experimental observations (Shan Reference Shan1997).
$N_x \times N_z = 202 \times 101$
, using bounce-back boundary conditions at the top and bottom and periodic boundary conditions elsewhere. This result exhibits a 0.2 % relative deviation from the reference value of 1707.8, derived from linear stability analysis and confirmed by experimental observations (Shan Reference Shan1997).
The implemented LBM model is further validated against conjugate heat transfer in porous media, following the benchmark used in previous studies (Merrikh & Lage Reference Merrikh and Lage2005; Raji et al. Reference Raji, Hasnaoui, Naïmi, Slimani and Ouazzani2012; Karani & Huber Reference Karani and Huber2015; Lu et al. Reference Lu, Lei and Dai2017, Reference Lu, Lei and Dai2018; Landl et al. Reference Landl, Prieler, Monaco and Hochenauer2023). The benchmark is conducted in a two-dimensional porous medium of size $H \times H$
consisting of a regular array of 16 square blocks (each 60
$H \times H$
consisting of a regular array of 16 square blocks (each 60 $\times$
60 lattice nodes), which yields a porosity of
$\times$
60 lattice nodes), which yields a porosity of $ \varphi = 64\,\%$
, as shown in figure 1(b). While
$ \varphi = 64\,\%$
, as shown in figure 1(b). While $Ra_{\mkern -2mu f} = 10^5$
and
$Ra_{\mkern -2mu f} = 10^5$
and $k_{\mkern -2mu f}$
is kept constant in the benchmark, the solid-to-fluid thermal conductivity ratio (
$k_{\mkern -2mu f}$
is kept constant in the benchmark, the solid-to-fluid thermal conductivity ratio ( $k_{\mkern -2mu r} = k_{\mkern -2mu s}/k_{\mkern -2mu f}$
) is varied between
$k_{\mkern -2mu r} = k_{\mkern -2mu s}/k_{\mkern -2mu f}$
) is varied between $0.1$
and
$0.1$
and $100$
to analyse its influence on heat transfer. The Nusselt number for the benchmark problem is calculated as described in (Merrikh & Lage Reference Merrikh and Lage2005)
$100$
to analyse its influence on heat transfer. The Nusselt number for the benchmark problem is calculated as described in (Merrikh & Lage Reference Merrikh and Lage2005)
 \begin{equation} \begin{aligned} \textit{Nu} &= \frac {h_{\text{av}} H}{k_{\mkern -2mu f}} = \left ( \frac {H}{T_{\mkern -2mu H} - T_{\mkern -2mu C}} \right ) \left [ \frac {1}{H} \int _{0}^{H}\! \left . - \frac {\partial T}{\partial x} \right |_{x=0} {\rm d}y \right ] \\ &= - \int _{0}^{1}\! \left . \frac {\partial \theta }{\partial \xi } \right |_{\xi =0} {\rm d}\eta , \end{aligned} \end{equation}
where $h_{{av}}$
is the average heat transfer coefficient,
$h_{{av}}$
is the average heat transfer coefficient, $\xi =x/H$
is the dimensionless streamwise coordinate and
$\xi =x/H$
is the dimensionless streamwise coordinate and $\eta =y/H$
is the dimensionless vertical coordinate.
$\eta =y/H$
is the dimensionless vertical coordinate.
Table 1 presents the benchmark results, showing quantitative agreement between our LBM model and previous studies based on either LBM and finite volume (FVM) simulations.
Predictions for $\textit{Nu}$
along the hot wall for various solid-to-fluid thermal conductivity ratios. The top section presents results from previous studies, while the bottom section includes results from the present study, calculated with (2.12) and (2.20). References: [A] Merrikh & Lage (Reference Merrikh and Lage2005), [B] Raji et al. (Reference Raji, Hasnaoui, Naïmi, Slimani and Ouazzani2012), [C] Karani & Huber (Reference Karani and Huber2015), [D] Lu et al. (Reference Lu, Lei and Dai2017), [E] Lu, Lei & Dai (Reference Lu, Lei and Dai2018), [F] Landl et al. (Reference Landl, Prieler, Monaco and Hochenauer2023).
$\textit{Nu}$
along the hot wall for various solid-to-fluid thermal conductivity ratios. The top section presents results from previous studies, while the bottom section includes results from the present study, calculated with (2.12) and (2.20). References: [A] Merrikh & Lage (Reference Merrikh and Lage2005), [B] Raji et al. (Reference Raji, Hasnaoui, Naïmi, Slimani and Ouazzani2012), [C] Karani & Huber (Reference Karani and Huber2015), [D] Lu et al. (Reference Lu, Lei and Dai2017), [E] Lu, Lei & Dai (Reference Lu, Lei and Dai2018), [F] Landl et al. (Reference Landl, Prieler, Monaco and Hochenauer2023).

However, we argue that this calculation (using (2.12)) of the Nusselt number is not adequate. This method neglects heterogeneity in steady-state heat conduction and produces unphysical values below unity (noting that $ \textit{Nu} \geqslant 1$
by definition), along with an inverted trend in Nusselt number versus
$ \textit{Nu} \geqslant 1$
by definition), along with an inverted trend in Nusselt number versus $ k_r$
. For the interested reader, we share further discussion and illustrative benchmarks on this issue in the supplementary material, § 8.
$ k_r$
. For the interested reader, we share further discussion and illustrative benchmarks on this issue in the supplementary material, § 8.
2.3. Porous model, numerical diagnosis and dynamical regime
The porous model used in this study is at the transition between pore scale and continuum scale (Appendix C4). In this study, the domain-to-pore unit ratio is fixed at $ H/h = 9$
, while the cylinder spacing
$ H/h = 9$
, while the cylinder spacing $ L$
is varied to control the porosity, which ranges from 32.55 % to 43.44 % (figure 1
a). In order to ensure that the resulting scaling laws are not affected by grid resolution, we conducted additional simulations at twice the standard resolution for the lowest-porosity case in the inertial regime (figures 6 and 15). The baseline resolution corresponds to 30 lattice nodes per cylinder radius.
$ L$
is varied to control the porosity, which ranges from 32.55 % to 43.44 % (figure 1
a). In order to ensure that the resulting scaling laws are not affected by grid resolution, we conducted additional simulations at twice the standard resolution for the lowest-porosity case in the inertial regime (figures 6 and 15). The baseline resolution corresponds to 30 lattice nodes per cylinder radius.
Tabulated values for the simulation domains used (see figure 1
a). Here, L.U. stands for lattice units (metre equivalent). The table presents porosity ( $\varphi$
), unit pore scale (
$\varphi$
), unit pore scale ( $h$
), cylinder radius (
$h$
), cylinder radius ( $r = D/2$
), domain height/width (
$r = D/2$
), domain height/width ( $H$
), Darcy number (
$H$
), Darcy number ( $Da$
) and tortuosity (
$Da$
) and tortuosity ( $\tau$
).
$\tau$
).

To isolate the role of inertia, we first perform purely hydrodynamic simulations by imposing a pressure gradient, $\boldsymbol{\nabla \!}P$
, across the system volume,
$\boldsymbol{\nabla \!}P$
, across the system volume, $V$
, and measure the resulting effective discharge velocity in the forcing direction,
$V$
, and measure the resulting effective discharge velocity in the forcing direction, $U_{\mkern -2mu i}$
, using the Dupuit–Forchheimer relationship (Nield & Bejan Reference Nield and Bejan2017)
$U_{\mkern -2mu i}$
, using the Dupuit–Forchheimer relationship (Nield & Bejan Reference Nield and Bejan2017)
 \begin{equation} U_{\mkern -2mu i} = \frac {\varphi }{V} \int _{\mkern -2mu V} u_{\mkern -2mu i} \, {\rm d}V. \end{equation}
For simplicity, we omit the subscript and denote $U_{\mkern -2mu i}$
simply as
$U_{\mkern -2mu i}$
simply as $U$
. These measurements are performed using the hydrodynamic LBM model described in § 2.2 with
$U$
. These measurements are performed using the hydrodynamic LBM model described in § 2.2 with $\tau ^+ = 0.505$
and periodic boundary conditions in all directions of the porous models depicted in figure 1(a).
$\tau ^+ = 0.505$
and periodic boundary conditions in all directions of the porous models depicted in figure 1(a).
In the Darcy regime, the discharge velocity is linearly proportional to the pressure gradient
 \begin{align} U = - \frac {K}{\mu } \boldsymbol{\nabla \!}P, \end{align}
where $ \mu$
(ML
$ \mu$
(ML $^{-1}$
T
$^{-1}$
T $^{-1}$
) denotes the fluid dynamic viscosity.
$^{-1}$
) denotes the fluid dynamic viscosity.
As the flow rate increases, the relationship between effective discharge and pressure gradient becomes progressively nonlinear while still steady, and eventually transitions to an unsteady regime characterised by vortex shedding within the porous matrix (Khalifa et al. Reference Khalifa, Pocher and Tilton2020), referred to as the Hopf bifurcation (Agnaou, Lasseux & Ahmadi Reference Agnaou, Lasseux and Ahmadi2016).
The Forchheimer regime emerges as inertial effects become significant, introducing nonlinear pressure–velocity scaling. These deviations are captured by extending Darcy’s law with a quadratic correction term
 \begin{equation} -\boldsymbol{\nabla \!}P = \frac {\mu }{K_{\mkern -2mu F}} U + \frac {\rho c_{\mkern -2mu F}}{\sqrt {K_{\mkern -2mu F}}} U^2, \end{equation}
where $ K_{\mkern -2mu F}$
(L
$ K_{\mkern -2mu F}$
(L $^2$
) denotes the effective Forchheimer permeability. Experimental results by Dukhan, Bağcı & Özdemir (Reference Dukhan, Bağcı and Özdemir2014) suggest that
$^2$
) denotes the effective Forchheimer permeability. Experimental results by Dukhan, Bağcı & Özdemir (Reference Dukhan, Bağcı and Özdemir2014) suggest that $ K_{\mkern -2mu F}$
differs from the intrinsic permeability
$ K_{\mkern -2mu F}$
differs from the intrinsic permeability $K$
, with a deviation quantified by the permeability ratio
$K$
, with a deviation quantified by the permeability ratio $ \sigma _{\mkern -2mu F} = K_{\mkern -2mu F} / K$
.
$ \sigma _{\mkern -2mu F} = K_{\mkern -2mu F} / K$
.
To facilitate comparison across porous configurations and flow intensities, the pressure–velocity relationships are recast in dimensionless form using the normalised pressure gradient (Fand et al. Reference Fand, Kim, Lam and Phan1987; Khalifa et al. Reference Khalifa, Pocher and Tilton2020)
 \begin{equation} G = \frac {-\boldsymbol{\nabla \!}P}{\frac {\mu U }{K}}, \end{equation}
which expresses the actual pressure gradient relative to the Darcy prediction. The corresponding scaling laws for the different flow regimes are
 \begin{equation} \left \{ \begin{array}{lll} G = 1 & \quad \text{(Darcy regime),} \\[6pt] G = \frac {1}{\sigma _{\mkern -2mu F}} + \frac {c_{\mkern -2mu F}}{\sqrt {\sigma _{\mkern -2mu F}}} \textit{Re} & \quad \text{(Forchheimer regime),} \\[6pt] G = q + r \textit{Re} & \quad \text{(Vortex-shedding regime).} \end{array} \right . \end{equation}
In these expressions, $ \sigma _{\mkern -2mu F}$
and
$ \sigma _{\mkern -2mu F}$
and $ c_{\mkern -2mu F}$
represent the linear and quadratic resistance contributions in the Forchheimer regime, while
$ c_{\mkern -2mu F}$
represent the linear and quadratic resistance contributions in the Forchheimer regime, while $ q$
and
$ q$
and $ r$
serve as analogous coefficients in the vortex-shedding regime. The Reynolds number is defined as
$ r$
serve as analogous coefficients in the vortex-shedding regime. The Reynolds number is defined as $ \textit{Re} = U \sqrt {K} / \nu$
, where
$ \textit{Re} = U \sqrt {K} / \nu$
, where $ \sqrt {K}$
acts as a characteristic length scale (Nield & Bejan Reference Nield and Bejan2017).
$ \sqrt {K}$
acts as a characteristic length scale (Nield & Bejan Reference Nield and Bejan2017).
To quantify the transition to non-Darcy behaviour, we define the non-Darcy Reynolds number, $ \textit{Re}_{\mkern -2mu nD}$
, as the point where the pressure gradient exceeds the Darcy prediction by 1 %. Although this criterion may appear arbitrary, intersecting fitted Darcy, transitional and Forchheimer regimes also requires selection of a cutoff for the included data points, which is equally subjective. Nevertheless, this criterion yields results consistent with those obtained by such intersection methods, as shown by Khalifa et al. (Reference Khalifa, Pocher and Tilton2020). The associated uncertainty,
$ \textit{Re}_{\mkern -2mu nD}$
, as the point where the pressure gradient exceeds the Darcy prediction by 1 %. Although this criterion may appear arbitrary, intersecting fitted Darcy, transitional and Forchheimer regimes also requires selection of a cutoff for the included data points, which is equally subjective. Nevertheless, this criterion yields results consistent with those obtained by such intersection methods, as shown by Khalifa et al. (Reference Khalifa, Pocher and Tilton2020). The associated uncertainty, $ \Delta \textit{Re}_{\mkern -2mu nD}$
, is defined by the spacing to the next lower Reynolds number in the dataset.
$ \Delta \textit{Re}_{\mkern -2mu nD}$
, is defined by the spacing to the next lower Reynolds number in the dataset.
The onset of the vortex-shedding regime is identified as the first occurrence of unsteady flow, defining the critical Reynolds number $ \textit{Re}_{\mkern -2mu c}$
. Its uncertainty,
$ \textit{Re}_{\mkern -2mu c}$
. Its uncertainty, $ \Delta \textit{Re}_{\mkern -2mu c}$
, corresponds to the interval between the last steady and the first unsteady data point.
$ \Delta \textit{Re}_{\mkern -2mu c}$
, corresponds to the interval between the last steady and the first unsteady data point.
The Forchheimer regime is characterised by fitting the normalised pressure gradient $ G$
over the steady-state interval
$ G$
over the steady-state interval $ \textit{Re}_{\mkern -2mu nD} \leqslant \textit{Re} \leqslant \textit{Re}_{\mkern -2mu c}$
, where the parameters
$ \textit{Re}_{\mkern -2mu nD} \leqslant \textit{Re} \leqslant \textit{Re}_{\mkern -2mu c}$
, where the parameters $ \sigma _{\mkern -2mu F}$
and
$ \sigma _{\mkern -2mu F}$
and $ c_{\mkern -2mu F}$
are obtained with a regression confidence of
$ c_{\mkern -2mu F}$
are obtained with a regression confidence of $ R^2 \gt 0.99$
.
$ R^2 \gt 0.99$
.
Having established the hydrodynamic behaviour, we now turn to heat transfer in HRLC. As shown in § 2.2.2, the accurate evaluation of $ \textit{Nu}$
relies on the proper determination of the effective thermal conductivity of the porous medium. The effective thermal conductivity
$ \textit{Nu}$
relies on the proper determination of the effective thermal conductivity of the porous medium. The effective thermal conductivity $ k_{\mkern -2mu m}$
is determined prior to each HRLC simulation by running a conduction-only case below the onset of convection (
$ k_{\mkern -2mu m}$
is determined prior to each HRLC simulation by running a conduction-only case below the onset of convection ( $ Ra_{\mkern -2mu f} = 1$
), using the same parameters as in the main simulation (see table 5 in Appendix A for the comprehensive list of symbols used throughout this study).
$ Ra_{\mkern -2mu f} = 1$
), using the same parameters as in the main simulation (see table 5 in Appendix A for the comprehensive list of symbols used throughout this study).
We start the simulations with a linear temperature profile along the gravitational direction and wait until the vertical heat flux remains constant within $10^{-7}$
over a time window of
$10^{-7}$
over a time window of $ t = 0.01\, H^2 / \alpha _{\mkern -2mu f}$
. The conductive heat flux
$ t = 0.01\, H^2 / \alpha _{\mkern -2mu f}$
. The conductive heat flux $ q_{\textit{cond}}$
is computed as
$ q_{\textit{cond}}$
is computed as
 \begin{equation} q_{\textit{cond}} = -\frac {1}{H} \int _H k(x) \frac {{\rm d}T}{{\rm d}z} \Big |_{\mkern -2mu z=0} {\rm d}x, \end{equation}
where $ k(x)$
is the local thermal conductivity, either of the fluid or of the solid, and
$ k(x)$
is the local thermal conductivity, either of the fluid or of the solid, and $ {{\rm d}T}/{{\rm d}z}\big |_{\mkern -2mu z=0}$
denotes the temperature gradient at the bottom wall. The effective medium thermal conductivity is obtained using Fourier’s law as
$ {{\rm d}T}/{{\rm d}z}\big |_{\mkern -2mu z=0}$
denotes the temperature gradient at the bottom wall. The effective medium thermal conductivity is obtained using Fourier’s law as
 \begin{equation} k_{\mkern -2mu m} = \frac {q_{\textit{cond}}}{\Delta T / H}. \end{equation}
As mentioned in the previous section, the definition of the Nusselt number proposed in previous publication may take non-physical values less than unity. Throughout the rest of this study, we adopt a definition similar to Karani & Huber (Reference Karani and Huber2017)
 \begin{equation} \textit{Nu} = 1 + \frac {\frac {1}{V} \int _V u_{\mkern -2mu i} \ T \, {\rm d}V }{\alpha _{\mkern -2mu m} \, \frac {\Delta T}{H}}, \end{equation}
where $ u_{\mkern -2mu i}$
denotes the local fluid velocity component aligned with the macroscopic temperature gradient.
$ u_{\mkern -2mu i}$
denotes the local fluid velocity component aligned with the macroscopic temperature gradient.
Following Nield & Bejan (Reference Nield and Bejan2017), we define the Reynolds number in the context of convection as
 \begin{equation} \textit{Re} = \frac {|U| \sqrt {K}}{\nu }, \end{equation}
where $ U$
is the discharge velocity in the direction of the macroscopic temperature gradient, as introduced earlier. The absolute value reflects that inertial effects depend on the magnitude of the flow, regardless of its direction, while
$ U$
is the discharge velocity in the direction of the macroscopic temperature gradient, as introduced earlier. The absolute value reflects that inertial effects depend on the magnitude of the flow, regardless of its direction, while $ \sqrt {K}$
serves as the characteristic pore-scale length.
$ \sqrt {K}$
serves as the characteristic pore-scale length.
3. Inertial effects in HRLC at fixed porosity and conductivity ratio
3.1. Transition from Darcy to non-Darcy flow in hydrodynamics
Before analysing the role of inertia in HRLC, we first examine isothermal hydrodynamic flow driven by a pressure gradient at a fixed porosity of $ \varphi = 43\,\%$
. To characterise the distinct flow regimes, we evaluate the relationship between the normalised pressure gradient
$ \varphi = 43\,\%$
. To characterise the distinct flow regimes, we evaluate the relationship between the normalised pressure gradient $ G$
(2.16) and the permeability-based Reynolds number, spatially averaged over the fluid domain,
$ G$
(2.16) and the permeability-based Reynolds number, spatially averaged over the fluid domain, $ \langle \textit{Re} \rangle _H$
.
$ \langle \textit{Re} \rangle _H$
.
(a) Pore-scale streamlines illustrating: (i) laminar (Darcy) flow; (ii) steady inertia-dominated flow (Forchheimer regime); and (iii) unsteady flow with vortex shedding (snapshot in time). (b) Log–log plot of the normalised pressure gradient $ G$
versus the domain-averaged permeability-based Reynolds number
$ G$
versus the domain-averaged permeability-based Reynolds number $ \langle \textit{Re} \rangle _H$
. Transitions between regimes are indicated by vertical dashed lines, denoting the onset of non-Darcy flow (
$ \langle \textit{Re} \rangle _H$
. Transitions between regimes are indicated by vertical dashed lines, denoting the onset of non-Darcy flow ( $ \textit{Re}_{\mkern -2mu nD}$
) and the onset of vortex shedding (
$ \textit{Re}_{\mkern -2mu nD}$
) and the onset of vortex shedding ( $ \textit{Re}_{\mkern -2mu c}$
).
$ \textit{Re}_{\mkern -2mu c}$
).

Figure 2(b) compares the simulation results (square symbols) with the regime-specific scaling laws (solid lines) introduced in (2.17).
Following the procedure outlined in § 2.3, we identify the regime transitions for $ \varphi = 43\,\%$
at
$ \varphi = 43\,\%$
at $ \textit{Re}_{\mkern -2mu nD} \approx 0.3$
and
$ \textit{Re}_{\mkern -2mu nD} \approx 0.3$
and $ \textit{Re}_{\mkern -2mu c} \approx 2.6$
. The fitted parameters are
$ \textit{Re}_{\mkern -2mu c} \approx 2.6$
. The fitted parameters are
 \begin{align} r = 0.232 \pm 0.003, \quad q = 0.754 \pm 0.012, \quad c_{\mkern -2mu F} = 0.152 \pm 0.003, \quad \sigma _{\mkern -2mu F} = 1.052 \pm 0.005. \end{align}
The Darcy regime corresponds to the inertialess limit, while the Forchheimer regime reflects a finite-Reynolds-number correction to Darcy’s law. As proposed by Khalifa et al. (Reference Khalifa, Pocher and Tilton2020), the initial inertial deviations from the laminar regime may follow the quadratic scaling $ G = \sigma ^{-1} + \gamma \textit{Re}^2$
, which they designate as the transitional regime. Given the limited validity of this scaling, we interpret the interval
$ G = \sigma ^{-1} + \gamma \textit{Re}^2$
, which they designate as the transitional regime. Given the limited validity of this scaling, we interpret the interval $ [\textit{Re}_{\mkern -2mu nD}, \textit{Re}_{\mkern -2mu c}]$
as a transitional range between Darcy and vortex-shedding flow, and refer to the steady inertial dynamics in this range as Forchheimer-type behaviour.
$ [\textit{Re}_{\mkern -2mu nD}, \textit{Re}_{\mkern -2mu c}]$
as a transitional range between Darcy and vortex-shedding flow, and refer to the steady inertial dynamics in this range as Forchheimer-type behaviour.
3.2.
Thermal convection in a homogeneous porous medium (
$k_{\mkern -2mu s}=k_{\mkern -2mu f}$
)

This section presents the HRLC results for a porous medium of a moderate porosity $ \varphi = 43\,\%$
(
$ \varphi = 43\,\%$
( $ Da = 5.25 \times 10^{-6}$
), saturated with a fluid with a thermal conductivity of
$ Da = 5.25 \times 10^{-6}$
), saturated with a fluid with a thermal conductivity of $k_{\mkern -2mu f}=k_{\mkern -2mu s}$
and
$k_{\mkern -2mu f}=k_{\mkern -2mu s}$
and $\textit{Pr}_{\mkern -2mu f}=1$
, representing the base case of uniform thermal conductivity (i.e.
$\textit{Pr}_{\mkern -2mu f}=1$
, representing the base case of uniform thermal conductivity (i.e. $\lambda =1$
).
$\lambda =1$
).
3.2.1. From steady to oscillatory convection
Snapshots of the normalised temperature field $\theta$
(top), and time-averaged Nusselt number versus Rayleigh-fluid number (bottom), across different flow regimes but for fixed porosity
$\theta$
(top), and time-averaged Nusselt number versus Rayleigh-fluid number (bottom), across different flow regimes but for fixed porosity $\varphi = 43\,\%$
and Darcy number (
$\varphi = 43\,\%$
and Darcy number ( $Da = 5.25 \times 10^{-6}$
). The horizontal colour map encodes the degree of temporal variability in the heat transport (i.e.
$Da = 5.25 \times 10^{-6}$
). The horizontal colour map encodes the degree of temporal variability in the heat transport (i.e. $\textit{Nu}(t)$
). Blue regions indicate steady-state convection, while shaded regions represent the uncertainty in the onset of harmonic oscillations. As
$\textit{Nu}(t)$
). Blue regions indicate steady-state convection, while shaded regions represent the uncertainty in the onset of harmonic oscillations. As $Ra_{\mkern -2mu f}$
increases, multi-frequency oscillatory convection emerges, denoted as vigorous oscillatory convection.
$Ra_{\mkern -2mu f}$
increases, multi-frequency oscillatory convection emerges, denoted as vigorous oscillatory convection.

Figure 3 presents instantaneous thermal fields, shown as non-dimensional temperature $ \theta =(T-T_{\mkern -2mu C})/(T_{\mkern -2mu H}-T_{\mkern -2mu C})$
, illustrating the transition from steady to quasi-steady states across a range of fluid Rayleigh numbers
$ \theta =(T-T_{\mkern -2mu C})/(T_{\mkern -2mu H}-T_{\mkern -2mu C})$
, illustrating the transition from steady to quasi-steady states across a range of fluid Rayleigh numbers $ Ra_{\mkern -2mu f}$
, along with the corresponding Nusselt–Rayleigh relationship. The colour coding (steady state, harmonic oscillatory and vigorous oscillatory) qualitatively represents the temporal behaviour of the vertical heat flux (
$ Ra_{\mkern -2mu f}$
, along with the corresponding Nusselt–Rayleigh relationship. The colour coding (steady state, harmonic oscillatory and vigorous oscillatory) qualitatively represents the temporal behaviour of the vertical heat flux ( $ \textit{Nu}$
), while the shaded region illustrates the uncertainty associated with the transition to oscillatory behaviour. At sufficiently low
$ \textit{Nu}$
), while the shaded region illustrates the uncertainty associated with the transition to oscillatory behaviour. At sufficiently low $ Ra_{\mkern -2mu f}$
, just above the onset of convection, the system exhibits a steady central upwelling flanked by two lateral downwellings, characteristic of a mode-2 convection pattern. The Nusselt number initially follows an approximately linear scaling,
$ Ra_{\mkern -2mu f}$
, just above the onset of convection, the system exhibits a steady central upwelling flanked by two lateral downwellings, characteristic of a mode-2 convection pattern. The Nusselt number initially follows an approximately linear scaling, $ \textit{Nu} \propto Ra_{\mkern -2mu f}$
, consistent with the approximation
$ \textit{Nu} \propto Ra_{\mkern -2mu f}$
, consistent with the approximation $ \textit{Nu} - 1 \sim \langle U_z T' \rangle / Q_{\mkern -2mu {cond}}$
, where
$ \textit{Nu} - 1 \sim \langle U_z T' \rangle / Q_{\mkern -2mu {cond}}$
, where $ \langle U_z T' \rangle$
represents the characteristic enthalpy flux. Near the onset of convection, the characteristic velocity scales with
$ \langle U_z T' \rangle$
represents the characteristic enthalpy flux. Near the onset of convection, the characteristic velocity scales with $ U \propto Ra_{\!f} - Ra_{c}$
, where
$ U \propto Ra_{\!f} - Ra_{c}$
, where $ Ra_{c}$
is the critical Rayleigh number for the onset of convection. As
$ Ra_{c}$
is the critical Rayleigh number for the onset of convection. As $ Ra_{\mkern -2mu f}$
increases further within the steady regime, the heat transport departs from the linear trend and follows a shallower scaling. With increasing
$ Ra_{\mkern -2mu f}$
increases further within the steady regime, the heat transport departs from the linear trend and follows a shallower scaling. With increasing $ Ra_{\mkern -2mu f}$
, the flow transitions into a mode-4 convection pattern with double upwellings, which persists into the unsteady regime. Oscillations first emerge at the plume necks, altering the thermal structure and reducing heat transport efficiency. As these oscillations intensify, the domain becomes well mixed, and the Nusselt number scaling flattens toward
$ Ra_{\mkern -2mu f}$
, the flow transitions into a mode-4 convection pattern with double upwellings, which persists into the unsteady regime. Oscillations first emerge at the plume necks, altering the thermal structure and reducing heat transport efficiency. As these oscillations intensify, the domain becomes well mixed, and the Nusselt number scaling flattens toward $ \textit{Nu} \sim Ra_{\mkern -2mu f}^{1/3}$
, consistent with classical inertial RBC.
$ \textit{Nu} \sim Ra_{\mkern -2mu f}^{1/3}$
, consistent with classical inertial RBC.
To delineate the observed unsteady dynamics in $\textit{Nu}$
, we performed a Fourier analysis of its fluctuating component, defined as
$\textit{Nu}$
, we performed a Fourier analysis of its fluctuating component, defined as
 \begin{align} \Delta {\textit{Nu}}(t^*) = {\textit{Nu}}(t^*) - \overline {\textit{Nu}}, \end{align}
with $\overline {\textit{Nu}}$
and
$\overline {\textit{Nu}}$
and $\textit{Nu}(t^*)$
being the time-averaged and fluctuating components of the Nusselt number, respectively, and
$\textit{Nu}(t^*)$
being the time-averaged and fluctuating components of the Nusselt number, respectively, and $t^* = t \ \alpha _{\mkern -2mu f} / H^2$
the time normalised by thermal diffusion time scale.
$t^* = t \ \alpha _{\mkern -2mu f} / H^2$
the time normalised by thermal diffusion time scale.
To ensure statistical stationarity, we monitor the mean Nusselt number over a moving window of $1/100$
of the diffusion time. Once convergence is observed, the simulation is restarted from that point with finer temporal resolution (
$1/100$
of the diffusion time. Once convergence is observed, the simulation is restarted from that point with finer temporal resolution ( $\Delta t^* = 10^{-6}$
) for time-averaged and spectral analysis. As shown in figure 4(b), this window captures the full dynamics across all tested cases.
$\Delta t^* = 10^{-6}$
) for time-averaged and spectral analysis. As shown in figure 4(b), this window captures the full dynamics across all tested cases.
We compute the fast Fourier transform (FFT), and the power spectral density (PSD) is obtained as
 \begin{equation} \mathrm{PSD}(f^*) = \frac {\left |\text{FFT}(\Delta \textit{Nu})\right |^2}{\Delta f^*}. \end{equation}
Figure 4 presents time series and corresponding power spectral densities across increasing $ Ra_{\mkern -2mu f}$
, illustrating the transition from harmonic to modulated, aperiodic and chaotic dynamics. At the onset of unsteadiness, a dominant frequency
$ Ra_{\mkern -2mu f}$
, illustrating the transition from harmonic to modulated, aperiodic and chaotic dynamics. At the onset of unsteadiness, a dominant frequency $ f^* \sim 10^4$
emerges, corresponding to coherent plume oscillations. Near the
$ f^* \sim 10^4$
emerges, corresponding to coherent plume oscillations. Near the $ Ra_{\mkern -2mu f}$
value at which the Nusselt number exhibits non-monotonic behaviour, the primary signal becomes modulated by a slower component at
$ Ra_{\mkern -2mu f}$
value at which the Nusselt number exhibits non-monotonic behaviour, the primary signal becomes modulated by a slower component at $ f^* \sim 600$
, likely indicating periodic disruption of the plume dynamics. Similar loss of coherence was reported by Liu et al. (Reference Liu, Jiang, Chong, Zhu, Wan, Verzicco, Stevens, Lohse and Sun2020) in porous RBC. At higher
$ f^* \sim 600$
, likely indicating periodic disruption of the plume dynamics. Similar loss of coherence was reported by Liu et al. (Reference Liu, Jiang, Chong, Zhu, Wan, Verzicco, Stevens, Lohse and Sun2020) in porous RBC. At higher $ Ra_{\mkern -2mu f}$
, a clear time scale separation develops: fast fluctuations (
$ Ra_{\mkern -2mu f}$
, a clear time scale separation develops: fast fluctuations ( $ 2\times 10^4 \lt f^* \lt 3\times 10^4$
) coexist with a slower dynamics around
$ 2\times 10^4 \lt f^* \lt 3\times 10^4$
) coexist with a slower dynamics around $ f^* \sim 400$
, analogous to large-scale overturning and small-scale inertia in classical Rayleigh–Bénard systems (Pandey, Scheel & Schumacher Reference Pandey, Scheel and Schumacher2018).
$ f^* \sim 400$
, analogous to large-scale overturning and small-scale inertia in classical Rayleigh–Bénard systems (Pandey, Scheel & Schumacher Reference Pandey, Scheel and Schumacher2018).
Time evolution and spectral analysis of the Nusselt number for $\varphi = 43\,\%$
,
$\varphi = 43\,\%$
, $k_{\mkern -2mu r} = 1.0$
,
$k_{\mkern -2mu r} = 1.0$
, $Da = 5.25 \times 10^{-6}$
and
$Da = 5.25 \times 10^{-6}$
and $\textit{Pr}_{\mkern -2mu f} = 1$
, using the same colour scheme as in figure 3. (a) Log-scale
$\textit{Pr}_{\mkern -2mu f} = 1$
, using the same colour scheme as in figure 3. (a) Log-scale $\textit{Nu}$
over dimensionless time
$\textit{Nu}$
over dimensionless time $t^* = t / t_{\mkern -2mu {diff}}$
. The first 10 % with respect to the diffusion time scale is shown. (b) Oscillatory component
$t^* = t / t_{\mkern -2mu {diff}}$
. The first 10 % with respect to the diffusion time scale is shown. (b) Oscillatory component $\Delta \textit{Nu}$
at quasi-steady state, plotted over
$\Delta \textit{Nu}$
at quasi-steady state, plotted over $t^*$
. (c) Power spectral density of
$t^*$
. (c) Power spectral density of $\Delta \textit{Nu}$
, with dominant frequencies annotated. Frequency is dimensionless and expressed in
$\Delta \textit{Nu}$
, with dominant frequencies annotated. Frequency is dimensionless and expressed in $1 / t^*$
.
$1 / t^*$
.

(a) Domain-averaged permeability-based Reynolds number $ \langle \textit{Re} \rangle _H$
as a function of the fluid Rayleigh number
$ \langle \textit{Re} \rangle _H$
as a function of the fluid Rayleigh number $ Ra_{\mkern -2mu f}$
, colour coded by temporal regime: steady (blue), harmonic to vigorous oscillatory (purple-yellow). Dashed and dash-dotted lines indicate critical values from the hydrodynamic reference:
$ Ra_{\mkern -2mu f}$
, colour coded by temporal regime: steady (blue), harmonic to vigorous oscillatory (purple-yellow). Dashed and dash-dotted lines indicate critical values from the hydrodynamic reference: $ \textit{Re}_{\mkern -2mu nD} = 0.30$
(non-Darcy flow) and
$ \textit{Re}_{\mkern -2mu nD} = 0.30$
(non-Darcy flow) and $ \textit{Re}_c = 2.58$
(onset of vortex shedding). Reference scalings for Darcy (
$ \textit{Re}_c = 2.58$
(onset of vortex shedding). Reference scalings for Darcy ( $ \textit{Re} \propto Ra_{\mkern -2mu f}$
) and Forchheimer (
$ \textit{Re} \propto Ra_{\mkern -2mu f}$
) and Forchheimer ( $ \textit{Re} \propto Ra_{\mkern -2mu f}^{1/2}$
) flows are shown for comparison. (b) Cumulative distribution functions of the unit-pore-scale Reynolds number
$ \textit{Re} \propto Ra_{\mkern -2mu f}^{1/2}$
) flows are shown for comparison. (b) Cumulative distribution functions of the unit-pore-scale Reynolds number $ \langle \textit{Re} \rangle _h$
for various
$ \langle \textit{Re} \rangle _h$
for various $ Ra_{\mkern -2mu f}$
, using the same regime classification. Light-blue and light-green shaded areas denote ranges associated with a Darcy-like and a Forchheimer-like dynamics, respectively. Broader distributions emerge following thermal reorganisation, coinciding with stagnation in Nusselt number growth. (c) Normalised vertical velocity fields
$ Ra_{\mkern -2mu f}$
, using the same regime classification. Light-blue and light-green shaded areas denote ranges associated with a Darcy-like and a Forchheimer-like dynamics, respectively. Broader distributions emerge following thermal reorganisation, coinciding with stagnation in Nusselt number growth. (c) Normalised vertical velocity fields $u_z/u_{max }$
for increasing
$u_z/u_{max }$
for increasing $Ra_f$
, illustrating the transition from organised conveyor-belt convection to irregular flow patterns and ultimately to well-mixed Rayleigh–Bénard-like convection.
$Ra_f$
, illustrating the transition from organised conveyor-belt convection to irregular flow patterns and ultimately to well-mixed Rayleigh–Bénard-like convection.

3.2.2. The role of inertia in HRLC
To assess the role of inertia in HRLC, we examine the evolution of the Reynolds number with increasing $ Ra_{\mkern -2mu f}$
. In figure 5(a), we present the computed Reynolds number
$ Ra_{\mkern -2mu f}$
. In figure 5(a), we present the computed Reynolds number $\langle \textit{Re} \rangle _H$
as a function of
$\langle \textit{Re} \rangle _H$
as a function of $Ra_{\mkern -2mu f}$
for a porosity of
$Ra_{\mkern -2mu f}$
for a porosity of $\phi =43\,\%$
at
$\phi =43\,\%$
at $\textit{Pr}_{\mkern -2mu f}=1$
and
$\textit{Pr}_{\mkern -2mu f}=1$
and $\lambda =1$
. We observed two distinct scalings at low and high
$\lambda =1$
. We observed two distinct scalings at low and high $Ra_{\mkern -2mu f}$
. For
$Ra_{\mkern -2mu f}$
. For $Ra_{\mkern -2mu f}\lesssim 2\times 10^8$
, the flow is steady and the Reynolds number falls into the range associated with the Darcy regime in our purely hydrodynamic simulation with a scaling
$Ra_{\mkern -2mu f}\lesssim 2\times 10^8$
, the flow is steady and the Reynolds number falls into the range associated with the Darcy regime in our purely hydrodynamic simulation with a scaling $\langle \textit{Re} \rangle _H \propto Ra_{\mkern -2mu f}$
. For
$\langle \textit{Re} \rangle _H \propto Ra_{\mkern -2mu f}$
. For $Ra_{\mkern -2mu f}\gtrsim 2\times 10^9$
, the flow is unsteady and
$Ra_{\mkern -2mu f}\gtrsim 2\times 10^9$
, the flow is unsteady and $\langle \textit{Re} \rangle _{\mkern -2mu H}$
is in the range of the so-called Forchheimer regime and scales as
$\langle \textit{Re} \rangle _{\mkern -2mu H}$
is in the range of the so-called Forchheimer regime and scales as $\langle \textit{Re} \rangle _H \propto Ra_{\mkern -2mu f}^{1/2}$
. Those scalings can be derived from a force balance argument as follow.
$\langle \textit{Re} \rangle _H \propto Ra_{\mkern -2mu f}^{1/2}$
. Those scalings can be derived from a force balance argument as follow.
The dynamics in the steady Darcy regime is governed by a balance between buoyancy and viscous forces, represented as Darcy drag (Nield & Bejan Reference Nield and Bejan2017)
 \begin{equation} \left | \frac {\nu U}{K} \right |\sim | g \beta _{\mkern -2mu f} \Delta T |. \end{equation}
Recasting this force balance in terms of $ Ra_{\mkern -2mu f}$
using (1.1), we obtain the characteristic velocity
$ Ra_{\mkern -2mu f}$
using (1.1), we obtain the characteristic velocity
 \begin{equation} U \sim Ra_{\mkern -2mu f} Da \, \frac {\alpha _{\mkern -2mu f}}{H}. \end{equation}
Introducing this characteristic velocity into the permeability-based Reynolds number (2.21), we obtain
 \begin{equation} \textit{Re} \sim \left (\frac {Da^{3/2}}{\textit{Pr}_{\mkern -2mu f}}\right ) Ra_{\mkern -2mu f} , \end{equation}
resulting in the linear Reynolds–Rayleigh scaling observed in our results (figure 5 a).
Increasing $Ra_{\mkern -2mu f}$
, the mean Reynolds number falls in the range of the Forchheimer regime defined in our purely hydrodynamic simulations, where the drag is modified by inertia resulting in the nonlinear correction introduced in (2.15). Assuming the mean velocity to be large enough, the pressure gradient will be dominated by the nonlinear component in balance with the buoyancy (1.4). We assume that the difference between
$Ra_{\mkern -2mu f}$
, the mean Reynolds number falls in the range of the Forchheimer regime defined in our purely hydrodynamic simulations, where the drag is modified by inertia resulting in the nonlinear correction introduced in (2.15). Assuming the mean velocity to be large enough, the pressure gradient will be dominated by the nonlinear component in balance with the buoyancy (1.4). We assume that the difference between $K_{\mkern -2mu F}$
and
$K_{\mkern -2mu F}$
and $K$
is sufficiently small to have a negligible impact on the scaling behaviour in HRLC, and can therefore be disregarded.
$K$
is sufficiently small to have a negligible impact on the scaling behaviour in HRLC, and can therefore be disregarded.
Reformulating (1.4) in terms of $ Ra_{\mkern -2mu f}$
, we obtain the following expression for the characteristic velocity
$ Ra_{\mkern -2mu f}$
, we obtain the following expression for the characteristic velocity
 \begin{equation} U \sim \left ( Ra_{\mkern -2mu f} \, Da^{1/2} \, \frac { \alpha _{\mkern -2mu f} \nu }{c_{\mkern -2mu F} H^2} \right )^{1/2}\!. \end{equation}
Substituting this characteristic velocity into the permeability-based Reynolds number (2.21) yields
 \begin{equation} \textit{Re} = Ra_{\mkern -2mu f}^{1/2}\! \left ( \frac {\textit{Pr}_{\mkern -2mu f} Da^{3/2}}{c_{\mkern -2mu F}} \right )^{1/2}\!, \end{equation}
resulting in a one-half-power-law relationship between Reynolds and Rayleigh number, which is approached in our results for $ Ra_{\mkern -2mu f} \gt 10^9$
. However, numerical constraints related to stability, resolution and computational cost limit the accessible
$ Ra_{\mkern -2mu f} \gt 10^9$
. However, numerical constraints related to stability, resolution and computational cost limit the accessible $ Ra_{\mkern -2mu f}$
, keeping viscous effects non-negligible and resulting in a slightly steeper slope. As
$ Ra_{\mkern -2mu f}$
, keeping viscous effects non-negligible and resulting in a slightly steeper slope. As $ Ra_{\mkern -2mu f}$
and
$ Ra_{\mkern -2mu f}$
and $ \textit{Re}$
increase, the flow transitions before reaching a fully developed asymptotic regime.
$ \textit{Re}$
increase, the flow transitions before reaching a fully developed asymptotic regime.
The different regimes of convection seem to be tightly related to the regimes reported in pure hydrodynamic simulations. However, in convective simulations, velocities vary significantly at the scale of the domain, leading to a region of an inertialess quasi-Darcy dynamics and regions where inertial effects become important. We now aim to gain insights into how the local dynamics collectively drives macroscopic regime transitions.
To diagnose the local dynamics, we define the pore-scale Reynolds number $ \langle \textit{Re} \rangle _h$
by averaging the velocity over a representative volume of size
$ \langle \textit{Re} \rangle _h$
by averaging the velocity over a representative volume of size $ h \times h$
, using
$ h \times h$
, using $ h$
as the characteristic length (see figure 1).
$ h$
as the characteristic length (see figure 1).
Figure 5(b) shows the distribution of the pore-scale Reynolds number $ \langle \textit{Re} \rangle _h$
across the fluid domain for various
$ \langle \textit{Re} \rangle _h$
across the fluid domain for various $ Ra_{\mkern -2mu f}$
. In the light-blue shaded region, where
$ Ra_{\mkern -2mu f}$
. In the light-blue shaded region, where $ \textit{Re} \propto Ra_{\mkern -2mu f}$
, most REVs remain below the non-Darcy threshold
$ \textit{Re} \propto Ra_{\mkern -2mu f}$
, most REVs remain below the non-Darcy threshold $ \textit{Re}_{\mkern -2mu nD}$
. As the majority of the REVs
$ \textit{Re}_{\mkern -2mu nD}$
. As the majority of the REVs $ \langle \textit{Re} \rangle _h$
exceed this threshold, harmonic oscillations emerge, marking the onset of transition. The cumulative distribution functions (CDFs) evolve from steep, homogeneous profiles to broader Reynolds-number distributions, indicating increased flow heterogeneity and a gradual approach toward the Forchheimer scaling, as illustrated by the light-green shaded region.
$ \langle \textit{Re} \rangle _h$
exceed this threshold, harmonic oscillations emerge, marking the onset of transition. The cumulative distribution functions (CDFs) evolve from steep, homogeneous profiles to broader Reynolds-number distributions, indicating increased flow heterogeneity and a gradual approach toward the Forchheimer scaling, as illustrated by the light-green shaded region.
To conclude on the effect of inertia on the convective regimes and heat transfer, our numerical results suggest that the macroscopic behaviour of the system is well captured by a domain average permeability based Reynolds number, which results from the local dynamics at the pore scale. The proposed scaling allows us to predict the limits of these regimes on the sole knowledge of $Ra_{\mkern -2mu f}$
. However, we have not yet considered the restricting effect of lower porosity nor the effects of the solid to fluid thermal conductivity ratio that will modify heat transfer in the system.
$Ra_{\mkern -2mu f}$
. However, we have not yet considered the restricting effect of lower porosity nor the effects of the solid to fluid thermal conductivity ratio that will modify heat transfer in the system.
Tabulated values for the simulation domains shown in figure 1(a). The table lists porosity ( $\varphi$
), form drag coefficient of the porous matrix (
$\varphi$
), form drag coefficient of the porous matrix ( $c_{\mkern -2mu F}$
), Forchheimer parameter (
$c_{\mkern -2mu F}$
), Forchheimer parameter ( $\sigma _{\mkern -2mu F}$
), the non-Darcy Reynolds number (
$\sigma _{\mkern -2mu F}$
), the non-Darcy Reynolds number ( $\textit{Re}_{\mkern -2mu nD}$
) defined as the point where the pressure drop deviates by 1 % from the Darcy regime and the critical Reynolds number (
$\textit{Re}_{\mkern -2mu nD}$
) defined as the point where the pressure drop deviates by 1 % from the Darcy regime and the critical Reynolds number ( $\textit{Re}_{\mkern -2mu c}$
) indicating the onset of vortex shedding. All uncertainties are given as absolute values and rounded to three decimal places.
$\textit{Re}_{\mkern -2mu c}$
) indicating the onset of vortex shedding. All uncertainties are given as absolute values and rounded to three decimal places.

4. Effect of porosity and conductivity ratio on HRLC
This section investigates the influence of porosity and conductivity ratio on flow and heat transfer behaviour. We first examine the influence of porosity on the pure hydrodynamics of the staggered cylinder array, followed by an analysis of how varying conductivity ratios affect both steady-state conduction and HRLC. Finally, we examine the combined effects using a dimensionless framework based on $ Ra^* / \textit{Pr}_{\!p}$
, rooted in porous-continuum theory, to assess the Darcy–Forchheimer transition and its breakdown, marked by the emergence of RBC at higher porosity.
$ Ra^* / \textit{Pr}_{\!p}$
, rooted in porous-continuum theory, to assess the Darcy–Forchheimer transition and its breakdown, marked by the emergence of RBC at higher porosity.
Normalised pressure gradient $G=-\boldsymbol{\nabla \!}P/(\mu U/K)$
versus domain-averaged Reynolds number for three porosities, showing the progression from Darcy to Forchheimer and the onset of vortex shedding (Hopf bifurcation). In the Darcy limit the data approach
$G=-\boldsymbol{\nabla \!}P/(\mu U/K)$
versus domain-averaged Reynolds number for three porosities, showing the progression from Darcy to Forchheimer and the onset of vortex shedding (Hopf bifurcation). In the Darcy limit the data approach $G\!\approx \!1$
; with increasing inertia
$G\!\approx \!1$
; with increasing inertia $G$
grows roughly linearly with
$G$
grows roughly linearly with $\textit{Re}$
in accord with the Forchheimer form
$\textit{Re}$
in accord with the Forchheimer form $G\simeq 1+( {c_F}/{\sqrt {\sigma _F}})\,\textit{Re}$
(fit lines). Markers labelled
$G\simeq 1+( {c_F}/{\sqrt {\sigma _F}})\,\textit{Re}$
(fit lines). Markers labelled $\textit{Re}_{nD}$
and
$\textit{Re}_{nD}$
and $\textit{Re}_c$
indicate, respectively, the departure from Darcy scaling and the critical Reynolds for the Hopf transition; thresholds shift with porosity.
$\textit{Re}_c$
indicate, respectively, the departure from Darcy scaling and the critical Reynolds for the Hopf transition; thresholds shift with porosity.

Time-averaged Nusselt number $\overline {\textit{Nu}}$
for three porosities (
$\overline {\textit{Nu}}$
for three porosities ( $\varphi =33\,\%, 39\,\%, 43\,\%$
) at fixed conductivity ratio
$\varphi =33\,\%, 39\,\%, 43\,\%$
) at fixed conductivity ratio $\lambda =1$
. The two higher-porosity cases follow a Rayleigh–Bénard-type scaling (
$\lambda =1$
. The two higher-porosity cases follow a Rayleigh–Bénard-type scaling ( $\overline {\textit{Nu}} \propto Ra_{\!f}^{1/3}$
), whereas the lowest porosity shows a scaling closer to
$\overline {\textit{Nu}} \propto Ra_{\!f}^{1/3}$
), whereas the lowest porosity shows a scaling closer to $\overline {\textit{Nu}} \propto Ra_{\!f}^{1/2}$
, consistent with the Forchheimer regime. Panel (a) shows
$\overline {\textit{Nu}} \propto Ra_{\!f}^{1/2}$
, consistent with the Forchheimer regime. Panel (a) shows $\overline {\textit{Nu}}$
versus fluid Rayleigh number
$\overline {\textit{Nu}}$
versus fluid Rayleigh number $Ra_{\!f}$
, showing the transition from steady to oscillatory convection indicated by the colour bar. Porosity strongly affects convective efficiency in the steady regime, while differences diminish once inertial effects dominate. Panel (b) shows
$Ra_{\!f}$
, showing the transition from steady to oscillatory convection indicated by the colour bar. Porosity strongly affects convective efficiency in the steady regime, while differences diminish once inertial effects dominate. Panel (b) shows $\overline {\textit{Nu}}/Ra^{\ast }$
versus modified Rayleigh number
$\overline {\textit{Nu}}/Ra^{\ast }$
versus modified Rayleigh number $Ra^{\ast }$
, compared against the theoretical predictions of Darcy, Forchheimer and Rayleigh-Bénard type scaling laws.
$Ra^{\ast }$
, compared against the theoretical predictions of Darcy, Forchheimer and Rayleigh-Bénard type scaling laws.

4.1. Effects of porosity on Darcy to non-Darcy transition in pressure-driven flows
Building on the analysis of the $ \varphi = 43\,\%$
case in § 3.1, we now extend the investigation to two additional porosities,
$ \varphi = 43\,\%$
case in § 3.1, we now extend the investigation to two additional porosities, $ \varphi = 39\,\%$
and
$ \varphi = 39\,\%$
and $ \varphi = 33\,\%$
, using the hydrodynamic set-up introduced in § 2.3. For each case, we compute the normalised pressure gradient
$ \varphi = 33\,\%$
, using the hydrodynamic set-up introduced in § 2.3. For each case, we compute the normalised pressure gradient $ G$
as a function of the domain-averaged permeability-based Reynolds number
$ G$
as a function of the domain-averaged permeability-based Reynolds number $ \langle \textit{Re} \rangle _H$
, allowing comparison with the scaling relations introduced in (2.16). Figure 6 shows the transition from Darcy to inertial flow across different porosities. In the staggered array, lower
$ \langle \textit{Re} \rangle _H$
, allowing comparison with the scaling relations introduced in (2.16). Figure 6 shows the transition from Darcy to inertial flow across different porosities. In the staggered array, lower $\varphi$
leads to an earlier departure from Darcy behaviour, with wake recirculation appearing at smaller
$\varphi$
leads to an earlier departure from Darcy behaviour, with wake recirculation appearing at smaller $\textit{Re}=U\sqrt {K}/\nu$
. All datasets follow the expected non-dimensional Forchheimer trend, with fit parameters provided in table 3. Porosity is controlled by adjusting the centre-to-centre spacing
$\textit{Re}=U\sqrt {K}/\nu$
. All datasets follow the expected non-dimensional Forchheimer trend, with fit parameters provided in table 3. Porosity is controlled by adjusting the centre-to-centre spacing $ L$
between cylinders (figure 1
a), which alters the pore geometry and intensifies local pressure and velocity gradients. The Hopf bifurcation occurs at lower
$ L$
between cylinders (figure 1
a), which alters the pore geometry and intensifies local pressure and velocity gradients. The Hopf bifurcation occurs at lower $\textit{Re}$
for larger porosities, indicating that spatial confinement has a stabilising effect on initial vortex shedding.
$\textit{Re}$
for larger porosities, indicating that spatial confinement has a stabilising effect on initial vortex shedding.
4.2. Effect of porosity on HRLC
The influence of porosity on convective heat transfer in HRL convection is examined by comparing time-averaged Nusselt numbers $ \overline {\textit{Nu}}$
across a range of fluid Rayleigh numbers
$ \overline {\textit{Nu}}$
across a range of fluid Rayleigh numbers $ Ra_{\mkern -2mu f}$
for three porosities (
$ Ra_{\mkern -2mu f}$
for three porosities ( $ \varphi = 33\,\%, 39\,\%, 43\,\%$
) at a fixed conductivity ratio
$ \varphi = 33\,\%, 39\,\%, 43\,\%$
) at a fixed conductivity ratio $ \lambda = 1$
(figure 7). In the steady-state regime, decreasing the porosities leads to significantly lower absolute value of the Nusselt numbers. All cases exhibit a characteristic stagnation in
$ \lambda = 1$
(figure 7). In the steady-state regime, decreasing the porosities leads to significantly lower absolute value of the Nusselt numbers. All cases exhibit a characteristic stagnation in $ \overline {\textit{Nu}}$
as convection transitions from steady to unsteady. The onset of oscillations occurs for all cases around
$ \overline {\textit{Nu}}$
as convection transitions from steady to unsteady. The onset of oscillations occurs for all cases around $Ra_{\mkern -2mu f} \sim 10^9$
, although we note a marginal shift toward higher
$Ra_{\mkern -2mu f} \sim 10^9$
, although we note a marginal shift toward higher $Ra_{\mkern -2mu f}$
for the lowest porosity. The classical well-mixed Rayleigh–Bénard scaling,
$Ra_{\mkern -2mu f}$
for the lowest porosity. The classical well-mixed Rayleigh–Bénard scaling, $\textit{Nu} \propto Ra_{\mkern -2mu f}^{1/3}$
may capture reasonably well our observations at the largest values of the porosity. In contrast, at the lowest porosity considered in this study the scaling seems to approach
$\textit{Nu} \propto Ra_{\mkern -2mu f}^{1/3}$
may capture reasonably well our observations at the largest values of the porosity. In contrast, at the lowest porosity considered in this study the scaling seems to approach $Ra_{\mkern -2mu f}^{1/2}$
.
$Ra_{\mkern -2mu f}^{1/2}$
.
Value of $\langle \textit{Re}\rangle _H/\sqrt {Da}$
as a function of the Darcy–Rayleigh number
$\langle \textit{Re}\rangle _H/\sqrt {Da}$
as a function of the Darcy–Rayleigh number $Ra^{\ast }$
for
$Ra^{\ast }$
for $k_s/k_{\!f}=1$
at
$k_s/k_{\!f}=1$
at $\textit{Pr}_f = 1$
. The data are compared against the theoretical predictions given by (3.6) and (3.8). For the lowest porosity (
$\textit{Pr}_f = 1$
. The data are compared against the theoretical predictions given by (3.6) and (3.8). For the lowest porosity ( $\varphi =33\,\%$
), the dynamics in the inertial regime remains influenced by Darcy drag, whereas higher porosities (
$\varphi =33\,\%$
), the dynamics in the inertial regime remains influenced by Darcy drag, whereas higher porosities ( $\varphi =39\,\%, 43\,\%$
) exhibit a reduced influence and approach the expected inertial scaling.
$\varphi =39\,\%, 43\,\%$
) exhibit a reduced influence and approach the expected inertial scaling.

This shift in scaling behaviour reflects changes in the underlying momentum balance but cannot be attributed to Forchheimer effects alone. In the steady-state HRLC, the mean Reynolds number scales linearly with the Darcy–Rayleigh number across all porosities, indicating that buoyancy directly balances Darcy drag (figure 8). Once the flow becomes oscillatory, all porosities bend toward the asymptotic Forchheimer scaling $\propto \sqrt {Ra^\ast }$
(3.8), with the lowest porosity transitioning slightly earlier and rising more steeply, showing that Darcy drag still contributes to the forcing balance and the momentum dynamics remain transitional. The corresponding Nusselt–Rayleigh scaling for
$\propto \sqrt {Ra^\ast }$
(3.8), with the lowest porosity transitioning slightly earlier and rising more steeply, showing that Darcy drag still contributes to the forcing balance and the momentum dynamics remain transitional. The corresponding Nusselt–Rayleigh scaling for $\varphi =39\,\%$
and
$\varphi =39\,\%$
and $43\,\%$
does not follow a purely Forchheimer-governed
$43\,\%$
does not follow a purely Forchheimer-governed $1/2$
law; instead, these cases already approach a Rayleigh–Bénard-type
$1/2$
law; instead, these cases already approach a Rayleigh–Bénard-type $1/3$
scaling. This demonstrates that inertial momentum transport alone cannot explain the heat-transfer behaviour and that thermal diffusion must be considered to capture the observed transition in scaling.
$1/3$
scaling. This demonstrates that inertial momentum transport alone cannot explain the heat-transfer behaviour and that thermal diffusion must be considered to capture the observed transition in scaling.
Experimental studies on RBC at comparable $ Ra_{\mkern -2mu f}$
and moderate Prandtl numbers typically report slightly lower exponents than the classical
$ Ra_{\mkern -2mu f}$
and moderate Prandtl numbers typically report slightly lower exponents than the classical $ 1/3$
scaling, such as
$ 1/3$
scaling, such as $ \textit{Nu} \propto Ra_{\mkern -2mu f}^{0.297}$
observed by Xia, Lam & Zhou (Reference Xia, Lam and Zhou2002). In the inertial regime of porous-medium convection, Keene & Goldstein (Reference Keene and Goldstein2015) report
$ \textit{Nu} \propto Ra_{\mkern -2mu f}^{0.297}$
observed by Xia, Lam & Zhou (Reference Xia, Lam and Zhou2002). In the inertial regime of porous-medium convection, Keene & Goldstein (Reference Keene and Goldstein2015) report $ \beta = 0.298$
, consistent with the findings of Liu et al. (Reference Liu, Jiang, Chong, Zhu, Wan, Verzicco, Stevens, Lohse and Sun2020), Korba & Li (Reference Korba and Li2022) and Li, Yang & Sun (Reference Li, Yang and Sun2025) for porosities
$ \beta = 0.298$
, consistent with the findings of Liu et al. (Reference Liu, Jiang, Chong, Zhu, Wan, Verzicco, Stevens, Lohse and Sun2020), Korba & Li (Reference Korba and Li2022) and Li, Yang & Sun (Reference Li, Yang and Sun2025) for porosities $\geqslant$
35 %. However, for smaller porosities, Li et al. (Reference Li, Yang and Sun2025) report a similar trend toward a steeper scaling exponent approaching
$\geqslant$
35 %. However, for smaller porosities, Li et al. (Reference Li, Yang and Sun2025) report a similar trend toward a steeper scaling exponent approaching $ 1/2$
in the inertial regime.
$ 1/2$
in the inertial regime.
Due to limited data in the steady-state convective regime, a precise scaling remains uncertain; for $ \varphi = 43\,\%$
, we observe a sub-linear trend (figure 7
b), whereas at lower porosities the range over which this scaling holds seems to narrow and the trend approaches
$ \varphi = 43\,\%$
, we observe a sub-linear trend (figure 7
b), whereas at lower porosities the range over which this scaling holds seems to narrow and the trend approaches $ \textit{Nu} \propto Ra_{\mkern -2mu f}$
. Li et al. (Reference Li, Yang and Sun2025) report an increasing scaling exponent with decreasing porosity within the well-defined, yet laminar, regime they designate as the high Darcy–Rayleigh regime, with values approaching unity as porosity decreases. This overall trend, where the scaling exponent increases with decreasing porosity and Darcy number, aligns with previous observations in the literature (Liu et al. Reference Liu, Jiang, Chong, Zhu, Wan, Verzicco, Stevens, Lohse and Sun2020; Korba & Li Reference Korba and Li2022; Noto et al. Reference Noto, Letelier and Ulloa2024).
$ \textit{Nu} \propto Ra_{\mkern -2mu f}$
. Li et al. (Reference Li, Yang and Sun2025) report an increasing scaling exponent with decreasing porosity within the well-defined, yet laminar, regime they designate as the high Darcy–Rayleigh regime, with values approaching unity as porosity decreases. This overall trend, where the scaling exponent increases with decreasing porosity and Darcy number, aligns with previous observations in the literature (Liu et al. Reference Liu, Jiang, Chong, Zhu, Wan, Verzicco, Stevens, Lohse and Sun2020; Korba & Li Reference Korba and Li2022; Noto et al. Reference Noto, Letelier and Ulloa2024).
4.3. Effect of conductivity ratios
In this section, we first report the effective thermal conductivities $ k_{\mkern -2mu m}$
obtained from steady-state conduction across a range of solid-to-fluid conductivity ratios
$ k_{\mkern -2mu m}$
obtained from steady-state conduction across a range of solid-to-fluid conductivity ratios $ k_{\mkern -2mu r} \in \{0.1, 0.2, 1.0, 5.0, 10.0\}$
, with a fixed heat capacity ratio
$ k_{\mkern -2mu r} \in \{0.1, 0.2, 1.0, 5.0, 10.0\}$
, with a fixed heat capacity ratio $ \sigma = 1$
. We then analyse the influence of
$ \sigma = 1$
. We then analyse the influence of $ k_{\mkern -2mu r}$
on heat flux at a porosity of
$ k_{\mkern -2mu r}$
on heat flux at a porosity of $ \varphi = 43\,\%$
, followed by the combined effects of porosity and the relative conductivity
$ \varphi = 43\,\%$
, followed by the combined effects of porosity and the relative conductivity $ \lambda = k_{\mkern -2mu f} / k_{\mkern -2mu m}$
on heat transfer. These effects are examined across both laminar and inertial regimes, tested against Darcy and Forchheimer scaling, and interpreted through the concept of plume-scale confinement to assess the limits of porous-continuum theory – highlighting the onset of Rayleigh–Bénard-type convection at higher porosities.
$ \lambda = k_{\mkern -2mu f} / k_{\mkern -2mu m}$
on heat transfer. These effects are examined across both laminar and inertial regimes, tested against Darcy and Forchheimer scaling, and interpreted through the concept of plume-scale confinement to assess the limits of porous-continuum theory – highlighting the onset of Rayleigh–Bénard-type convection at higher porosities.
4.3.1. Relative thermal conductivity ratio
$\lambda$

The resulting values for relative thermal conductivity ratio, $\lambda = k_{\mkern -2mu f} / k_{\mkern -2mu m}$
, range from greater than 1 when the solid phase is a strong thermal insulator to less than 1 when the solid phase conducts heat efficiently (table 4). For a lower porosity of
$\lambda = k_{\mkern -2mu f} / k_{\mkern -2mu m}$
, range from greater than 1 when the solid phase is a strong thermal insulator to less than 1 when the solid phase conducts heat efficiently (table 4). For a lower porosity of $\varphi = 33\,\%$
,
$\varphi = 33\,\%$
, $\lambda$
varies from 3.68 at
$\lambda$
varies from 3.68 at $k_{\mkern -2mu r} = 0.1$
to 0.27 at
$k_{\mkern -2mu r} = 0.1$
to 0.27 at $k_{\mkern -2mu r} = 10.0$
, whereas for a higher porosity of
$k_{\mkern -2mu r} = 10.0$
, whereas for a higher porosity of $\varphi = 43\,\%$
, the values range from 2.79 to 0.35 (table 4).
$\varphi = 43\,\%$
, the values range from 2.79 to 0.35 (table 4).
Values of effective thermal conductivity $k_{\mkern -2mu m}$
and relative thermal conductivity ratios (
$k_{\mkern -2mu m}$
and relative thermal conductivity ratios ( $\lambda = k_{\mkern -2mu f} / k_{\mkern -2mu m}$
) are shown for various solid-to-fluid conductivity ratios (
$\lambda = k_{\mkern -2mu f} / k_{\mkern -2mu m}$
) are shown for various solid-to-fluid conductivity ratios ( $k_{\mkern -2mu r} = k_{\mkern -2mu s} / k_{\mkern -2mu f}$
) and porosities (
$k_{\mkern -2mu r} = k_{\mkern -2mu s} / k_{\mkern -2mu f}$
) and porosities ( $\varphi$
). The value of
$\varphi$
). The value of $k_{\mkern -2mu m}$
is evaluated at fluid-relaxation time
$k_{\mkern -2mu m}$
is evaluated at fluid-relaxation time $\tau _{\mkern -2mu f}^+ = 0.505$
and
$\tau _{\mkern -2mu f}^+ = 0.505$
and $\textit{Pr}_{\mkern -2mu f} = 1$
with fluid conductivity given as
$\textit{Pr}_{\mkern -2mu f} = 1$
with fluid conductivity given as $k_{\mkern -2mu f} = 16.67 \ \times \ 10^{-4}$
(W m−1 K−1 in lattice units).
$k_{\mkern -2mu f} = 16.67 \ \times \ 10^{-4}$
(W m−1 K−1 in lattice units).

For a comparable solid-to-fluid conductivity ratio ( $ k_{\mkern -2mu r} = 4.26$
) in glass–glycol packed beds, Prasad et al. (Reference Prasad, Kladias, Bandyopadhaya and Tian1989) report
$ k_{\mkern -2mu r} = 4.26$
) in glass–glycol packed beds, Prasad et al. (Reference Prasad, Kladias, Bandyopadhaya and Tian1989) report $ \lambda (\varphi = 40\,\%) = 0.43$
, while Kladias (Reference Kladias1989) measure
$ \lambda (\varphi = 40\,\%) = 0.43$
, while Kladias (Reference Kladias1989) measure $ \lambda (\varphi = 40\,\%) = 0.44$
and
$ \lambda (\varphi = 40\,\%) = 0.44$
and $ \lambda (\varphi = 44\,\%) = 0.49$
. These values show reasonable agreement across similar porosities and different packings where the solids are in contact, supporting the estimated effective conductivity ratios of the chosen porous media. Furthermore, our values also agree well with the reported values for
$ \lambda (\varphi = 44\,\%) = 0.49$
. These values show reasonable agreement across similar porosities and different packings where the solids are in contact, supporting the estimated effective conductivity ratios of the chosen porous media. Furthermore, our values also agree well with the reported values for $ k_{\mkern -2mu r} = 0.1$
and
$ k_{\mkern -2mu r} = 0.1$
and $ k_{\mkern -2mu r} = 10$
from figure 5 in Korba & Li (Reference Korba and Li2022).
$ k_{\mkern -2mu r} = 10$
from figure 5 in Korba & Li (Reference Korba and Li2022).
4.3.2. Effect of conductivity ratio on HRLC at
$\varphi = 43\,\%$

At a porosity of $\varphi = 43\,\%$
, increasing the solid-to-fluid conductivity ratio
$\varphi = 43\,\%$
, increasing the solid-to-fluid conductivity ratio $k_{\mkern -2mu r}$
results in a reduction of the Nusselt number across all temporal regimes (figure 9
a). For
$k_{\mkern -2mu r}$
results in a reduction of the Nusselt number across all temporal regimes (figure 9
a). For $k_{\mkern -2mu r} = 10$
, the onset of convection is delayed, and the steady convection regime persists up to slightly higher values of
$k_{\mkern -2mu r} = 10$
, the onset of convection is delayed, and the steady convection regime persists up to slightly higher values of $Ra_{\mkern -2mu f}$
. Across all values of
$Ra_{\mkern -2mu f}$
. Across all values of $ k_{\mkern -2mu r}$
, the Nusselt number plateaus following the onset of minor harmonic oscillations, which are linked to the reorganisation of thermal structures driven by emerging inertial effects. The scaling of
$ k_{\mkern -2mu r}$
, the Nusselt number plateaus following the onset of minor harmonic oscillations, which are linked to the reorganisation of thermal structures driven by emerging inertial effects. The scaling of $ \textit{Nu}$
with
$ \textit{Nu}$
with $ Ra_{\mkern -2mu f}$
shows a dependence on the effective conductivity ratio
$ Ra_{\mkern -2mu f}$
shows a dependence on the effective conductivity ratio $ \lambda$
in the steady convective regime, where stronger solid diffusion (lower
$ \lambda$
in the steady convective regime, where stronger solid diffusion (lower $ \lambda$
) leads to reduction in the scaling exponents (figure 9
b). In the oscillatory regime, this effect largely vanishes. In the inertial regime, the data generally follow the trend
$ \lambda$
) leads to reduction in the scaling exponents (figure 9
b). In the oscillatory regime, this effect largely vanishes. In the inertial regime, the data generally follow the trend $\textit{Nu} \propto Ra_{\mkern -2mu f}^{1/3}$
.
$\textit{Nu} \propto Ra_{\mkern -2mu f}^{1/3}$
.
(a) Time-averaged Nusselt number $ \overline {\textit{Nu}}$
as a function of fluid Rayleigh number
$ \overline {\textit{Nu}}$
as a function of fluid Rayleigh number $ Ra_{\mkern -2mu f}$
for three conductivity ratios (
$ Ra_{\mkern -2mu f}$
for three conductivity ratios ( $ k_{\mkern -2mu r} = 0.1, 1.0, 10.0$
) at fixed porosity
$ k_{\mkern -2mu r} = 0.1, 1.0, 10.0$
) at fixed porosity $ \varphi = 43\,\%$
. The transition from steady to oscillatory convection is indicated by the colour bar, while the asymptotic relation
$ \varphi = 43\,\%$
. The transition from steady to oscillatory convection is indicated by the colour bar, while the asymptotic relation $ \overline {\textit{Nu}} \propto Ra_{\mkern -2mu f}^{1/3}$
from theoretical Rayleigh–Bénard scaling is shown for reference. (b) Normalised heat transfer
$ \overline {\textit{Nu}} \propto Ra_{\mkern -2mu f}^{1/3}$
from theoretical Rayleigh–Bénard scaling is shown for reference. (b) Normalised heat transfer $ \overline {\textit{Nu}}/Ra^{\ast }$
as a function of modified Rayleigh number
$ \overline {\textit{Nu}}/Ra^{\ast }$
as a function of modified Rayleigh number $ Ra^{\ast }$
. The steady-state data do not collapse onto the Darcy scaling but instead exhibit sublinear trends that reduce with increasing
$ Ra^{\ast }$
. The steady-state data do not collapse onto the Darcy scaling but instead exhibit sublinear trends that reduce with increasing $ k_{\mkern -2mu r}$
, while the inertial regime progressively approaches the Rayleigh–Bénard reference.
$ k_{\mkern -2mu r}$
, while the inertial regime progressively approaches the Rayleigh–Bénard reference.

The relative thermal conductivity of the solid ( $ \lambda$
) influences the onset of unsteady convection. As shown in figures 10 (a) and 10(b), higher solid conductivity (
$ \lambda$
) influences the onset of unsteady convection. As shown in figures 10 (a) and 10(b), higher solid conductivity ( $ k_{\mkern -2mu r} \gt 1$
) has a stabilising effect, extending the steady convective regime to higher
$ k_{\mkern -2mu r} \gt 1$
) has a stabilising effect, extending the steady convective regime to higher $ Ra_{\mkern -2mu f}$
and associated pore-scale Reynolds numbers. In contrast, for insulating solids (
$ Ra_{\mkern -2mu f}$
and associated pore-scale Reynolds numbers. In contrast, for insulating solids ( $ k_{\mkern -2mu r} \lt 1$
), the transition to oscillatory convection occurs at lower
$ k_{\mkern -2mu r} \lt 1$
), the transition to oscillatory convection occurs at lower $ Ra_{\mkern -2mu f}$
, accompanied by a shift to lower values in the
$ Ra_{\mkern -2mu f}$
, accompanied by a shift to lower values in the $ \textit{Re}$
distributions. Additionally, the transition between the steady and oscillatory scaling regimes narrows in both
$ \textit{Re}$
distributions. Additionally, the transition between the steady and oscillatory scaling regimes narrows in both $ \textit{Re}$
and
$ \textit{Re}$
and $ Ra_{\mkern -2mu f}$
for
$ Ra_{\mkern -2mu f}$
for $ k_{\mkern -2mu r} \gt 1$
, indicating a more abrupt onset of unsteady convection in porous media with thermally strongly diffusive solids.
$ k_{\mkern -2mu r} \gt 1$
, indicating a more abrupt onset of unsteady convection in porous media with thermally strongly diffusive solids.
(a,b) Cumulative density functions of $\langle \textit{Re} \rangle _h$
averaged over the unit pore scale
$\langle \textit{Re} \rangle _h$
averaged over the unit pore scale $h$
for different
$h$
for different $Ra_{\mkern -2mu f}$
and
$Ra_{\mkern -2mu f}$
and $k_{\mkern -2mu r}$
. Dashed and dash-dotted lines mark the critical Reynolds numbers from the hydrodynamic reference case:
$k_{\mkern -2mu r}$
. Dashed and dash-dotted lines mark the critical Reynolds numbers from the hydrodynamic reference case: $ \textit{Re}_{\mkern -2mu nD}$
(onset of Forchheimer flow) and
$ \textit{Re}_{\mkern -2mu nD}$
(onset of Forchheimer flow) and $ \textit{Re}_{\mkern -2mu c}$
(onset of vortex shedding), respectively. Shaded regions highlight the uncertainty in oscillatory convection onset and the Nusselt number stagnation zone. (c,d) Horizontally averaged temperature profiles
$ \textit{Re}_{\mkern -2mu c}$
(onset of vortex shedding), respectively. Shaded regions highlight the uncertainty in oscillatory convection onset and the Nusselt number stagnation zone. (c,d) Horizontally averaged temperature profiles $\langle \theta \rangle _x$
as a function of normalised height. The shaded region in (d) represents the buoyancy potential
$\langle \theta \rangle _x$
as a function of normalised height. The shaded region in (d) represents the buoyancy potential $\varPsi _{\mkern -2mu k_{\mkern -2mu r}}$
, while the BL thickness
$\varPsi _{\mkern -2mu k_{\mkern -2mu r}}$
, while the BL thickness $\delta _{\mkern -2mu k_{\mkern -2mu r}}$
is depicted by horizontal dashed and dotted lines, indicating an increase in BL height with higher
$\delta _{\mkern -2mu k_{\mkern -2mu r}}$
is depicted by horizontal dashed and dotted lines, indicating an increase in BL height with higher $k_{\mkern -2mu r}$
.
$k_{\mkern -2mu r}$
.

In our HRLC simulations, increasing $k_{\mkern -2mu r}$
leads to a thicker BL (figure 10
c). The thermal BL thickness
$k_{\mkern -2mu r}$
leads to a thicker BL (figure 10
c). The thermal BL thickness $\delta$
was determined using the gradient method, obtained by extrapolating the near-wall temperature gradient to its intersection with the bulk mean temperature,
$\delta$
was determined using the gradient method, obtained by extrapolating the near-wall temperature gradient to its intersection with the bulk mean temperature, $\theta =0.5$
(Stevens et al. Reference Stevens, Zhong, Clercx, Ahlers and Lohse2009). For
$\theta =0.5$
(Stevens et al. Reference Stevens, Zhong, Clercx, Ahlers and Lohse2009). For $ k_{\mkern -2mu s}/k_{\mkern -2mu f} = 10$
, the measured BL thickness is
$ k_{\mkern -2mu s}/k_{\mkern -2mu f} = 10$
, the measured BL thickness is $ \delta _{\mkern -2mu 10} = 2.5\, \delta _{\mkern -2mu 0.1}$
compared with
$ \delta _{\mkern -2mu 10} = 2.5\, \delta _{\mkern -2mu 0.1}$
compared with $ k_{\mkern -2mu s}/k_{\mkern -2mu f} = 0.1$
. Since the porosity is below
$ k_{\mkern -2mu s}/k_{\mkern -2mu f} = 0.1$
. Since the porosity is below $ 50\,\%$
, increasing
$ 50\,\%$
, increasing $ k_{\mkern -2mu r}$
raises the effective conductivity
$ k_{\mkern -2mu r}$
raises the effective conductivity $ \alpha _m$
(
$ \alpha _m$
( $\sigma = 1$
, table 4). An increase in
$\sigma = 1$
, table 4). An increase in $ \alpha _m$
lowers
$ \alpha _m$
lowers $ \textit{Nu}$
according to (2.20), which, via the relation
$ \textit{Nu}$
according to (2.20), which, via the relation $ \delta _T \sim H/(2\textit{Nu})$
(Liu et al. 2020), reflects a thickening of the thermal BL. This is consistent with the continuum-scale heat equation of Korba & Li (Reference Korba and Li2022, their equation (2.20)), in which the diffusive term scales as
$ \delta _T \sim H/(2\textit{Nu})$
(Liu et al. 2020), reflects a thickening of the thermal BL. This is consistent with the continuum-scale heat equation of Korba & Li (Reference Korba and Li2022, their equation (2.20)), in which the diffusive term scales as $ 1/Ra^* \propto \alpha _m$
at fixed
$ 1/Ra^* \propto \alpha _m$
at fixed $ Ra_f$
and
$ Ra_f$
and $ Da$
. The observed BL thickening with
$ Da$
. The observed BL thickening with $ k_{\mkern -2mu r}$
therefore matches the expected macroscopic behaviour. If a pure-fluid BL is imposed in DNS (e.g. Korba & Li Reference Korba and Li2022), the direct wall measurement shows an inverse
$ k_{\mkern -2mu r}$
therefore matches the expected macroscopic behaviour. If a pure-fluid BL is imposed in DNS (e.g. Korba & Li Reference Korba and Li2022), the direct wall measurement shows an inverse $ k_{\mkern -2mu r}$
–
$ k_{\mkern -2mu r}$
– $ \delta _T$
trend (cf. their figures 21–22), consistent with the trend of (2.12) when
$ \delta _T$
trend (cf. their figures 21–22), consistent with the trend of (2.12) when $ k_{\mkern -2mu r} \neq 1$
(table 4). This behaviour originates from isotherm compression (
$ k_{\mkern -2mu r} \neq 1$
(table 4). This behaviour originates from isotherm compression ( $ k_s/k_{\!f} \gt 1$
) or expansion (
$ k_s/k_{\!f} \gt 1$
) or expansion ( $ k_s/k_{\!f} \lt 1$
) within the fluid, combined with the local boundary topology. Incorporating the solid phase directly into the boundary recovers the expected scaling
$ k_s/k_{\!f} \lt 1$
) within the fluid, combined with the local boundary topology. Incorporating the solid phase directly into the boundary recovers the expected scaling $ \textit{Nu} \propto 1/\delta _T$
, as shown in figure 10. If the Nusselt number is computed using an incorrect conductive baseline, it can lead to an artificial inversion of the
$ \textit{Nu} \propto 1/\delta _T$
, as shown in figure 10. If the Nusselt number is computed using an incorrect conductive baseline, it can lead to an artificial inversion of the $ \textit{Nu}$
–
$ \textit{Nu}$
– $ k_r$
trend (table 1). Such artefacts arise when assuming a pure-fluid wall layer – a common simplification in DNS studies that neglects the true porous-wall structure found in random packings and natural porous media.
$ k_r$
trend (table 1). Such artefacts arise when assuming a pure-fluid wall layer – a common simplification in DNS studies that neglects the true porous-wall structure found in random packings and natural porous media.
In the inertial regime, cases with $ k_{\mkern -2mu r} \gt 1$
exhibit higher average and peak
$ k_{\mkern -2mu r} \gt 1$
exhibit higher average and peak $ \langle \textit{Re} \rangle _h$
at the same
$ \langle \textit{Re} \rangle _h$
at the same $ Ra_{\mkern -2mu f}$
compared with
$ Ra_{\mkern -2mu f}$
compared with $ k_{\mkern -2mu r} \lt 1$
(e.g. at
$ k_{\mkern -2mu r} \lt 1$
(e.g. at $ Ra_{\mkern -2mu f} = 5.71 \times 10^9$
; see figures 10
a and 10
b). Despite the increased kinetic energy, the Nusselt number is lower for
$ Ra_{\mkern -2mu f} = 5.71 \times 10^9$
; see figures 10
a and 10
b). Despite the increased kinetic energy, the Nusselt number is lower for $ \lambda \lt 1$
, indicating reduced heat transfer efficiency. This result is supported by the horizontally averaged temperature profiles (figure 10
d), which exhibit greater deviation from the reference temperature for
$ \lambda \lt 1$
, indicating reduced heat transfer efficiency. This result is supported by the horizontally averaged temperature profiles (figure 10
d), which exhibit greater deviation from the reference temperature for $ k_{\mkern -2mu r} = 10$
, as quantified by the buoyancy potential
$ k_{\mkern -2mu r} = 10$
, as quantified by the buoyancy potential
 \begin{align} \varPsi _{\mkern -2mu k_{\mkern -2mu r}} = \int _0^H\! \rho _{\mkern -2mu f} g (\langle \theta \rangle _x - \theta _0)\,{\rm d}z. \end{align}
As an example, at $ Ra_{\mkern -2mu f} = 1.90 \times 10^9$
, the value
$ Ra_{\mkern -2mu f} = 1.90 \times 10^9$
, the value $ \varPsi _{\mkern -2mu 10} = 1.3\,\varPsi _{\mkern -2mu 0.1}$
indicates slightly stronger buoyancy forcing and higher velocities. For
$ \varPsi _{\mkern -2mu 10} = 1.3\,\varPsi _{\mkern -2mu 0.1}$
indicates slightly stronger buoyancy forcing and higher velocities. For $ k_{\mkern -2mu r} = 10$
, solid-phase conduction enhances background heat transport by more than an order of magnitude (table 4). As a result,
$ k_{\mkern -2mu r} = 10$
, solid-phase conduction enhances background heat transport by more than an order of magnitude (table 4). As a result, $ \textit{Nu}$
is reduced by approximately a factor of 4 compared with the
$ \textit{Nu}$
is reduced by approximately a factor of 4 compared with the $ k_{\mkern -2mu r} = 0.1$
case.
$ k_{\mkern -2mu r} = 0.1$
case.
4.3.3. Scaling of the combined effect of porosity and conductivity ratios in the Darcy and Forchheimer regimes
First we assess the combined effect of $\lambda$
and
$\lambda$
and $\varphi$
on the steady-state HRLC simulations where Darcy drag dominates over inertial forcing. The corresponding results for solid-to-fluid conductivity ratios
$\varphi$
on the steady-state HRLC simulations where Darcy drag dominates over inertial forcing. The corresponding results for solid-to-fluid conductivity ratios $k_{\mkern -2mu r} = k_{\mkern -2mu s}/k_{\mkern -2mu f} \in \{0.1, 0.2, 1.0, 5.0, 10.0\}$
and porosities
$k_{\mkern -2mu r} = k_{\mkern -2mu s}/k_{\mkern -2mu f} \in \{0.1, 0.2, 1.0, 5.0, 10.0\}$
and porosities $\varphi = \{33\,\%, 39\,\%, 43\,\%\}$
are presented in figure 11, where the data are presented in the classic
$\varphi = \{33\,\%, 39\,\%, 43\,\%\}$
are presented in figure 11, where the data are presented in the classic $\textit{Nu} - Ra^*$
scaling.
$\textit{Nu} - Ra^*$
scaling.
(a,b) Steady-state Nusselt–Darcy–Rayleigh relation for different porosities. The onset of convection and the laminar Darcy regime align well with the Elder relation. (c) The data deviate from the Elder relation, indicating a breakdown of the Darcy–Rayleigh scaling for different conductivity ratios, despite being identified as laminar convection.

The simulation results generally follow the Elder relation (Elder Reference Elder1967), with particularly good agreement observed for $\varphi = 33\,\%$
, and slightly less consistency for
$\varphi = 33\,\%$
, and slightly less consistency for $\varphi = 39\,\%$
. In contrast, the data for
$\varphi = 39\,\%$
. In contrast, the data for $\varphi = 43\,\%$
exhibit a shallower scaling, especially when
$\varphi = 43\,\%$
exhibit a shallower scaling, especially when $\lambda \lt 1$
, following a relationship of
$\lambda \lt 1$
, following a relationship of $\textit{Nu} \sim (Ra^*)^{2/3}$
. Since the linear
$\textit{Nu} \sim (Ra^*)^{2/3}$
. Since the linear $\textit{Re}_K$
–
$\textit{Re}_K$
– $Ra^*$
relation holds in the laminar regime for all
$Ra^*$
relation holds in the laminar regime for all $k_s/k_{\!f}$
at
$k_s/k_{\!f}$
at $\varphi = 43\,\%$
, the reduced growth of
$\varphi = 43\,\%$
, the reduced growth of $\textit{Nu}$
must stem from a reduction in the vertical convective flux
$\textit{Nu}$
must stem from a reduction in the vertical convective flux $\langle u_z T'\rangle _V$
with increasing
$\langle u_z T'\rangle _V$
with increasing $Ra^*$
, as also evidenced by the thicker thermal BL for
$Ra^*$
, as also evidenced by the thicker thermal BL for $k_s/k_{\!f} \gt 1$
(figure 10
c). This effect is also observed by Karani & Huber (Reference Karani and Huber2017) at onset of convection at 50 % porosity.
$k_s/k_{\!f} \gt 1$
(figure 10
c). This effect is also observed by Karani & Huber (Reference Karani and Huber2017) at onset of convection at 50 % porosity.
To account for inertial effects in porous convection, the characteristic velocity can be derived from a balance between buoyancy and Forchheimer drag (3.5), rather than from the classical Darcy drag. In this case, the ratio of diffusive to advective time scales, $\mathcal{R}$
, yields the following dimensionless group:
$\mathcal{R}$
, yields the following dimensionless group:
 \begin{equation} \mathcal{R} = \frac {H^2 / \alpha _{\mkern -2mu m}}{H / U} = (\textit{Pr}_{\!p} Ra^*)^{1/2}. \end{equation}
In the Darcy regime, the corresponding time-scale ratio reduces to the standard Darcy–Rayleigh number. Wang & Bejan (Reference Wang and Bejan1987) employed a similar approach to derive the Nusselt–Rayleigh scaling in the Forchheimer regime, obtaining $ \textit{Nu} \propto (\textit{Pr}_{\!p} Ra^*)^{1/2}$
.
$ \textit{Nu} \propto (\textit{Pr}_{\!p} Ra^*)^{1/2}$
.
Compensated plots of $Y=\textit{Nu}/(Ra^{\ast }/Ra_c^{\ast })$
versus
$Y=\textit{Nu}/(Ra^{\ast }/Ra_c^{\ast })$
versus $X=Ra^{\ast }/\textit{Pr}_{\!p}$
for the two porosities of (a) 33 % and (b) 43 %. We set
$X=Ra^{\ast }/\textit{Pr}_{\!p}$
for the two porosities of (a) 33 % and (b) 43 %. We set $Ra_c^{\ast }=40$
from the Elder threshold (linear stability;
$Ra_c^{\ast }=40$
from the Elder threshold (linear stability; $4\pi ^2 \approx 40$
) Elder (Reference Elder1967), so the Darcy asymptote (Wang & Bejan Reference Wang and Bejan1987, (13)) appears as a horizontal plateau at unity. The inertial (Forchheimer) asymptote (Wang & Bejan Reference Wang and Bejan1987, (14)) and a Rayleigh–Bénard-type scaling
$4\pi ^2 \approx 40$
) Elder (Reference Elder1967), so the Darcy asymptote (Wang & Bejan Reference Wang and Bejan1987, (13)) appears as a horizontal plateau at unity. The inertial (Forchheimer) asymptote (Wang & Bejan Reference Wang and Bejan1987, (14)) and a Rayleigh–Bénard-type scaling $\textit{Nu}\sim (Ra^{\ast })^{1/3}$
are included, corresponding to slopes
$\textit{Nu}\sim (Ra^{\ast })^{1/3}$
are included, corresponding to slopes $Y\propto (Ra^{\ast }/\textit{Pr}_{\!p})^{-1/2}$
and
$Y\propto (Ra^{\ast }/\textit{Pr}_{\!p})^{-1/2}$
and $Y\propto (Ra^{\ast }/\textit{Pr}_{\!p})^{-2/3}$
, respectively. The top bar indicates steady, harmonic and vigorous oscillatory regimes.
$Y\propto (Ra^{\ast }/\textit{Pr}_{\!p})^{-2/3}$
, respectively. The top bar indicates steady, harmonic and vigorous oscillatory regimes.

We characterise the transition to inertial porous convection across conductivity ratios by plotting the compensated quantity $Y = \textit{Nu} / (Ra^{\ast } / Ra_c^{\ast })$
against
$Y = \textit{Nu} / (Ra^{\ast } / Ra_c^{\ast })$
against $X = Ra^{\ast } / \textit{Pr}_{\!p}$
(figure 12). Here,
$X = Ra^{\ast } / \textit{Pr}_{\!p}$
(figure 12). Here, $ Ra_c^{\ast } = 40$
is adopted based on the linear stability threshold (
$ Ra_c^{\ast } = 40$
is adopted based on the linear stability threshold ( $4\pi ^2 \approx 40$
) proposed by Elder (Reference Elder1967), although this slightly underestimates the onset observed in the present domain. The plot includes theoretical reference scalings for Darcy flow (
$4\pi ^2 \approx 40$
) proposed by Elder (Reference Elder1967), although this slightly underestimates the onset observed in the present domain. The plot includes theoretical reference scalings for Darcy flow ( $ Y = 1$
), Forchheimer flow (
$ Y = 1$
), Forchheimer flow ( $ Y \propto (Ra^{\ast }/\textit{Pr}_{\!p})^{-1/2}$
) and classical RBC (
$ Y \propto (Ra^{\ast }/\textit{Pr}_{\!p})^{-1/2}$
) and classical RBC ( $ Y \propto (Ra^{\ast }/\textit{Pr}_{\!p})^{-2/3}$
), the latter motivated by the BL-controlled scaling of heat transfer in RBC (Grossmann & Lohse Reference Grossmann and Lohse2000).
$ Y \propto (Ra^{\ast }/\textit{Pr}_{\!p})^{-2/3}$
), the latter motivated by the BL-controlled scaling of heat transfer in RBC (Grossmann & Lohse Reference Grossmann and Lohse2000).
(a) Horizontally averaged temperature profiles near the hot wall for $\varphi = 33\,\%$
and
$\varphi = 33\,\%$
and $43\,\%$
, shown at comparable Reynolds numbers (
$43\,\%$
, shown at comparable Reynolds numbers ( $\langle \textit{Re} \rangle _H / \textit{Re}_{nD} \sim 1$
), marking the existence of inertial effects. Both cases represent inertial convection regimes, characterised by Forchheimer-type scaling at
$\langle \textit{Re} \rangle _H / \textit{Re}_{nD} \sim 1$
), marking the existence of inertial effects. Both cases represent inertial convection regimes, characterised by Forchheimer-type scaling at $\varphi = 33\,\%$
and transition to a Rayleigh–Bénard–like dynamics at
$\varphi = 33\,\%$
and transition to a Rayleigh–Bénard–like dynamics at $\varphi = 43\,\%$
. The corresponding dynamic confinement measures are
$\varphi = 43\,\%$
. The corresponding dynamic confinement measures are $\varLambda = 1.2$
and
$\varLambda = 1.2$
and $0.7$
, respectively. (b) Dynamic confinement
$0.7$
, respectively. (b) Dynamic confinement $\varLambda$
versus Darcy–Rayleigh number
$\varLambda$
versus Darcy–Rayleigh number $Ra^*$
, indicating a transition from Forchheimer to Rayleigh–Bénard scaling as the thermal BL reaches the pore scale; data from inertial convective cases only suggest
$Ra^*$
, indicating a transition from Forchheimer to Rayleigh–Bénard scaling as the thermal BL reaches the pore scale; data from inertial convective cases only suggest $\varLambda \approx 0.7$
, slightly above the theoretical 0.5.
$\varLambda \approx 0.7$
, slightly above the theoretical 0.5.

At low porosity ( $ \varphi = 33\,\%$
), the transition to oscillatory convection reveals a clear bifurcation (figure 12
a): for
$ \varphi = 33\,\%$
), the transition to oscillatory convection reveals a clear bifurcation (figure 12
a): for $ \lambda \gt 1$
, thermally insulating solids make heat transfer strongly dependent on the convective structure, resulting in greater sensitivity of
$ \lambda \gt 1$
, thermally insulating solids make heat transfer strongly dependent on the convective structure, resulting in greater sensitivity of $ \textit{Nu}$
to thermal reorganisation. In contrast, for
$ \textit{Nu}$
to thermal reorganisation. In contrast, for $ \lambda \lt 1$
, high solid-phase conductivity dampens this sensitivity, leading to a more gradual transition toward inertia-driven convection. This effect is captured by the variation in
$ \lambda \lt 1$
, high solid-phase conductivity dampens this sensitivity, leading to a more gradual transition toward inertia-driven convection. This effect is captured by the variation in $\textit{Pr}_{\!p}$
and is clearly visible, as the axes are normalised accordingly. For
$\textit{Pr}_{\!p}$
and is clearly visible, as the axes are normalised accordingly. For $\varphi =33\,\%$
, both inertial branches (
$\varphi =33\,\%$
, both inertial branches ( $k_r\gt 1$
and
$k_r\gt 1$
and $k_r\lt 1$
) collapse initially onto the Forchheimer-type scaling, in agreement with theoretical predictions for low-porosity media. At the largest values of
$k_r\lt 1$
) collapse initially onto the Forchheimer-type scaling, in agreement with theoretical predictions for low-porosity media. At the largest values of $Ra^*/\textit{Pr}_{\!p}$
, however, the uppermost points exhibit a slight deviation from this trend. In the case of higher porosity (
$Ra^*/\textit{Pr}_{\!p}$
, however, the uppermost points exhibit a slight deviation from this trend. In the case of higher porosity ( $\varphi = 43\,\%$
), the steady-state laminar convection regime deviates from classical Darcy scaling and exhibits a sublinear dependence on
$\varphi = 43\,\%$
), the steady-state laminar convection regime deviates from classical Darcy scaling and exhibits a sublinear dependence on $Ra^*/\textit{Pr}_{\!p}$
, consistent with the trends in figure 11(c). The transition to inertial convection is more gradual and spans a broader range of
$Ra^*/\textit{Pr}_{\!p}$
, consistent with the trends in figure 11(c). The transition to inertial convection is more gradual and spans a broader range of $ Ra^*/\textit{Pr}_{\!p}$
values compared with lower porosities. Across all conductivity ratios
$ Ra^*/\textit{Pr}_{\!p}$
values compared with lower porosities. Across all conductivity ratios $ \lambda$
, the difference in
$ \lambda$
, the difference in $\textit{Pr}_{\!p}$
diminishes primarily due to reduced variation in
$\textit{Pr}_{\!p}$
diminishes primarily due to reduced variation in $ \lambda$
at higher porosities.
$ \lambda$
at higher porosities.
Neither the inertial measure nor the BL thickness alone explains why the two cases fall onto distinct inertial branches (Forchheimer versus Rayleigh–Bénard), as shown in figure 13(a), which compares BL thicknesses ( $k_r=1$
) from two simulations at different porosities but similar pore-scale inertia,
$k_r=1$
) from two simulations at different porosities but similar pore-scale inertia, $\langle \textit{Re} \rangle _H/\textit{Re}_{nD} \sim 1$
. Under these comparable inertial conditions, the lower-porosity case follows Forchheimer scaling, whereas the higher-porosity case follows Rayleigh–Bénard scaling (figure 7). To rationalise this separation, we follow the framework of Noto et al. (Reference Noto, Letelier and Ulloa2024), who introduced the dynamic confinement ratio
$\langle \textit{Re} \rangle _H/\textit{Re}_{nD} \sim 1$
. Under these comparable inertial conditions, the lower-porosity case follows Forchheimer scaling, whereas the higher-porosity case follows Rayleigh–Bénard scaling (figure 7). To rationalise this separation, we follow the framework of Noto et al. (Reference Noto, Letelier and Ulloa2024), who introduced the dynamic confinement ratio
 \begin{align} \varLambda = \frac {\delta }{b}, \end{align}
which quantifies the competition between thermal BL thickness $\delta$
and a lateral length scale
$\delta$
and a lateral length scale $b$
. In porous media,
$b$
. In porous media, $b$
can be related to the pore space (Noto et al. Reference Noto, Letelier and Ulloa2024). Based on experiments in a HS cell, they showed that unsteady Rayleigh–Bénard–like convection emerges when
$b$
can be related to the pore space (Noto et al. Reference Noto, Letelier and Ulloa2024). Based on experiments in a HS cell, they showed that unsteady Rayleigh–Bénard–like convection emerges when $\varLambda \lesssim 1/2$
, with
$\varLambda \lesssim 1/2$
, with $\delta = H/(2\textit{Nu})$
and
$\delta = H/(2\textit{Nu})$
and $\textit{Nu} = c\,\textit{Pr}^{\alpha } Ra^{\beta }$
, where
$\textit{Nu} = c\,\textit{Pr}^{\alpha } Ra^{\beta }$
, where $c=0.14$
,
$c=0.14$
, $\alpha =-0.03$
and
$\alpha =-0.03$
and $\beta =0.297$
(see figure 5 in Noto et al. Reference Noto, Letelier and Ulloa2024).
$\beta =0.297$
(see figure 5 in Noto et al. Reference Noto, Letelier and Ulloa2024).
Figure 13(b) shows $\varLambda$
as a function of
$\varLambda$
as a function of $Ra^*$
in the oscillatory regime for
$Ra^*$
in the oscillatory regime for $\varphi =33\,\%$
and
$\varphi =33\,\%$
and $43\,\%$
, spanning all conductivity ratios. For
$43\,\%$
, spanning all conductivity ratios. For $\varLambda \lesssim 0.7$
, the sensitivity of
$\varLambda \lesssim 0.7$
, the sensitivity of $\varLambda$
to
$\varLambda$
to $Ra^*$
decreases; above this, most points correspond to
$Ra^*$
decreases; above this, most points correspond to $\varphi =33\,\%$
and align with Forchheimer scaling. Below
$\varphi =33\,\%$
and align with Forchheimer scaling. Below $\varLambda = 1/2$
, all cases – including those with
$\varLambda = 1/2$
, all cases – including those with $\varphi = 33\,\%$
– follow Rayleigh–Bénard-type scaling. This supports the interpretation that the deviations from Forchheimer behaviour at high
$\varphi = 33\,\%$
– follow Rayleigh–Bénard-type scaling. This supports the interpretation that the deviations from Forchheimer behaviour at high $Ra^*/\textit{Pr}_{\!p}$
in the low-porosity cases mark a transition to RB convection, supported by the observed structural changes (figure 17). We interpret the range
$Ra^*/\textit{Pr}_{\!p}$
in the low-porosity cases mark a transition to RB convection, supported by the observed structural changes (figure 17). We interpret the range $\varLambda \approx 0.5$
–1 as a porous-to-free-fluid transition regime, where the thermal BL thickness
$\varLambda \approx 0.5$
–1 as a porous-to-free-fluid transition regime, where the thermal BL thickness $\delta$
becomes comparable to the pore scale. In our configuration,
$\delta$
becomes comparable to the pore scale. In our configuration, $b$
is defined with reference to the half-cylinder at the porous BL and approximated as
$b$
is defined with reference to the half-cylinder at the porous BL and approximated as $r+\ell _t \sim L$
, equivalent to the size of the pore body. Within the BL, transport is diffusion dominated; once destabilised, thermal plumes of width
$r+\ell _t \sim L$
, equivalent to the size of the pore body. Within the BL, transport is diffusion dominated; once destabilised, thermal plumes of width $\delta$
emerge at the pore neck. For
$\delta$
emerge at the pore neck. For $\delta \gg b$
(
$\delta \gg b$
( $\varLambda \gg 1$
), interaction with the solid matrix maintains confinement and Forchheimer behaviour. As
$\varLambda \gg 1$
), interaction with the solid matrix maintains confinement and Forchheimer behaviour. As $\delta$
approaches
$\delta$
approaches $b$
(
$b$
( $\varLambda \sim 1$
), confinement weakens and the flow increasingly resembles that of a pure fluid.
$\varLambda \sim 1$
), confinement weakens and the flow increasingly resembles that of a pure fluid.
To examine whether our confinement-based interpretation extends beyond our configuration, we compare our results with experimental data from three-dimensional packed-bed domains of varying aspect ratios by plotting the $Ra^*$
–
$Ra^*$
– $\textit{Nu}$
relation corrected with the porous-medium Prandtl number (figure 14). The data are colour coded by
$\textit{Nu}$
relation corrected with the porous-medium Prandtl number (figure 14). The data are colour coded by $\varLambda$
, estimated from reported parameters using
$\varLambda$
, estimated from reported parameters using $\delta = H/(2\textit{Nu})$
and
$\delta = H/(2\textit{Nu})$
and $b \approx d$
, where
$b \approx d$
, where $d$
denotes the bead diameter. Across the combined dataset, points collapse onto a common envelope bounded by the asymptotic Darcy and Forchheimer scalings. Individual branches depart from the Darcy prediction earlier than expected and subsequently enter Forchheimer- or Rayleigh–Bénard-type behaviour, consistent with our results and the data of Schneider (Reference Schneider1963), Elder (Reference Elder1967), Buretta & Berman (Reference Buretta and Berman1976), Kladias & Prasad (Reference Kladias and Prasad1991) and Keene & Goldstein (Reference Keene and Goldstein2015), where small
$d$
denotes the bead diameter. Across the combined dataset, points collapse onto a common envelope bounded by the asymptotic Darcy and Forchheimer scalings. Individual branches depart from the Darcy prediction earlier than expected and subsequently enter Forchheimer- or Rayleigh–Bénard-type behaviour, consistent with our results and the data of Schneider (Reference Schneider1963), Elder (Reference Elder1967), Buretta & Berman (Reference Buretta and Berman1976), Kladias & Prasad (Reference Kladias and Prasad1991) and Keene & Goldstein (Reference Keene and Goldstein2015), where small $H/d$
values promoted inertial effects. All cases branching off from Darcy scaling at
$H/d$
values promoted inertial effects. All cases branching off from Darcy scaling at $Ra^*/\textit{Pr}_{\!p} \lt 1$
exhibit
$Ra^*/\textit{Pr}_{\!p} \lt 1$
exhibit $\varLambda \lt 10$
while still nominally in the Darcy regime, whereas datasets with
$\varLambda \lt 10$
while still nominally in the Darcy regime, whereas datasets with $\varLambda \lt 0.5$
predominantly display Rayleigh–Bénard-type scaling. In our configuration,
$\varLambda \lt 0.5$
predominantly display Rayleigh–Bénard-type scaling. In our configuration, $\varLambda$
similarly approaches order unity before inertia dominates, explaining the deviations from the
$\varLambda$
similarly approaches order unity before inertia dominates, explaining the deviations from the $Ra^*/\textit{Pr}_{\!p} \sim 1$
criterion seen in figure 12. Consistent with this, Bavandla & Srinivasan (Reference Bavandla and Srinivasan2025) showed that when
$Ra^*/\textit{Pr}_{\!p} \sim 1$
criterion seen in figure 12. Consistent with this, Bavandla & Srinivasan (Reference Bavandla and Srinivasan2025) showed that when $\varLambda \gg 1$
at the onset of inertia, the
$\varLambda \gg 1$
at the onset of inertia, the $Ra^*/\textit{Pr}_{\!p}$
framework remains valid and the theoretical envelope holds as long as confinement persists.
$Ra^*/\textit{Pr}_{\!p}$
framework remains valid and the theoretical envelope holds as long as confinement persists.
Compilation of historic HRL experiments normalised by the porous Prandtl number $\textit{Pr}_{\!p}$
. Dataset specifications are given in Appendix C.6. Marker colour denotes dynamic confinement
$\textit{Pr}_{\!p}$
. Dataset specifications are given in Appendix C.6. Marker colour denotes dynamic confinement $\varLambda$
, with green markers indicating results from this study (
$\varLambda$
, with green markers indicating results from this study ( $\varphi =33\,\%$
). Theoretical Darcy and Forchheimer scalings are shown for reference, together with the Rayleigh–Bénard scaling that marks the regime where the porous matrix influence vanishes. Here,
$\varphi =33\,\%$
). Theoretical Darcy and Forchheimer scalings are shown for reference, together with the Rayleigh–Bénard scaling that marks the regime where the porous matrix influence vanishes. Here, $\varLambda$
reflects the onset of pore-scale control, estimated for the literature as
$\varLambda$
reflects the onset of pore-scale control, estimated for the literature as $\varLambda = H/d \,(2\textit{Nu})^{-1}$
and measured directly for the present data.
$\varLambda = H/d \,(2\textit{Nu})^{-1}$
and measured directly for the present data.

5. Summary
This study investigates the transition from laminar to inertial natural convection (HRLC) in porous media, focusing on the combined effects of porosity and solid-to-fluid thermal conductivity ratios. Using a lattice Boltzmann approach that accurately recovers the Navier–Stokes–Fourier dynamics, we analyse a porous model represented by a staggered array of two-dimensional cylinders with half-cylinders at the walls, forming a Darcy continuum at the domain scale (figure 1
a). Key parameters, including permeability $K$
, effective conductivities
$K$
, effective conductivities $k_{\mkern -2mu m}$
and the porous form drag coefficient
$k_{\mkern -2mu m}$
and the porous form drag coefficient $c_{\mkern -2mu F}$
, are directly simulated for the porous domains used.
$c_{\mkern -2mu F}$
, are directly simulated for the porous domains used.
To robustly characterise inertia-driven HRLC, we first distinguish the two asymptotic hydrodynamic regimes: laminar Darcy flow and unsteady vortex shedding. Between these limits lies a transitional regime – steady under one-dimensional forcing yet already influenced by inertia – which we define as the Forchheimer regime, characterised by fits to the non-dimensional Forchheimer equation (2.17). To quantify the onset of inertial effects, we introduce the non-Darcy Reynolds number $ \textit{Re}_{nD}$
, defined as the point where the non-dimensional pressure gradient deviates by 1 % from the Darcy prediction, marking the transition to an initial inertial regime (Forchheimer). The transition to unsteady, vortex-dominated flow is marked by a critical Reynolds number
$ \textit{Re}_{nD}$
, defined as the point where the non-dimensional pressure gradient deviates by 1 % from the Darcy prediction, marking the transition to an initial inertial regime (Forchheimer). The transition to unsteady, vortex-dominated flow is marked by a critical Reynolds number $ \textit{Re}_{\mkern -2mu c}$
, defined as the first case showing time dependence, and corresponding to a Hopf bifurcation (Agnaou et al. Reference Agnaou, Lasseux and Ahmadi2016). Both
$ \textit{Re}_{\mkern -2mu c}$
, defined as the first case showing time dependence, and corresponding to a Hopf bifurcation (Agnaou et al. Reference Agnaou, Lasseux and Ahmadi2016). Both $ \textit{Re}_{\mkern -2mu nD}$
and
$ \textit{Re}_{\mkern -2mu nD}$
and $ \textit{Re}_{\mkern -2mu c}$
vary with porosity, leading to a broader Forchheimer regime at lower porosities (figure 6). This trend aligns with Khalifa et al. (Reference Khalifa, Pocher and Tilton2020) for
$ \textit{Re}_{\mkern -2mu c}$
vary with porosity, leading to a broader Forchheimer regime at lower porosities (figure 6). This trend aligns with Khalifa et al. (Reference Khalifa, Pocher and Tilton2020) for $ \varphi \gt 40\,\%$
, and is governed by two effects: macroscopic confinement imposed by the porous geometry, and the intra-porous throat-to-chamber ratio, captured by the porous drag coefficient
$ \varphi \gt 40\,\%$
, and is governed by two effects: macroscopic confinement imposed by the porous geometry, and the intra-porous throat-to-chamber ratio, captured by the porous drag coefficient $ c_F$
.
$ c_F$
.
Within the HRLC framework, the transition from steady, conveyor belt-like convection to oscillatory convection begins when the majority of unit pore-scale subdomains exceed the defined non-Darcy threshold $ \langle \textit{Re} \rangle _h \gt \textit{Re}_{\mkern -2mu nD}$
(figures 5
a and 5
b). This is accompanied by a reorganisation of the thermal structure, reflected in the broadening of the local Reynolds-number distribution and increased flow heterogeneity, even before the global Reynolds number reaches the critical value
$ \langle \textit{Re} \rangle _h \gt \textit{Re}_{\mkern -2mu nD}$
(figures 5
a and 5
b). This is accompanied by a reorganisation of the thermal structure, reflected in the broadening of the local Reynolds-number distribution and increased flow heterogeneity, even before the global Reynolds number reaches the critical value $ \textit{Re}_{\mkern -2mu c}$
. This reorganisation coincides with a stagnation in the Nusselt number. Beyond this point, we observe two distinct trends emerge depending on porosity: the low-porosity case
$ \textit{Re}_{\mkern -2mu c}$
. This reorganisation coincides with a stagnation in the Nusselt number. Beyond this point, we observe two distinct trends emerge depending on porosity: the low-porosity case $\varphi = 33 \,\%$
tends to follow Forchheimer scaling, while the high-porosity cases transition toward RB convection (figure 7). To delineate this observation, we adopt the plume-scale confinement parameter
$\varphi = 33 \,\%$
tends to follow Forchheimer scaling, while the high-porosity cases transition toward RB convection (figure 7). To delineate this observation, we adopt the plume-scale confinement parameter $ \varLambda$
introduced by Noto et al. (Reference Noto, Letelier and Ulloa2024). Our data suggest that, for
$ \varLambda$
introduced by Noto et al. (Reference Noto, Letelier and Ulloa2024). Our data suggest that, for $ \varLambda \gt 1$
, the flow remains confined by the porous matrix and follows a Forchheimer-type dynamics, whereas for
$ \varLambda \gt 1$
, the flow remains confined by the porous matrix and follows a Forchheimer-type dynamics, whereas for $ \varLambda \lt 1/2$
, the confinement breaks down and RB-type behaviour emerges. We further show that the porous-convection criterion
$ \varLambda \lt 1/2$
, the confinement breaks down and RB-type behaviour emerges. We further show that the porous-convection criterion $ Ra^*/\textit{Pr}_{\!p} \approx 1$
holds only as long as
$ Ra^*/\textit{Pr}_{\!p} \approx 1$
holds only as long as $ \varLambda \gt 10$
at the transition to inertial convection (figure 14); all cases with
$ \varLambda \gt 10$
at the transition to inertial convection (figure 14); all cases with $ \varLambda \lesssim 10$
deviate from this prediction and transition earlier, at
$ \varLambda \lesssim 10$
deviate from this prediction and transition earlier, at $ Ra^*/\textit{Pr}_{\!p} \lt 1$
. This includes both the present simulations and prior experiments by Schneider (Reference Schneider1963), Elder (Reference Elder1967) and Kladias & Prasad (Reference Kladias and Prasad1991). Finally, we observe that cases with
$ Ra^*/\textit{Pr}_{\!p} \lt 1$
. This includes both the present simulations and prior experiments by Schneider (Reference Schneider1963), Elder (Reference Elder1967) and Kladias & Prasad (Reference Kladias and Prasad1991). Finally, we observe that cases with $ \varLambda \lt 0.5$
consistently follow Rayleigh–Bénard scaling, while those with
$ \varLambda \lt 0.5$
consistently follow Rayleigh–Bénard scaling, while those with $ \varLambda \gt 1$
remain on the Forchheimer branch (figure 14).
$ \varLambda \gt 1$
remain on the Forchheimer branch (figure 14).
For porosities of 33 % and 39 %, the steady-state simulations scale with the Elder relation $ \textit{Nu} \propto Ra^*$
(Elder Reference Elder1967) across all
$ \textit{Nu} \propto Ra^*$
(Elder Reference Elder1967) across all $ \lambda$
. However, as the porosity increases to 43 %, the classic
$ \lambda$
. However, as the porosity increases to 43 %, the classic $ \textit{Nu} \propto Ra^*$
scaling breaks down across conductivity ratios. Higher relative solid conductivity leads to shallower
$ \textit{Nu} \propto Ra^*$
scaling breaks down across conductivity ratios. Higher relative solid conductivity leads to shallower $ \textit{Nu}$
–
$ \textit{Nu}$
– $ Ra^*$
scalings, indicating that the characteristic velocity derived from a balance between buoyancy and Darcy drag no longer captures all relevant diffusive effects. This behaviour is consistent with observations at the onset of convection in porous domains with porosity around 50 %, as reported by Karani & Huber (Reference Karani and Huber2017).
$ Ra^*$
scalings, indicating that the characteristic velocity derived from a balance between buoyancy and Darcy drag no longer captures all relevant diffusive effects. This behaviour is consistent with observations at the onset of convection in porous domains with porosity around 50 %, as reported by Karani & Huber (Reference Karani and Huber2017).
Unlike studies that impose purely fluid BLs (Karani & Huber Reference Karani and Huber2017; Liu et al. Reference Liu, Jiang, Chong, Zhu, Wan, Verzicco, Stevens, Lohse and Sun2020; Korba & Li Reference Korba and Li2022; Li et al. Reference Li, Yang and Sun2025), our simulations incorporate the solid phase into the BL. In low-porosity systems ( $\varphi \lt 50\,\%$
), this recovers the expected scaling
$\varphi \lt 50\,\%$
), this recovers the expected scaling $\textit{Nu} \propto 1/\delta _T$
. By contrast, fluid-only BL studies (Korba & Li Reference Korba and Li2022) show an apparent
$\textit{Nu} \propto 1/\delta _T$
. By contrast, fluid-only BL studies (Korba & Li Reference Korba and Li2022) show an apparent $k_r$
–
$k_r$
– $\delta _T$
inversion caused by isotherm compression (
$\delta _T$
inversion caused by isotherm compression ( $k_s/k_{\!f}\gt 1$
) or expansion (
$k_s/k_{\!f}\gt 1$
) or expansion ( $k_s/k_{\!f}\lt 1$
) within the fluid. The artefact becomes evident when
$k_s/k_{\!f}\lt 1$
) within the fluid. The artefact becomes evident when $\textit{Nu}$
is taken directly from the wall flux without correcting for the effective conduction baseline, yielding an inverse
$\textit{Nu}$
is taken directly from the wall flux without correcting for the effective conduction baseline, yielding an inverse $\textit{Nu}$
–
$\textit{Nu}$
– $k_r$
trend and even unphysical values
$k_r$
trend and even unphysical values $\textit{Nu}\lt 1$
(table 1). Incorporating the solid phase into the boundary treatment removes this artefact from porous media DNS and restores the expected
$\textit{Nu}\lt 1$
(table 1). Incorporating the solid phase into the boundary treatment removes this artefact from porous media DNS and restores the expected $\textit{Nu} \propto 1/\delta _T$
behaviour observed in our simulations (figures 9 and 10
c,d).
$\textit{Nu} \propto 1/\delta _T$
behaviour observed in our simulations (figures 9 and 10
c,d).
Acknowledgements
The Werner Siemens Foundation (Werner Siemens-Stiftung) is gratefully acknowledged for its support of the Geothermal Energy and Geofluids (GEG.ethz.ch) Group at ETH Zurich. The chair of the GEG Group, Professor Dr Martin O. Saar, is gratefully acknowledged for the invaluable support provided during the PhD project of Dario M. Schwendener. The authors gratefully acknowledge K. C. Bavandla and V. Srinivasan for providing their Nusselt–Rayleigh data, which supported the comparison with earlier experimental studies. The authors used OpenAI’s ChatGPT (model GPT-4o, accessed via chat.openai.com) during January–September 2025 to refine the text and to assist in formatting tables and lists. No content was generated without author oversight, and all scientific content, interpretations, and conclusions were developed by the authors.
Funding
This work was supported by ETH Grant ETH-C-03 22-1. X.-Z. Kong also acknowledges support from the Swiss National Science Foundation (SNSF) under Grant CRSK-2 196759. C. Coreixas acknowledges financial support from the BNBU Research Grant No. UICR0700094-24 entitled “GPU-accelerated multidisciplinary methods for industrial computational fluid dynamics”.
Declaration of interests
The authors report no conflict of interest.
Data availability statement
The data and additional information about the benchmark and performance are available on (https://github.com/GEG-ETHZ/JFM_Schwendener_et_al_2025).
Appendix A. List of symbols
Comprehensive list of symbols used in this study, including physical quantities, dimensionless numbers, LBM variables and mathematical notation. Dimensions are given in the L (length), M (mass), T (time), K (temperature) framework.

Appendix B. Detailed Lattice Boltzmann formulation and implementation
B.1. Lattice Boltzmann method for mass and momentum conservations
The LBM discretises the DVBE (2.8) through two consecutive steps (Dellar Reference Dellar2013). First, the local collision term is integrated using the second-order accurate trapezium rule, while the non-local advection term is discretised using the exact method of characteristics. To obtain an explicit time-marching numerical scheme, an additional change of variables is applied (He et al. Reference He, Chen and Doolen1998). This results in the following collide-and-stream scheme, which is second-order accurate in both space and time
 \begin{equation} f_k(\boldsymbol{r} + \boldsymbol{c}_k\Delta t, t + \Delta t) = \tilde {f}_k(\boldsymbol{r}, t) + \boldsymbol{F}_k(\boldsymbol{r}, t). \end{equation}
Here, $\tilde {f}_k(\boldsymbol{r}, t)$
represents the post-collision distributions,
$\tilde {f}_k(\boldsymbol{r}, t)$
represents the post-collision distributions, $\boldsymbol{F}_k(\boldsymbol{r}, t)$
stands for an external force term related to such as buoyancy. The three-dimensional velocity space is discretized using the D3Q19 lattice, which consists of 19 discrete velocity vectors
$\boldsymbol{F}_k(\boldsymbol{r}, t)$
stands for an external force term related to such as buoyancy. The three-dimensional velocity space is discretized using the D3Q19 lattice, which consists of 19 discrete velocity vectors

Thus, 19 equations of type (B1) are solved per grid node at each time step.
The simplest and most widely used approximation for the collision term is the BGK model (Bhatnagar et al. Reference Bhatnagar, Gross and Krook1954; Qian et al. Reference Qian, D’Humières and Lallemand1992). This model assumes that the collision process relaxes the distribution function towards an equilibrium state $f_k^{{eq}}$
with a single relaxation time
$f_k^{{eq}}$
with a single relaxation time $\tau$
. The corresponding post-collision distribution
$\tau$
. The corresponding post-collision distribution $\tilde {f}_k$
is given by
$\tilde {f}_k$
is given by
 \begin{equation} \tilde {f}_k(\boldsymbol{r}, t) = f_k(\boldsymbol{r}, t) - \frac {\Delta t}{\tau } \big ( f_k(\boldsymbol{r}, t) - f_k^{{eq}}(\boldsymbol{r}, t) \big ), \end{equation}
with the relaxation time $\tau$
being related to the kinematic viscosity
$\tau$
being related to the kinematic viscosity $\nu$
of the fluid through the relationship
$\nu$
of the fluid through the relationship
 \begin{equation} \nu = c_{\mkern -2mu s}^2\! \left ( \tau - \frac {1}{2} \right ) \Delta t. \end{equation}
The equilibrium distribution function $f_k^{{eq}}$
is typically a polynomial approximation of the Maxwell–Boltzmann distribution, which depends on the local macroscopic fluid density
$f_k^{{eq}}$
is typically a polynomial approximation of the Maxwell–Boltzmann distribution, which depends on the local macroscopic fluid density $\rho$
and velocity
$\rho$
and velocity $\boldsymbol{u}$
 \begin{equation} f_k^{{eq}}(\boldsymbol{r}, t) = \omega _k \rho\! \left ( 1 + \frac {\boldsymbol{c}_k \boldsymbol{\cdot }\boldsymbol{u}}{c_{\mkern -2mu s}^2} + \frac {(\boldsymbol{c}_k \boldsymbol{\cdot }\boldsymbol{u})^2}{2c_{\mkern -2mu s}^4} - \frac {\boldsymbol{u} \boldsymbol{\cdot }\boldsymbol{u}}{2c_{\mkern -2mu s}^2} \right )\!. \end{equation}
This equilibrium distribution is closely related to lattice parameters, such as quadrature weights $\omega _k$
and lattice constant
$\omega _k$
and lattice constant $c_{\mkern -2mu s}$
, in order to ensure the recovery of the Navier–Stokes equations in the continuum and weakly compressible limit (Shan, Yuan & Chen Reference Shan, Yuan and Chen2006; Krüger et al. Reference Krüger, Kusumaatmaja, Kuzmin, Shardt, Silva and Viggen2017). The weights
$c_{\mkern -2mu s}$
, in order to ensure the recovery of the Navier–Stokes equations in the continuum and weakly compressible limit (Shan, Yuan & Chen Reference Shan, Yuan and Chen2006; Krüger et al. Reference Krüger, Kusumaatmaja, Kuzmin, Shardt, Silva and Viggen2017). The weights $\omega _k$
for the D3Q19 lattice are
$\omega _k$
for the D3Q19 lattice are
 \begin{equation} \omega _k = \begin{cases} 1/3 & \text{for } k = 0 ,\\ 1/18 & \text{for } k = 1, \ldots , 6 ,\\ 1/36 & \text{for } k = 7, \ldots , 18, \end{cases} \end{equation}
while the lattice constant $c_{\mkern -2mu s}$
, representing the speed of sound in lattice units, is fixed at
$c_{\mkern -2mu s}$
, representing the speed of sound in lattice units, is fixed at $c_{\mkern -2mu s} = 1/\sqrt {3}$
. With these values, the moments of the equilibrium distribution function exactly match those of the Maxwell–Boltzmann distribution up to the second order, hence guaranteeing the correct hydrodynamic behaviour of the simulated fluid in the low-speed regime.
$c_{\mkern -2mu s} = 1/\sqrt {3}$
. With these values, the moments of the equilibrium distribution function exactly match those of the Maxwell–Boltzmann distribution up to the second order, hence guaranteeing the correct hydrodynamic behaviour of the simulated fluid in the low-speed regime.
The buoyancy force, $\boldsymbol{F}_g = \rho \beta _{\mkern -2mu f} (T - T_0) \boldsymbol{g}$
, is introduced into the model as (Peng et al. Reference Peng, Shu and Chew2003)
$\boldsymbol{F}_g = \rho \beta _{\mkern -2mu f} (T - T_0) \boldsymbol{g}$
, is introduced into the model as (Peng et al. Reference Peng, Shu and Chew2003)
 \begin{equation} \boldsymbol{F}_k = \frac {\boldsymbol{F}_g \boldsymbol{\cdot }\boldsymbol{c}_k}{c_{\mkern -2mu s}^2} \Delta t. \end{equation}
Here, $T_0$
is the reference temperature. Assuming an ideal gas, the thermal expansion coefficient at constant pressure
$T_0$
is the reference temperature. Assuming an ideal gas, the thermal expansion coefficient at constant pressure $P$
is
$P$
is
 \begin{equation} \beta _{\mkern -2mu f} = -\frac {1}{\rho } \left ( \frac {\partial \rho }{\partial T} \right )_{\!P} = \frac {1}{T}. \end{equation}
To compute $\boldsymbol{F}_g$
, the thermal expansion coefficient is evaluated at the reference temperature
$\boldsymbol{F}_g$
, the thermal expansion coefficient is evaluated at the reference temperature $T_0 = 1$
, yielding
$T_0 = 1$
, yielding $\beta _{\mkern -2mu f} = 1$
in lattice units. Additionally, macroscopic quantities, including pressure
$\beta _{\mkern -2mu f} = 1$
in lattice units. Additionally, macroscopic quantities, including pressure $P = c_{\mkern -2mu s}^2 \rho$
and momentum
$P = c_{\mkern -2mu s}^2 \rho$
and momentum $\rho \boldsymbol{u}$
, are directly related to the zeroth and first moments of the distribution functions and are conserved during the collision step
$\rho \boldsymbol{u}$
, are directly related to the zeroth and first moments of the distribution functions and are conserved during the collision step
 \begin{equation} \left \{\begin{array}{ll} \rho = \sum _{k=0}^{18} f_k, \\[8pt] \rho \boldsymbol{u} = \sum _{k=0}^{18} f_k \boldsymbol{c}_k .\end{array}\right . \end{equation}
Eventually, no-slip boundary conditions are enforced thanks to the bounce-back scheme (Krüger et al. Reference Krüger, Kusumaatmaja, Kuzmin, Shardt, Silva and Viggen2017). This simple condition is implemented during the streaming step and reads as follows:
 \begin{equation} f_{k}(\boldsymbol{r}, t + \Delta t) = \begin{cases} f_{-k}(\boldsymbol{r}, t) & \text{if } \boldsymbol{r} \text{ is a solid boundary node}, \\ f_{k}(\boldsymbol{r} - \boldsymbol{c}_{k} \Delta t, t) & \text{otherwise}, \end{cases} \end{equation}
where $f_{-k}$
represents the distribution function in the opposite direction of
$f_{-k}$
represents the distribution function in the opposite direction of $f_k$
. This approach ensures that the velocity at the boundary node is zero, effectively enforcing the no-slip condition without adding complexity to the numerical method.
$f_k$
. This approach ensures that the velocity at the boundary node is zero, effectively enforcing the no-slip condition without adding complexity to the numerical method.
B.2. Improving hydrodynamics in porous media
The BGK model, despite its simplicity, can face stability and accuracy challenges in under-resolved conditions. Over the past three decades, numerous alternatives have been proposed to address these issues (Coreixas et al. Reference Coreixas, Chopard and Latt2019, Reference Coreixas, Wissocq, Chopard and Latt2020). For hydrodynamic simulations in porous media, the TRT collision operator is often preferred (Ginzburg et al. Reference Ginzburg, Verhaeghe and d’Humieres2008). The TRT model effectively minimises numerical errors associated with no-slip boundary conditions, such as those arising from the bounce-back scheme, while the first relaxation time sets the desired viscosity. These errors are particularly prominent at low Reynolds numbers (below 10–100) and in under-resolved conditions, making TRT well suited for DNS-level hydrodynamic simulations in porous media (Ginzburg Reference Ginzburg2007; Krüger et al. Reference Krüger, Kusumaatmaja, Kuzmin, Shardt, Silva and Viggen2017). The TRT collision model builds upon the BGK model by incorporating two relaxation times, $\tau _+$
and
$\tau _+$
and $\tau _-$
, which control the symmetric and anti-symmetric parts of the distribution function, respectively. The post-collision distribution
$\tau _-$
, which control the symmetric and anti-symmetric parts of the distribution function, respectively. The post-collision distribution $\tilde {f}_k$
for the TRT model is given by
$\tilde {f}_k$
for the TRT model is given by
 \begin{equation} \tilde {f}_k(\boldsymbol{r}, t) = f_k(\boldsymbol{r}, t) - \frac {\Delta t}{\tau _+} \big ( f_k^+(\boldsymbol{r}, t) - f_k^{{eq}+}(\boldsymbol{r}, t) \big ) - \frac {\Delta t}{\tau _-} \big ( f_k^-(\boldsymbol{r}, t) - f_k^{{eq}-}(\boldsymbol{r}, t) \big ), \end{equation}
where $f_k^+$
and
$f_k^+$
and $f_k^-$
are the symmetric and anti-symmetric components of the distribution function, defined as
$f_k^-$
are the symmetric and anti-symmetric components of the distribution function, defined as
 \begin{equation} f_k^+ = \frac {f_k + f_{-k}}{2}, \quad \text{and} \quad f_k^- = \frac {f_k - f_{-k}}{2}, \end{equation}
with $-k$
indicating the opposite direction such that
$-k$
indicating the opposite direction such that $\boldsymbol{c}_k + \boldsymbol{c}_{-k} = \boldsymbol{0}$
. Similar formulas apply to the equilibrium distributions
$\boldsymbol{c}_k + \boldsymbol{c}_{-k} = \boldsymbol{0}$
. Similar formulas apply to the equilibrium distributions
 \begin{equation} f_k^{{eq}+} = \frac {f_k^{{eq}} + f_{-k}^{{eq}}}{2}, \quad \text{and} \quad f_k^{{eq}-} = \frac {f_k^{{eq}} - f_{-k}^{{eq}}}{2}. \end{equation}
The relaxation times $\tau _+$
and
$\tau _+$
and $\tau _-$
independently adjust the kinematic viscosity
$\tau _-$
independently adjust the kinematic viscosity $\nu$
and a parameter
$\nu$
and a parameter $\varLambda$
that controls the model’s stability and accuracy (Ginzburg et al. Reference Ginzburg, Verhaeghe and d’Humieres2008)
$\varLambda$
that controls the model’s stability and accuracy (Ginzburg et al. Reference Ginzburg, Verhaeghe and d’Humieres2008)
 \begin{equation} \nu = c_{\mkern -2mu s}^2\! \left ( \tau _+ - \frac {1}{2} \right ) \Delta t, \quad \text{and} \quad \varLambda _{\textit{TRT}} = \left ( \tau _+ - \frac {1}{2} \right ) \left ( \tau _- - \frac {1}{2} \right ) \Delta t^2. \end{equation}
Following (Talon et al. Reference Talon, Bauer, Gland, Youssef, Auradou and Ginzburg2012), we set $\varLambda _{\textit{TRT}} = 3/16$
so that optimal accuracy can be achieved for Stokes flow simulations in porous media.
$\varLambda _{\textit{TRT}} = 3/16$
so that optimal accuracy can be achieved for Stokes flow simulations in porous media.
B.3. Energy conservation and conjugated heat transfer
An additional LBM-BGK is employed to recover the energy equations corresponding to our conjugated heat transfer problem. This second set of distribution functions $ g_k$
also follows a collide-and-stream evolution
$ g_k$
also follows a collide-and-stream evolution
 \begin{equation} g_k(\boldsymbol{r} + \boldsymbol{c}_k \Delta t, t + \Delta t) = \tilde {g}_k(\boldsymbol{r}, t) + R_k(\boldsymbol{r}, t) , \end{equation}
where $ R_k(\boldsymbol{r}, t)$
is a discrete heat source term, expressed as
$ R_k(\boldsymbol{r}, t)$
is a discrete heat source term, expressed as
 \begin{equation} R_k = \left ( 1 - \frac {1}{2 \tau }\right ) \frac {\omega _k c_p T \boldsymbol{F_g} \boldsymbol{\cdot }\boldsymbol{c}_k}{c_{\mkern -2mu s}^2} \Delta t. \end{equation}
The corresponding post-collision distributions are computed as
 \begin{equation} \tilde {g}_k(\boldsymbol{r}, t) = g_k(\boldsymbol{r}, t) - \frac {\Delta t}{\tau } \big [ g_k(\boldsymbol{r}, t) - g_k^{eq}(\boldsymbol{r}, t) \big ], \end{equation}
where the equilibrium distribution function $ g_k^{eq}$
is defined as (Yue et al. Reference Yue, Chai, Wang and Shi2021)
$ g_k^{eq}$
is defined as (Yue et al. Reference Yue, Chai, Wang and Shi2021)
 \begin{equation} g_k^{eq} = \omega _k\! \left \{ \rho c_p T\! \left ( 1 + \frac {\boldsymbol{c}_k \boldsymbol{\cdot }\boldsymbol{u}}{c_{\mkern -2mu s}^2} \right ) + \frac {[(A - \rho c_p) T c_{\mkern -2mu s}^2 \mathbb{I} + \rho c_p T \boldsymbol{u} \boldsymbol{u} ]: (\boldsymbol{c}_k \boldsymbol{c}_k - c_{\mkern -2mu s}^2 \mathbb{I})}{2 c_{\mkern -2mu s}^4} \right \}\!. \end{equation}
The variable $ A$
is an adjustable parameter introduced to enhance numerical stability. It shares the same units as
$ A$
is an adjustable parameter introduced to enhance numerical stability. It shares the same units as $ \rho c_p$
and is further used to establish a direct relationship between the relaxation time and thermal conductivity in each phase (solid (
$ \rho c_p$
and is further used to establish a direct relationship between the relaxation time and thermal conductivity in each phase (solid ( $s$
) and fluid (
$s$
) and fluid ( $f$
))
$f$
))
 \begin{equation} \kappa _{f,s} = A c_{\mkern -2mu s}^2\! \left ( \tau _{f,s} - \frac {1}{2} \right ) \Delta t. \end{equation}
For simplicity, we set $ A = (\rho c_p)_{\mkern -2mu f}$
in this study.
$ A = (\rho c_p)_{\mkern -2mu f}$
in this study.
To recover the temperature field, the macroscopic energy relations are linked to the zeroth moment of the distribution functions
 \begin{equation} \rho c_p T = \sum _{k=0}^{18} g_k. \end{equation}
In conjugated heat transfer simulations, the computational domain $ \mathcal{M}$
consists of both fluid (f) and solid (s) phases, each characterised by distinct thermo-physical properties, such as thermal conductivity
$ \mathcal{M}$
consists of both fluid (f) and solid (s) phases, each characterised by distinct thermo-physical properties, such as thermal conductivity $ k_{f,s}$
, density
$ k_{f,s}$
, density $ \rho _{f,s}$
, specific heat capacity
$ \rho _{f,s}$
, specific heat capacity $ c_{p,f,s}$
and relaxation times
$ c_{p,f,s}$
and relaxation times $ \tau _{f,s}$
.The energy LBM recovers the transient conjugate heat transfer equation of Yue et al. (Reference Yue, Chai, Wang and Shi2021, (7)). Equations (2.6)–(2.7) apply if
$ \tau _{f,s}$
.The energy LBM recovers the transient conjugate heat transfer equation of Yue et al. (Reference Yue, Chai, Wang and Shi2021, (7)). Equations (2.6)–(2.7) apply if $(\rho c_p)$
and
$(\rho c_p)$
and $k$
are constant within each phase and in time,
$k$
are constant within each phase and in time, $\boldsymbol{u}=\boldsymbol{0}$
in the solid, and interface conditions enforce continuity of temperature and normal conductive heat flux.
$\boldsymbol{u}=\boldsymbol{0}$
in the solid, and interface conditions enforce continuity of temperature and normal conductive heat flux.
B.4. Boundary conditions
The boundary conditions, as detailed in § 2.1, are imposed through link-wise boundary treatments, hence eliminating the need for any additional modification of the model (Yue et al. Reference Yue, Chai, Wang and Shi2021). Notably, adiabatic boundaries are enforced using the standard bounce-back scheme (Krüger et al. Reference Krüger, Kusumaatmaja, Kuzmin, Shardt, Silva and Viggen2017), which reflects the distribution functions to ensure no heat flux across the boundary. Dirichlet conditions for prescribed hot and cold temperatures are implemented via the anti-bounce-back scheme (Zhang et al. Reference Zhang, Shi, Guo, Chai and Lu2012). This scheme modifies the bounce-back rule to impose specific temperature values at the boundary nodes, ensuring accurate thermal boundary conditions. The anti-bounce-back scheme for a boundary node $ \boldsymbol{r}_b$
with a prescribed temperature
$ \boldsymbol{r}_b$
with a prescribed temperature $ T_b$
is implemented as
$ T_b$
is implemented as
 \begin{equation} g_{-k}(\boldsymbol{r}_b, t + \Delta t) = -\tilde {g}_k(\boldsymbol{r}_b, t) + 2 \omega _k \rho c_p T_b. \end{equation}
This formulation ensures that the temperature at the boundary node $ \boldsymbol{r}_b$
is set to
$ \boldsymbol{r}_b$
is set to $ T_b$
.
$ T_b$
.
Appendix C. Supplementary details on LBM parameters and benchmarking
C.1. Parameters set-up
The input parameters for our numerical approach include the fluid Rayleigh number $Ra_{\mkern -2mu f}$
, Prandtl number
$Ra_{\mkern -2mu f}$
, Prandtl number $\textit{Pr}_{\mkern -2mu f}$
, even relaxation rate
$\textit{Pr}_{\mkern -2mu f}$
, even relaxation rate $\tau ^+$
, fluid specific heat capacity
$\tau ^+$
, fluid specific heat capacity $C_{\!p,f}$
, heat capacity ratio
$C_{\!p,f}$
, heat capacity ratio $\sigma$
, thermal conductivity ratio
$\sigma$
, thermal conductivity ratio $k_{\mkern -2mu r}$
, hot and cold temperatures
$k_{\mkern -2mu r}$
, hot and cold temperatures $T_{\mkern -2mu H}$
and
$T_{\mkern -2mu H}$
and $T_{\mkern -2mu C}$
and the number of time steps
$T_{\mkern -2mu C}$
and the number of time steps $N_{\mkern -2mu i}$
.
$N_{\mkern -2mu i}$
.
The fluid thermal conductivity is given by
 \begin{equation} k_{\mkern -2mu f} = \frac {\mu _v \rho C_{\!p,f}}{\textit{Pr}_{\mkern -2mu f}}. \end{equation}
The Grashof number is determined as
 \begin{equation} Gr_{\!f} = \frac {Ra_{\mkern -2mu f}}{\textit{Pr}_{\mkern -2mu f}}. \end{equation}
Fluid dynamic viscosity $\mu$
is computed using the relaxation rate
$\mu$
is computed using the relaxation rate $\tau ^+$
in (B14).
$\tau ^+$
in (B14).
The gravitational acceleration vector is defined as
 \begin{equation} \boldsymbol{g} = \frac {Gr_{\mkern -2mu f} \nu ^2}{H^3}. \end{equation}
The thermal properties of the solid phase are derived from their fluid counterparts
 \begin{equation} k_{\mkern -2mu s} = k_{\mkern -2mu r} k_{\mkern -2mu f}, \quad C_{\!p,s} = \sigma C_{\!p,f}. \end{equation}
At the boundaries, we set the temperatures as $ T_{\mkern -2mu C} = 1$
and
$ T_{\mkern -2mu C} = 1$
and $ T_{\mkern -2mu H} = T_{\mkern -2mu C} + \Delta T$
with
$ T_{\mkern -2mu H} = T_{\mkern -2mu C} + \Delta T$
with $ \Delta T = 10$
(B21). For simulations with
$ \Delta T = 10$
(B21). For simulations with $ Ra^* \leqslant 10^9$
, a fluid relaxation time of
$ Ra^* \leqslant 10^9$
, a fluid relaxation time of $ \tau _{\mkern -2mu f} = 0.51$
was used. For higher Rayleigh numbers,
$ \tau _{\mkern -2mu f} = 0.51$
was used. For higher Rayleigh numbers, $ \tau _{\mkern -2mu f}^+= \{0.505, 0.5025\}$
was chosen to increase the diffusion time, thereby improving time resolution. Since the thermal conductivity
$ \tau _{\mkern -2mu f}^+= \{0.505, 0.5025\}$
was chosen to increase the diffusion time, thereby improving time resolution. Since the thermal conductivity $ k_{\mkern -2mu m}$
is affected by the relaxation time, it was measured separately to ensure consistency, given that the Prandtl number is fixed at
$ k_{\mkern -2mu m}$
is affected by the relaxation time, it was measured separately to ensure consistency, given that the Prandtl number is fixed at $ \textit{Pr}_{\mkern -2mu f} = 1$
. The resulting
$ \textit{Pr}_{\mkern -2mu f} = 1$
. The resulting $ \lambda$
values are consistent to at least three decimal places.
$ \lambda$
values are consistent to at least three decimal places.
C.2. Benchmark details
The benchmark model used for simulations in figure 1(b) (Merrikh & Lage Reference Merrikh and Lage2005; Raji et al. Reference Raji, Hasnaoui, Naïmi, Slimani and Ouazzani2012; Karani & Huber Reference Karani and Huber2015; Lu et al. Reference Lu, Lei and Dai2017, Reference Lu, Lei and Dai2018; Landl et al. Reference Landl, Prieler, Monaco and Hochenauer2023). The mesh consisted of $242 \times 242$
lattice nodes, with the outermost layer implemented using half-way bounce-back and anti-bounce-back boundary conditions, respectively. The boundary of fluid and solid nodes in the domain was modelled as described in § 2.2. The side length
$242 \times 242$
lattice nodes, with the outermost layer implemented using half-way bounce-back and anti-bounce-back boundary conditions, respectively. The boundary of fluid and solid nodes in the domain was modelled as described in § 2.2. The side length $D$
of the square obstacle was
$D$
of the square obstacle was $3L$
, where
$3L$
, where $L = 12$
was selected as half the spacing between the solids. The relaxation time was fixed for the fluid as
$L = 12$
was selected as half the spacing between the solids. The relaxation time was fixed for the fluid as $\tau ^+ = 0.505$
with
$\tau ^+ = 0.505$
with $\varLambda _{\textit{TRT}} = 3/16$
. The fluid relaxation time was set via
$\varLambda _{\textit{TRT}} = 3/16$
. The fluid relaxation time was set via $k_{\mkern -2mu r}$
and (B14).
$k_{\mkern -2mu r}$
and (B14).
Time-averaged Nusselt number $\overline {\textit{Nu}}$
as a function of the Darcy–Rayleigh number
$\overline {\textit{Nu}}$
as a function of the Darcy–Rayleigh number $Ra^*$
for two simulations with the same porosity (
$Ra^*$
for two simulations with the same porosity ( $\varphi = 33\,\%$
) and thermal conductivity ratio (
$\varphi = 33\,\%$
) and thermal conductivity ratio ( $\lambda = 1$
), but different grid resolutions. The resolution is increased by a factor of
$\lambda = 1$
), but different grid resolutions. The resolution is increased by a factor of $\sim$
2. The scaling exponent in the inertial regime (Forchheimer-type;
$\sim$
2. The scaling exponent in the inertial regime (Forchheimer-type; $\overline {\textit{Nu}} \propto (Ra^*)^{0.5}$
) remains consistent, indicating that the grid refinement does not significantly affect the scaling behaviour at the lower resolution.
$\overline {\textit{Nu}} \propto (Ra^*)^{0.5}$
) remains consistent, indicating that the grid refinement does not significantly affect the scaling behaviour at the lower resolution.

C.3. The HRLC at different resolutions
In order to prevent an effect of the grid on the results, we performed additional simulations at $\sim$
2 times the resolution for the case of lowest porosity in the inertial regime for pure hydrodynamics and HRLC (figures 6 and 15). The scaling law for the inertial regime in HRLC remains consistent across resolutions, confirming the robustness of the simulations during the transition from the laminar to the oscillatory regime.
$\sim$
2 times the resolution for the case of lowest porosity in the inertial regime for pure hydrodynamics and HRLC (figures 6 and 15). The scaling law for the inertial regime in HRLC remains consistent across resolutions, confirming the robustness of the simulations during the transition from the laminar to the oscillatory regime.
C.4. Scale-dependent evaluation of porous-medium model
To characterise the porous geometry in this study with respect to heterogeneity and scale (figure 1
a), we employ a Monte Carlo mapping approach (figure 16). The relative standard deviation (RSD [%]) of porosity is calculated from 1000 randomly sampled volumes of diameter $D_{\textit{REV}}$
, extracted from a porous domain with the same geometry as shown in figure 1(a), but with four times the side length. The RSD is computed as
$D_{\textit{REV}}$
, extracted from a porous domain with the same geometry as shown in figure 1(a), but with four times the side length. The RSD is computed as $ \text{RSD} = \sigma _{\varphi } / \langle \varphi \rangle _{\textit{REV}} \times 100\,\,\%$
, where
$ \text{RSD} = \sigma _{\varphi } / \langle \varphi \rangle _{\textit{REV}} \times 100\,\,\%$
, where $\sigma _{\varphi }$
and
$\sigma _{\varphi }$
and $\langle \varphi \rangle _{\textit{REV}}$
are the standard deviation and mean porosity of the 1000 samples, respectively. This statistical evaluation quantifies spatial porosity variations and demonstrates how its fluctuations decrease with increasing REV sizes. The chosen domain scale
$\langle \varphi \rangle _{\textit{REV}}$
are the standard deviation and mean porosity of the 1000 samples, respectively. This statistical evaluation quantifies spatial porosity variations and demonstrates how its fluctuations decrease with increasing REV sizes. The chosen domain scale $H$
is composed of several sub-REVs that exhibit relatively minor fluctuations. In contrast, at small REVs such as the unit pore-scale
$H$
is composed of several sub-REVs that exhibit relatively minor fluctuations. In contrast, at small REVs such as the unit pore-scale $h$
, significant variations persist, indicating the heterogeneity at this scale.
$h$
, significant variations persist, indicating the heterogeneity at this scale.
The relative standard deviation (RSD (%)) of porosity is calculated from 1000 randomly sampled volumes of diameter $D_{\textit{REV}}$
, extracted from a porous domain with the same geometry as shown in figure 1(a), but with four times the side length. The RSD is computed as
$D_{\textit{REV}}$
, extracted from a porous domain with the same geometry as shown in figure 1(a), but with four times the side length. The RSD is computed as $ \text{RSD} = \sigma _{\varphi } / \langle \varphi \rangle _{\textit{REV}} \times 100\,\,\%$
, where
$ \text{RSD} = \sigma _{\varphi } / \langle \varphi \rangle _{\textit{REV}} \times 100\,\,\%$
, where $\sigma _{\varphi }$
and
$\sigma _{\varphi }$
and $\langle \varphi \rangle _{\textit{REV}}$
are the standard deviation and mean porosity of the 1000 samples, respectively. The RSD is shown as a function of sample diameter normalised by the solid diameter and the pore-throat size
$\langle \varphi \rangle _{\textit{REV}}$
are the standard deviation and mean porosity of the 1000 samples, respectively. The RSD is shown as a function of sample diameter normalised by the solid diameter and the pore-throat size $l_t$
of the medium. As the sample size increases, the RSD decreases, illustrating the scale separation required for Darcy-scale descriptions.
$l_t$
of the medium. As the sample size increases, the RSD decreases, illustrating the scale separation required for Darcy-scale descriptions.

The chosen domain size exhibits relatively good agreement with continuum-scale assumptions at the continuum scale. Our evaluation also shows that, at the scale $h$
, porosity fluctuations remain significant due to its role as a weighting factor in averaging. Figure 16 confirms that the chosen porous model is suited for investigating the transition between pore-scale and continuum-scale behaviour in our simulations.
$h$
, porosity fluctuations remain significant due to its role as a weighting factor in averaging. Figure 16 confirms that the chosen porous model is suited for investigating the transition between pore-scale and continuum-scale behaviour in our simulations.
C.5. Thermal structure at the transition to RB convection
A representative change in thermal structure as $\varLambda$
falls below 0.5 is illustrated in figure 17, where the scaling departs from Forchheimer-type convection.
$\varLambda$
falls below 0.5 is illustrated in figure 17, where the scaling departs from Forchheimer-type convection.
Thermal and velocity fields for $\varphi =33\,\%$
,
$\varphi =33\,\%$
, $k_r=0.2$
. At
$k_r=0.2$
. At $Ra_f=5.5\times 10^{9}$
(
$Ra_f=5.5\times 10^{9}$
( $\varLambda =0.5$
, left) and
$\varLambda =0.5$
, left) and $Ra_f=1.1\times 10^{10}$
(
$Ra_f=1.1\times 10^{10}$
( $\varLambda =0.3$
, right), the two cases fall onto distinct inertial branches that can be associated with Forchheimer and Rayleigh–Bénard scaling, respectively.
$\varLambda =0.3$
, right), the two cases fall onto distinct inertial branches that can be associated with Forchheimer and Rayleigh–Bénard scaling, respectively.

Specifications of earlier HRL experiments compiled in this study. Listed are porosity ϕ, Darcy number Da, conductivity ratio km/kf and porous Prandtl number Prp.

C.6. The HRLC of different experiments
We compiled permeability values using the Carman–Kozeny relation with a shape factor of $180$
for random packed beds (Bavandla & Srinivasan Reference Bavandla and Srinivasan2025)
$180$
for random packed beds (Bavandla & Srinivasan Reference Bavandla and Srinivasan2025)
 \begin{align} K = \frac {d^2 \varphi ^3}{180 \,(1-\varphi )^2}, \end{align}
where $d$
is the pore diameter and
$d$
is the pore diameter and $\varphi$
the porosity. To estimate the drag coefficient in the experiments, we used the correlation (Nield & Bejan Reference Nield and Bejan2017)
$\varphi$
the porosity. To estimate the drag coefficient in the experiments, we used the correlation (Nield & Bejan Reference Nield and Bejan2017)
 \begin{align} C_{\!F} = 0.55\! \left (1 - 5.5 \, \frac {d}{D_e}\right )\!, \qquad \text{where} \qquad D_e = \frac {2LH}{L+H}. \end{align}
Data that produce negative values of the porous-medium drag coefficient $c_F$
under the above correlation were excluded, as this indicates that the porous-continuum assumption is not satisfied at the domain scale and that the static confinement is typically large (
$c_F$
under the above correlation were excluded, as this indicates that the porous-continuum assumption is not satisfied at the domain scale and that the static confinement is typically large ( $\varGamma \gt 0.1$
). Although alternative estimators for
$\varGamma \gt 0.1$
). Although alternative estimators for $c_F$
exist (Nield & Bejan Reference Nield and Bejan2017; Bavandla & Srinivasan Reference Bavandla and Srinivasan2025), they likewise require a valid porous-continuum description and are not reliable in these weakly confined regimes.
$c_F$
exist (Nield & Bejan Reference Nield and Bejan2017; Bavandla & Srinivasan Reference Bavandla and Srinivasan2025), they likewise require a valid porous-continuum description and are not reliable in these weakly confined regimes.
For the historic measurements of Schneider (Reference Schneider1963) and Elder (Reference Elder1967), permeability was derived using the Carman–Kozeny relation with the shape factor 180 as above; fluid properties were taken at ambient conditions.
Porous Prandtl numbers were adopted from Bavandla & Srinivasan (Reference Bavandla and Srinivasan2025), except for the data of Kladias & Prasad (Reference Kladias and Prasad1991), which were calculated independently.
The corresponding data sets shown in the table below, together with a complete list containing further details of the parameters used, are accessible on GitHub (link: 8).


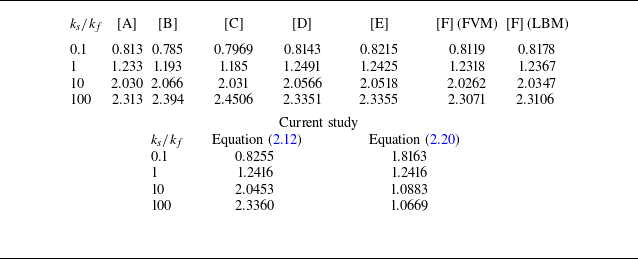

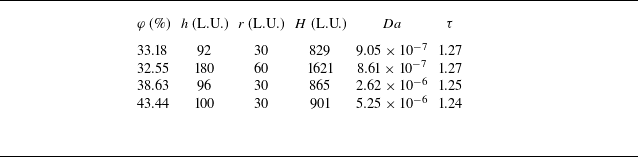


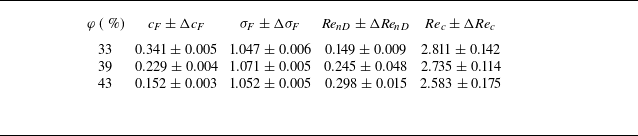


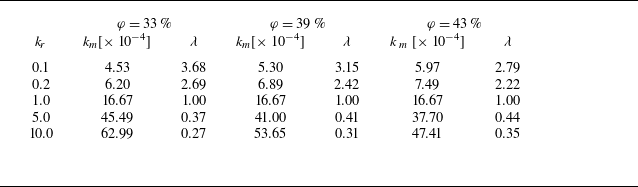


 Open access

