


I. Introduction
Alcohol and cannabis are among the most prevalent adult recreational substances (SAMHSA, 2022), and while cannabis remains illegal in many parts of the world, policy reform is well underway (Goodwin, Reference Goodwin, Coleman, Ghostlaw, Hoddinott, Menon, Parvin, Pereira, Quisumbing, Roy and Younus2024). In the United States, for example, nearly half of adults can legally purchase recreational cannabis despite its federal classification as a controlled substance (Schaeffer, Reference Schaeffer2023). As cannabis markets have expanded, researchers have analyzed the effect of legalization on various economic and health outcomes (e.g., Anderson and Rees, Reference Anderson and Rees2023; Hall and Lynskey, Reference Hall and Lynskey2016). However, one area that policymakers, health officials, and other stakeholder groups are still questioning is the relationship between alcohol and cannabis markets (Guttmannova et al., Reference Guttmannova, Lee, Kilmer, Fleming, Rhew, Kosterman and Larimer2016).
Several studies have attempted to determine whether the two substances are complements or substitutes, but the findings are mixed. Some state they are complements (Lu, Reference Lu2021; O'Hara et al., Reference O'Hara, Armeli and Tennen2016; Pacula, Reference Pacula1998; Wen et al., Reference Wen, Hockenberry and Cummings2015; Williams et al., Reference Williams, Liccardo Pacula, Chaloupka and Wechsler2004), while others suggest they are substitutes (Anderson et al., Reference Anderson, Hansen and Rees2013; Anderson and Rees, Reference Anderson and Rees2014, Reference Anderson and Rees2023; Baggio et al., Reference Baggio, Chong and Kwon2020; Crost and Guerrero, Reference Crost and Guerrero2012; DiNardo and Lemieux, Reference DiNardo and Lemieux2001; Miller and Seo, Reference Miller and Seo2021; Sabia et al., Reference Sabia, Swigert and Young2017). Past research primarily relies on secondary time-series data, which can be associated with price endogeneity and aggregation issues over products and individuals (Dhar et al., Reference Dhar, Chavas and Gould2003). Consequently, these studies may not provide a holistic understanding of the effects of cannabis legalization on substance use. Filling this gap is increasingly important for addressing policy-relevant questions regarding individual-specific behaviors and for improving public health messaging.
We use a framed market experiment and recent choice modeling advancements to provide novel insights into intra- and intercategory preferences for alcohol and cannabis at a disaggregated level. Specifically, we employ the basket-based choice experiment (BBCE) introduced in Caputo and Lusk (Reference Caputo and Lusk2022) to assess alcohol and cannabis preference heterogeneity, compare price elasticities across subgroups, and identify who is most likely to simultaneously consume these two substances. Using an online survey with 2,010 U.S. adults, we create a hypothetical retail environment consisting of common alcohol and cannabis products offered at different market prices. Respondents envision gathering with friends on a weekend night, and they select the basket of goods they would expect to consume, given the posted prices and choice environment. In replicating a social environment where substance use is prevalent (Acuff et al., Reference Acuff, Strickland, Aston, Gex and Murphy2023; Eisenberg et al., Reference Eisenberg, Golberstein and Whitlock2014), the analysis offers two key insights into substance use patterns and contributes to the ongoing policy debates on the relationship between these markets.
First, we use descriptive statistics and multivariate logistic (MVL) regression analysis (Richards and Bonnet, Reference Richards, Bonnet, G. L., K. P. and A.2018) to provide a more granular perspective on the tradeoffs consumers make within and across alcohol and cannabis categories. In evaluating common product bundling patterns, marginal utility estimates, and own- and cross-price elasticities across subgroups, we demonstrate the nuances of the relationship between alcohol and cannabis markets. For instance, we show that more than half the consumers in our sample bundle alcohol and cannabis on at least one choice occasion, while most other respondents view them as independent markets. We also highlight the varying degrees of price sensitivity and basket composition across subsamples based on the BBCE purchasing behavior.
The second key contribution is identifying the demographics and personality traits of individuals who are most likely to bundle alcohol and cannabis. The health and addiction literature suggests that the couse of these substances is associated with a variety of potential short- and long-term health and behavioral effects (for a review, see Yurasek et al., Reference Yurasek, Aston and Metrik2017). These risks include elevated consumption levels and additive performance impairment effects (Brière et al., Reference Brière, Fallu, Descheneaux and Janosz2011; Subbaraman and Kerr, Reference Subbaraman and Kerr2015); heightened risk of driving while impaired (Ronen et al., Reference Ronen, Chassidim, Gershon, Parmet, Rabinovich, Bar-Hamburger, Shinar and Shinar2010; Subbaraman and Kerr, Reference Subbaraman and Kerr2015); and an increased likelihood of substance use and mental health disorders (Fleming et al., Reference Fleming, Duckworth, Rhew, Abdallah, Guttmannova, Patrick and Lee2021; Lopez-Quintero et al., Reference Lopez-Quintero, Granja, Hawes, Duperrouzel, Pacheco-Colón and Gonzalez2018; SAMHSA, 2022; Weinberger et al., Reference Weinberger, Platt and Goodwin2016). The results show that individuals who bundle alcohol and cannabis have distinct demographics and personality traits from those who only select alcohol or cannabis. These results could be helpful to improve public health targeting and messaging on the potential risks of simultaneous substance use.
The remainder of this paper is structured as follows. Section 2 outlines the experimental design, survey methods, and sampling procedures, while Section 3 describes the estimation procedures. Section 4 presents the results, including descriptive statistics, BBCE output, and the identification of traits of those who are most likely to bundle alcohol and cannabis. Section 5 concludes with a discussion of the implications of this work from a public health and policy perspective.
II. Experimental methods
a. Product selection and experimental design
BBCEs are a highly flexible and novel approach to understanding consumer preferences and demand (Caputo and Lusk, Reference Caputo and Lusk2022; Kilders et al., Reference Kilders, Caputo and Lusk2023; Ma et al., Reference Ma, Gallardo, Canales and Iorizzo2024; Neill and Lahne, Reference Neill and Lahne2022). They possess the same desirable properties as discrete choice experiments, including external validity, resemblance to real-world purchasing environments, and reduced price endogeneity concerns (Caputo and Just, Reference Caputo, Just, Barrett and Just2023). However, BBCEs can estimate complementarity and substitution effects, whereas discrete choice experiments only assess substitution effects (Caputo and Lusk, Reference Caputo and Lusk2022). Given the research objectives, we created an environment where respondents are presented with several alcohol and cannabis product options at different prices.
Nine product options were presented in the alcohol market, including eight intoxicating beverages and one soda. The eight alcoholic beverages included light beer, craft beer, hard seltzer, red wine, white wine, vodka, whiskey, and rum. These options were selected based on the existing literature and market trends at the time of data collection. For example, the domestic beer industry is commonly divided into two segments with different consumer bases (e.g., Malone and Lusk, Reference Malone and Lusk2018; Staples et al., Reference Staples, Reeling, Widmar and Lusk2020), while hard seltzers were among the fastest-growing segments of the alcohol industry during data collection. Red and white wines were included because the literature suggests the flavor profile, drinking occasion, and consumer base for the two products differ (Carew et al., Reference Carew, Florkowski and Meng2017). Three distilled spirits (vodka, whiskey, and rum) were included, based on the top 10 most popular liquor brands in 2020 by U.S. sales volume (Staab, Reference Staab2023).Footnote 1 Soda was included because it provides a nonalcoholic drink that can be consumed alone or with an alcoholic beverage.
Nine cannabis options were also included to replicate product selection in state-licensed cannabis retail outlets, also known as dispensaries. These products included smokable loose flower, smokable prerolls, vaporizers, resin, edibles, cannabidiol-infused (CBD-infused) beverages, tetrahydrocannabinol-infused (THC-infused) beverages, topical creams, and tinctures. Smokable loose flower and prerolls were the most frequent consumption methods of recreational cannabis at the time of data collection (MJBiz Daily, 2022; Smart et al., Reference Smart, Caulkins, Kilmer, Davenport and Midgette2017). The difference between the two products is that prerolled flower is prepackaged for consumption, whereas the loose flower is not. Edibles, or food products infused with cannabis oil, represent another common consumption method, followed by vaporizers and resin. Vaporizers and resin are concentrated versions of cannabis that represent alternative smoke-based consumption methods. Similar to edibles, CBD- and THC-infused beverages were also emerging in the market during data collection (Staples, Reference Staples2024; Villa, Reference Villa2021). The main distinction is that CBD is a nonpsychoactive cannabinoid more commonly associated with alleviating joint pain, reducing muscle aches, and aiding sleep, whereas THC is a psychoactive cannabinoid for recreational use (McFadden and Malone, Reference McFadden and Malone2021). Topical creams and tinctures, although less common, complement the product assortment to replicate the full variety at a dispensary.
A simultaneous orthogonal fractional factorial design was then created to assign prices to each product alternative across choice tasks. Within each task, each item was assigned one of four product-specific price levels based on estimates from online resources. The complete set of price levels for each product is available in Appendix Table A1. The design consists of 40 choice tasks, blocked into four sets of 10. Thus, each respondent saw 10 choice tasks.
During the experiment, respondents were asked to envision that cannabis had been legalized in their state (if it had not already), and they were gathering with friends on a single weekend night. Respondents then selected the products they expected to consume on this occasion. This scenario is chosen for three key reasons. First, considering a hypothetical environment in which cannabis was legal across all states allowed us to standardize the legal landscape for all respondents. In states without legal recreational cannabis, cannabis could still be accessed through alternative shadow markets (Auriol et al., Reference Auriol, Mesnard and Perrault2023; Goldstein and Sumner, Reference Goldstein and Sumner2022). However, cannabis legalization reduces purchasing transaction costs and the stigmas associated with its use (Charlebois et al., Reference Charlebois, Music, Sterling and Somogyi2020; Jacobi and Sovinsky, Reference Jacobi and Sovinsky2016), which has increased consumption rates (Auriol et al., Reference Auriol, Mesnard and Perrault2023). Thus, creating a hypothetical setting where recreational cannabis was legal across all states allowed us to predict substance use and forecast preferences under the most liberal cannabis regimes. Additionally, this social setting marks a common occasion where substance use is prevalent (Acuff et al., Reference Acuff, Strickland, Aston, Gex and Murphy2023) and private and social costs could be elevated (e.g., driving under the influence). Lastly, constraining the experimental setting to one night allows us to validate the assumption that BBCE purchasing behavior translates to consumption on the same occasion.Footnote 2
b. Survey design and sampling procedures
The experiment and survey instrument were designed and distributed through Qualtrics, targeting a nationally representative sample of U.S. adults 21+ with respect to key demographic characteristics.Footnote 3 Table 1 summarizes the demographics of the 2,010 respondents who completed the study relative to U.S. census estimates.
Sample demographics and characteristics relative to the U.S. Census, broken down by basket-based choice experiment (BBCE) purchasing behavior

Following the screening questions, respondents were provided instructions describing the BBCE.Footnote 4 They were told to envision that recreational cannabis has been legalized and that state-licensed dispensaries are located throughout the state. Respondents then selected the products they would purchase for themselves for a weekend night spent with friends, which could include alcohol, cannabis, both substances, or neither. The full experimental instructions are available in Appendix B of this paper.
After the instructions, respondents were given the full list of products (including volume/weight) as well as a cheap talk (Cummings and Taylor, Reference Cummings and Taylor1999) and consequentiality script (Vossler and Evans, Reference Vossler and Evans2009) to mitigate potential online survey biases (Penn and Hu, Reference Penn and Hu2018). Immediately before the first choice task, respondents were shown a figure summarizing the instructions (Figure A2). Respondents then went through their 10-choice tasks, which were intended to be independent of one another. The choice tasks and product orderings within each category were randomized to prevent ordering effects. Figure 1 presents an example choice task.
Example choice task in the basket-based choice experiment.

Respondents saw all 18 products simultaneously, but product randomization was constrained to the category level for two reasons. First, it reduces the cognitive burden of the respondents, as the grouping creates a logical breakdown of product options, following the approach outlined in Kilders et al. (Reference Kilders, Caputo and Lusk2023). Second, it more closely resembles a real-world environment, as alcohol and most recreational cannabis products are not available in the same retail outlet for legal reasons.Footnote 5
Recognizing that personality and mental health may correlate with risky decision-making and substance use (Moschion and Powdthavee, Reference Moschion and Powdthavee2018; Rice and Robone, Reference Rice and Robone2022; Rup et al., Reference Rup, Freeman, Perlman and Hammond2021), participants also completed the Midlife Development Inventory (MIDI) personality test (Lachman and Weaver, Reference Lachman and Weaver1997). Also sometimes referred to as the Big Six personality test, this scale has been used in empirical economic studies (e.g., DeLong and Grebitus, Reference DeLong and Grebitus2018; Grebitus et al., Reference Grebitus, Lusk and Nayga2013), asking respondents to indicate how well 30 adjectives describe them on a four-point scale. Each adjective corresponds to one of six personality traits: agency, openness, conscientiousness, extraversion, agreeableness, and neuroticism. An index for each trait is formed by summing the corresponding adjective scores and dividing them by the number of adjectives in each group. Average scores across the sample are listed in Table 1, while the adjectives and indexing system are included in Table A2 of Appendix A.
III. Estimation procedures
a. Multivariate logistic model
While important insights are garnered directly through descriptive statistics, we use MVL modeling to extend our formal analysis (Richards and Bonnet, Reference Richards, Bonnet, G. L., K. P. and A.2018). The MVL model is useful for BBCE analysis (Caputo and Lusk, Reference Caputo and Lusk2022; Kilders et al., Reference Kilders, Caputo and Lusk2023) because it accounts for bundling behaviors and integrates conjoint effects, overcoming core limitations of models commonly used in discrete choice studies (e.g., MNL, mixed logit).
Following random utility theory (McFadden, Reference McFadden and Zarembka1973) and the Lancaster theory of consumer demand (Lancaster, Reference Lancaster1966), we assume that consumer n maximizes utility  ${U_{nb}} = {V_{nb}} + {\varepsilon _{nb}}$ from selecting bundle b. The observable component of utility ${V_{nb}}$ is expressed as a discrete, second-order Taylor series approximation (Song and Chintagunta, Reference Song and Chintagunta2006):
 \begin{equation}{V_{nb}} = \mathop \sum \limits_{j = 1}^J {v_{nj}}{x_j} + \frac{1}{2}\mathop \sum \limits_{j = 1}^J \mathop \sum \limits_{k \ne j}^J {\gamma _{jk}}{x_j}{x_k},\end{equation}
 while  ${\varepsilon _{nb}}$ is assumed to be an independent and identically distributed type-1 extreme value unobserved error term. In equation (1), ${v_{nj}}$ is the baseline utility that individual n receives from selecting item j, and ${x_j}$ is a binary variable equal to one if item j is selected but zero otherwise. The baseline utility term for each product j can be formally defined to include other attributes, including price ( $pric{e_j}$) and a vector of individual-specific characteristics ( ${\mathbf X}_{\mathbf n})$:
 \begin{equation}v_{nj}=\alpha_{0,j}+\beta price_j+{\mathbf X}_{\mathbf n}{\boldsymbol{\delta}}_{\mathbf j},\end{equation}
 where  ${\alpha _{0,j}}$, $\beta ,{\text{ and }}{{\boldsymbol{\delta }}_{\mathbf{j}}}$ are parameters to be estimated. The term ${\gamma _{jk}}$ in equation (1) represents the interaction utility from bundling items j and k together, offering insights into whether the average consumer prefers to consume these products together ( ${\gamma _{jk}} \gt 0$) or not ( ${\gamma _{jk}} \lt 0)$ at fixed price levels. Following Besag (Reference Besag1974), Richards et al. (Reference Richards, Hamilton and Yonezawa2018), and Russell and Petersen (Reference Russell and Petersen2000), we ensure identification by imposing symmetry ( ${\gamma _{jk}} = {\gamma _{kj}}$) and restricting the main diagonals to zero ( ${\gamma _{jj}} = 0$).
Instead of predicting the probability of choosing bundle b, which can include up to 18 products, the model estimates the conditional probability that product j is included in a bundle. This is expressed through a series of J logits with cross-equation restrictions (Besag, Reference Besag1974; Richards et al., Reference Richards, Hamilton and Yonezawa2018; Russell and Petersen, Reference Russell and Petersen2000):
 \begin{equation}{P_{nj}} = \frac{{\exp \left( {{z_{nj}}} \right)}}{{1 + \exp \left( {{z_{nj}}} \right)}}.\end{equation}
 Here,  ${z_{nj}} = {v_{nj}} + \mathop \sum \limits_{k \ne j}^J {\gamma _{jk}}{y_{nk}}$, where ${y_{nk}}$ equals one if respondent n chooses k and zero otherwise. The total probability of selecting product j is then calculated by summing across all bundles containing the item, and arc-elasticities are computed using these probabilities (Hensher et al., Reference Hensher, Rose and Greene2015). These procedures are first computed for the full sample. Then, we perform subsample analyses to assess price sensitivity across different groups based on the BBCE purchasing behavior (described more in the next subsection).
b. Predicting bundling behavior
We are also interested in identifying the characteristics of the consumers most likely to consume these substances simultaneously. To do so, respondents are grouped into one of three mutually exclusive categories based on their BBCE purchasing behavior. The first group includes individuals who bundle alcohol and cannabis on at least one occasion. The second and third groups consist of individuals who only select alcohol and only select cannabis within the BBCE, respectively.Footnote 6 Respondents who never select alcohol or cannabis are excluded from the analysis.
We then use multinomial logit regression analysis to predict the likelihood of group membership based on individual characteristics, where the probability that individual n is placed in group  $g = \left\{ {bundle{\text{ }}alcohol{\text{ }}and{\text{ }}cannabis,{\text{ }}cannabis{\text{ }}only,alcohol{\text{ }}only} \right\}$ is defined as:
 \begin{equation}\text{P}\left(Y_n=g\vert X\right)=\text{G}\left(\sigma_g+{\mathbf D}_{\mathbf n}{\boldsymbol{\unicode{x03C8}}}_{\mathbf g}\right).\end{equation}
 Here,  ${Y_n}$ is individual n's grouping outcome, ${\text{G}}\left( \cdot \right)$ is the standard logistic function, ${{{D}}_{{n}}}$ is a vector of demographics and personality index scores, and ${\sigma _g}$ and ${\boldsymbol{\unicode{x03C8}}}_{\mathbf g}$ are parameters to be estimated for each group. The alcohol only group serves as the baseline for comparison.
IV. Results
a. BBCE summary statistics
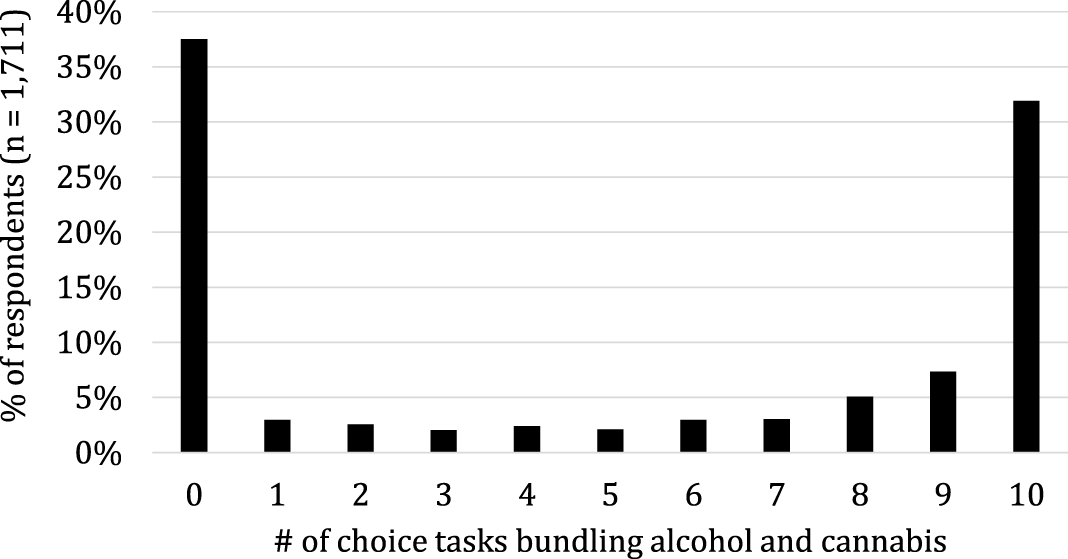
Of the 2,010 respondents who completed the survey, 53% bundled alcohol and cannabis on at least one choice occasion. Among this group, more than half bundled both substances on all 10 choice occasions (Figure A3). Approximately 6% selected cannabis in the experiment, while 26% selected alcohol. The remaining 15% never selected alcohol or cannabis during the BBCE, and given that their preferences do not inform our primary objectives, these respondents are excluded from the primary analysis.Footnote 7 Thus, the results that follow focus on the 1,711 individuals who selected alcohol and/or cannabis in at least one choice situation.
Table 2 conveys the probability of selecting each alternative, along with the conditional probability of each selection. First, considering individual product selection (the bottom row of Table 2), light beer was the most selected alcoholic beverage (26% of the choice tasks). Craft beer, whiskey, red wine, and white wine were each selected across roughly 20% of choice tasks, whereas rum (13%) and hard seltzer (14%) were the least commonly selected alcoholic beverages. Among the cannabis products, smokable flower was chosen most frequently (26% of choice tasks), followed by edibles (20%), prerolls (18%), and vapes (12%). The other cannabis alternatives were selected between 5% and 7% of the time. The alcohol and cannabis purchasing behaviors align with expectations based on past studies and industry reports. For example, Saad (Reference Saad2022) indicates that consumers have heterogeneous preferences across alcohol types, with the drinking population nearly equally divided among beer, wine, and distilled spirits. Additionally, MJBiz Daily (2022) and Smart et al. (Reference Smart, Caulkins, Kilmer, Davenport and Midgette2017) suggest that the loose flower market is the largest segment of the cannabis industry.
Conditional probabilities

Note: This table excludes individuals who never selected alcohol or cannabis in the basket-based choice experiment, as this aligns with the presentation in the main analysis.
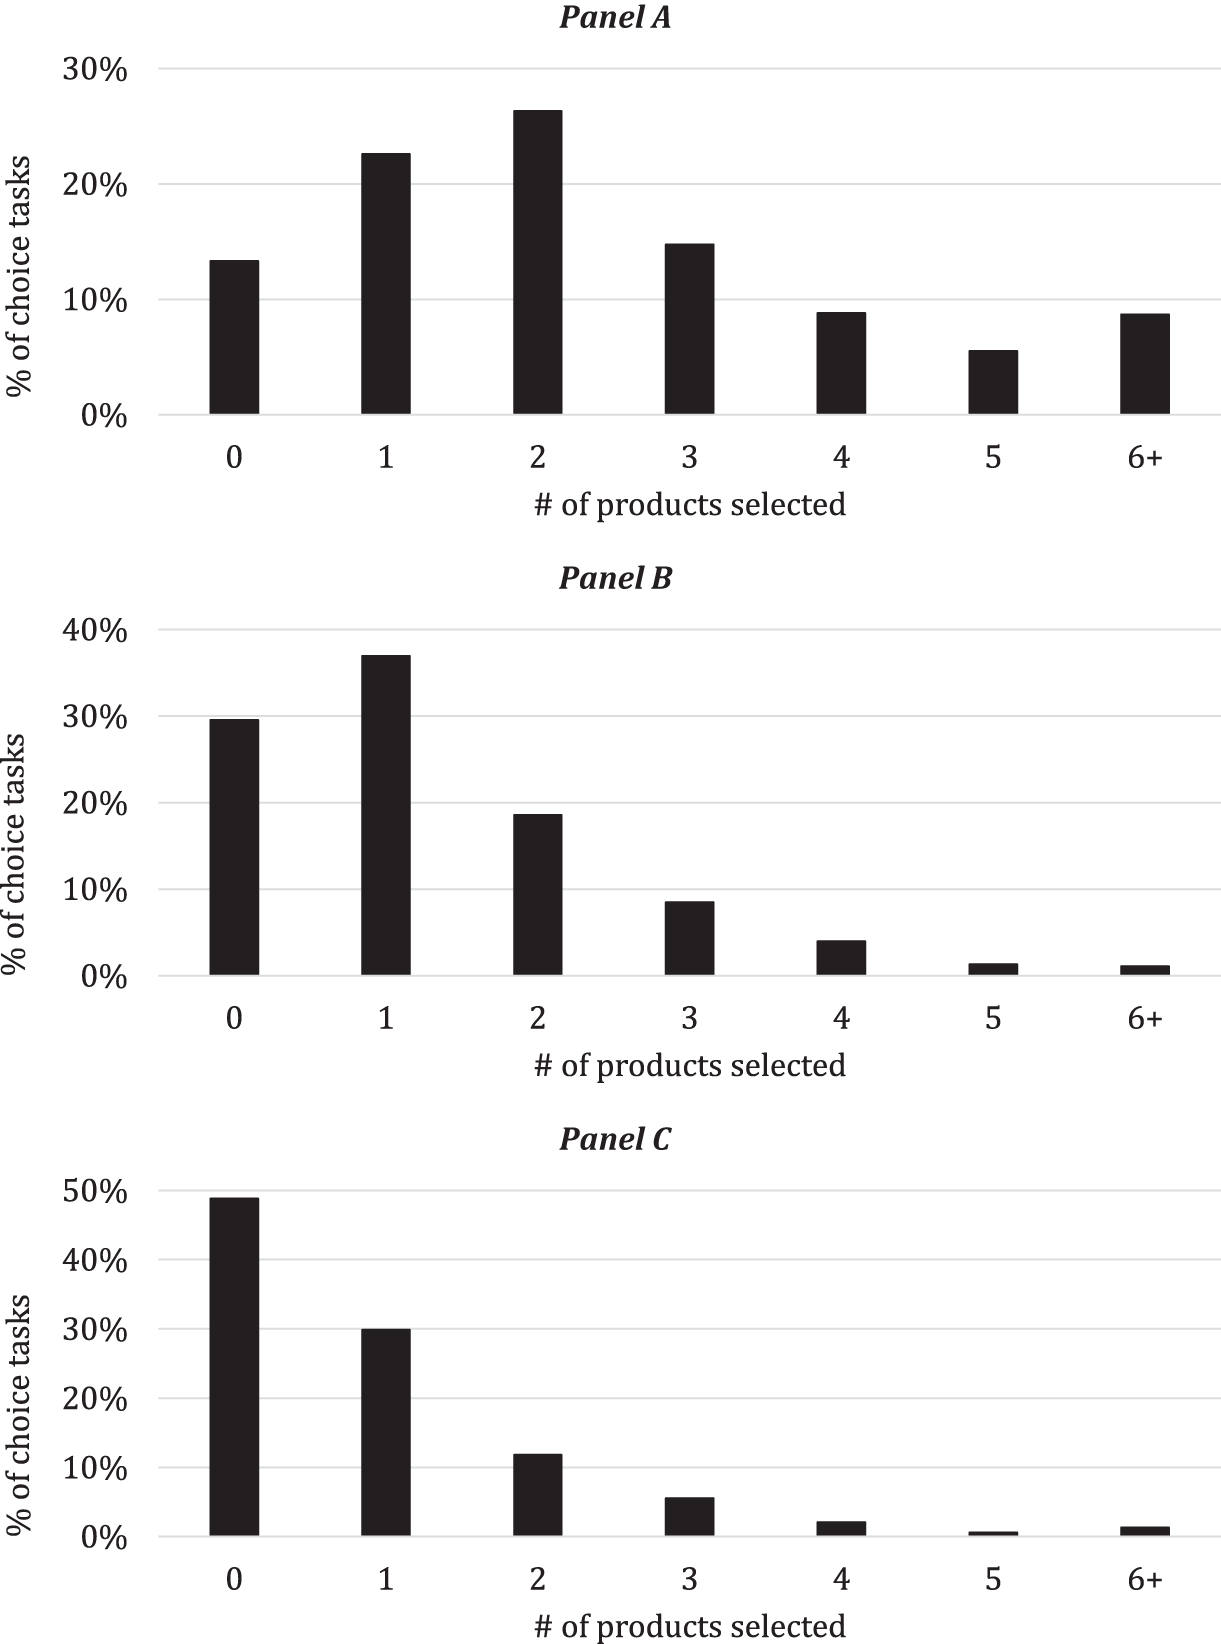
However, participants were not constrained to a single product. While respondents selected a single product in 23% of choice tasks, they chose two or more products in 65% (Figure 2). Indeed, the most common purchasing behavior is selecting two products (26%), giving credence to using a BBCE over a traditional discrete choice experiment due to the potential for complementarity within and across product categories (Caputo and Lusk, Reference Caputo and Lusk2022).
Number of products selected per choice task. Panel A. aggregate, panel B. alcoholic beverages only (excludes soda), Panel C. cannabis products only.

While some of the largest conditional probabilities are detected in the least commonly selected products, unique patterns also emerge. This provides a glimpse of which products are most likely be bundled. For example, when selecting prerolls, respondents chose loose flower on nearly half of all choice occasions. Confirming expectations that soda would be used as a mixer for alcoholic products, the conditional probability of selecting soda based on selecting rum and vodka was 0.41 and 0.37, respectively. Other notable estimates are red/white wine, conditional on selecting white/red wine (0.35 each way), and selecting loose flower, conditional upon choosing craft beer (0.32).
Table A3 presents the most common product bundles, showing the percentage of choice tasks in which the same two products are bundled. This includes alcohol-alcohol, alcohol-cannabis, and cannabis-cannabis product pairs. For example, loose cannabis flower with prerolled joints was the most prevalent combination (7.4% of choice tasks), followed by pairing red with white wine (6.0%) and light beer with flower (6.0%). Capturing this purchasing behavior provides a preliminary understanding of which products U.S. adults prefer to consume together.
b. MVL model results
Table 3 presents the results of the baseline utility MVL model,Footnote 8 including the main effects of each product alternative and key demographics.
Baseline utility estimates from MVL

* Note: superscript denotes statistical significance at the 5% level or better.
Consistent with economic theory, the price coefficient is negative and statistically different from zero, meaning higher prices decrease the probability of selection. The baseline utility for each product ( ${\alpha _{0,j}}$ in equation (2)) is denoted under the constant column, which is interpreted as the utility of an item when all of the other demographic variables and prices are equal to zero. Both beer options have the highest utility, which roughly aligns with the summary statistics and real-world purchasing patterns (Brenan, Reference Brenan2023). Meanwhile, among the cannabis products, loose flower has the highest utility, again corresponding with summary statistics and observed market trends in legal markets (MJBiz Daily, 2022). All available options have a higher utility than the no-purchase option, suggesting that respondents prefer to select an option rather than opting out.
Considering the coefficients corresponding to different demographics, we observe several distinct patterns. In line with previous studies, women and college-educated respondents have a significantly higher utility for the opt-out option than their counterparts, suggesting a generally lower preference for purchasing alcohol and cannabis (Collins, Reference Collins2016). Similarly, lower-income individuals express a higher utility for the no-purchase option and a lower utility for most of the cannabis and alcohol products, which could be associated with greater capital constraints. In contrast, younger individuals (21–44) have a substantially lower utility for the no-purchase alternative, implying a strong preference for selecting alcohol and/or cannabis alternatives within the choice setting. They also display significantly higher utilities for all cannabis products than older respondents. This corresponds with cannabis usage patterns observed in previous studies (e.g., Carlini and Schauer, Reference Carlini and Schauer2022). We also note that respondents in this age group have a significantly lower utility for both wine alternatives, but a higher utility for light beer, hard liquor beverages, and soda. Most strikingly, though, we note the highest positive utility for seltzers, matching observed consumption trends stating that younger consumers drive hard seltzer sales (Bruce, Reference Bruce2020)
Looking more closely at the impact of gender, female utility is significantly lower for most in the cannabis category. Among the exceptions are edibles, suggesting that females prefer edible cannabis products as their route of administration for cannabis (Doran and Papadopoulos, Reference Doran and Papadopoulos2019; Friese et al., Reference Friese, Slater and Battle2017; Greaves and Hemsing, Reference Greaves and Hemsing2020). Additionally, in line with Brenan (Reference Brenan2023), women have a significantly higher utility for both wines, whereas rum, whiskey, and both beer options are more popular among male respondents.
Meanwhile, respondents with a college degree have a significantly lower preference for most cannabis products. Some earlier studies looking at the relationship between cannabis use and education find a mostly negative association, which might explain these results (e.g., Berten et al., Reference Berten, Cardoen, Brondeel and Vettenburg2012; Legleye et al., Reference Legleye, Khlat, Mayet, Beck, Falissard, Chau and Peretti‐Watel2016).
We also consider cross-utility estimates (Table A4) to understand whether the average consumer prefers to consume these products together ( ${\gamma _{jk}} \gt 0$) or separately ( ${\gamma _{jk}} \lt 0$). These results mainly align with Table A3, where the most popular product pairs exhibit positive and statistically significant cross-utility (e.g., 0.96 for bundling loose flower and prerolled joint). For example, individuals who select craft beer are less likely to choose light beer but more likely to select wines, whiskey, and many of the cannabis products. One exception, however, is that despite being the third most prevalent product pair, the cross-utility estimate for light beer and loose cannabis flower is negative. This suggests that while some consumers enjoy pairing these products together, the majority do not. This could be driven by the fact that light beer is more common among older consumers (Malone and Lusk, Reference Malone and Lusk2018), while cannabis is less prevalent among this age group (Carlini and Schauer, Reference Carlini and Schauer2022).
c. Elasticity estimates
The cross-utility estimates only determine whether average utility increases or decreases conditional on a fixed price. We also derive the own- and cross-price elasticities for a more thorough evaluation (Table A5). The results suggest weak and inelastic own-price elasticities, ranging from −0.87 for the topical cream to −0.12 for light beer. The cross-price elasticities, which inform whether the products are complements or substitutes, are even weaker. Prior research into the disaggregated cross-price elasticities of these two goods remains sparse. Investigations into cannabis have primarily concentrated on the elasticity distinctions between legal and illegal variants of the product, as in Amlung et al. (Reference Amlung, Reed, Morris, Aston, Metrik and MacKillop2019). Similarly, the academic focus on alcohol has been somewhat narrow, often concentrating on specific categories like beer, wine, and spirits (e.g., Rousselière et al., Reference Rousselière, Petit, Coisnon, Musson and Rousselière2022). These studies consistently report inelastic elasticities. For example, Nelson (Reference Nelson2014) conducts a meta-analysis of beer price elasticities, finding an average own-price elasticity of −0.20, compared with our estimates of −0.12 for light beer and −0.16 for craft beer.
It is possible that our experimental context drives weak elasticities. As participants select the products they want when spending an evening with friends, they may be less price-sensitive and more eager to consume their preferred substance(s) within the social setting. We also acknowledge that the observed elasticities might be influenced by differences in consumer behavior. Consequently, we derive elasticities for subsections of our sample differentiated by their purchasing behavior across choice tasks: (1) always bundle alcohol and cannabis; (2) sometimes bundle alcohol and cannabis; (3) only select alcohol; and (4) only select cannabis. To do so, we run the MVL for each subgroup and calculate the corresponding own- and cross-price elasticities. Tables A6–A9 present the elasticities, revealing some differences. For example, across almost all products, the own-price elasticities are lower for respondents who always bundle alcohol and cannabis than for those who stick to only alcohol or cannabis.
So, where does this study land on the complements versus substitutes debate? Ultimately, there is considerable nuance given the weak cross-price elasticities and heterogeneity in consumer preferences. The price insensitivity suggests that consumers select their preferred products for the occasion, irrespective of price. While this makes it challenging to assess complements versus substitutes, it likely aligns with real-world purchasing patterns in settings resembling our experimental framework. However, in evaluating BBCE response behavior and cross-utility estimates, some consumers view these markets as entirely unrelated, while others prefer to consume these substances together.
d. Who bundles alcohol and cannabis?
Table 4 presents the marginal effects from the MNL regression analysis exploring the demographics and personality traits of the individuals who are most likely to simultaneously consume alcohol and cannabis.Footnote 9 Individuals are placed into one of three mutually exclusive groups based on their experimental purchasing behavior (bundle alcohol and cannabis, only select cannabis, only select alcohol).
Average marginal effects from exploratory multinomial logistic regression analysis predicting alcohol and cannabis product selection and bundling behavior

***, **, and * Note: superscripts denote statistical significance at the 1%, 5%, and 10% levels, respectively.
The results indicate that demographics and personality scores have strong and statistically significant relationships with group membership. Specifically, males, individuals between 21 and 44, and respondents without a college degree are more likely to bundle alcohol and cannabis. These estimates are all statistically significant at the 1% or 5% level, where age is the strongest predictor of this bundling behavior. These results align well with those presented in the MVL output. There are also ample differences in the personality scores, where individuals who bundle have higher average agency (e.g., self-confidence and assertiveness), openness (e.g., creative and adventurous), and neuroticism (e.g., moody and nervous) scores but lower conscientiousness (e.g., organized and careful) scores.
In briefly summarizing the other group characteristics, the cannabis-only group is more likely to consist of individuals 45 + and in lower-income households (< $60 K per year).Footnote 10 They also have higher average agreeableness (e.g., helpful and sympathetic) and lower extraversion (e.g., outgoing and lively) scores than the other groups. Finally, the alcohol-only group is more likely to include females, respondents over 45+, and college-educated individuals. Personality scores counter the bundling group, where the direction of the signs for agency, openness, neuroticism, and conscientiousness are opposite but retain the same statistical significance with similar magnitude.
V. Discussion and implications
The BBCE enables new insights into the nuances of assessing the relationship between alcohol and cannabis markets. In creating an environment where respondents select the alcohol and cannabis products that they would expect to consume on a night with friends, our results show heterogeneous consumer preferences toward these substances. Aligning with past research (Guttmannova et al., Reference Guttmannova, Lee, Kilmer, Fleming, Rhew, Kosterman and Larimer2016), this somewhat simplistic finding expresses the difficulty of providing a single population-level measurement of whether alcohol and cannabis are complements or substitutes. This is why the question must be considered at the individual level, where some consumers may view these goods as complements, others as substitutes, and more as independent markets.
Approximately 53% of respondents in our sample bundle alcohol and cannabis on at least one choice occasion. While the cross-price elasticity estimates indicate weak complementarity or substitution behavior in the traditional economic sense, most consumers in our sample prefer to consume these substances together in our hypothetical social environment. The other respondents appear to view these markets as independent of one another. Demographic and personality traits can also be used to predict bundling behavior, where males and younger consumers are more likely to simultaneously select alcohol and cannabis. This aligns with public health research indicating that cannabis consumption and bundling behavior are higher among younger populations (Chawla et al., Reference Chawla, Yang, Desrosiers, Westreich, Olshan and Daniels2018; Lee et al., Reference Lee, Calhoun, Abdallah, Blayney, Schultz, Brunner and Patrick2022; SAMHSA, 2022). It also aligns with literature suggesting that males are more likely to engage in risky health behaviors (e.g., Hailemariam et al., Reference Hailemariam, Yew and Appau2021). Additionally, higher agency, openness, and neuroticism and lower conscientiousness are associated with a higher probability of bundling alcohol and cannabis.
Highlighting the usefulness of BBCEs in conducting policy-relevant research, our work provides several insights into the relationship between mixed substance use, personality, and risky addictive behaviors. One policy insight stems from the largely inelastic own- and cross-price elasticities of demand, particularly among respondents who bundle alcohol and cannabis on all choice occasions. These results suggest that higher prices—for example, through higher excise tax rates—are unlikely to substantially curb consumption among these consumers in social settings resembling our experimental framework.Footnote 11 Thus, if policymakers do intend to reduce the co-use of these substances, additional measures might need to be paired with fiscal interventions. Importantly, potential unintended consequences should also be considered. For instance, Auriol et al. (Reference Auriol, Mesnard and Perrault2023) note that one unintended consequence of steep cannabis excise taxes is that consumers could pursue less expensive cannabis from shadow markets. Thus, higher tax rates could lead to the coexistence of legal and shadow markets, which pose additional health and safety risks (Goldstein and Sumner, Reference Goldstein and Sumner2022).
A second policy implication relates to public health messaging on the well-documented short- and long-term risks of simultaneous alcohol and cannabis consumption (Yurasek et al., Reference Yurasek, Aston and Metrik2017). Our regression analysis shows that males and younger populations are most susceptible to simultaneous alcohol and cannabis consumption. Thus, educational campaigns aimed at reducing mixed substance use in social environments should resonate with these demographic groups, such as college students (O'Hara et al., Reference O'Hara, Armeli and Tennen2016; Williams et al., Reference Williams, Liccardo Pacula, Chaloupka and Wechsler2004). Relatedly, public health messaging should consider personality factors when designing educational campaigns to enhance the receptiveness of informational resources (Hawkins et al., Reference Hawkins, Kreuter, Resnicow, Fishbein and Dijkstra2008). By better targeting public health messaging, resources can be allocated more efficiently when communicating the individual and social costs of simultaneous substance use.
Three potential limitations should be considered when interpreting the results. First, choice experiments are context-dependent, where purchasing behavior could depend on the choice environment outlined in the experimental instructions (Ghvanidze et al., Reference Ghvanidze, Ščasný and Hanf2025). Our environment asks respondents to envision spending a single weekend night gathering with friends to identify the consumer group that simultaneously uses alcohol and cannabis. However, some adults may consume both products separately but not on the same occasion. Our choice context cannot detect this hypothetical consumption behavior and could be an area for future work.
Second, individuals can only choose one unit of each product. While allowing respondents to also select quantity could enhance the realism of the experiment, it would drastically complicate the modeling procedures. Also, the choice setting asks respondents to select the products they would expect to consume on their own on a single night. While this should not be an issue for most products, some respondents may expect to consume multiple quantities of some within this setting (e.g., multiple six-packs of light beer). In this case, the respondent may exhibit conditional purchasing behavior, which drives a higher complementarity rate across products and product categories, absent a budgetary constraint. We acknowledge this potential limitation and suggest that our estimates likely constitute an upper bound for the percentage of the population expected to consume both substances on a single occasion. Nonetheless, identifying the characteristics of consumers who could bundle is still of tremendous relevance.
Finally, the sample may be indirectly exposed to a degree of self-selection and hypothetical bias given the online choice setting. Cannabis and alcohol are sensitive survey topics, and adults who use these substances may be more likely to complete the survey than those who oppose them. In this case, the sample could be representative of key demographics but not entirely representative of the stances on alcohol and cannabis consumption. Indeed, 36% of the sample states that they had consumed cannabis in the past year, which is larger than the national average of approximately 23% of adults reported by SAMHSA (2022).Footnote 12 A cheap talk (Cummings and Taylor, Reference Cummings and Taylor1999) and consequentiality script (Vossler and Evans, Reference Vossler and Evans2009) were included to reduce these biases (Penn and Hu, Reference Penn and Hu2018).
Despite these limitations, we provide unique insights into the interplay between alcohol and cannabis markets that can inform health officials and policymakers. We also hope that this research will open avenues for future economic and health-related studies. For example, there are ample opportunities to study consumer preferences in new product development, product labeling, and marketing through framed market experiments. On the health side, future research could evaluate user perceptions of alcohol, cannabis, and mixed substance use, as well as explore the role of alcohol and cannabis consumption on other risky behaviors and mental and physical health outcomes. As cannabis markets expand, filling these gaps in the literature becomes more pressing to inform policy decisions and market outcomes.
Acknowledgements
The authors would like to thank the anonymous reviewer and associate editor for their constructive comments and suggestions, which helped improve the quality of this paper. The authors are also grateful for NCR-SARE (GNC21-337) for supporting data collection.
Appendix A: Additional Tables and Figures
Product offerings and price levels

Midlife Development Inventory (MIDI) personality test adjectives and scoring system designed by Lachman and Weaver (Reference Lachman and Weaver1997)

Popular product bundles in the BBCE (n = 17,100)

Cross utility estimates of the full sample

* Note: numbers in parentheses are standard errors; denotes statistical significance at the 5% level or above.
Own- and cross-price elasticity estimates – full sample

Own- and cross-price elasticity estimates – respondents who bundled alcohol and cannabis in each choice task

Own- and cross-price elasticity estimates – respondents who sometimes bundled alcohol and cannabis in across choice task

Own- and cross-price elasticity estimates – respondents who only selected alcohol across choice task

Own- and cross-price elasticity estimates – respondents who only selected cannabis products across choice task

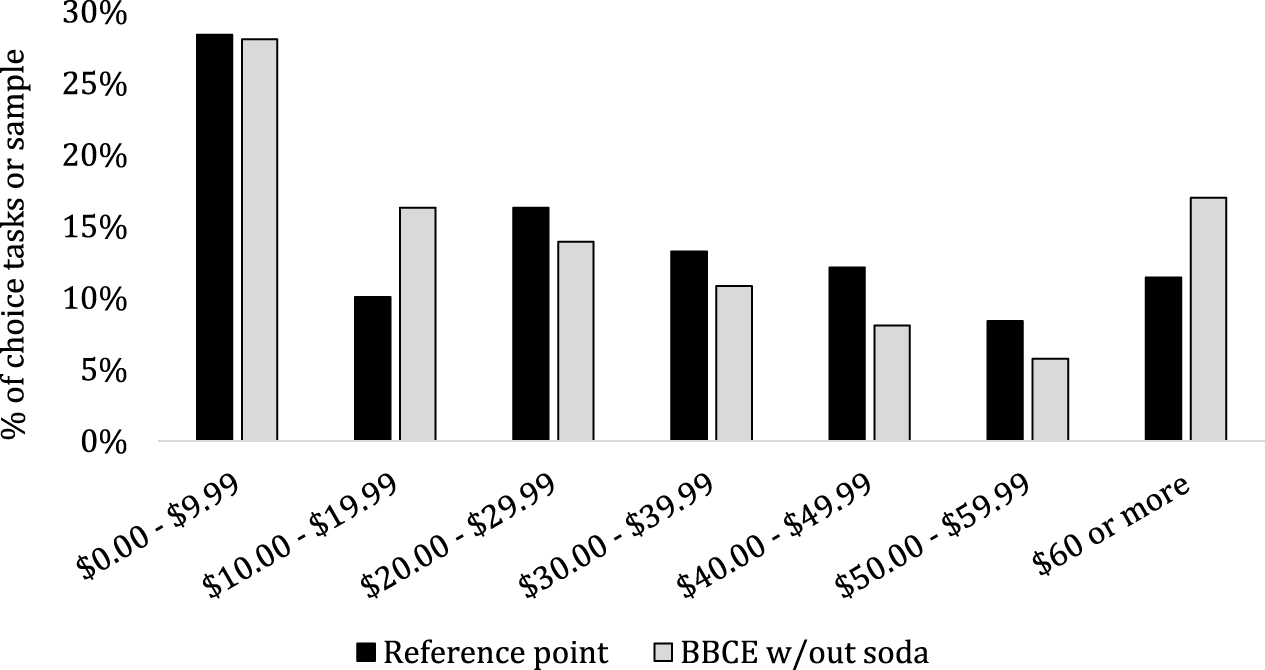
Comparison of BBCE expenditures with a reference price question on expected alcohol and cannabis spending for the specific choice setting before the experiment (n = 2,010).

Graphical summary of instructions presented to respondents before the first choice task.

The percentage of respondents who bundled alcohol and cannabis across the BBCE, by the number of choice tasks (removing respondents who never selected alcohol or cannabis).

Appendix B: Experimental instructions
Below, please find the experimental instructions used in this study. Page breaks represent new questions. Each question was presented on a separate screen for the participants.
The purpose of this experiment is to learn about the demand for alcohol and cannabis products. In each of the following settings, we ask that you imagine that recreational marijuana has been legalized in your state. Also, imagine that marijuana retail outlets (also known as dispensaries) are located throughout the state. Thus, in this hypothetical experiment, imagine that marijuana is legal and widely available through legal state-licensed retail outlets.
This experiment consists of 11 rounds. In each round, you will be presented with various alcoholic beverages and cannabis options. The price of the different products will vary across rounds.
You will be asked to select the alcoholic beverages and cannabis options that you would purchase for a night during the weekend with some friends. You may select:
• 1 or more types of alcoholic beverages
• 1 or more types of legal marijuana products
• a combination of alcoholic beverages and marijuana products
• none of the above.
In other words, if you do not consume alcohol or legal marijuana, you can choose to select the “none of these” options in the alcohol and cannabis category.
Please treat each round as independent from one another. That is, your choices in the previous rounds of the experiment do not carry over to the next round.
For some additional context, please consider reading through the key differences between CBD and THC.
In the experiment, you will be allowed to select between the following products.
Alcoholic beverages:
• light beer (6-pack)
• craft beer (6-pack)
• hard seltzer (6-pack)
• rum (750 ml bottle)
• vodka (750 ml bottle)
• whiskey (750 ml bottle)
• red wine (750 ml)
• white wine (750 ml).
Marijuana products:
• resin (1 gram)
• marijuana flower (1 gram)
• edible (100 mg)
• preroll (1 gram)
• THC skin cream (2 oz)
• THC liquid extract (1 oz)
• vaporizers (1 gram)
• THC-infused beverage (6-pack).
Nonintoxicating products:
• soda (20 oz)
• CBD-infused beverage (6-pack).
Before we begin, we want to once again stress the importance of providing truthful answers, as these results will be used to inform policymakers and industry groups.
To summarize the experimental instructions:


 Open access