

Obesity is an important public health problem worldwide. Despite many initiatives, the number of obese people continues to grow. Currently, there is an intensive debate concerning the most effective management of obesity using dietary macronutrient composition (high carbohydrate, high fat or high protein). However, the results of a 2-year follow-up study has revealed that reduced-energy diets result in clinically meaningful weight loss regardless of macronutrient composition( Reference Sacks, Bray and Carey 1 ). Moreover, in addition to the effectiveness of the diet, the impact of macronutrients on general health and postprandial satiety is even more important for obesity management.
Dietary manipulations that prolong postprandial sensation of satiety can improve adherence to a restricted-energy diet and long-term outcomes. Hunger ratings and subsequent food intakes in normal-weight subjects have been shown to be reduced following the intake of a protein meal, compared with consumption of carbohydrate and fat meals( Reference Poppitt, McCormack and Buffenstein 2 ). This may be related to higher postprandial circulating glucagon-like peptide-1 (GLP-1) and insulin levels 1–3 h after ingestion of whey protein compared with glucose observed in normal-weight and obese men( Reference Bowen, Noakes and Clifton 3 ). It has also been shown that carbohydrates affecting lower glycaemic and insulinaemic responses prolong satiety sensation( Reference Pawlak, Ebbeling and Ludwig 4 ). The results of a recently published study has also shown that the intake of milk induces greater subjective fullness and less hunger as well as leads to higher GLP-1 and glucose-dependent insulinotropic polypeptide (GIP) concentrations than regular cola intake( Reference Maersk, Belza and Holst 5 ).
The results of previously published studies have revealed an abnormal, attenuated postprandial GLP-1 response in obese subjects, with its improvement following weight reduction( Reference Verdich, Toubro and Buemann 6 ). There is convincing evidence that GLP-1 is one of the meal-induced satiety response mediators. GLP-1 inhibits gastric emptying( Reference Näslund, Barkeling and King 7 ) and the activity of the central nervous system involved in the regulation of satiety( Reference Turton, O'Shea and Gunn 8 ). Similar effects have been observed after administration of liraglutide, a GLP-1 analogue( Reference Rotondo, Janssen and Mulè 9 ). Therefore, GLP-1 analogues are a new class of drugs potentially useful in obesity management. On the other hand, as mentioned above, dietary manipulations may improve the postprandial GLP-1 release and increase adherence to the diet recommendation and improve the effectiveness of the diet. Moreover, the increase in postprandial GLP-1 release is followed by the improvement of glucose homeostasis (incretin action of GLP-1)( Reference Nauck 10 ).
There is a growing body of evidence that GIP is the second key hormone of the incretin axis, involved in the stimulation of postprandial insulin secretion( Reference Nauck 10 ) and the regulation of satiety. However, in contrast to GLP-1, the postprandial GIP level is inversely related to the subsequent feeling of satiety( Reference Raben, Andersen and Christensen 11 , Reference Raben, Tagliabue and Christensen 12 ). In addition, a higher postprandial GIP response after ingestion of a high-fat test meal in post-obese women compared with normal-weight women has been found( Reference Raben, Andersen and Christensen 11 ). Thus, it has been suggested that GIP stimulates hunger sensation and its supra-normal release participates in obesity development( Reference Raben, Andersen and Christensen 11 ). This hypothesis is partially supported by the results obtained by Daousi et al. ( Reference Daousi, Wilding and Aditya 13 ), revealing that healthy normal-weight men but not obese type 2 diabetic subjects have reported higher hunger scores during GIP infusion compared with placebo.
The above-described data were obtained from studies regarding protein or sugar drink administered before consumption of a high-fat or mixed meal. However, there are no data concerning postprandial activity of the incretin axis, insulin secretion and satiety or hunger sensation after ingestion of high-carbohydrate, high-protein and high-fat test meals that are likely to be normally consumed. Moreover, there is a lack of studies assessing the differences between obese and normal-weight subjects in the effect of various macronutrients on the incretin axis and satiety or hunger sensation.
Therefore, the aim of the present study was to assess the effect of dietary macronutrients on postprandial incretin responses and satiety and hunger sensation in obese and normal-weight women.
Experimental methods
A total of twenty young women (eleven obese without co-morbidities and nine healthy normal weight) with a stable weight during at least a 3-month period and not pharmacologically treated were included in the present study. Subjects suffering from Cushing's syndrome, thyroid dysfunctions, hyperandrogenism, type 1 and 2 diabetes and any other diseases including gastrointestinal diseases as well as bariatric surgery procedures were excluded. Additional exclusion criteria were smoking and alcohol consumption. The present study was conducted according to the guidelines laid down in the Declaration of Helsinki, and all procedures involving human subjects were approved by the Bioethical Committee of Medical University of Silesia. The study was conducted after obtaining written informed consent from each participant.
All of the participants were tested within 2 and 6 d of the menstrual cycle. At baseline, anthropometric measurements (body mass, height and waist circumference) were performed and BMI was calculated according to the standard formula: body mass (kg)/height (m2). In addition, body composition was assessed by bioimpedance analysis using the Bodystat 1500 analyser. The characteristics of the study groups are presented in Table 1.
Characteristics of the study groups (Mean values and standard deviations)

GLP-1, glucagon-like peptide-1; GIP, glucose-dependent insulinotropic polypeptide.
Study protocol
Subjects arrived using motorised transportation at the Health Promotion and Obesity Management Unit at 08.30 hours with 1 d intervals between the test meals. After a 16 h overnight fast, the subjects were served carbohydrate, protein and fatty meals at 09.00 hours on the 1st, 3rd and 5th day of the study.
The solid test meals had the same mass and volume but different energy contents. The carbohydrate meal with 874 kJ (209 kcal) of energy consisted of 150 g rice and 50 g stewed apple. This meal consisted of 6 E% (percentage of energy) protein, 1 E% fat and 93 E% carbohydrates, with an energy density of 4·39 kJ/g (1·05 kcal/g). The protein meal with 749 kJ (179 kcal) of energy composed of 150 g low-fat white cheese and 50 g of 2 % yogurt. This meal consisted of 72 E% protein, 9 E% fat and 19 E% carbohydrates, with an energy density of 3·72 kJ/g (0·89 kcal/g). The fatty meal with 3075 kJ (735 kcal) of energy consisted of 100 g mackerel, 50 g mayonnaise and 50 g egg yolk. This meal consisted of 15 E% protein, 84 E% fat and 1 E% carbohydrates, with an energy density of 15·35 kJ/g (3·67 kcal/g). The test meals were prepared directly before serving to the subjects and were administered in the same dish. The consumption of the test meals was controlled by a dietitian. The test meals were not served in random order. Each subject first consumed the carbohydrate meal, second the protein meal and finally the fatty meal.
A computer database of foods from the National Food and Nutrition Institute (Diet 4.0, Polish Food Tables 2005) was used to calculate the energy and macronutrient composition of the test meals.
During the 6 h period after ingestion of the test meals, the subjects did not consume other products, and drank no other fluid than 30 ml of still mineral water.
Venous blood samples (10 ml) were withdrawn from the subjects and sensation of satiety and hunger was measured using a 0–100 mm visual analogue scale in the fasting state and at 15, 60, 120, 180, 240, 300 and 360 min after consumption of the test meals. For analysis of the appetite questionnaire, the distance between the left end of the scale and each mark was measured (mm). The mean response to ‘How hungry do you feel?/How much food would you like to eat now?/How strong do you like eating?’ and ‘How satiating do you feel at the moment?/How satisfied do you feel?/How full do you feel?’ was calculated for each subject and used for subsequent analysis( Reference Raben, Tagliabue and Astrup 14 ).
Laboratory procedures
Venous blood samples were collected directly into Vacutainer tubes (Becton Dickinson) according to the manufacturer's recommendations for the use of their kits. Aliquots of serum and plasma samples were frozen at − 70°C.
Plasma glucose and TAG levels were estimated by colorimetric methods using commercially available test kits (Roche). Serum insulin concentrations were measured by RIA (Diagnostic Product Corporation) with a lower limit of sensitivity of 1·2 μIU/ml (8.6 pmol/l) and intra- and inter-assay CV of 5·0 and 10·0 %, respectively. Plasma GLP-1 and GIP levels were assessed by ELISA (Phoenix Pharmaceuticals, Inc.) with a lower limit of sensitivity of 0·11 and 0·41 ng/ml, respectively, and intra- and inter-assay CV of 5·0–10 and 15·0 %, respectively.
Statistical analysis
All statistical analyses were performed using Statistica 9.0 (StatSoft) and R software (University of Wroclaw). Results are presented as means and standard deviations. The distribution of variables was evaluated by the Shapiro–Wilk test. The homogeneity of variances was assessed by the Levene test. For comparison of data between subjects and controls, Student's t test for independent data was used in the case of a normal distribution or after normalisation. In order to assess changes in the sensation of satiety and hunger as well as hormone concentrations over time after ingestion of the test meals, two-way ANOVA with repeated measures and analysis of contrasts were used. In order to estimate the time to achieve the maximum sensation of satiety and hunger during the test, cubic spline interpolation was used. For each of the profiles, interpolation function was matched and on the basis of which the peak value was determined. For the energy-adjusted assessment of the responses, we divided each subject's value of AUC by the energy of the test meal in kcal (according to group and type of the meal). Correlations between the analysed variables were determined either with Pearson's correlation coefficient in the case of normally distributed data or with Spearman's range correlation coefficient for other data. All tests were two-tailed, with P< 0·05 considered as statistically significant.
Results
Fasting serum glucose, TAG and insulin levels as well as plasma GLP-1 and GIP levels were similar before ingestion of all the test meals in both study groups (Table 1).
Fasting serum glucose and plasma GLP-1 levels did not differ between the obese and normal-weight women, while fasting serum TAG concentrations were higher in obese subjects. Fasting serum insulin level was significantly higher in obese subjects but not in normal-weight subjects during consumption of the carbohydrate test meal than when the fatty test meal was administered. In addition, plasma GIP level was lower in obese subjects than in normal-weight subjects during the days when the carbohydrate and fatty test meals were served (Table 1).
Fasting satiety sensation in both study groups was similar and significantly higher in the obese group than in the normal-weight group during all the study days (Table 1).
Fasting hunger sensation in the obese group was similar on all the study days when the test meals were administered, while fasting hunger sensation in the normal-weight group was significantly higher on the day when the fatty meal was served than on the day of the administration of the carbohydrate meal (78 (sd 17) v. 51 (sd 14) mm; P< 0·05). Throughout the study days, fasting hunger sensation was lower in the obese group than in the normal-weight group (Table 1).
Effect of the test meals on satiety and hunger sensation
The AUCsatiety value in the obese group was significantly higher after ingestion of the fatty test meal compared with after the protein and carbohydrate test meals. However, the AUCsatiety value in the normal-weight group was higher after consumption of the fatty test meal than after the carbohydrate, but not protein, test meal (Table 2).
Effect of the test meals on the sensation of satiety and hunger as well as the levels of hormone release (AUC value) in obese (n 11) and normal-weight (n 9) subjects (Mean values and standard deviations)

GLP-1, glucagon-like peptide-1; GIP, glucose-dependent insulinotropic polypeptide.
Mean value was significantly different from that of the fatty meal: * P< 0·05, *** P< 0·001.
Mean value was significantly different from that of the fatty meal: † P< 0·05, †† P< 0·01, ††† P< 0·001.
Mean value was significantly different from that of the protein meal: ‡ P< 0·05.
The AUCsatiety value was similar after consumption of the carbohydrate and fatty test meals in the obese and normal-weight groups. However, after ingestion of the protein meal, the AUCsatiety value was significantly lower in the obese group than in the normal-weight group (P< 0·05; Fig. 1).
Satiety sensation before and during a 6 h period after the consumption of the high-carbohydrate (![]() ), high-protein (
), high-protein (![]() ) and high-fatty (
) and high-fatty (![]() ) test meals in (a) normal-weight subjects (n 9) and (b) obese subjects (n 11). VAS, visual analogue scale.
) test meals in (a) normal-weight subjects (n 9) and (b) obese subjects (n 11). VAS, visual analogue scale.

There were no differences in the time to achieve the mean maximum sensation of satiety after ingestion of the carbohydrate, protein and fatty test meals between the obese and normal-weight groups (40 (sd 34) v. 36 (sd 18) min; 36 (sd 25) v. 29 (sd 9) min and 34 (sd 18) v. 34 (sd 17) min, respectively). The time to achieve the mean maximum satiety after ingestion of the carbohydrate, protein and fatty test meals was similar in both groups (40 (sd 34) v. 36 (sd 25) v. 34 (sd 18) min and 36 (sd 18) v. 29 (sd 9) v. 34 (sd 17) min, respectively).
The AUChunger value in both groups did not differ significantly after ingestion of the carbohydrate, protein and fatty test meals (Table 2).
The AUChunger value was similar after consumption of the carbohydrate and fatty test meals in the obese and normal-weight groups, while it was significantly higher after ingestion of the protein meal in the obese group (P< 0·05; Fig. 2).
Hunger sensation before and during a 6 h period after consumption of the high-carbohydrate (![]() ), high-protein (
), high-protein (![]() ) and high-fatty (
) and high-fatty (![]() ) test meals in (a) normal-weight subjects (n 9) and (b) obese subjects (n 11). VAS, visual analogue scale.
) test meals in (a) normal-weight subjects (n 9) and (b) obese subjects (n 11). VAS, visual analogue scale.

There were no differences in the time to achieve the minimum sensation of hunger after ingestion of the protein and fatty test meals between the obese and normal-weight groups (25 (sd 7) v. 28 (sd 10) min and 29 (sd 15) min v. 30 (sd 12) min, respectively), while the time to achieve the minimum sensation of hunger after consumption of the carbohydrate test meal was significantly shorter in the obese group (19 (sd 13) v. 51 (sd 26) min, P< 0·001). Additionally, in the normal-weight group only, the minimum hunger sensation after carbohydrate was significantly longer than after protein and fatty test meal ingestion (51 (sd 26) v. 28 (sd 10) min; P< 0·05 and 51 (sd 26) v. 30 (sd 12) min; P< 0·05, respectively).
The analysis of the changes in postprandial sensation of satiety and hunger based on consumed energy did not affect the results.
Effect of the test meals on the levels of hormone release
The AUCtotal insulin value in the obese group was increased after consumption of the protein and carbohydrate test meals compared with the fatty test meal; however, it was similar after ingestion of the protein and carbohydrate test meals. While in the normal-weight group, the AUCtotal insulin value was increased only after the ingestion of the carbohydrate test meal compared with the fatty test meal and did not differ after the intake of the carbohydrate and protein test meals as well as the protein and fatty test meals (Table 2). However, the AUCtotal insulin value was significantly increased in obese women compared with normal-weight women only after ingestion of the carbohydrate test meal (P< 0·05; Fig. 3).
Serum insulin concentrations before and during a 6 h period after consumption of the high-carbohydrate (![]() ), high-protein (
), high-protein (![]() ) and high-fatty (
) and high-fatty (![]() ) test meals in (a, c) normal-weight subjects (n 9) and (b, d) obese subjects (n 11). (a, b) Row and (c, d) energy-adjusted data.
) test meals in (a, c) normal-weight subjects (n 9) and (b, d) obese subjects (n 11). (a, b) Row and (c, d) energy-adjusted data.

There were no significant differences in the values of AUCtotal GLP-1 after ingestion of the carbohydrate and protein test meals in relation to the fatty test meal in both obese and normal-weight groups (Table 2). The AUCtotal GLP-1 value was significantly decreased in obese women than in normal-weight women only after ingestion of the fatty test meal (P< 0·05; Fig. 4).
Plasma glucagon-like peptide-1 (GLP-1) concentrations before and during a 6 h period after consumption of the high-carbohydrate (![]() ), high-protein (
), high-protein (![]() ) and high-fatty (
) and high-fatty (![]() ) test meals in (a, c) normal-weight subjects (n 9) and (b, d) obese subjects (n 11). (a, b) Row and (c, d) energy-adjusted data.
) test meals in (a, c) normal-weight subjects (n 9) and (b, d) obese subjects (n 11). (a, b) Row and (c, d) energy-adjusted data.

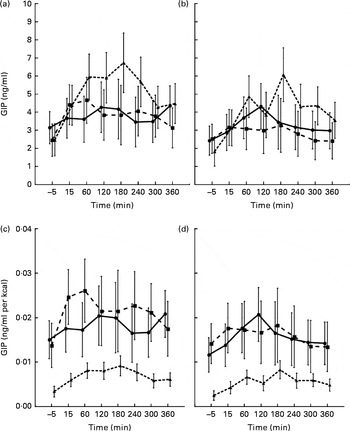
In both groups, the AUCtotal GIP values were similar after consumption of the carbohydrate and protein test meals. Moreover, there were no differences between the values of AUCtotal GIP after ingestion of the carbohydrate and fatty test meals in obese women. While in the normal-weight group, the AUCtotal GIP value was decreased after consumption of the carbohydrate test meal compared with that of the fatty test meal. Furthermore, the AUCtotal GIP value was decreased after ingestion of the protein test meal compared with the fatty test meal in both groups (Table 2). Additionally, the AUCtotal GIP value was lower in obese women than in normal-weight women after consumption of all the test meals (all P< 0·05; Fig. 5).
Plasma glucose-dependent insulinotropic polypeptide (GIP) concentrations before and during a 6 h period after consumption of the high-carbohydrate (![]() ), high-protein (
), high-protein (![]() ) and high-fatty (
) and high-fatty (![]() ) test meals in (a, c) normal-weight subjects (n 9) and (b, d) obese subjects (n 11). (a, b) Row and (c, d) energy-adjusted data.
) test meals in (a, c) normal-weight subjects (n 9) and (b, d) obese subjects (n 11). (a, b) Row and (c, d) energy-adjusted data.
Effect of the test meals on the levels of hormone release after conversion for consumed energy
The AUCtotal insulin value in both groups was increased after consumption of the protein and carbohydrate test meals compared with the fatty test meal; however, it was similar after ingestion of the protein and carbohydrate test meals (Table 2). There were no significant differences in the values of AUCtotal insulin between the obese and normal-weight women for any of the test meals consumed (Fig. 3).
AUCtotal GLP-1 in the obese group was more increased after protein and carbohydrate than fatty and after protein than carbohydrate test meal consumption. In the normal-weight group, AUCtotal GLP-1 value was increased after consumption of the protein and carbohydrate test meals compared with that of the fatty test meal; however, it was similar after ingestion of the protein and carbohydrate test meals (Table 2). The AUCtotal GLP-1 value was significantly decreased only after ingestion of the fatty test meal in obese women compared with normal-weight women (P< 0·05; Fig. 4).
The AUCtotal GIP value in both groups was more increased after than protein and carbohydrate fatty test than fatty test meal consumption, but similar after protein and carbohydrate ingestion (Table 2). The AUCtotal GIP value was significantly decreased only after ingestion of the protein test meal in obese women compared with normal-weight women (P< 0·05; Fig. 5).
Associations between intestinal hormones and the sensation of satiety and hunger
After consumption of the fatty meal, a significant positive correlation between the maximum sensation of satiety and the AUCtotal GLP-1 value (R 0·91; P< 0·001) in the obese group and that between the minimum sensation of hunger and the AUCtotal GLP-1 value (R 0·83; P< 0·01) in the normal-weight women were observed.
When the postprandial satiety and hunger sensation was converted for consumed meal energy after ingestion of the carbohydrate and protein test meals in the obese group, a positive correlation between the AUCsatiety and AUCtotal insulin values (R 0·64; P< 0·05 and R 0·68; P< 0·05, respectively) was found. However, after consumption of the carbohydrate test meal, a negative correlation between the AUChunger and AUCtotal insulin values (R − 0·66; P< 0·05) was observed in the normal-weight group. Moreover, after ingestion of the fatty test meal, a positive correlation between the AUChunger and AUCtotal GLP-1 values (R 0·62; P< 0·05) in the obese group and that between the AUCsatiety and AUCtotal insulin values (R 0·71; P< 0·05) in the normal-weight group were observed.
Discussion
This is the first study to assess the influence of high-carbohydrate, high-protein and high-fat test meals that are likely to be normally consumed on the postprandial activity of the incretin axis, insulin secretion and satiety or hunger sensation in obese and normal-weight women.
Fasting satiety sensation in both study groups was similar during all the study days when the test meals were administered. However, it should be emphasised that fasting satiety sensation was significantly higher and fasting hunger sensation was significantly lower in obese women than in normal-weight women. This may be due to the effect of long-term improper eating habits.
As the perception of the subjective sensation of satiety could be affected by meal visualisation and the awareness of its quantity, the participants were not informed about the mass of the test meal. All the meals had the same mass and were served in the same dish. The decision for administration of the test meals with the equal mass, but not volume or energy content, was due to technical difficulties in maintaining a similar volume and energy content of the solid test meals with the predominant amount of various macronutrients. Maintaining the same energy content of the test meals would result in a very small volume and mass of the fatty meal that could affect the subjective sensation of satiety even more than energy density. It should also be noted that the results of previous studies did not establish a consensus on which test meal parameter has the greatest impact on postprandial subjective sensation of satiety. Some studies have shown that energy content has the greatest impact( Reference Kirkmeyer and Mattes 15 ), while others have suggested meal volume( Reference Norton, Anderson and Hetherington 16 ) as well as the meal texture and portion size( Reference Leidy, Apolzan and Mattes 17 ) as playing the predominant role. The present results partially support the latter findings because the mean maximum satiety after ingestion of the carbohydrate, protein and fatty test meals was achieved in a similar time in both obese and normal-weight groups. Moreover, it should be emphasised that the analysis of the changes in sensation of satiety corrected for energy consumed did not affect the results. There was no difference in the time to achieve the mean maximum sensation of satiety after consumption of all the test meals between the obese and normal-weight women. Novel important results of the present study are the differences between the study groups in the time to achieve the minimum sensation of hunger after ingestion of the carbohydrate meal compared with the protein or fatty meal. The time to achieve the minimum sensation of hunger was shorter in obese women and longer in normal-weight women, while it was similar after consumption of the protein and fatty meals in both the obese and normal-weight groups.
In the obese group, the AUCsatiety value was significantly increased after ingestion of the fatty test meal compared with the protein and carbohydrate test meals. However, in the normal-weight group, a higher AUCsatiety value was observed only after consumption of the fatty test meal than the carbohydrate meal. Interestingly, in both study groups, the AUChunger value did not differ after ingestion of all the test meals. It should also be stressed that both AUCsatiety and AUChunger values after consumption of the carbohydrate and fatty test meals in the obese and normal-weight groups were similar. However, the AUCsatiety value was low after consumption of the protein test meal and the AUChunger value was high in obese women. These results are in accordance with those described by Cecil et al. ( Reference Cecil, Francis and Read 18 ), showing that ingestion of a high-fat soup suppressed hunger, induced fullness and slowed gastric emptying more than a high-carbohydrate soup and also tended to be more effective at reducing energy intake from the test meal. However, these authors have also revealed that orosensory stimulation induced by nutrients plays an important role in the regulation of appetite. In this context, we hypothesised that lower sensation of satiety after the protein meal in obese women than in normal-weight women is the consequence of differences in orosensory stimulation. The role of the palatability of the test meal but not energy consumed has also been confirmed by another study( Reference Yeomans, Lee and Gray 19 ). In addition, it should be emphasised that the analysis of the changes in postprandial sensation of satiety and hunger corrected for consumed energy in the present study did not affect the results.
In the present study, fasting serum insulin levels in obese and normal-weight women were similar. In accordance with the results of a previously published study( Reference Collier, McLean and O'Dea 20 ), we observed a lower impact of fatty meals compared with carbohydrate meals on the postprandial insulin response in both groups independent of energy consumed. It is interesting to note that only in normal-weight women, the intake of the carbohydrate meal being stronger than the protein meal stimulated the postprandial insulin response, while in obese women, the postprandial insulin response was higher after the ingestion of the protein meal than the fatty meal. However, after correcting these data for energy consumed, a higher postprandial insulin response after the intake of the protein meal compared with the fatty meal was observed in both study groups. In addition, it should be emphasised that the postprandial insulin response was significantly higher only after ingestion of the carbohydrate test meal in obese women than in normal-weight women. However, after correcting these data for energy consumed, these differences disappeared. Thus, the present results suggest that the postprandial insulin response is dependent on consumed energy only after the intake of the protein meal in the normal-weight group.
In contrast to previous studies, we did not observe any differences in fasting plasma GLP-1 levels between obese and normal-weight women( Reference Ranganath, Beety and Morgan 21 ). Furthermore, an attenuated postprandial GLP-1 response after ingestion of the mixed meal has been found in obese subjects( Reference Verdich, Toubro and Buemann 6 , Reference Nauck 10 – Reference Raben, Tagliabue and Christensen 12 ). However, we observed an attenuated postprandial GLP-1 response after consumption of the fatty test meal in both study groups, independent of energy consumed. However, after correcting these data for energy consumed, a lower postprandial GLP-1 response after the intake of the carbohydrate meal than that of the protein meal was found only in the obese group. These results are in line with those reported by Ranganath et al. ( Reference Ranganath, Beety and Morgan 21 ), indicating that the attenuated response was observed in the obese group only after the ingestion of a carbohydrate meal. Moreover, Ranganath et al. ( Reference Ranganath, Beety and Morgan 21 ) suggested that the factor that inhibits the postprandial GLP-1 release after consumption of fatty meals is the high level of circulating NEFA. Thus, fatty test meals of different compositions and varied postprandial circulating NEFA levels may affect the GLP-1 release to a different extent. This hypothesis is supported by the results obtained by Maffeis et al. ( Reference Maffeis, Surano and Cordioli 22 ) who showed that a meal with a higher fat content than with a lower fat level stimulates the postprandial GLP-1 response in obese boys. Thus, we suggest that the duration of obesity and consumption long-term of a high-fat diet impair the postprandial GLP-1 response after the intake of a high-fat meal.
We failed to find, as described previously, a stronger postprandial GLP-1 stimulation by carbohydrate meals in both obese and normal-weight women( Reference Rijkelijkhuizen, McQuarrie and Girman 23 ). Perhaps this is due to the different types of carbohydrates used in the test meals. This hypothesis is supported by the results of a previously published study revealing different GLP-1 responses after the ingestion of various protein( Reference Poppitt, McCormack and Buffenstein 2 ) and fat( Reference Thomsen, Rasmussen and Lousen 24 ) meals. In accordance with these results, Soenen & Westerterp-Plantenga( Reference Soenen and Westerterp-Plantenga 25 ) observed a similar effect of carbohydrate and protein meals on the postprandial GLP-1 response in normal-weight subjects. Furthermore, it has been reported that intake of semi-skimmed milk being stronger than sweetened soft drink stimulates the GLP-1 response in obese individuals( Reference Pawlak, Ebbeling and Ludwig 4 ). The results support the above-described hypothesis of the present study that attenuation of the postprandial GLP-1 response is associated with the duration of obesity and is its consequence.
As mentioned previously( Reference Sarson, Kopelman and Besterman 26 ), we found similar fasting plasma GIP levels in obese and normal-weight subjects before administration of the protein meal. In the two other days (before the carbohydrate and fatty test meals), fasting plasma GIP levels were lower in the obese group, suggesting a high level of variability in GIP secretion and the long-term effects of food intake on the previous day.
In the present study, the postprandial GIP response in obese women was similar after consumption of the carbohydrate, protein and fatty test meals. However, in normal-weight women, consumption of the carbohydrate meal being less than that of the fatty meal stimulated the postprandial GIP response. However, after correcting for energy consumed, both carbohydrate and protein meals increased the postprandial GIP response strongly than the fatty meal, and the response was similar after consumption of the carbohydrate and protein meals in both obese and normal-weight women. These results contradict those obtained by Elliot et al. ( Reference Elliott, Morgan and Tredger 27 ), revealing a similar effect of carbohydrate and fatty meals on the postprandial GIP response in young healthy men, while protein meals exhibited only a minimal effect. In addition, an increase in the GIP response after the intake of a high-fat meal compared with a carbohydrate meal has been described in obese subjects before and after weight loss( Reference Jones, Owens and Luzio 28 ), type 2 diabetics and healthy subjects( Reference Maffeis, Surano and Cordioli 22 ). It has also been reported that intake of semi-skimmed milk being stronger than that of sweetened soft drink stimulates the GIP response in obese subjects( Reference Maersk, Belza and Holst 5 ). The differences are difficult to explain because Ebert et al. ( Reference Ebert and Creutzfeldt 29 ) revealed that in obese individuals, the GIP response is associated with a higher meal energy content and meal volume. However, in the present study, the effect of a high-energy meal was associated with a lower postprandial GIP response independent of body mass. Thus, the present results do not support the hypothesis reported by Ebert et al. ( Reference Ebert and Creutzfeldt 29 ) suggesting that it is the effect of an attenuated gastric emptying rate after the intake of a fatty meal in the obese group. However, it cannot be ruled out that the differences are the consequences of various carbohydrates and fat used to prepare test meals and different methods used to determine the concentration of GIP.
The normal( Reference Verdich, Toubro and Buemann 6 , Reference Sarson, Kopelman and Besterman 26 ), increased( Reference Elliott, Morgan and Tredger 27 ) or attenuated( Reference Ebert and Creutzfeldt 29 ) postprandial GIP response was described in obese subjects. In the present study, the postprandial GIP response was attenuated in obese women compared with normal-weight women after ingestion of all the test meals. However, after correcting for energy consumed, the lower postprandial GIP response in obese women was observed only after ingestion of the protein meal.
We did not observe an association between BMI and the postprandial GIP response. Thus, the attenuated postprandial GIP response seems to be an early defect of the incretin axis in obese subjects and a potential mechanism preventing the increased postprandial glucagon release during the development of insulin resistance partially dependent on energy and macronutrient intakes. Moreover, we suggest that attenuated postprandial GIP response is influenced by the habitual diet composition and energy balance as well as the duration of obesity( Reference Thomsen, Rasmussen and Lousen 24 ).
It should be emphasised that the postprandial GLP-1 response was associated with the maximum sensation of satiety in obese women and with the minimum sensation of hunger in the normal-weight group only after ingestion of the fatty test meal. However, after correction of the postprandial sensation of satiety and hunger for meal energy consumed, the postprandial sensation of satiety was proportional to the insulin response after ingestion of the carbohydrate and protein meals in obese women, while postprandial sensation of hunger was inversely proportional to the insulin response after consumption of the carbohydrate meal in the normal-weight group. Moreover, after consumption of the fatty meal, the postprandial sensation of hunger was proportional to the GLP-1 response in obese women, while the postprandial sensation of satiety was proportional to the insulin response in normal-weight women. It suggests that insulin and GLP-1 are only some of the factors influencing postprandial satiety fullness. In addition, the differences between the obese and normal-weight women indicate that visual and orosensory stimulation as well as individual attitude to the meal play an important role in this partially subjective sensation. This hypothesis is supported by the results obtained by Lemmens et al. ( Reference Lemmens, Martens and Kester 30 ), revealing that circulating insulin and gut hormone levels explained 40–70 % of the variation in visual analogue scale scores.
The limitation of the present study is the size of the enrolled groups and the enrolment of women exclusively. As we did not include men in the study, the analysed group was more homogeneous. The different energy contents of the test meals and the absence of the test meals with a high fibre content, as well as the lack of the assessment of daily energy consumption after each test meal and the determination of gastric empting are further limitations of the study. Furthermore, the test meals were not administered in random order, as we expected that the fatty test meal would discourage normal-weight women from continuing to participate in the study. Therefore, this meal was served last. Moreover, AUC is only a rough estimation of the integrated changes in plasma GLP-1 and GIP levels, due to long intervals between blood sampling collections and the possible pulsatile GLP-1 and GIP release. Furthermore, peripheral plasma GLP-1 level may not be an adequate measure of the GLP-1 release because it has been shown that about 50 % of the newly secreted GLP-1 from the intestinal L-cells is metabolised when passing from the intestinal stroma into the capillary bed( Reference Hansen, Deacon and Ørskov 31 ).
Conclusions
The findings of the present study suggest that: (1) subjective factors such as visual and orosensory stimulation as well as individual attitude to the meal, not assessed in the present study, are more important than meal energy and macronutrient contents for postprandial sensation of satiety and hunger; (2) satiety sensation after consumption of carbohydrate and protein meals in obese women is related to the postprandial insulin response, while it is related to the postprandial GLP-1 release after consumption of a fatty meal; (3) the postprandial GIP release does not influence satiety and hunger sensation in both obese and normal-weight women; (4) the reduced GLP-1 release after consumption of a fatty meal in obese women may explain the impaired sensation of satiety; (5) the impaired postprandial GIP release may be the early indicator of incretin axis dysfunction in obese women.
Acknowledgements
The authors thank Maria Bożentowicz-Wikarek and Aniceta Brzozowska for their assistance and technical support, Grażyna Wrosz for preparing the test meals and Mike Smertka, for language corrections. The study was funded by the National Science Center (project no. 4566/B/P01/2010/39).
The authors’ contributions are as follows: T. W. conducted the experiment, collected the data and wrote the manuscript; J. C. was involved in data analyses and helped in the drafting of the manuscript; A. O. participated in the design of the study and performed the statistical analysis; M. O.-G. conceived the study, participated in its design and coordination and helped in the drafting of the manuscript. All authors read and approved the final manuscript.
The authors have no conflict of interest to disclose.


