


1. Introduction
Suspension flows of spherical particles in a Newtonian fluid pertain to a wide range of applications, including biomedical, industrial and geographical applications. Such flows represent generally chaotic dynamical systems (Drazer et al. Reference Drazer, Koplik, Khusid and Acrivos2002), with the particles undergoing irreversible migration from an initial configuration to a final, steady-state configuration. Mechanisms for particle or droplet migration across streamlines may be exploited for passive sorting in typical duct-like microfluidic channels (Marnoto & Hashmi Reference Marnoto and Hashmi2023).
The role of particle contacts and surface roughness in non-Brownian suspensions is a topic of current interest as it relates to the particles’ irreversible migration at low Reynolds number in a shear flow. Particle surface roughness results in an inherent irreversibility in the particles’ relative motion as the particles are displaced across streamlines, and also modifies the pair distribution function between particles (Rampall, Smart & Leighton Reference Rampall, Smart and Leighton1997; Ingber et al. Reference Ingber, Mammoli, Vorobieff, McCollam and Graham2006; Blanc, Peters & Lemaire Reference Blanc, Peters and Lemaire2011). It has been shown that neither the long-range hydrodynamic interactions (Metzger & Butler Reference Metzger and Butler2010) nor the lubrication forces (Metzger, Pham & Butler Reference Metzger, Pham and Butler2013) contribute significantly to the irreversibility. However, the particle surface roughness plays a key role in such dynamics (Corte et al. Reference Corte, Chaikin, Gollub and Pine2008; Pham, Metzger & Butler Reference Pham, Metzger and Butler2015; Zhang et al. Reference Zhang, Pham, Metzger, Kopelevich and Butler2023) and can also impact directly the bulk rheological properties of non-Brownian suspensions (More & Ardekani Reference More and Ardekani2020). Pine et al. (Reference Pine, Gollub, Brady and Leshansky2005) discovered that there is a critical strain amplitude for a given volume fraction below which the particle locations are reversible in oscillating flow. Above this critical strain amplitude, chaos sets in. This critical strain amplitude is quite sensitive to the volume fraction, with irreversible behaviour being more difficult to achieve with low volume fractions. Pham, Butler & Metzger (Reference Pham, Butler and Metzger2016) found that smoother particles lead to a higher critical strain amplitude, and predicted the critical strain as a function of the particle surface roughness, although very recent work has shown the role of particle roughness in irreversibility to be more subtle (Zhang et al. Reference Zhang, Pham, Metzger, Kopelevich and Butler2023). The critical strain amplitude has been explored further in flows with clouds of particles in an oscillating shear flow. The clouds are shown to extend until the volume fraction is less than the critical volume fraction for irreversibility at a given strain amplitude (Metzger & Butler Reference Metzger and Butler2012; Howard & Maxey Reference Howard and Maxey2018). The vast majority of prior experimental and numerical works have focused only on the simplest possible flow geometries, either flow between parallel plates or circular pipe flow, and typically in scenarios where the particles are much smaller than the confining geometry. Taking a first step towards extending our understanding of particle migration behaviours and irreversibility to more general geometries with non-uniform shear in multiple directions and to scenarios where confinement effects are important is the primary goal of this work.
Information about suspension flows comes from simulations and experiments. Simulations are costly, and quantities such as the particle surface roughness are represented by approximations such as an interparticle contact barrier. While simulations have been shown to capture experiments accurately (Maxey Reference Maxey2017), there is still a need for highly resolved experiments that can track particle locations. A number of experiments have been performed (Snook, Butler & Guazelli Reference Snook, Butler and Guazelli2015; Guasto, Ross & Gollub Reference Guasto, Ross and Gollub2010; Pham et al. Reference Pham, Butler and Metzger2016) that use a laser sheet to image a slice of the suspension. This technique requires the suspending fluid to be index-matched to the particles, and complete trajectories are unavailable because particles are lost from view once they leave the laser plane. Laser-Doppler velocimetry (LDV) has also been used to achieve high-resolution measurements of particle velocity and concentration (Lyon & Leal Reference Lyon and Leal1998a, Reference Lyon and Lealb), but the one-dimensional nature of LDV prohibits simultaneous capture of the entire flow. Magnetic resonance imaging (MRI) can provide three-dimensional (3-D) measurements of suspensions that are optically opaque and hence is well suited to suspensions in porous media (Mirbod & Shapley Reference Mirbod and Shapley2023). However, individual particles cannot be tracked because of the relatively low resolution of MRI. Single-camera refraction-based methods have been developed previously and applied to multiphase flows in the reconstruction of the 3-D shape of fluid interfaces (Moisy, Rabaud & Salsac Reference Moisy, Rabaud and Salsac2009; Kilbride et al. Reference Kilbride, Fagg, Ouali and Fairhurst2023); however, to the best of our knowledge, similar ideas have not previously been adapted to suspension flows. Although high-resolution two-dimensional (2-D) trajectory measurements have been performed previously to study irreversible dynamics in very small numbers of particles (Pham et al. Reference Pham, Metzger and Butler2015), we believe that our work is the first to provide such experimental data in a 3-D random suspension of many particles, enabled directly by our new tracking technique.
In this work, we study experimentally the migration of spherical particles suspended in a viscous fluid subjected to an oscillatory pressure-driven duct flow. Extended 3-D particle trajectories are resolved with a single camera by implementing a refraction-based imaging technique capable of capturing particle motion in the out-of-plane direction. Although relatively low volume fractions are considered in this work, nevertheless we observe significant migration in both dimensions of the cross-section. We report measurements of the migration dynamics and steady-state particle distributions for different packing fractions and strain amplitudes, and quantitatively associate particle proximity during each cycle with the measured irreversibility. Our results are also compared directly with new numerical predictions of a highly confined suspension flowing steadily between parallel plates.
2. Experiments
The particles used in our experiments are optically clear acrylic (PMMA) spheres with diameter  $1.598 \pm 0.009$ mm and root-mean-square (r.m.s.) surface roughness $0.08 \pm 0.03\,\mathrm {\mu }{\rm m}$. They are suspended in a water–glycerol mixture with Newtonian viscosity $36.3 \pm 1.8$ cP (Cheng Reference Cheng2008) filling a 300 mm long borosilicate glass test channel (VitroCom R0309, rectangular internal cross-section $3\times 9$ mm). The mixture ratio is chosen such that the particles are neutrally buoyant, each with density $1.179 \pm 0.003\,{\rm g}\,{\rm ml}^{-1}$. The 3 mm channel height is just less than two particle diameters, preventing complete particle overlap. The 9 mm channel width was selected to be small enough so that a significant shear gradient would be present across the entire $x$-direction, and wide enough to allow particles to move a few diameters away from the side walls. Experiments performed by Guasto et al. (Reference Guasto, Ross and Gollub2010) use the same channel aspect ratio, though in their case the particle size to channel depth ratio is far smaller, and only a single central plane is imaged, with the intent of approximating a 2-D flow. The complete experimental set-up is shown in figure 1, and dimensional and non-dimensional parameters are summarized in table 1. The glass test channel is oriented vertically and attached to a laser cut stand by screw-adjustable mounts. The 3-D-printed end caps with flow orifices ensure that the particles remain in the channel and adapt the ends of the channel to hoses. The upper hose goes to a reservoir of suspending fluid that is open to the atmosphere, and the bottom hose attaches to a syringe pump (Harvard Apparatus Pump 11 Elite).
(a) A diagram of the channel assembly, along with a magnified view of the rectangular glass channel and speckle pattern positioning. The channel cross-section is 3 mm ( $y$-direction) $\times$ 9 mm ( $x$-direction). (b) A photograph of the complete experimental set-up.

Relevant parameters and their ranges of values in our experimental study.

A back light panel (3 W LED tracing pad) illuminates the test section. We generate speckle patterns using the Rosta algorithm implementation (dot size 1, density 0.3, and zero smoothing) in the  $\mathrm {\mu }$DIC Python library (Olufsen, Andersen & Fagerholt Reference Olufsen, Andersen and Fagerholt2019), which are then inkjet-printed with $1200 \times 2400$ dots per inch resolution on transparency film. The pattern is fastened to the channel with a transparent acrylic clamping block. An Allied Vision Mako 503B monochrome CMOS camera with 105 mm micro Nikkor lens is used for imaging the suspension at a 1 Hz frame rate and $2592 \times 610$ resolution. The camera is placed at a working distance of approximately 1 m, resulting in a 40 mm by 10 mm imaged section. Hence lens distortion is minimized and the incident rays from the camera can be assumed to be parallel. The outlets of the channel are 130 mm away from the imaged section so entry length effects can be neglected.
We prepare particle suspensions with nominal bulk particle volume fractions  ${\phi _B'} = 0.07$, $0.11$ and 0.14. The corresponding nominal bulk area fractions $\phi _A'$ – defined as the area of the experimental image that would be filled with particles assuming no overlap – are 0.2, 0.3 and 0.4. Similar bulk area fraction values have been used previously in simulations of a monolayer suspension (Nott & Brady Reference Nott and Brady1994). A magnetic 3-D-printed plough-shaped particle pusher is used to set manually the initial particle distribution in the channel by guiding it with a handheld magnet outside the channel. The geometry of the pusher is such that the particles are driven to the channel walls in the $x$-direction and to the channel centre ( $y=h/2$) in the $y$-direction. However, we observe that the particles quickly migrate towards the walls along the $y$-direction once the experiment starts. Since the manual particle arrangement process produces some heterogeneity in the particle distribution, the measured bulk volume fraction $\phi _B$ in the field of view (averaged over all frames of the experiment) is slightly different from the nominal $\phi _B'$ and takes values ranging from 0.06 to 0.12.
During the experiment, the syringe pump generates oscillatory flow in a square wave, prescribing the volumetric flow rate  $Q$ to be
 \begin{equation} Q(t) = \frac{\gamma w^2 h}{T}\,\frac{\sin(2 {\rm \pi}t / T)}{|{\sin(2 {\rm \pi}t / T)}|}, \end{equation}
where  $T$ is the flow oscillation period. The strain amplitude $\gamma$ is the average displacement of a fluid parcel over a half-cycle $T/2$ divided by the channel half-width $w/2$. We perform experiments with $\gamma =6$ up to an accumulated strain of 550 (46 oscillation cycles) and with $\gamma =1$ to an accumulated strain of 1100 (550 oscillation cycles). The period $T$ is chosen to maintain a particle Reynolds number of 0.016. Initial experiments performed at Reynolds number 0.008 produced indistinguishable suspension dynamics. Experiments were also performed with a single particle in the channel showing fully reversible motion in three dimensions, regardless of its initial position.
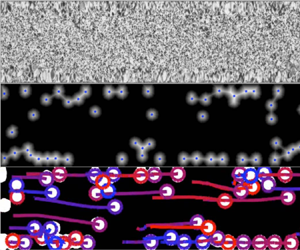
Prior to each experiment, a particle-free reference image of the speckle pattern is taken. Then, throughout the experiment, a series of photographs of the test section with particles are captured. Figure 2(a) outlines the image-processing steps, which include background subtraction (Zivkovic Reference Zivkovic2004), filtering with morphological operations, and determining 2-D particle positions with the Euclidean distance transform and h-maxima filter (Vincent Reference Vincent1993). The out-of-plane  $y$-component of each particle's position may be inferred by comparing the reference and particle images, since the speckle pattern in the particle image will be distorted depending on the particles’ positions. Figure 2(b) illustrates the working principle of this particle tracking technique. The incident rays from the camera refract at the fluid–particle interfaces and focus as they reach the pattern attached to the outside of the channel. As seen in the photographs corresponding to each particle height, increasing the $y$-component of the particle position has the approximate effect of increasing the magnification of the pattern. By applying Snell's law at each optical interface in this axisymmetric geometry (Hecht Reference Hecht2012), an analytical expression may be constructed that predicts the observed distortion of the reference pattern through the transparent particle. For the case of partially overlapping particles, the distortion is determined numerically by propagating recursively each incident ray from the camera through the cluster of particles until it reaches the speckle pattern. The particle's position is then determined by solving the inverse problem illustrated in figure 2(c): given a reference image $I_r$ of the pattern and the resulting particle image $I_p$, we find a position $\boldsymbol {r}$ for the particle that reproduces the observed distortion by maximizing the cross-correlation between regions $J$ and $D_p$. We use the Nelder–Mead algorithm (Nelder & Mead Reference Nelder and Mead1965) in the NLopt library (Johnson Reference Johnson2021) to optimize the cross-correlation. The OpenCV library (Bradski Reference Bradski2000) for C++ is used to implement the image transformations and cross-correlations. The tracking method requires calibration in order to determine precisely the refraction indices of the particles, fluid and channel walls. A calibration device was constructed by attaching a particle on a thin wire to a high-precision translation stage. The particle may then be moved to known $y$-positions across the height of the channel while capturing images of the distorted speckle pattern. Using the algorithms described, the particle positions are measured from each image, and the refraction indices are adjusted in order to minimize the sum of squared residuals between the actual particle position and the measured position. After calibration, the translation stage was used again to determine independently the accuracy of the tracking method. Using a number of different particles at various locations in the field of view, the comparison between the measured height and the actual height reveals excellent agreement (figure 2d). Over the full measurement range, the particle's $y$-position can be determined to within $157\,\mathrm {\mu }{\rm m}$ or 5.23 % of the channel height with 95 % confidence. The final processing step is to link the 3-D particle positions into trajectories using the Crocker & Grier (Reference Crocker and Grier1996) algorithm in the open-source library Trackpy (Allan et al. Reference Allan, Caswell, Keim, van der Wel and Verweij2021) so that each particle's identity is known throughout multiple frames, with the result shown in the ‘Tracking’ panel of figure 2(a).
(a) Example images of the channel test section at each step of the processing procedure. The tails in the ‘Tracking’ image illustrate how each particle's position has evolved from the initial state in the previous images, with the colouring indicating the  $y$-position over time. (b) Cross-sectional diagram of the channel labelled with relevant dimensions. Incident rays from the camera at $p$ are propagated based on the refraction model to $R(p;\boldsymbol {r})$ for particles at different heights. Experimental images of particles over a regular $200 \,\mathrm {\mu }{\rm m}$ grid pattern at the different heights are shown below. (c) The reference image $I_r$ is transformed based on the refraction model and the guessed particle position $\boldsymbol {r}$. The result in $J$ is compared with the corresponding region $D_p$ in the particle image $I_p$ using the cross-correlation. (d) Histogram of particle height measurement errors from 120 data points taken at 12 evenly spaced known positions in $y$.
$y$.

3. Simulations
To compare with the experiments, we also completed a limited set of simulations using the force coupling method (FCM) (Yeo & Maxey Reference Yeo and Maxey2010, Reference Yeo and Maxey2011). Due to computational limitations, the simulations are completed with a single set of walls located at  $y = 0$ and $y=4a$, representing a very narrow channel (corresponding to channel height $h=4a$), and are periodic in the streamwise ( $z$) and spanwise ( $x$) directions. The simulations are scaled by the particle radius $a=1$. To set up the simulations, the particles are seeded randomly in the channel to reach the proper area fraction. The particles are first seeded with radius $0.85a$ and then ‘inflated’ to reach radius $a = 1$ with a molecular dynamics simulation. In doing this work, we experimented with different methods of seeding the particles to match the experimental results. With simulations, it is possible to seed the particles in a perfect monolayer, located at the channel half-height $y =2a$. However, this does not match the experiments, because the simulation particles are not subject to noise in their location, and therefore would remain in a monolayer for an unphysically long time. Instead, we seed the particles in a ‘pseudo-monolayer’, or a noisy monolayer. The particles are seeded with average $y$-location at $y=2a$ and a standard deviation of $0.05a$. The minimum $y$ value for $\phi _B = 0.14$ is $1.833a$, and the maximum $y$ value is $2.221a$ at the beginning of the simulation. This way, the particles begin close to the centre of the channel, but particle interactions allow the particles to migrate in the cross-stream ( $y$) direction. The channel width is $w = 30a$, and the channel length is $l = 60a$, which results in a total of $115$ particles for $\phi _B = 0.07$, $172$ particles for $\phi _B = 0.11$, and $230$ particles for $\phi _B = 0.14$.
The flow is driven by a pressure gradient  $\partial p / \partial z = 0.5$. Because the strain amplitude in the experiments is calculated using the $x$-direction length scales, we calculate the accumulated strain as $\gamma _a = 2\langle u_z \rangle t / (11 a)$, where the scaling factor $11$ is chosen to approximate the experimental strain amplitude scaling factor $w$.
$w$.
The simulations use a time step of  $\Delta t = 0.005$. To approximate the particle surface roughness, we use a short-range contact barrier that disrupts the symmetry in particle interactions and computationally prevents the particles from overlapping. The contact force between particles $\alpha$ and $\beta$, with centres $\boldsymbol {r}^{\alpha }$ and $\boldsymbol {r}^{\beta }$, acts along the line of centres of the particles and is given by
 \begin{equation} \boldsymbol{F}^{\alpha \beta}_P = \left\{ \begin{array}{@{}ll} \displaystyle -6{\rm \pi} \mu a V_{ref} \left( \dfrac{R_{ref}^2-|\boldsymbol{r}|^2}{R_{ref}^2-4 a^2} \right)^6 \dfrac{\boldsymbol{r}}{|\boldsymbol{r}|} & \text{if} \ |\boldsymbol{r}| < R_{ref},\\ \displaystyle 0 & \mbox{otherwise}, \end{array}\right. \end{equation}
in which  $\boldsymbol {r} = \boldsymbol {r}^\beta - \boldsymbol {r}^\alpha$ and $R_{ref} = 2.01a$ is the cut-off distance (Yeo & Maxey Reference Yeo and Maxey2010, Reference Yeo and Maxey2011). The relationship between the contact force reference values and the pressure gradient driving the flow sets the minimum separation between particles; $V_{ref}=200$ is a constant chosen so that the minimum gap between two particles is approximately $0.005a$. Particles separated by a distance of less than $0.01a$ are considered to be in contact. The contact force between a particle $\alpha$ with centre $\boldsymbol {r}^{\alpha }$ and a wall is given by
 \begin{equation} \boldsymbol{F}^{\alpha, wall}_P = \left\{ \begin{array}{@{}ll} \displaystyle -6{\rm \pi} \mu a V_{ref, wall} \left( \dfrac{R_{ref, wall}^2-|\boldsymbol{r}|^2}{R_{ref, wall}^2-a^2} \right)^6 \dfrac{\boldsymbol{r}}{|\boldsymbol{r}|} & \mbox{if} \ |\boldsymbol{r}| < R_{ref, wall},\\ \displaystyle 0 & \mbox{otherwise}, \end{array}\right. \end{equation}
where  $\boldsymbol {r}$ is the vector between $\boldsymbol {r}^{\alpha }$ and the top or bottom wall. We take $R_{ref, wall} = 1.05a$ and $V_{ref, wall} = 200$.
4. Results
4.1. Migration to the walls: cross-stream  $y$-direction

Although we bias the particles to the channel centre ( $y=h/2$) in the narrow dimension at the start of the experiment, we observe that the particles migrate rapidly towards the walls once the suspension is subjected to a periodic strain. The rate of this migration is captured in figure 3(a), which shows the average distance between a particle centre and the nearest wall as a function of the accumulated strain $\gamma _a$. On a time scale that is approximately an order of magnitude faster than the less-confined $x$-direction evolution, which we will present in § 4.2, the particles reach a configuration in which the average particle is approximately 1.25 radii away from the channel wall. The corresponding FCM simulations produce a similar result in figure 4(a), where the migration to the walls is even more apparent due to the near-monolayer initial condition. The rate of migration is enhanced for higher $\phi _B$. For the simulations, the final average $y$-locations for the two highest values of $\phi _B$ are approximately $1.25a$, the same as for the experiments. The initial and steady-state particle position distributions in the experiments and simulations are presented in figures 3(b) and 4(b), where we plot the probability that a given particle's centre will lie in one of 20 evenly spaced bins distributed over the channel height. Both the experimental and the simulation plots show an initial distribution that favours the channel centre due to the imposed particle configuration. However, the particles strongly prefer the walls in the steady-state distribution. The data points that appear closer than one particle radius to the wall in the experiments are a consequence of the $y$-direction tracking uncertainty, which is quantified in figure 2(d). The experimental measurements of Snook et al. (Reference Snook, Butler and Guazelli2015) in circular pipe flow show the presence of local peaks in the radial concentration distribution at the wall, which they attribute to a particle wall-layering effect. This becomes more pronounced in their data for the smaller pipe radius considered, an effect that they attribute to the higher confinement. In the case of extreme $y$-direction confinement studied here, such wall layers dominate and ultimately overwhelm the final concentration distribution. As also noted by Snook et al. (Reference Snook, Butler and Guazelli2015), continuum models such as the suspension balance model are of course unable to capture such discrete particle effects.
Experimental results for migration in the cross-stream ( $y$) direction. (a) Average distance between a particle centre and the nearest wall versus the accumulated strain for experiments with $\gamma =6$ and $\phi _B = {0.06}$ (red), 0.10 (green) and 0.12 (blue). The error bars show the standard deviation between five trials. (b) Initial and steady-state particle position distributions over the height of the channel show that in the narrow channel dimension, the particles prefer the walls at steady state. The initial distribution is averaged over the first 20 frames ( $\gamma _a < 2.74$), and the steady profile is averaged over frames 601–656 ( $\gamma _a = [82, 90]$). The vertical dashed lines indicate a distance of one particle radius from the wall.

Simulation results for migration in the cross-stream ( $y$) direction. (a) Average distance between a particle centre and the nearest wall versus the accumulated strain for simulations with steady flow and $\phi _B = 0.07$ (red), 0.11 (green) and 0.14 (blue). The particles begin in a ‘pseudo-monolayer’ but quickly migrate to the walls in the narrow channel dimension. (b) Initial and steady-state particle position distributions over the height of the channel. The initial distribution is averaged over the first 20 frames ( $\gamma _a < 3$), and the steady profile is averaged over frames 550–600 ( $\gamma _a = [82, 90]$). The vertical dashed lines indicate a distance of one particle radius from the wall.

It is possible to understand this migration to the walls by considering two-body interactions between the particles. If two particles come into contact, then the force between the particles acts along the line of centres of the particles. Unless the particles have identical  $y$-locations, the force will have a component that displaces each particle towards the walls. After many strain units and particle interactions, the particles will migrate to be close to the walls. Once a particle enters the wall layer – that is, it is on top of the wall – it is very difficult for the particle to exit because any additional interaction will force the particle closer to the wall.
4.2. Migration to the centre: spanwise $x$-direction

Examining the evolution of the local particle volume fraction  $\phi$ as a function of the accumulated strain $\gamma _a$ gives insight into the dynamics of the migration process and its dependence on the bulk packing fraction. The average particle concentrations in the centre and outer quarter-width bins when $\gamma =6$ are plotted against the accumulated strain in figure 5. The bin concentration $\langle \phi \rangle _{bin}$ is computed based on the 3-D particle positions as the volume in the bin filled with particles divided by the total bin volume. When a particle intersects the $x=w/4$ or $x=3w/4$ planes, its volume is partitioned accordingly between the inner and outer bins. The results in these and all subsequent experimental plots are averaged over at least five trials, with error bars representing one standard deviation. Because of the initial configuration of the particles, the initial outer bin concentration exceeds the bulk packing fraction for all experiments. However, for the $\phi _B={0.10}$ and $\phi _B={0.12}$ experiments, the inner and outer bin concentrations eventually cross, and at high accumulated strain, the inner bin concentration exceeds the bulk packing due to particle migration. Migration proceeds at an increased rate for $\phi _B={0.12}$. For the low-packing-fraction experiments with $\phi _B={0.06}$, the bin concentrations do not cross the average channel concentration up to an accumulated strain of 550, indicating a sharp reduction in the rate of migration. The oscillations in the inner bin concentration in figure 5(a) match the period of the flow and occur because of small variations in the packing fraction along the length of the channel. ‘Anomalous’ migration was not observed in the present experiments, but is predicted to occur for significantly smaller strain amplitudes than explored in the present work (Morris Reference Morris2001).
Experimental results for migration in the spanwise ( $x$) direction. The evolution of particle concentration in the inner and outer bins is shown for (a) $\phi _B={0.06}$, (b) $\phi _B={0.10}$ and (c) $\phi _B={0.12}$, with $\gamma = 6$. The dashed line indicates the measured bulk volume fraction $\phi _B$ in the field of view averaged over the experiment. (d) The outer bins are one-quarter of the channel width, and the concentrations are calculated from the reconstructed 3-D particle positions as the volume in the bin filled with particles divided by the total bin volume.

The initial and steady-state particle concentration profiles over the channel width are shown in figure 6(a) for experiments with  $\gamma =6$. Since the experiments begin in a wall-loaded configuration, the initial concentration profiles contain two peaks that are approximately one particle radius away from the channel walls. Additional experiments were conducted for more homogeneous initial concentrations and showed very similar results (see Appendix A). For the $\phi _B={0.10}$ and $\phi _B={0.12}$ experiments, the steady-state concentration profiles indicate significant migration towards the channel centre since the bulk packing fraction is surpassed there. However, compared against results with a parabolic flow profile in Snook et al. (Reference Snook, Butler and Guazelli2015) and Lyon & Leal (Reference Lyon and Leal1998a), the enhanced concentration at the channel centre is less pronounced, mirroring the flatter velocity profile in the current geometry. For $\phi _B={0.06}$, the particle arrangement relaxes from its initial configuration, suggesting some irreversible behaviour, but there is less preferential migration towards the centre of the channel. The $x$-direction concentration profiles are constructed by computing the local $y$-and- $z$-averaged particle volume concentration $\langle \phi \rangle _{yz}$ in a bin that is swept over the width of the channel as shown in figure 6(b). The bin width is $w/100$, and the volume concentration $\langle \phi \rangle _{yz}$ is computed as the volume of the bin filled with particles divided by the total bin volume. For clarity, error bars are shown at discrete points rather than at every bin station. While we do observe a net migration of particles to regions of lower shear in the channel centre (in the $x$-direction), we note that owing to the relatively large particle-to-channel size (i.e. high confinement) it is unlikely that our results would be well described by continuum models of similar behaviours, such as the suspension balance model (Morris & Boulay Reference Morris and Boulay1999; Guazzelli & Pouliquen Reference Guazzelli and Pouliquen2018). In contrast to the present work, prior experimental work on shear-induced migration in less confined suspensions in circular pipes has suggested an absence of migration for suspensions with $\phi _B\approx 10\,\%$ in both oscillatory (Snook et al. Reference Snook, Butler and Guazelli2015) and steady (Hampton et al. Reference Hampton, Mammoli, Graham, Tetlow and Altobelli1997) flows. The fact that detectable migration towards the centre is observed for the relatively low volume fractions in our system is thus likely to be a consequence of the high levels of confinement, which naturally increase the likelihood of particle contacts. Such contacts are known to be the primary source of irreversibility in these systems (Metzger et al. Reference Metzger, Pham and Butler2013).
(a) Initial and steady-state concentration profiles for  $\gamma =6$. Initial profiles were averaged over the first 20 frames ( $\gamma _a < 2.74$), and steady profiles were averaged over frames 3500–3700 ( $\gamma _a = [480, 508]$). The shaded regions indicate the measured bulk packing fraction $\phi _B$ in each experiment. (b) A bin of width $w/100$ is swept over the reconstructed 3-D particle positions in $x$ to measure the local volume concentration $\langle \phi \rangle _{yz}$. (c) Centreline ( $y=h/2$) particle velocity profiles compared with the theoretical Newtonian case. The curves are normalized by the theoretical velocity at the channel centre $U_{centre} = 1.15\,{\rm mm}\,{\rm s}^{-1}$. (d) Cross-sectional particle velocity profiles.

4.3. Migration rate
We quantify the rate of migration in our experiments by measuring the number of oscillations required for the particle concentration profile to reach steady state, following a method similar to the one used in Snook et al. (Reference Snook, Butler and Guazelli2015). As seen by comparing figures 3(a) and 5, the time to steady state in our experiments is dominated by the migration in the  $x$-direction. As such, in order to determine the steady state, we compute $\langle \phi \rangle _{yz}$ using bins of width $w/20$ for each oscillation of the experiment, averaging over frames 22–76 of the oscillation. When a majority of the bins are within one standard deviation of the particle concentration over the remaining oscillations, the suspension is considered to have reached steady state. Steady state is reached in $29 \pm 14$, $11 \pm 7$ and $4 \pm 1$ oscillations for experiments with $\phi _B = 0.06$, $0.10$ and 0.12, respectively. The values following the means characterize the distribution in the time to steady state between trials. This result matches the observation in Snook et al. (Reference Snook, Butler and Guazelli2015) that the mean accumulated strain to reach steady state scales approximately as $\phi _B^{-2}$. Despite the lower volume fractions considered in our work, the mean numbers of oscillations to steady state are comparable in magnitude to the numerical values reported by Snook et al. (Reference Snook, Butler and Guazelli2015). Furthermore, their data indicate a decrease in time to steady state with both volume fraction and degree of confinement. It is thus likely that the increased confinement in our system promotes more particle contacts than in an otherwise equivalent lesser confined scenario, which compensates for the reduced likelihood of contact associated with smaller volume fractions.
4.4. Particle velocities
Enabled by the 3-D particle tracking, figure 6(d) shows the average magnitude of the particle velocity over the channel cross-section. The experimental velocity profiles are time-averaged over a full experiment, and the theoretical velocity is calculated for a pure Newtonian fluid in Stokes flow. The white cells in the experimental profiles are regions where no velocity measurement could be obtained since the particle centres must be at least one particle radius away from the channel walls. For the  $\phi _B={0.06}$ case, the magnitude of the measured velocity profile is close to the theoretical profile, but the particle velocities are reduced for the higher-packing cases. The midline particle velocity profiles at $y=h/2$ are compared in figure 6(c) against the theoretical centreline velocity. The experimental velocity profiles are constructed using particles whose centres are within $0.12h$ of the channel centre. The profile becomes increasingly blunt with higher $\phi _B$, consistent with results in a circular pipe (Snook et al. Reference Snook, Butler and Guazelli2015) and 2-D channel flow (Lyon & Leal Reference Lyon and Leal1998a; Guasto et al. Reference Guasto, Ross and Gollub2010).
4.5. Particle irreversibility and interactions
The mean-square particle displacements (MSDs) are a quantitative measure of irreversibility in the particles’ motion and thus allow more detailed comparison between the experiments. The non-dimensional effective particle diffusivity  $D_x$ is defined following Pine et al. (Reference Pine, Gollub, Brady and Leshansky2005) according to
 \begin{equation} \langle (\Delta x /(2 a))^2 \rangle= 2 D_x \gamma_a, \end{equation}
where  $\langle (\Delta x /(2a))^2 \rangle$ is the non-dimensional MSD, $2a$ is the particle diameter, $\gamma _a$ is the total accumulated strain and $\Delta x$ is the displacement of the particle over one cycle. Given the 3-D nature of the flow geometry, effective diffusivities $D_y$ and $D_z$ for the other directions are defined in a similar manner. In order to ensure that the results are statistically significant, MSDs are computed up to the maximum accumulated strain for which there are at least 50 continuous particle trajectories (starting at any point in the experiment). Since a higher bulk packing fraction increases the likelihood that a particle is lost during tracking, MSDs are calculated to a lower accumulated strain for higher- $\phi _B$ experiments. The MSDs after an integral number of cycles in the $\gamma =6$ experiments are graphed against the accumulated strain in figure 7(a). The $y$-component is omitted as it does not exhibit diffusive behaviour, presumably due to the high confinement. The least-squares fits for the effective particle diffusivities are shown as well. For a given packing fraction, the effective diffusivity along the flow direction $D_z$ is significantly higher than the spanwise diffusivity $D_x$. This result is consistent with findings in a circular Couette flow where two or more components of diffusivity were measured (Breedveld et al. Reference Breedveld, van den Ende, Jongschaap and Mellema2001, Reference Breedveld, van den Ende, Bosscher, Jongschaap and Mellema2002; Pine et al. Reference Pine, Gollub, Brady and Leshansky2005). Guasto et al. (Reference Guasto, Ross and Gollub2010) also report that the streamwise diffusivity is consistently higher than the spanwise diffusivity in a rectangular channel flow. Figure 7(b) compares the effective diffusivities as a function of $\phi _B$. For every value of $\phi _B$, the ratio between $D_x$ and $D_z$ is approximately 20, but their values increase by approximately one order of magnitude as $\phi _B$ increases from 0.06 to 0.12. The increase of effective diffusivity with bulk volume fraction is consistent with experimental results in the literature for other flow geometries (Pine et al. Reference Pine, Gollub, Brady and Leshansky2005; Guasto et al. Reference Guasto, Ross and Gollub2010). We note that our experiments involve non-uniform strain and time-evolving non-uniform particle concentrations. As such, the particle diffusivities will depend on space (Guasto et al. Reference Guasto, Ross and Gollub2010) and time – dependencies that a single particle diffusivity value does not capture. Even in the case of a simple shear flow, it has been observed experimentally that the particle diffusivity can have distinct short- and long-time values (Breedveld et al. Reference Breedveld, van den Ende, Jongschaap and Mellema2001). Nevertheless, the average diffusivities computed here remain a reasonable quantitative proxy for the general level of chaos in the system (Drazer et al. Reference Drazer, Koplik, Khusid and Acrivos2002) and allow a simple comparison between our experimental conditions. Direct quantitative comparison of these numerical values with simpler cases involving uniform strain and particle concentration, such as Pine et al. (Reference Pine, Gollub, Brady and Leshansky2005), should be made with care, however. With significantly more data, the spatial dependence and temporal evolution of the particle diffusivities could be resolved faithfully using our experimental set-up.
(a) Mean-square particle displacements in  $x$ and $z$ for $\gamma =6$ experiments. The dashed lines show linear fits to the data used to extract the effective diffusivities via (4.1). (b) Comparison of effective diffusivities $D_x$ (squares) and $D_z$ (triangles) at different bulk volume fractions.

Since the 3-D position of each particle in the experiment is known, interactions between particles and the resulting irreversibility may be examined directly. Figure 8 shows the number of particles that migrate a given amount based on their proximity to their neighbours over a cycle. A particle's level of interaction is quantified along the abscissa by  $\langle d_{{min}} \rangle /(2a)$, which represents the average 3-D surface-to-surface distance between a particle and its nearest neighbour over a cycle, normalized by the particle diameter. The nearest neighbour is chosen at each frame in the cycle, and the data are collected over the entire experiment. While other metrics for particle contact pressure such as the radial distribution function have been used in the literature (Rintoul & Torquato Reference Rintoul and Torquato1996), we find that our metric $\langle d_{{min}} \rangle /(2a)$ is correlated more strongly to the irreversible particle displacements in our experiments. The magnitude of the spanwise displacement over a single cycle $|\Delta x|$ is plotted on the ordinate, and is a measure of the irreversibility of particle motion during the cycle. These plots demonstrate that for all experiments, the particles with more interactions (smaller $\langle d_{{min}} \rangle$) have a greater tendency to migrate (larger $|\Delta x|)$. The presence of close interactions does not guarantee migration, however, but it is statistically more likely to occur. As the packing fraction increases, so does the number of particles that interact closely with their neighbours, resulting in larger migratory excursions. For the $\phi _B={0.06}$ experiments, there are few particles with $\langle d_{{min}} \rangle /(2a) < 0.2$ compared to the $\phi _B = {0.10}$ and $\phi _B = {0.12}$ experiments, and consequently little migration towards the channel centre, which is corroborated in the concentration profile results. We observe no appreciable difference when the heat maps are generated using only data from before or after steady state is reached. However, the heat map results do exhibit some spatial dependence, which is explored in Appendix B. Example movies of particle behaviour at specific points on the heat map are provided in the supplementary material available at https://doi.org/10.1017/jfm.2023.793. Heat maps are also presented for the corresponding FCM simulations in figure 9. Since the simulations feature steady rather than periodic flow, the particle migrations are measured in 12 strain unit increments so that the average particle $z$-displacement between snapshots is the same as in the experiments. As in the experiments, particles with more interactions are more likely to migrate, and the particle proximity tends to increase with packing fraction.
Experimental heat maps of  $x$-particle migration over one cycle versus average distance to nearest neighbour at $\gamma =6$ for (a) $\phi _B={0.06}$, (b) $\phi _B={0.10}$ and (c) $\phi _B={0.12}$. The colour map is normalized by the maximum bin count, which is 56, 57 and 32, respectively.

Simulation heat maps of  $x$-particle migration after 12 strain units versus average distance to nearest neighbour for (a) $\phi _B=0.07$, (b) $\phi _B=0.11$ and (c) $\phi _B=0.14$. The colour map is normalized by the maximum bin count, which is 22, 42 and 54, respectively.

4.6. Influence of strain amplitude
Experiments are also performed at  $\phi _B={0.10}$ ( $\phi _B'=0.11$) and $\gamma =1$ in order to observe the influence of the strain amplitude on the migration dynamics. The average particle concentrations in the centre and outer quarter-width bins are plotted against the accumulated strain in figure 10(a) up to an accumulated strain of 1100. Despite the large accumulated strain, the bin concentrations do not cross, and the experiments exhibit quasi-reversible behaviour where the bin concentrations change very slowly, potentially due to the locally high volume fraction at the walls. Furthermore, the effects of residual buoyancy (due to distribution in particle density) also lead to irreversible behaviours that are more apparent on long time scales. The initial and steady-state concentration profiles in figure 10(b) feature a similar lack of migration, which is consistent with observations in the literature (Guasto et al. Reference Guasto, Ross and Gollub2010; Pham et al. Reference Pham, Butler and Metzger2016) of a critical strain amplitude below which the particles can subtly reorganize into a configuration that is essentially reversible. For the migration heat map in figure 10(c), the peak intensity occurs near $\langle d_{{min}} \rangle /(2a) = 0$, yet almost no migration occurs. Since the suspension is quasi-reversible at this low strain amplitude, the particles remain near their initial tightly packed wall-loaded configuration. Measurements of the mean-square particle displacements after integral numbers of cycles yield values that are at least an order of magnitude smaller than those reported in figure 7(a). However, given the particle tracking resolution, we cannot make a statistically significant estimate for the effective diffusivity without substantially more data.
Experiments are performed at  $\phi _B={0.10}$ and $\gamma =1$, and the (a) bin concentration evolution, (b) concentration profiles and (c) migration heat map are plotted. The initial concentration profile is averaged over the first 20 frames ( $\gamma _a < 2.74$), and the steady profile is averaged over frames 7000–7400 ( $\gamma _a = [960, 1016]$). The shaded region in (b) indicates the measured bulk packing fraction $\phi _B$.

5. Conclusions
In our experiments, suspensions of neutrally buoyant spherical particles at bulk volume fractions  $\phi _B$ from 0.06 to 0.12 are subjected to oscillatory pipe flow in a confined rectangular channel, and the resulting particle migration is characterized through direct imaging. We study a channel of aspect ratio $3:1$ ( $x:y$) with particles that are just larger than half the channel height in $y$ to prevent complete overlap. While numerous qualitative comparisons with existing state-of-the-art measurements have been made throughout, quantitative comparisons are far more challenging, as it is not straightforward to map unambiguously between highly disparate flow geometries.
In experiments performed at strain amplitude  $\gamma =6$, the particles are observed to migrate preferentially in the spanwise $x$-direction towards the channel centre, with a higher bulk volume fraction hastening the dynamics. These findings are consistent with results in the literature for other, unconfined flow geometries exhibiting shear-induced migration (Lyon & Leal Reference Lyon and Leal1998a; Guasto et al. Reference Guasto, Ross and Gollub2010; Snook et al. Reference Snook, Butler and Guazelli2015), although the enhanced concentration at the centre of the channel is less pronounced in our case. Other measurements of the collective particle behaviour, such as local particle concentration and velocity, are similarly consistent with previous results (Lyon & Leal Reference Lyon and Leal1998a; Guasto et al. Reference Guasto, Ross and Gollub2010; Snook et al. Reference Snook, Butler and Guazelli2015). The relative particle concentration at the channel centre increases as the bulk volume fraction is increased. Conversely, the velocity profile is increasingly blunted compared to the theoretical $\phi _B=0$ case as $\phi _B$ is increased. Measurements of particle trajectories show that individual particles exhibit anisotropic diffusive-like behaviours, with streamwise diffusivities approximately an order of magnitude larger than their spanwise counterparts, again consistent with prior work (Pine et al. Reference Pine, Gollub, Brady and Leshansky2005; Guasto et al. Reference Guasto, Ross and Gollub2010). Additional experiments at a lower strain amplitude $\gamma =1$ produce quasi-reversible particle behaviour consistent with the existence of a critical strain amplitude below which shear migration does not occur (Guasto et al. Reference Guasto, Ross and Gollub2010; Pham et al. Reference Pham, Butler and Metzger2016). In the small cross-stream ( $y$) cross-sectional dimension, particles migrate rapidly to the walls in all cases and reach a steady-state distribution more rapidly than in the $x$-direction. This rapid segregation is also observed in companion FCM simulations where the spheres are not confined in the $x$-direction.
Furthermore, other comparisons with the literature indicate that confinement plays an impactful role in our system. In particular, previous results indicate a lack of migration for low volume fractions of approximately 10 % (Hampton et al. Reference Hampton, Mammoli, Graham, Tetlow and Altobelli1997; Snook et al. Reference Snook, Butler and Guazelli2015), whereas we find clear evidence of migratory behaviour at these low densities. Additionally, the time to steady state in our system is comparable to that of more dense (but less confined) suspensions (Snook et al. Reference Snook, Butler and Guazelli2015). Both of these observations suggest that confinement tends to enhance irreversibility. Geometrical confinement restricts possible particle motions, and thus naturally provides a mechanism for increasing the number of particle contacts when sheared. Finally, for the case of extreme confinement (i.e. in the small cross-stream direction of our channel), the wall layers observed in prior work (Snook et al. Reference Snook, Butler and Guazelli2015) entirely dominate the resultant distribution. Future experiments that span high to low levels of confinement more continuously using a single flow geometry may provide additional valuable insights into the role of confinement in non-uniformly sheared non-Brownian suspensions.
In order to conduct the experimental measurements, we also implement a new, single-camera 3-D particle tracking method. The transparent particles are imaged above a speckle pattern, and the magnitude of the resulting optical distortions are used to infer the out-of-plane particle positions with high accuracy. This method trades the high optical component cost of typical particle suspension set-ups for computational complexity, utilizing a refraction model to predict the distortion of the speckle patterns and iterating the particle position to reproduce the observed distortion.
The 3-D tracking method permits the characterization of not only collective but also individual particle behaviour, enabling direct observations of interparticle spacing and trajectories over long times. Consequently, it is possible to build a quantitative connection between particle interactions and displacement over a cycle to explain the source of irreversibility. In both experiments and simulations, it is observed that as the bulk volume fraction increases, a greater number of particles experience close interactions with their neighbours, and these same particles are responsible for the strongest individual migration events. While similar measurements have been performed for very few numbers of particles in two dimensions (Pham et al. Reference Pham, Metzger and Butler2015), this work represents the first realization of similar temporally resolved, high-resolution trajectories for suspensions of large numbers of particles in three dimensions.
In addition to allowing measurements of otherwise inaccessible quantities in the mono-disperse case, our 3-D tracking method has the advantage of convenient extension to the case of bi-disperse or poly-disperse suspensions, as particle size can be determined easily during the optical reconstruction. Owing to the presence of the channel walls, which prevent particle overlap, the present experimental findings are also relevant to natural problems involving particle suspension in high confinement, such as thin films (Hooshanginejad, Druecke & Lee Reference Hooshanginejad, Druecke and Lee2019) or porous media (Mirbod & Shapley Reference Mirbod and Shapley2023). Furthermore, as a consequence of the standard manufacturing methods, duct-like channels are extremely common in microfluidics. It has been shown previously that inertial effects in such geometries lead to focusing of suspensions in certain regions of the channel cross-section and can be exploited for passive particle manipulation (Di Carlo Reference Di Carlo2009). Irreversible particle–particle interactions in duct-like geometries can also result in particle migration across streamlines, even in the absence of inertia, with confinement hastening the process.
Supplementary material
Supplementary movies are available at https://doi.org/10.1017/jfm.2023.793.
Acknowledgements
All authors would like to thank the referees for their constructive suggestions.
Funding
A.H. acknowledges support from the US Department of Energy, Advanced Scientific Computing Research programme, under the Scalable, Efficient and Accelerated Causal Reasoning Operators, Graphs and Spikes for Earth and Embedded Systems (SEA-CROGS) project, FWP 80278. Pacific Northwest National Laboratory (PNNL) is a multi-programme national laboratory operated for the US Department of Energy by the Battelle Memorial Institute under contract no. DE-AC05-76RL01830. F.V. acknowledges funding from the University of Granada through the Brown/CASA-UGR Research Collaboration Fund and MICINN PID2019-104883GB-I00 project (Spain).
Declaration of interests
The authors report no conflict of interest.
Code and data accessibility
The particle tracking code, associated documentation and data sets can be found at https://github.com/harrislab-brown/ParticleHeight.
Appendix A. Uniform initial conditions
In order to explore the sensitivity of the experimental steady-state particle distribution to the wall-loaded initial conditions, we also performed experiments at  $\phi _B=0.11$ ( $\phi _B'=0.11$) and $\gamma =6$ with an approximately homogeneous initial particle distribution. The resulting migration dynamics and particle distribution profiles across both channel dimensions are shown in figure 11. Although the initial conditions here are notably different, we recover a steady state similar to that in the experiments with a wall-loaded initial configuration, as can be seen by comparing figures 3(b) and 6(a). An approximately equal number of particles start in the inner and outer bins in this case, with particles migrating preferentially to the inner bin as time progresses. Similarly, the bin concentrations recover a state close to the equilibrium values in figure 5(b).
Experiments are performed at  $\phi _B=0.11$ and $\gamma =6$ with a homogeneous initial concentration, yet the steady state of the suspension is similar to the case with wall-loaded initial conditions. (a) The bin concentration evolution is plotted, with the error bars showing the standard deviation of five trials. (b) Plots of $x$-concentration initial (dotted) and steady (solid) profiles. The initial concentration profile is averaged over the first 20 frames ( $\gamma _a < 2.74$), and the steady profile is averaged over frames 3500–3700 ( $\gamma _a = [480, 508]$). The shaded region indicates the measured bulk packing fraction $\phi _B$. (c) Initial (dotted) and steady (solid) distributions of particle centres in the $y$-direction. The likelihood that a given particle's centre will lie in each region of the channel is plotted. The initial distribution is averaged over the first 20 frames ( $\gamma _a < 2.74$), and the steady profile is averaged over frames 601–656 ( $\gamma _a = [82, 90]$). The vertical dashed lines indicate a distance of one particle radius from the wall.

Appendix B. Migration heat maps in inner and outer bins
Heat maps of  $x$-particle migration generated using only data from after the steady state is reached are shown in figure 12 in order to explore the spatial dependence of the particle behaviour. Figure 12(a–c) use only particle trajectories that start the cycle in the centre quarter-width bins. Conversely, figure 12(d–f) use only particle trajectories that start the cycle in the outer quarter-width bins. The inner bin migration heat maps closely resemble the full channel experimental heat maps in figure 8 as well as the simulation heat maps in figure 9, the latter of which are fully unconfined in the spanwise ( $x$) direction. On the other hand, the outer bin migration heat maps – where the confinement from the channel walls plays a role – are notably different. Although the average particle remains further from its neighbours in this region (since the average outer bin volume fraction is diminished once steady state is reached), even particles that interact closely never achieve migration events as large as those in the centre bins, which is consistent with the existence of a persistent wall layer in which individual particles may become ‘trapped’ for long times. Particle wall layering has been shown in simulations of wall-bounded Couette and Poiseuille flow suspensions across a range of systems (Kulkarni & Morris Reference Kulkarni and Morris2008; Yeo & Maxey Reference Yeo and Maxey2010, Reference Yeo and Maxey2011; Kanehl & Stark Reference Kanehl and Stark2015), and similar wall layering has been seen in experiments (Snook et al. Reference Snook, Butler and Guazelli2015). Physically, if two particles of equal size are in the wall layer and are involved in a collision, then the force between the two particles is along the line of centres of the particles, which is parallel to the wall. Thus there is no force to move the particles from the wall layer. Additionally, collisions with particles above the wall layer can serve to push particles in the wall layer closer to the wall. This results in a consistent and stable monolayer forming on the channel walls, with very few particles leaving over long times (Howard Reference Howard2018).
Experimental heat maps after steady state of  $x$-particle migration over one cycle versus average distance to nearest neighbour at $\gamma =6$ for (a,d) $\phi _B={0.06}$, (b,e) $\phi _B={0.10}$ and (c, f) $\phi _B={0.12}$. Only particles that start a cycle in the inner quarter-width bins (a–c) or outer quarter-width bins (d–f) are considered. The colour map is normalized by the maximum bin count, which is 15, 20, 10, 7, 11 and 10, respectively.


 Open access