


Introduction
Diversification of energy sources and rapidly growing implementation of renewable options worldwide create new challenges for technological energy storage and conversion solutions. From this perspective, materials that would secure effective implementation of future energy strategies are indispensable. This includes discovery of new compounds with enhanced properties, on the one hand, and reinvestigation of new functionalities of already recognized materials, with well known characteristics, on the other hand.
Electrochemical energy storage in batteries is one of the most important technological solutions in the new energy paradigm. Over the past several decades, nickel-metal hydride (Ni-MH), lead-acid, and Li-ion batteries (LIBs) have triggered a revolution in small personal electronic devices, hybrid, plug-in hybrid, and electric vehicles, and in large-scale stationary applications [Reference Armand and Tarascon1]. However, continuous growth in energy demand and shift into the “green” electricity in the global energy landscape require constant progress on the materials side, which is expected to provide prompt answers to the market needs and ensure implementation of appropriate energy storage options.
The rechargeable LIBs, with reasonably high energy density, reliability, and durability, have become the main players in the commercialized battery technology. A battery consists of two electrodes immersed in an electrolyte. The storage of electrical charge in electrodes occurs via three types of electrochemical reactions: alloying, conversion, and intercalation [Reference Choi and Aurbach2]. The first one offers the highest specific capacity, but it is associated with a large volume change. The conversion reactions involve chemical transformation(s) and are often limited by their irreversibility. Thus, the electrochemical intercalation reactions are the most commonly applied in LIBs. In such a cell, the anode (a negative electrode) is typically made of graphite, while the cathode (a positive electrode) is usually a transition metal oxide, with layered, spinel, or olivine crystal structure. The thermodynamically favored redox reaction allows for reversible transport of Li+ between electrodes, which, in this case, act as ionic intercalation hosts. Magnesium-ion batteries and sodium-ion batteries (NIBs), which recently have been identified as appealing, more element abundant and less expensive alternatives to LIBs, share very similar architectures and are subject of extensive studies expected to accelerate their commercial implementation [Reference Choi and Aurbach2, Reference Mohtadi and Mizuno3]. Despite the fact that significant improvements in performance of these secondary batteries have been demonstrated, there are still challenges to be addressed. One of them is the identification of new electrolytes that would enable their reliable and safe operation. In LIBs and NIBs, the electrolyte is expected to fulfill higher safety standards than the currently used solvents, characterized by high volatility and flammability. An ideal scenario foresees the integration of a solvent-free and thermally stable inorganic solid-state electrolyte (SSE) into a battery cell [Reference Manthiram, Yu and Wang4]. An alternative, cheaper and safer magnesium battery technology—that can provide higher energy capacity—also struggles with the identification of proper electrolytes that, in this case, would support Mg2+ insertion in cathodes, ensure efficient and reversible magnesium deposition/dissociation, in addition to being safe and stable toward all battery components [Reference Tutusaus and Mohtadi5]. The list of previously explored alternatives spans a broad range of compounds; yet, none of them satisfies the physical, chemical, and electrochemical requirements that a potential electrolyte material for Mg batteries must fulfill.
Hydrides are an important class of compounds and over the years have inspired the development of many practical and environmentally friendly technologies [Reference Mohtadi and Orimo6, Reference Orimo, Nakamori, Eliseo, Züttel and Jensen7]. They have been proven to work in an efficient and a reliable way in many energy-related applications, of which Ni-MH batteries are the most prominent examples. Although the higher requirements in energy density demand in transportation and portable electronics lessened the commercial importance of hydrides, the continuous research in the last decade brought them back into focus by discoveries of novel, latent properties and new potential applications. Complex metal hydrides (CMHs), with the general formula Mmδ+[M′Hn]δ−, consist of a metal cation (Mδ+, in this review, typically lithium, sodium, and magnesium) stabilized by a complex anion [M′Hn]δ−. In lightweight CMHs, the latter is formed by light elements, such as boron ([BH4]−), aluminum ([AlH4]− and [AlH6]3−), or nitrogen ([NH2]−), coordinated by hydrogen atoms. Over the years, these compounds have been mostly investigated due to their high hydrogen storage capacity [Reference Orimo, Nakamori, Eliseo, Züttel and Jensen7]. However, recent studies revealed their yet unexplored potential, which goes beyond their original applications [Reference Mohtadi and Orimo6, Reference Paskevicius, Jepsen, Schouwink, Cerny, Ravnsbaek, Filinchuk, Dornheim, Besenbacherf and Jensen8]. One of the essential new functionalities addresses an integration of lightweight CMHs in rechargeable batteries, either as solid-state/non-aqueous electrolytes and/or electrode materials, and by that opens novel possibilities for broad applications of these compounds in the future electrochemical energy storage technologies.
This review gives a complete overview of up-to-date studies that have focused on the characterization of complex light-metal hydrides with high ionic conductivities as well as examples of their application in rechargeable batteries as electrolytes and/or negative electrode materials. The sections titled “Lightweight CMHs as Li-ion conductors,” “Lightweight CMHs as Na-ion conductors,” “Conductivity of lightweight CMHs in Mg batteries,” and “Conductivity of Li, Na, and Mg ions in 3D boron clusters (closo-boranes)” cover literature reports on Li-, Na-, and Mg-ion conductivity in lightweight metal hydride complexes and boron clusters, while in the section titled “Light-metal hydride complexes and 3D boron clusters in rechargeable battery cells: application review,” the documented examples of their application in battery cells will be presented. Tables I and II give an overview of the ionic conductivities of the presented lightweight CMHs and selected performance parameters of investigated batteries, respectively.
Ionic conductivity (σ) values for reported lightweight CMHs, boron clusters and their anhydrous salts.

Selected parameters for reported lightweight CMHs- and boron clusters-based Li-, Na-, and Mg-ion batteries. Values of first/nth discharge capacities and the capacity retention were taken directly from reported publications and given if available.

Lightweight CMHs as Li-ion conductors
Borohydrides
The first reported information on ionic conductivity (σ) in hydrides, in the solid-state, dates to the late 1970s (room temperature (RT) mobility of Li+ in Li2NH = 3 × 10⁻⁴ S/cm) [Reference Boukamp and Huggins48]. Nonetheless, the interest in this class of materials as fast solid-state ionic conductors has been in focus only recently, driven by the discovery of a high σ value for LiBH4 in 2007 [Reference Matsuo, Nakamori, Orimo, Maekawa and Takamura9]. Since then, the number of studies on ionic conductivities in hydrides has been increasing, with borohydrides and their derivatives being the most intensively investigated compositions. Among numerous advantages that characterize this group of compounds, lightweight, compatibility with Li and Na electrodes, thermal/electrochemical stability, and plasticity, which facilitates manufacturing of an electrolyte/electrode interface, appear as the most appealing.
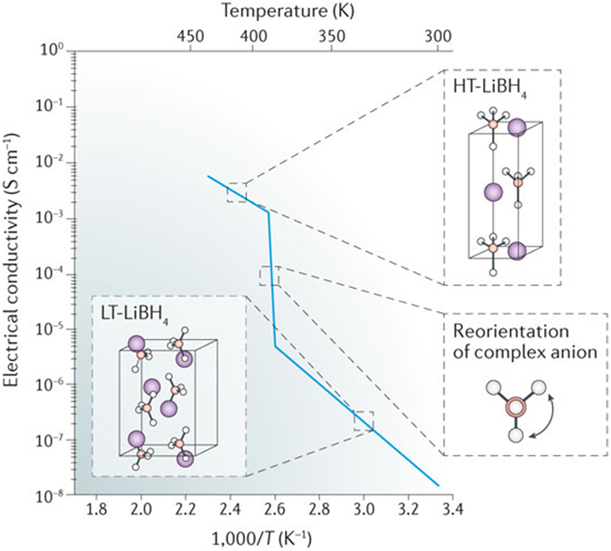
Nakamori et al. reported that at RT, LiBH4 formed an orthorhombic crystal structure characterized by a low ionic conductivity (approximately 10−8–10−6 S/cm at 303 K) [Reference Nakamori, Orimo and Tsutaoka10]. However, at 388 K, this low-temperature (LT) modification transformed to the hexagonal high-temperature phase (HT-LiBH4), which revealed a remarkable increase in the Li-ion mobility (5 × 10⁻³ S/cm at 423 K, Fig. 1 and Table I) [Reference Mohtadi and Orimo6, Reference Matsuo, Nakamori, Orimo, Maekawa and Takamura9, Reference Matsuo and Orimo11, Reference Unemoto, Matsuo and Orimo12, Reference Ikeshoji, Tsuchida, Takagi, Matsuo and Orimo102]. The large band gap reported for both LT-LiBH4 (0.69 eV) and HT-LiBH4 (0.53 eV) suggested a negligible contribution of the electronic conductivity [Reference Matsuo and Orimo11, Reference Miwa, Ohba, Towata, Nakamori and Orimo103, Reference Orgaz, Membrillo, Castaneda and Aburto104]. As such, HT-LiBH4 has qualified as a new solid-state superionic conductor, with a potential application as SSE in LIBs. Later, reports evidenced that the observed increase in the ionic conductivity of Li+ was likely due to rearrangements in the LiBH4 crystal structure. The rotational disorder of the [BH4]− units, combined with the formation of metastable interstitial sites and alignment of both the Li+ and [BH4]− ions along the a and b axes permitted for an unhampered migration of Li+ in both directions [Reference Matsuo and Orimo11, Reference Buchter, Lodziana, Mauron, Remhof, Friedrichs, Borgschulte, Zuttel, Sheptyakov, Strassle and Ramirez-Cuesta105, Reference Remhof, Lodziana, Martelli, Friedrichs, Zuttel, Skripov, Embs and Strassle106]. In batteries, however, the practical application of the observed phenomena requires stability of the hexagonal HT-LiBH4 at much lower temperatures. To achieve this goal, various experimental approaches have been implemented.
The LT-LiBH4 to HT-LiBH4 phase transition triggered by the reorientation of the complex anion with the corresponding Arrhenius plots illustrating changes in ionic conductivity. Reprinted with permission from Ref. Reference Mohtadi and Orimo6, copyright 2016 Macmillan Publishers Limited, part of Springer Nature.
Cation and/or anion substitution
Orimo’s group, motivated by the studies on the thermal stability of borohydrides [Reference Stephenson, Rice and Stockmayer107], performed systematic investigation of the LiBH4–LiX systems, where a fraction of [BH4]− was replaced by halide anions (X = Br−, Cl−, and I−) [Reference Matsuo and Orimo11, Reference Unemoto, Matsuo and Orimo12, Reference Maekawa, Matsuo, Takamura, Ando, Noda, Karahashi and Orimo14, Reference Miyazaki, Karahashi, Kumatani, Noda, Ando, Takamura, Matsuo, Orimo and Maekawa15]. The (1 − x)Li(BH4) + xLiI solid solution with a hexagonal crystal structure was successfully obtained by a mechanochemical synthesis (Table I). The replacement of [BH4]− for I− stabilized the formation of the HT phase at lower temperatures, which decreased monotonically with an increasing concentration of the I− ions. As demonstrated by powder X-ray diffraction (PXD), for x > 13%, the HT phase was observed at RT. The sample with 40% of the LiI content showed σ as high as 0.1 × 10⁻³ S/m and 10 × 10−3 S/m at 303 K and 413 K, respectively [Reference Matsuo and Orimo11, Reference Unemoto, Matsuo and Orimo12, Reference Sveinbjornsson, Myrdal, Blanchard, Bentzen, Hirata, Mogensen, Norby, Orimo and Vegge13, Reference Maekawa, Matsuo, Takamura, Ando, Noda, Karahashi and Orimo14, Reference Miyazaki, Karahashi, Kumatani, Noda, Ando, Takamura, Matsuo, Orimo and Maekawa15, Reference Oguchi, Matsuo, Hummelshoj, Vegge, Norskov, Sato, Miura, Takamura, Maekawa and Orimo108]. Later, it was confirmed that a higher fraction of I− anions reduced the activation energy and subsequently increased the conductivity of Li+ [Reference Skripov, Soloninin, Rude, Jensen and Filinchuk109, Reference Epp and Wilkening110]. On the other hand, the higher mobility of Li+ in Li(BH4)1−nIn, compared to LT-LiBH4, was assigned to the I−-induced lattice anharmonicity and the increased distance between neighboring [BH4]− units [Reference Buchter, Lodziana, Mauron, Remhof, Friedrichs, Borgschulte, Zuttel, Sheptyakov, Strassle and Ramirez-Cuesta105, Reference Filinchuk, Chernyshov and Cerny111]. The formation of solid solutions with enhanced Li-ion conductivity was also observed in the LiBH4–LiBr and LiBH4–LiCl systems [Reference Maekawa, Matsuo, Takamura, Ando, Noda, Karahashi and Orimo14, Reference Cascallana-Matias, Keen, Cussen and Gregory16, Reference Matsuo, Takamura, Maekawa, Li and Orimo17]. Additionally, in the case of Li(BH4)1−nBrn, the importance of applied synthesis methods (mechanochemical powder processing alone over combination with thermal annealing) on the ionic transport properties was emphasized [Reference Cascallana-Matias, Keen, Cussen and Gregory16].
The successful anionic substitution that stabilized the HT-LiBH4 down to RT initiated a broad research activity on LiBH4-related compositions, obtained by either a cation and/or an intermolecular anion substitution.
In 2009, Matsuo et al. reported on the high ionic conductivity of Li+ in trigonal Li2(BH4)(NH2) and cubic Li4(BH4)(NH2)3 borohydride amides, prepared by mechanochemistry. The simultaneous presence of [BH4]− and [NH2]− complexes resulted in multiple crystallographic sites for the Li+ cations and increased their mobility to 2 × 10⁻⁴ S/cm at RT in both compounds [Reference Matsuo, Remhof, Martelli, Caputo, Ernst, Miura, Sato, Oguchi, Maekawa, Takamura, Borgschulte, Zuttel and Orimo20]. In addition, the study showed that the Li2(BH4)(NH2) activation energy, which is one of the measures of the barriers for lithium-ion migration, decreased from 0.66 to 0.24 eV at 368 K as a result of the compound melting. The σ value in the resulting Li2(BH4)(NH2) ionic liquid reached 6 × 10⁻² S/cm. For Li4(BH4)(NH2)3, the activation energy was 0.26 eV before melting (513 K) and suggested higher mobility of Li+ ions than in HT-LiBH4 (0.53 eV) and Li2(BH4)(NH2) [Reference Matsuo and Orimo11, Reference Matsuo, Remhof, Martelli, Caputo, Ernst, Miura, Sato, Oguchi, Maekawa, Takamura, Borgschulte, Zuttel and Orimo20]. Later, Yan et al. demonstrated that the mechanochemically processed powder mixture of LiBH4 and LiNH2 (molar ratio 1:2) formed cubic Li3(BH4)(NH2)2, isostructural to Li4(BH4)(NH2)3, whose σ was 6.4 × 10⁻³ S/cm at 313 K [Reference Yan, Kühnel, Remhof, Duchêne, Reyes, Rentsch, Łodziana and Battaglia22]. Recently, a new orthorhombic Li5(BH4)3NH phase was obtained; however, its lithium ionic conductivity at RT was only 10−6 S/cm [Reference Wolczyk, Paik, Sato, Nervi, Brighi, GharibDoust, Chierotti, Matsuo, Li, Gobetto, Jensen, Cerny, Orimo and Baricco23].
LiY(BH4)4 is one of the few bimetallic Li-based borohydrides that has been studied for a potential application as a SSE [Reference Roedern, Lee, Ley, Park, Cho, Skibsted and Jensen24]. This metastable tetragonal phase was synthesized by thermal treatment of ball milled precursors. The significant enlargement of the LiY(BH4)4 unit cell (by 14%), with respect to the constituting components, was assumed to contribute to the relatively high mobility of Li+ cations, which at RT was 1.26 × 10⁻⁶ S/cm. In 2013, Černý et al. reported on the Li+ ionic conductivity in Li3MZn5(BH4)15 (M = Mg, Mn), first trimetallic borhydrides [Reference Cerny, Schouwink, Sadikin, Stare, Smrcok, Richter and Jensen28]. Their complex crystal structure, which comprises channels built from face-sharing [M(BH4)6] octahedra, raised hope for the high mobility of lithium cations. Unfortunately, the order distribution of Li+ over the crystallographic sites resulted in a low σ, which at RT was only 4 × 10⁻⁸ S/cm.
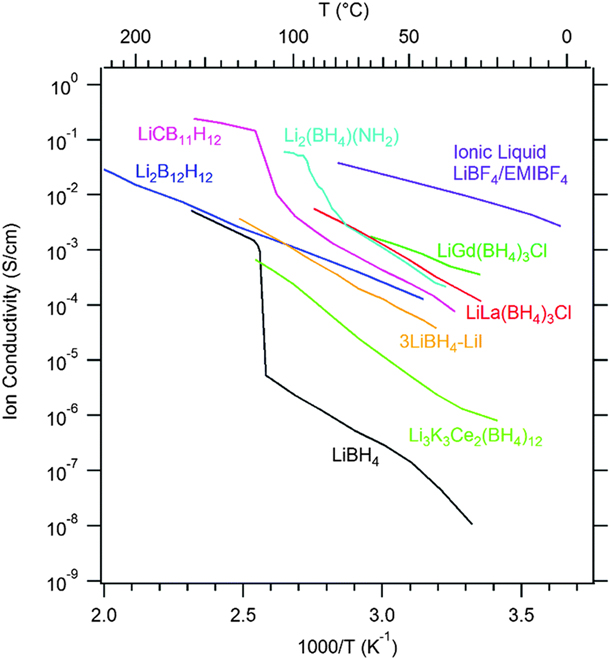
A new family of mixed-cation mixed-anion borohydride chlorides, based on Li and rare-earth elements, was discovered in 2012 and later on expanded by other halide analogues (Fig. 2 and Table I) [Reference Ley, Ravnsbæk, Filinchuk, Lee, Janot, Cho, Skibsted and Jensen25, Reference GharibDoust, Brighi, Sadikin, Ravnsbaek, Cerny, Skibsted and Jensen27]. The LiM(BH4)3Cl series, with M = Ce, Gd, and La, was obtained by the mechanochemical synthesis and subsequent heat treatment of MCl3 and LiBH4 powder mixtures. The PXD studies revealed that the compounds represented a new type of the crystal structure with isolated tetranuclear ionic clusters [M4Cl4(BH3)12]4− that were charge-balanced by Li+ cations. LiM(BH4)3Cl were found to be large entropy-stabilized compounds, with the disordered distribution of Li-ions, which boosted the ionic conductivity of compounds. At 293 K, the reported σ values were 1.02 × 10⁻⁴, 3.5 × 10⁻⁴, and 2.3 × 10⁻⁴ S/cm for Ce-, Gd-, and La-containing compounds, respectively. In another study, the series of LiLa(BH4)3X, X = Br, Cl, and I, was synthesized by the addition reaction, which increased the purity of the samples [Reference GharibDoust, Brighi, Sadikin, Ravnsbaek, Cerny, Skibsted and Jensen27]. At 293 K, the ionic conductivity showed the following trend: LiLa(BH4)3Br > LiLa(BH4)3I > LiLa(BH4)3Cl and oscillated around 10−5 S/cm. The results indicated a possible influence of the halide size on the mobility of Li-ions. The topological analysis of conduction pathways suggested a channel with two various structural apertures, crossed by Li+ while diffusing through vacancies. The size of these windows narrowed with an increasing size of the halide ion and was optimized for the structure of the bromide-based compound. It was found that the ionic conductivity of LiLa(BH4)3Cl was lower (1.09 × 10⁻⁵ S/cm) than the values reported earlier, for the same compound obtained by a metathesis reaction, and resulted possibly from the percolation effect [Reference Bunde, Dieterich and Roman112], already observed in mechanochemically processed materials. The study also indicated a correlation between the halide ion type and activation energy, which was the lowest for LiLa(BH4)3I and the highest for LiLa(BH4)3Cl.
Ionic conductivity of Li+ in selected light-metal complex hydrides and boron clusters. Reprinted with permission from Ref. Reference Paskevicius, Jepsen, Schouwink, Cerny, Ravnsbaek, Filinchuk, Dornheim, Besenbacherf and Jensen8, copyright 2017 The Royal Society of Chemistry.
The newly discovered bimetallic LiCa3(BH4)(BO3)2 borohydride borate [Reference Lee, Filinchuk, Lee, Suh, Kim, Yu and Cho113] was also reported to have a relatively high ionic conductivity at RT (2.5 × 10⁻⁶ S/cm) [Reference Didelot and Cerny31]. This number was further increased to 1 × 10⁻⁵ S/cm for the samples prepared with excess of lithium and doped with either heterovalent Na+ or homovalent Sr2+. The presence of extra atoms in the crystal structure did not affect the activation energy values, which indicated the same conduction mechanism in the undoped and doped compositions. The topological analysis suggested that the conduction paths were composed exclusively of BO33− anions, which formed face connected tetra- and octahedra accessible for Li+ jumps. The percolating pathway was stabilized by the calcium borohydride substructure, which was not directly involved in the conduction mechanism and indicated vacancy-dependent mobility of Li-ions. LiCa3(BH4)(BO3)2, as a first member of a new family of mixed anion hydrides, has opened possibility for the formation of other hydride-oxide compositions, e.g., SO42−, PO43−, or PS43−.
The investigation of the ionic conduction in borohydrides showed that in this group of compounds, the phenomenon is not exclusively vacancy-dependent and can be explained by a “paddle-wheel” mechanism [Reference Lee, Ley, Jensen and Cho26, Reference Martelli, Remhof, Borgschulte, Ackermann, Strassle, Embs, Ernst, Matsuo, Orimo and Zuttel114, Reference Skripov, Soloninin, Ley, Jensen and Filinchuk115]. It means that in the crystal structures based on [M′Xn]δ− polyanions, the fast ionic conductivity is promoted by a high rotational mobility of the [M′Xn]δ− units, which in turn, decreases the associated activation energy [Reference Jansen116].
Owning to a high-density of ionic bonds and packed structures, which are based on coordination polyhedral, metal borohydrides and metal oxides, are very similar. The crystallographic and chemical analogies were successfully used to establish formation rules for perovskite-type metal borohydrides and to predict their physical properties [Reference Schouwink, Ley, Tissot, Hagemann, Jensen, Smrcok and Cerny117]. Disordered complex hydride perovskites may serve as ionic conductors in analogy with oxides such as La2/3−xLi3xTiO3. So far, only limited number of these compounds have been explored for their potential application in electrochemical energy storage solutions. Cs2LiY(BH4)6, a trimetallic borohydride, is one of the studied examples [Reference Sadikin, Stare, Schouwink, Ley, Jensen, Meden and Cerny29]. Unfortunately, its cubic double-perovskite crystal structure possesses neither empty crystallographic sites available for Li+ jumps nor conduction channels, with sizes suitable for migration of lithium ions. Thus, at 303 K, its reported σ value was as low as 10−9 S/cm. The Li-ion conductivity of doped lanthanide-oxide Li3+xLa3M2O12 garnets led to the study on the alkali rare-earth garnet borohydrides, of which Li3K3M2(BH4)12, M = Ce, La, were the first reported examples [Reference Brighi, Schouwink, Sadikin and Cerny30]. Their ionic conductivity at RT, 3 × 10⁻⁷ and 6 × 10⁻⁷ S/cm, respectively, was 7 orders of magnitude higher than that of undoped metal oxide garnet analogues. The doping effect of mono- and divalent cations on the Li-ion conductivity in these compounds was also investigated. The results suggested that the presence of Sr2+ or Eu2+ in Ce- and La-containing compositions increased σ by one order of magnitude in the measured temperature range. Interestingly, to observe this effect, dopant concentrations over four times smaller than in oxides were needed. The enhancement was likely due to changes in the structural dynamics related to the disordering of [BH4]− tetrahedra.
The new concept of utilizing reversible ammonia gas sorption in LiBH4 for formation of structural defects, which consequently enhanced the Li-ion mobility, has been recently reported by Zhang et al. (Fig. 3 and Table I) [Reference Zhang, Wang, Song, Miyaoka, Shinzato, Miyaoka, Ichikawa, Shi, Zhang, Isobe, Hashimoto and Kojima32, Reference Mohtadi118]. Solid-state lithium borohydride ammoniates Li(NH3)xBH4, x = 0.5 and 1.0, showed a drastic change in the ionic conductivity due to the structural modifications, resultant from the desorption of NH3. For Li(NH3)BH4, the σ value increased from 1.5 × 10⁻⁶ S/cm at 303 K to 2.21 × 10⁻³ S/cm at temperatures >313 K, which was associated with the formation of Schottky defects in the compound crystal structure. These new solid-state superconductors were also characterized by a wide electrochemical window (4 V versus Li/Li+).
(a) Crystal structures of mono-ammoniate (i) and LiBH4 (ii) with marked unit cells. (b) Li-ion conductivity of Li(NH3)BH4 during the heating (black) and cooling processes (red). The blue line represents σ of the as-received LiBH4. (c) Status of the ionic conductivity in several borohydride-type electrolytes. Reprinted with permission from Ref. Reference Mohtadi118, copyright 2018 Elsevier Inc.

Composites
One of the alternative methods promoting the high ionic conductivity in lithium borohydride is the formation of composites with other materials. High σ (10−4 S/cm) at RT was observed for the LiBH4–SiO2 nanocomposite prepared by melt infiltration of the borohydride into a mesoporous inorganic silica scaffold [Reference Blanchard, Nale, Sveinbjornsson, Eggenhuisen, Verkuijlen, Suwarno, Vegge, Kentgens and de Jongh33, Reference Ngene, Adelhelm, Beale, de Jong and de Jongh119]. Given the high concentration of the insulating SiO2 in the material (up to 50 vol%) and limited stabilization of HT-LiBH4 in the matrix pores, the measured ionic conductivity values were surprising. However, the study suggested that the high mobility of Li+ in this case was related to the high density of defects and low diffusion barriers at the interface between two solids, which resulted from disorder, strain, and space-charge regions [Reference Blanchard, Nale, Sveinbjornsson, Eggenhuisen, Verkuijlen, Suwarno, Vegge, Kentgens and de Jongh33, Reference Verdal, Udovic, Rush, Liu, Majzoub, Vajo and Gross120]. The follow up studies on the same system, though synthesized by high energy milling, also demonstrated the fast Li+ diffusion in the obtained materials (10−4 S/cm at RT) [Reference Choi, Lee, Oh and Cho34]. This confirmed the importance of the interface-related processes on the enhancement of the ionic conductivity in LiBH4–SiO2. A similar study was later performed on the LiBH4–Al2O3 system [Reference Choi, Lee, Choi, Chae, Oh and Cho35]. The results showed that the Li+ ion conductivity of the composite reached 2 × 10⁻⁴ S/cm at RT and was associated with the formation of a highly defective interface between two solids. Motivated by this discovery, other nano/composites have also been explored. Teprovich et al. reported on fast ionic conduction in the LiBH4–C60 system and demonstrated the enhanced mobility of Li+ in the presence of C60, which for the mixture with a ratio of 70:30 wt% reached 2.0 × 10⁻⁵ and 2.0 × 10⁻³ at 298 K and 413 K, respectively [Reference Teprovich, Colon-Mercado, Ward, Peters, Giri, Zhou, Greenway, Compton, Jena and Zidan36]. This behavior resulted from the nonionic mechanism, which assumed destabilization of the Li+/[BH4]− ion pairs in the presence of fullerenes.
The high ionic conductivity of polycrystalline α- and β-Li3N [Reference Li, Wu, Araújo, Scheicher, Blomqvist, Ahuja, Xiong, Feng and Chen121] at RT (approximately 10−4 S/cm for both phases), with however a narrow potential window (<1 V), motivated studies on the LiBH4–Li3N system [Reference Zhan, Zhang, Zhuang, Fang, Zhu, Guo, Chen, Wang and Li37]. Materials prepared by mechanochemical methods contained crystalline LT-LiBH4 and β-Li3N, and below 380 K, their ionic conductivity was two orders of magnitude higher than unprocessed LT-LiBH4 (10−5 versus 10−7 S/cm at 323 K). Although no presence of crystalline intermediate phases was observed, IR studies indicated the formation of N–H chemical bonds. In addition, no occurrence of hexagonal HT-LiBH4 was confirmed in the studied samples. Based on the results, it was concluded that the observed increase in the mobility of Li+ ions was most likely associated with a high defect concentration at the interfaces between crystalline structures and amorphous components. A high σ of lithium imide [Reference Boukamp and Huggins48] has also attracted attention to the LiBH4–Li2NH system [Reference Zhang, Zhan, Zhuang, Zhu, Wan, Guo, Chen, Wang and Li38, Reference Wang, Cao, Zhang, Chen, Wu, Pistidda, Ju, Zhou, Wu, Etter, Klassen, Dornheim and Chen39]. The series of borohydride-imide composites prepared with molar ratios 1:1, 1:2, and 1:4 showed ionic conductivities of 10−6 and 10−2 S/cm at 323 K and 373 K, respectively [Reference Zhang, Zhan, Zhuang, Zhu, Wan, Guo, Chen, Wang and Li38]. The observed enhancement of the Li-ion diffusion was due to the formation of favorable boundaries by both phases. The increasing concentration of Li2NH in the system lowered the activation energy in the higher temperature range (373–393 K) but played an opposite effect within the lower temperature zone (323–363 K). In a recent study, the same system showed the formation of a new cavity-rich orthorhombic phase with yet unknown crystal structure [Reference Wang, Cao, Zhang, Chen, Wu, Pistidda, Ju, Zhou, Wu, Etter, Klassen, Dornheim and Chen39]. The σ values measured for this material oscillated in the same range as in the previous reports and showed the same temperature dependence as the earlier investigated compositions [Reference Zhang, Zhan, Zhuang, Zhu, Wan, Guo, Chen, Wang and Li38].
There are also several reports on the ionic conductivity of Li+ in borohydride–borohydride/hydride composites. A series of LiBH4 and Ca(BH4)2 powder mixtures were obtained by ball milling [Reference Sveinbjörnsson, Blanchard, Myrdal, Younesi, Viskinde, Riktor, Norby and Vegge40]. The synthesized materials did not form a bimetallic borohydride. Instead, they consisted of orthorhombic LiBH4, various Ca(BH4)2 polymorphs, and a small amount of CaH2 that formed upon heating. At 313 K, ionic conductivities of the obtained composites were lower than that of LiBH4 processed in the same way (e.g., 8.8 × 10⁻⁶ versus 4.6 × 10⁻⁵ for 0.75LiBH4–0.25Ca(BH4)2 and lithium borohydride, respectively). The increased σ was linked to the formation of defects and interfaces upon milling that was likely to open new Li-ion condition pathways. The similar interpretation of the results was given for the mechanochemically processed xLiBH4–NaBH4 powder mixtures [Reference Xiang, Zhang, Zhan, Zhu, Guo, Chen, Wang and Li41]. Milling did not cause the formation of a stoichiometric bimetallic borohydride or a solid solution, and the obtained samples consisted of LT-LiBH4 and NaBH4. Below the LiBH4 transition temperature, the composites revealed ionic conductivities of one or two orders of magnitude higher than that of pristine LT-LiBH4. On the other hand, above 373 K, their σ reached 10−2 S/cm. The result demonstrated that while higher amount of LiBH4 in the mixtures increased the mobility of Li+, the higher fraction of NaBH4 reduced the activation energy values. The ball milled LiBH4–MgH2 composite comprised LT-LiBH4 and MgH2 and had 10 times increased mobility of Li+ at temperatures <373 K, as compared with LT-LiBH4 [Reference López-Aranguren, Berti, Dao, Zhang, Cuevas, Latroche and Jordy42]. In the follow up study, Xiang et al. investigated mechanochemically processed powder mixtures of LiBH4–NaBH4–xMgH2, with x = 10, 20, and 30% [Reference Xiang, Zhang, Zhu, Guo, Chen and Li43]. The processed materials consisted of crystalline NaBH4 and MgH2, while the LiBH4 phase was most likely amorphous. For the LiBH4–NaBH4–30%MgH2 composition, Li+ ion conductivities reached 2.1 × 10⁻⁵ S/cm and 11.2 × 10⁻³ S/cm at 333 K and 383 K, respectively. Both values were significantly higher than those of LT/HT-LiBH4. The measurements also identified wide potential windows for the studied compositions, ranging from −1 to 4 V (versus Li/Li+), which indicated a high electrochemical stability of the materials. Recently, the ionic conductivities of the LiBH4–NaX (X = Cl, I) composites, obtained by ball milling, were reported [Reference Xiang, Zhang, Lin, Zhu, Guo, Chen and Li44]. The study showed the presence of the LiBH4−xClx halide solid solution and the eutectic LiBH4–NaBH4 composite in the processed LiBH4–NaCl powder mixture. Their coexistence was likely to facilitate the ionic transportation within the system, which below 373 K was greater by 10–100 times than that of LT-LiBH4 and increased to values of 10−2 S/cm above 373 K. Much higher conductivity of Li+ at lower temperatures (approximately 10−3 S/cm at 300 K) was observed in the crystalline mixture of 90LiBH4–10P2S5 [Reference Unemoto, Wu, Udovic, Matsuo, Ikeshoji and Orimo45]. Thermal heating of the material did not reveal any phase transition which confirmed the composite stability up to 473 K. This new phase was characterized by high plasticity and possessed a wide potential window (0–5 V), which made it suitable for a battery application.
The addition effect of crystalline LiBH4 on the ionic conductivity of sulfide glass electrolytes was also studied [Reference Yamauchi, Sakuda, Hayashi and Tatsumisago46]. The results showed that a higher content of LiBH4 increased the conductivity of Li+ in the mechanochemically processed mixture of xLiBH4–(100 − x)0.75Li2S·0.25P2S5. At RT, the composite with x = 33 showed the highest sigma (1.6 × 10⁻³ S/cm) σ and the lowest activation energy (0.30 eV). The Raman spectroscopy results suggested that the state of [BH4]− incorporated into the sulfide glass matrix was the same as in the HT-LiBH4, with the high rotational freedom and delocalized negative charge. As a consequence, the electrostatic interactions between Li+ and [BH4]− were weakened, which increased σ values in the obtained glasses. The addition of Li(BH4)3I also enhanced the Li-ion ion conduction of 0.75Li2S·0.25P2S5 [Reference El Kharbachi, Hu, Yoshida, Vajeeston, Kim, Sorby, Orimo, Fjellvag and Hauback47]. The Li(BH4)3I–0.75Li2S·0.25P2S5 mixture, with a molar ratio of 1:2, revealed σ in the order of 10−3 S/cm at RT, with the activation energy of 0.30 eV.
Alanates
Li-based LiAlH4 and Li3AlH6 alanates is another group of light-weight hydrogen-based materials, investigated in view of their potential application for electrochemical energy storage. These complex hydrides with ionic bonds between Li+ and [AlH4]−/[AlH6]3− are electrical insulators. The Li-ion conductivity of mechanochemically synthesized compounds was reported to increase linearly from 8.7 × 10⁻⁹ to 4.7 × 10⁻⁶ S/cm for LiAlH4 and from 1.4 × 10⁻⁷ to 1.6 × 10⁻⁵ S/cm for Li3AlH6, when measured from RT to 393 K [Reference Unemoto, Matsuo and Orimo12, Reference Oguchi, Matsuo, Sato, Takamura, Maekawa, Kuwano and Orimo18]. Alanates did not show any jump in the mobility of lithium cations, and the corresponding values of the activation energy were 0.76 and 0.61 eV, respectively. The effect of potential halide ion substitution/presence on the ionic conductivity in Li3AlH6 was also investigated. Ball-milled powder mixtures of Li3AlH6–LiCl and Li3AlH6–LiI, with a molar ratio of 3:1, had σ one and two orders of magnitude higher compared to pure Li3AlH6, respectively. The study also showed the reduction of the activation energy associated with the presence of LiCl and LiI. The likely origin of the observed improvement was associated either with an increased carrier concentration and/or formation of extra vacancies as a result of possible hydrogen substitution by the halide anions [Reference Oguchi, Matsuo, Sato, Takamura, Maekawa, Kuwano and Orimo18]. Unfortunately, no follow up studies have been conducted to verify the proposed hypothesis.
Imides & amides
Li2NH was the first reported hydrogen-based material with the high Li+ mobility at RT (2.5 × 10⁻⁴ S/cm) [Reference Li, Wu, Xiong, Feng and Chen21, Reference Boukamp and Huggins48]. The ionic conduction was mediated by Frenkel pair defects and/or charged vacancies. The cation diffusion occurred via pathways which involved octahedral to tetrahedral jumps along the [001] crystallographic direction. Although, at 400 K, the compound’s Li-ion conductivity was as high as 8.40 × 10⁻² S/cm, poor electrochemical stability (0.7 V versus Li+/Li) hindered its application as a solid-state ionic conductor [Reference Li, Wu, Xiong, Feng and Chen21]. The Li-based bimetallic systems with Ca and Mg were also explored [Reference Li, Wu, Xiong, Feng and Chen21]. While a high fraction of empty tetrahedral sites in Li2Mg(NH)2 was expected to facilitate the movement of thermally activated ions [Reference Rijssenbeek, Gao, Hanson, Huang, Jones and Toby49], neighboring Ca[NH]6 octahedral layers in Li2Ca(NH)2 could provide 2D channels necessary for the diffusion of Li+ ions [Reference Wu, Xiong, Liu, Liu, Hu, Chen, Feng and Wee122]. However, the obtained results did not suggest improved ionic mobility in any of these compounds. At RT, σ for Li2Ca(NH)2 reached only 6.40 × 10⁻⁶ S/cm, while for Li2Mg(NH)2, it was hardly detectable [Reference Li, Wu, Xiong, Feng and Chen21].
The conductivity of Li+ in LiNH2 is much worse than that of Li2NH. The reported value at RT was very low (3 × 10⁻⁹ S/cm) and at 520 K reached only 2.63 × 10⁻⁵ S/cm [Reference Li, Wu, Xiong, Feng and Chen21]. The theoretical studies on this amide suggested that, even though the Li-ion migration energy was relatively low along different crystallographic directions, defects necessary to mediate the ionic diffusion in the compound were difficult to form, which resulted in low σ. The ionic conductivity was however improved in the LiNH2–LiI system, where the formation of Li3(NH2)2I was observed. The compound was crystallized with the double perovskite structure and its σ was 1 × 10⁻⁵ S/cm at 296 K [Reference Oguchi, Matsuo, Sato, Takamura, Maekawa, Kuwano and Orimo18].
Lightweight CMHs as Na-ion conductors
The dominance of LIBs on the market naturally shifted the research focus toward solutions, thus compositions, which could improve the current technology. This has not been different for the hydrides, of which those containing Li+ ions have become the most studied group. However, the recent development in the field of sodium ion batteries (NIBs) sparked the research on the potential electrochemical application of Na-based light-metal hydride complexes [Reference Choi and Aurbach2, Reference Vaalma, Buchholz, Weil and Passerini123]. Several Na-based complex hydrides have been investigated, often in parallel to their Li-based analogues; yet, the number of reported cases is very limited. The studied examples of the hydride-based Na-ion conductors also demonstrate that there are still a lot of challenges to be addressed within this emerging technology.
Borohydrides
The conductivity of Na+ ions in complex hydrides was first studied in the Na(BH4)–Na(NH2)–NaI system [Reference Unemoto, Matsuo and Orimo12, Reference Matsuo, Kuromoto, Sato, Oguchi, Takamura and Orimo58, Reference Matsuo, Oguchi, Sato, Takamura, Tsuchida, Ikeshoji and Orimo59]. At RT, the σ values for the host materials (e.g., Na(BH4), Na(NH2), and NaI) as well as the formed Na3(BH4)2I and Na2(NH2)I were very low, in the range of 10−10–10−9 S/m. However, the number increased significantly for Na2(BH4)(NH2) and reached 2 × 10⁻⁶ S/cm at 300 K. This phase formed by mechanochemical processing of the Na(BH4) and Na(NH2) powder mixture, adopted the anti-perovskite cubic K3SO4F-type structure, which was known to be the HT polymorph [Reference Somer, Acar, Koz, Kokal, Hohn, Cardoso-Gil, Aydemir and Akselrud124]. Unlike the nominal Na(BH4)I and Na(NH2)I, the crystal structure of Na2(BH4)(NH2) revealed disordered distribution of the Na+ cations, which occupied only 2/3 of the available crystallographic sites. This suggested that the increased mobility of Na ions was vacancy diffusion-dependent. The results also demonstrated the high electrochemical stability of the compound up to 6 V (versus Na/Na+) [Reference Unemoto, Matsuo and Orimo12, Reference Matsuo, Kuromoto, Sato, Oguchi, Takamura and Orimo58]. Roedern et al. reported on the mobility of the Na+ in bimetallic NaY(BH4)4 (6.98 × 10⁻⁷ S/cm), which at RT was one order of magnitude lower than that of the Li-based analogue [Reference Roedern, Lee, Ley, Park, Cho, Skibsted and Jensen24].
Studies on the superionic conductivity of Na-ions in higher boranes, such as [B10H10]2− or [B12H12]2− [Reference Udovic, Matsuo, Tang, Wu, Stavila, Soloninin, Skoryunov, Babanova, Skripov, Rush, Unemoto, Takamura and Orimo65], suggested that the presence of both [BxHx]2− and [BH4]− anions in the same crystal structure could stabilize the formation of high-symmetry compounds with the high cationic mobility close to RT. The concept was successfully applied to the Na3BH4B12H12 mixed-anion borane, whose σ at RT was 0.5 × 10⁻³ S/cm [Reference Sadikin, Brighi, Schouwink and Cerny60], thus comparable to the currently available Na-based superionics, such as β-alumina [Reference Hooper125], NASICON [Reference Bohnke, Ronchetti and Mazza126] or sulfide-based glass ceramics [Reference Hayashi, Noi, Sakuda and Tatsumisago127]. The 2D ion conduction path involved mixed-anion slabs without Na2B12H12 ones. Na3BH4B12H12 was stable at RT and showed an electrochemical window up to 10 V (versus Na+/Na) [Reference Sadikin, Brighi, Schouwink and Cerny60]. This study was followed by the discovery of the high Na+ cation mobility in Na3NH2B12H12, another mixed-anion borane, for which σ = 1.0 × 10⁻⁴ S/cm, at 372 K. The composition also revealed high electrochemical (10 V versus Na/Na+) and thermal stability (up to 593 K) [Reference He, Lin, Li, Filinchuk, Zhang, Liu, Yang, Hou, Deng, Li, Shao, Wang and Lu61].
Alanates
Similar to Li-based alanates, mechanochemically synthesized NaAlH4 and Na3AlH6 were also studied in view of their potential application as SSEs in rechargeable batteries [Reference Unemoto, Matsuo and Orimo12, Reference Matsuo, Oguchi, Sato, Takamura, Tsuchida, Ikeshoji and Orimo59, Reference Oguchi, Matsuo, Kuronnoto, Kuwano and Orimo62]. The results showed that Na3AlH6 had higher ionic conductivity than NaAlH4, 6.4 × 10⁻⁷ and 2.1 × 10⁻¹⁰ S/cm, respectively. Upon thermal heating, σ for Na3AlH6 increased up to 4.1 × 10⁻⁶ S/cm at 433 K. In comparison to their Li-based counterparts, it was demonstrated that hydrides with the [AlH6]3− complex anion had always higher conductivities than those with the [AlH4]− units.
Conductivity of lightweight CMHs in Mg batteries
The post-lithium-ion battery research has recently shifted focus toward multivalent cations (e.g., Al3+, Ca2+, or Mg2+), which could further increase the energy density of the rechargeable batteries. Magnesium batteries attracted a lot of interest. With high negative potential (−2.4 V), high volumetric capacity (3832 mA h/cm versus 2062 mA h/cm and 1136 mA h/cm, for Li and Na, respectively), low cost, and safety, Mg holds very promising properties [Reference Choi and Aurbach2, Reference Mohtadi and Mizuno3, Reference Mohtadi and Orimo6, Reference Matsuo, Remhof, Martelli, Caputo, Ernst, Miura, Sato, Oguchi, Maekawa, Takamura, Borgschulte, Zuttel and Orimo20, Reference Matsuo, Oguchi, Sato, Takamura, Tsuchida, Ikeshoji and Orimo59, Reference Higashi, Miwa, Aoki and Takechi69, Reference Shao, Liu, Li, Gu, Nie, Engelhard, Xiao, Lv, Wang, Zhang and Liu71, Reference Mohtadi, Matsui, Arthur and Hwang128, Reference Mohtadi, Remhof and Jena129, Reference Amir, Vestfrid, Chusid, Gofer and Aurbach130, Reference Aurbach, Lu, Schechter, Gofer, Gizbar, Turgeman, Cohen, Moshkovich and Levi131, Reference Yoo, Shterenberg, Gofer, Gershinsky, Pour and Aurbach132]. As soon as the feasibility of Mg-based electrochemical cells was demonstrated [Reference Aurbach, Lu, Schechter, Gofer, Gizbar, Turgeman, Cohen, Moshkovich and Levi131], interest in their development has increased rapidly [Reference Mohtadi, Remhof and Jena129, Reference Matsui133, Reference Aurbach, Cohen and Moshkovich134, Reference Muldoon, Bucur, Oliver, Sugimoto, Matsui, Kim, Allred, Zajicek and Kotani135]. However, still poor and not fully understood electrolyte performances significantly delay the progress [Reference Mohtadi and Orimo6, Reference Wang, Cao, Zhang, Chen, Wu, Pistidda, Ju, Zhou, Wu, Etter, Klassen, Dornheim and Chen39, Reference Roedern, Kühnel, Remhof and Battaglia70, Reference Shao, Liu, Li, Gu, Nie, Engelhard, Xiao, Lv, Wang, Zhang and Liu71, Reference Mohtadi, Remhof and Jena129, Reference Amir, Vestfrid, Chusid, Gofer and Aurbach130, Reference Yoo, Shterenberg, Gofer, Gershinsky, Pour and Aurbach132, Reference Aurbach, Cohen and Moshkovich134]. The simple Mg salts mixed with typical solvents such as propylene carbonate or diethyl carbonate, similar to those used in LIBs, were shown to form a nonconductive layer on the Mg surface and did not allow for the reversible electrodeposition (also known as plating/stripping or deposition/dissolution) of Mg metal [Reference Yoo, Shterenberg, Gofer, Gershinsky, Pour and Aurbach132, Reference Aurbach, Cohen and Moshkovich134]. On the other hand, the well-suited electrolytes, based on organohalomagnesium salts and complexes, with high electrochemical stability against oxidation were found to be corrosive due to the presence of chlorides [Reference Amir, Vestfrid, Chusid, Gofer and Aurbach130, Reference Muldoon, Bucur, Oliver, Sugimoto, Matsui, Kim, Allred, Zajicek and Kotani135]. In 2012, Mohtadi et al. demonstrated the application of Mg(BH4)2 as a first example of the halogen-free simple salt-type electrolyte in Mg-based batteries [Reference Mohtadi, Matsui, Arthur and Hwang128]. Mg(BH4)2 in ethereal solvents [i.e., tetrahydrofuran (THF) and dimethoxyethane (DME)] enabled the reversible Mg plating/stripping. Interestingly, the addition of LiBH4 to mixed Mg(BH4)2 and DME increased the current density and Coulombic efficiency to 94%. This was attributed to the higher dissociation of the Mg(BH4)2 contact ion pair, which led to enhanced presence of MgBH4+ ions that acted as charge carriers (note that these studies recently inspired using Ca(BH4)2 in THF to successfully plate/strip Ca metal) [Reference Wang, Gao, Chen, Jin, Kuss and Bruce136]. The later study, which expanded the choice of chelatic solvent to diglyme (DGM), demonstrated the direct relationship between the number of formed electrodonating oxygen sites and the Coulombic efficiency of the corresponding solvated Mg complex electrolytes, which for Mg(BH4)2–LiBH4 in DGM reached almost 100% [Reference Shao, Liu, Li, Gu, Nie, Engelhard, Xiao, Lv, Wang, Zhang and Liu71]. The electrolyte conductivity was 3.27 × 10⁻³ S/cm and the addition of LiBH4, which acted as a second coordination ligand, accelerated the kinetics of the stripping process. Tuerxun et al. reported on the Mg(BH4)2–LiBH4 electrolyte in tetraglyme (TG), which enhanced the Mg(BH4)2 solubility and claimed a widened electrochemical potential window (up to 2.4 V versus Mg/Mg2+, note that the high viscosity of TG could mask the decomposition reaction owing to the slow kinetics, thereby artificially expanding the stability) [Reference Tuerxun, Abulizi, NuLi, Su, Yang and Wang72]. The reported σ value was 3.8 × 10⁻⁵ S/cm, and the Coulombic efficiency reached 95%. Mg(BH4)2–LiBH4 in DGM/TG solvents with the PP14TFSI ionic liquid displayed an ionic conductivity of 3.01 × 10⁻³ S/cm, with a slightly lower Coulombic efficiency (92%), where the observed increased electrochemical stability (3.0 V versus Mg/Mg2+) was likely due to sluggish decomposition kinetic effects [Reference Su, Nuli, Wang, Yusipu, Yang and Wang73]. In a recent report, the presence of multifunctional additive THFPB in the Mg(BH4)2DGM (σ = 3.72 × 10⁻³ S/m at 298 K) increased the Mg(BH4)2 solubility. The electrolyte showed improved current density and an electrochemical stability up to 2.8 V versus Mg/Mg2+. It also enhanced the Coulombic efficiency of Mg plating/stripping to 99% [Reference Xu, Zhang, Li, Qiao, Lu, Tang, Dong, Ma, Liu, Zhou and Cui74]. In this case, the reaction of the reductive borohydride with the acidic additive was indicated, thereby partially transforming the borohydride, and therefore, further investigation is needed to identify the new species.
Although the nonaqueous, halogen-free liquid borohydride electrolytes altered the design principles of how Mg metal compatible electrolytes need to look like, stability and safety remain a concern. In addition, the number of suitable SSEs is very limited. Designing solids with sufficiently high magnesium ion conductivity appears challenging due to the divalent positive charge carried by Mg2+ cations. Polymer-electrolyte systems, typically based on polyethylene oxide (PEO) and Mg salts, appeared very attractive, but the studies showed incompatibility with the Mg metal anode. In inorganic solids, high Mg conductivity has also been (σ = 10−5 S/cm) observed but typically at high temperatures (>673 K). However, the successful application of Mg(BH4)2-based materials as liquid electrolytes, owing to the high reducing stability of the [BH4]− anion, has stimulated research on Mg borohydride-based solid-state conductors. So far, only three examples of such materials have been reported. In 2014, Higashi et al. demonstrated enhanced Mg ion conductivity in the Mg(BH2)(NH2) ionic salt [Reference Higashi, Miwa, Aoki and Takechi69]. This band gap insulator, with σ of 10−6 S/cm at 393 K, was also characterized by a relatively wide electrochemical window (up to 3 V versus Mg2+/Mg). In 2015, Shao et al. reported on the nanocomposite polymer electrolyte based on PEO, Mg(BH4)2, and MgO, which allowed for reversible Mg deposition/dissolution with 98% Coulombic efficiency [Reference Shao, Rajput, Hu, Hu, Liu, Wei, Gu, Deng, Xu, Han, Wang, Nie, Li, Zavadil, Xiao, Wang, Henderson, Zhang, Wang, Mueller, Persson and Liu100]. High values of σ at lower temperatures were recently reported for cis-Mg(en)(BH4)2, en = NH2(CH2)2NH2, by Roedern et al. [Reference Roedern, Kühnel, Remhof and Battaglia70]. The material was obtained by the mechanochemical processing of the ethylene diamine and Mg(BH4)2 powder mixture. The mobility of Mg2+ ions in cis-Mg(en)(BH4)2 increased from 5 × 10⁻⁸ S/cm to 6 × 10⁻⁵ S/cm in the temperature range of 303–343 K.
Conductivity of Li, Na, and Mg ions in 3D boron clusters (closo-boranes)
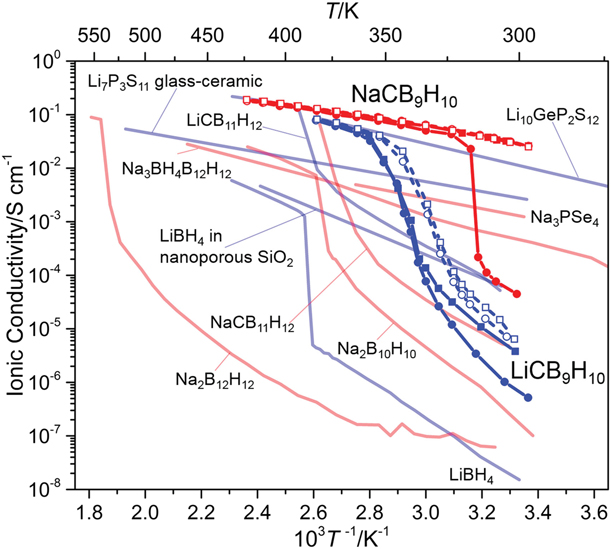
Boron clusters-based salts are known side products that form during the thermal dehydrogenation of borohydrides [Reference Orimo, Nakamori, Eliseo, Züttel and Jensen7]. Their high thermodynamic stability contributes to partial irreversibility in the hydrogenation of borohydrides, which makes them highly undesirable. In line with the efforts to tackle this challenge, studies aimed at understanding the structural and thermal properties of these salts suggested a potential application of these materials as SSEs [Reference Paskevicius, Pitt, Brown, Sheppard, Chumphongphan and Buckley137, Reference Skripov, Babanova, Soloninin, Stavila, Verdal, Udovic and Rush138]. The detailed investigation of the Li2B12H12 structural evolution indicated possible Li-ion conduction following transformation at 638 K to a disordered phase (β phase) with a frustrated Li+ lattice [Reference Paskevicius, Pitt, Brown, Sheppard, Chumphongphan and Buckley137]. Solid-state nuclear magnetic resonance (NMR) study of the spin-lattice relaxation in Na2B12H12 salts revealed a substantial increase in the reorientational jump rates of B12H122−, accompanied by fast translational diffusion of Na+ following a first-order transition near 520 K [Reference Skripov, Babanova, Soloninin, Stavila, Verdal, Udovic and Rush138]. As discussed in the section Lightweight CMHs as Li-ion conductors, the recent attention to boron hydrogen compounds as SSEs for LIBs was triggered by the discovery of high Li-ion conductivity in the high-temperature phase (10−3 S/cm) of complex hydride LiBH4 [Reference Matsuo, Nakamori, Orimo, Maekawa and Takamura9]. These remained the main focus of research until 2014, where interest of examining the thermally stable boron clusters as SSEs (Fig. 2 and Table I) started gaining momentum [Reference Mohtadi and Orimo6]. This shift occurred concurrent with independent reports of boron clusters as highly performing liquid electrolytes for a rechargeable magnesium battery [Reference Carter, Mohtadi, Arthur, Mizuno, Zhang, Shirai and Kampf76], where in this case icosahedral boron clusters were exploited, owing to their wide electrochemical window and inertness toward Mg metal [Reference Tutusaus and Mohtadi5]. In Subsections titled “Hydroborate-based ionic conductors” and “Carbaborate-based ionic conductors,” this new family of ionic conductors is discussed.
Hydroborate-based ionic conductors
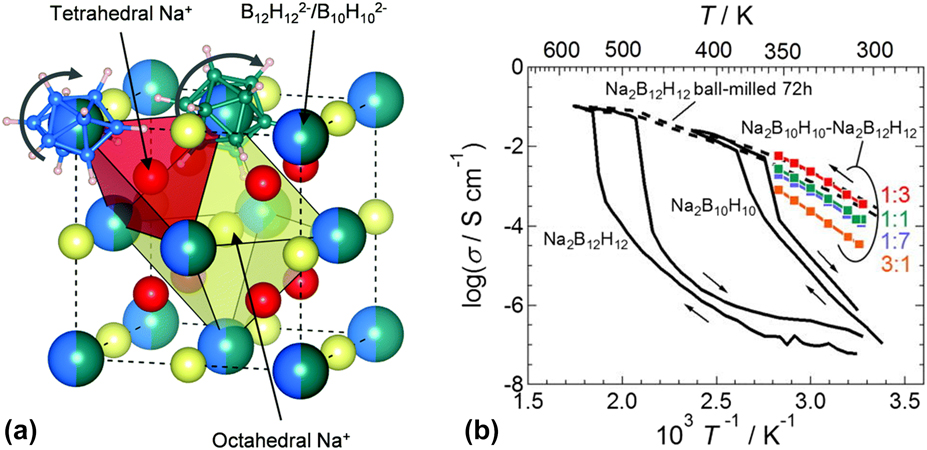
The exploitation and demonstration of closo-boranes as potential electrolytes for multivalent batteries (i.e., magnesium) was first reported by Carter el al. [Reference Carter, Mohtadi, Arthur, Mizuno, Zhang, Shirai and Kampf76]. The use of the borane clusters was proposed to enable the expansion of the electrochemical window of magnesium borohydride (discussed earlier), previously shown to possess high compatibility with the Mg metal [Reference Tutusaus and Mohtadi5]. One key challenge with the B12H122− anion was its insolubility in ethereal solvents that could function in Mg batteries, and for that, modifications of the cluster’s icosahedron was necessary, as discussed in the section titled “Carbaborate-based ionic conductors.” At the same time, the presence of cationic translational mobility in boron clusters was discovered and first reported for Na2B12H12, where the high Na+ ion conductivity in the order of 10−1 S/cm near 540 K was obtained [Reference Udovic, Matsuo, Unemoto, Verdal, Stavila, Skripov, Rush, Takamura and Orimo63]. These conductivities were observed following the transition from a low-temperature (ordered monoclinic) to a high-temperature (disordered, body centered cubic) phase and were consistent with 23Na NMR measurements showing enhancements in the Na+ cation jump rate (>2 × 10⁸ jumps/s) in the high temperature polymorph [Reference Skripov, Babanova, Soloninin, Stavila, Verdal, Udovic and Rush138]. It was also speculated that the reorientational mobility of the boron clusters could affect the ionic conductivity through the paddle-wheel mechanism, e.g., rapid spinning of B12H122− accompanied the phase transition. While this fundamental finding was interesting, from a SSE utility point of view, reduction of the transition temperature and enhancements in the cationic conductivities were needed. This was initially attained through shifting to Na2B10H10, where a disordered face centered cubic phase (>360 K) allowed for high Na-ion conductivities in the order of 0.01 S/cm at 383 K (Figs. 4 and 5) [Reference Udovic, Matsuo, Tang, Wu, Stavila, Soloninin, Skoryunov, Babanova, Skripov, Rush, Unemoto, Takamura and Orimo65]. It was suggested that, compared to the B12H122−, the less spherical B10H102− allowed for more free space between anions for the cation diffusion. In any case, boron clusters were thought to allow for the cationic mobility as a result of a large number of Na+ vacancies coupled with a large anion/cation size ratio that was thought to lead to larger interstitial diffusion pathways [Reference Udovic, Matsuo, Unemoto, Verdal, Stavila, Skripov, Rush, Takamura and Orimo63, Reference Udovic, Matsuo, Tang, Wu, Stavila, Soloninin, Skoryunov, Babanova, Skripov, Rush, Unemoto, Takamura and Orimo65]. These results suggested that the anion dynamics was one major contributor to the conduction of the cation. For example, ab initio molecular dynamics (AIMD) simulations showed that the Li+ ion diffusivity in β-Li2B12H12 would be reduced by 3 orders of magnitude if the anion was constrained and immobile [Reference Varley, Kweon, Mehta, Shea, Heo, Udovic, Stavila and Wood139]. Recently, computational studies have demonstrated that the energy landscape that the cation experiences, which determines its mobility, is not only resultant of the anion dynamics but rather the complex interplay between the anion rotation/vibrations, the density of accessible diffusion sites, and the nature of local bonding [Reference Kweon, Varley, Shea, Adelstein, Mehta, Heo, Udovic, Stavila and Wood140].
(a) T-dependent ionic conductivity of Na2B10H10 compared with other related materials. Reprinted with permission from Ref. Reference Udovic, Matsuo, Tang, Wu, Stavila, Soloninin, Skoryunov, Babanova, Skripov, Rush, Unemoto, Takamura and Orimo65, copyright 2014 WILEY‐VCH. (b) T-dependent ionic conductivity of as-milled M2B12H12: MBH4 (M = Li, Na) and as-prepared Na3BH4B12H12. Conductivity of the Na2B12H12 precursor is shown for comparison. Reprinted with permission from Ref. Reference Sadikin, Brighi, Schouwink and Cerny60, copyright 2015 WILEY‐VCH. (c) T-dependent ionic conductivity of LiNaB12H12, Na2B12H12, and Li2B12H12. Reprinted with permission from Ref. Reference He, Li, Nakajima, Tumanov, Filinchuk, Hwang, Sharma, Hagemann and Akiba54, copyright 2015 American Chemical Society.

(a) Simplified structure of Na2B10H10B12H12 based on the HT phase of Na2B10H10. Partially occupied Na+ ions sites are shown in different colors to distinguish tetrahedral and octahedral coordination. B12H122− and B10H102− anions are randomly distributed in the face centered cubic framework. Reprinted with permission from Ref. Reference Duchene, Kuhnel, Rentsch, Remhof, Hagemann and Battaglia66, copyright 2017 The Royal Society of Chemistry. (b) Na-ion conductivity of Na2B10H10–Na2B12H12 pseudobinary complex hydride with various molar ratios ball milled for 5 h. Different symbols denote the Na2B10H10:Na2B12H12 molar ratio; 3:1—orange, 1:1—green, 1:3—red, and 1:7—blue. Conductivity data for pristine Na2B12H12 are indicated for comparison. Reprinted with permission from Ref. Reference Yoshida, Sato, Unemoto, Matsuo, Ikeshoji, Udovic and Orimo67, copyright 2017 AIP Publishing.
In an effort to enhance the conductivity of the Na+ cations at lower temperatures, other design approaches included partial substitution with another anion such as [BH4]− and X−, X = Br, Cl, I, or with a cation like Li+ were applied [Reference He, Li, Nakajima, Tumanov, Filinchuk, Hwang, Sharma, Hagemann and Akiba54, Reference Sadikin, Brighi, Schouwink and Cerny60]. In cases where [BH4]− was present in the structure, the absence of order-disorder transition hinted that the anion dynamics were less important contributor to the superconductivities and that structural factors were more at play. For example, the conductivity of Na3BH4B12H12 at RT was 0.5 × 10⁻³ S/cm, which was several orders of magnitudes higher than that of Na2B12H12 [Fig. 4(b)] [Reference Sadikin, Brighi, Schouwink and Cerny60]. Partial substitution of [BH4]− with I− yielded much lower RT conductivities (in the order of 10−5 S/cm), which increased dramatically above 360 K (0.1 S/cm) [Reference GharibDoust, Brighi, Sadikin, Ravnsbaek, Cerny, Skibsted and Jensen27]. However, a recent report investigating the effect of replacing the hydrogens in the B12H122− anion with halogens showed that high conductivities, in the order of 10−1 S/cm, were only achieved at temperatures exceeding 673 K. Restrictions in the cluster’s reorientation mobility, caused by increased anion mass and strong bonds to Na+, as a result of directional charge distribution on the halogen atoms, contributed to this behavior [Reference Hansen, Paskevicius, Jørgensen and Jensen64]. On the other hand, a cationic substitution was reported to enhance the ionic conductivity. LiNaB12H12 was shown to have σ values 8 times higher than that of Na2B12H12 at 550 K, which was hypothesized to be due to synergistic effects between the two cations [Fig. 4(c)] [Reference He, Li, Nakajima, Tumanov, Filinchuk, Hwang, Sharma, Hagemann and Akiba54]. Note that in this case, both Li+ and Na+ cations were mobile and with the increase in temperature from 393 K to 433 K decreased the Li+ transference number from 0.91 to 0.71, respectively. It is however important to point out that the synthetic approach of LiNaB12H12 utilized B10H14 resulted in the inevitable presence of other cluster fragments such as B10H102− in the electrolyte, as was shown in 11B NMR. This may have inadvertently contributed to the observed improved conductivity. In fact, recently, two independent studies have shown that incorporating B10H102− in the structure of Na2B12H12 or simply preparing a binary complex of these anions drastically enhanced the Na+ conductivity, e.g., conductivities of 2–3 orders of magnitudes higher than those of Na2B12H12 (Fig. 5) [Reference Duchene, Kuhnel, Rentsch, Remhof, Hagemann and Battaglia66, Reference Yoshida, Sato, Unemoto, Matsuo, Ikeshoji, Udovic and Orimo67].
Beyond the chemical modifications explained earlier, other approaches also sought to improve the cationic conductivity through physical treatments of the material that included the use of mechanochemistry [Reference Tang, Matsuo, Wu, Stavila, Unemoto, Orimo and Udovic50, Reference Teprovich, Colon-Mercado, Washington, Ward, Greenway, Missimer, Hartman, Velten, Christian and Zidan51]. Ball milling was used initially to briefly condition Li2B12H12 particles, which resulted in ionic conductivity in the order of 10−4 S/cm at RT. Note that prior to this study, σ measurements for Li2B12H12, following its phase transition at 628 K, were challenging, owing to its thermal instability at these temperatures. It is also important to notice that in the aforementioned approach, Li2B12H12 was prepared from the reaction between decaborane B10H14 and LiBH4, which, as explained earlier, produces other cluster fragments that could also contribute to the increase in the conductivity. Thus, this aspect calls for further structural and compositional investigations. Systematic studies of ball milling effects on conductivity improvement in several boron cluster salts were later reported, aided by PXD and Quasielastic Neutron Scattering (QENS). The main finding was that the ball milling effect went beyond particle conditioning, as was evident from the presence of the high temperature disordered phase in the processed materials at RT, which suggested a stabilized RT disordered form [Reference Tang, Matsuo, Wu, Stavila, Unemoto, Orimo and Udovic50]. Conductivity enhancements were drastic, e.g., at RT, the σ value for Na2B12H12 was three orders of magnitude higher than that of the pristine sample. It is interesting that these ball milled solid-state conductors consisted of both the low conducting and superconducting phases. It was hypothesized that the latter was present in a form of the interconnected nanocrystallites that were distributed in larger crystallites, which exhibited typical bulk-like conductivities [Reference Tang, Matsuo, Wu, Stavila, Unemoto, Orimo and Udovic50]. Recently, the ball milling effect on Li2B12H12 conductivity (measured in the order of 10−5 S/cm at RT) was revisited. Unlike previous studies, these improvements were attributed to the formation of not only Li+ but also H deficiencies as was corroborated by theoretical and experimental evidence [Reference Kim, Toyama, Oguchi, Sato, Takagi, Ikeshoji and Orimo52]. In addition, the observed enhancements were suggested to be unlikely related to a stabilization effect of the high temperature phase. Although this was in contrast with the previous report, it was evident from a structural analysis that the lattice parameters were different from those of the high temperature phase, in addition to the preservation of the Li+ structural arrangements. The occurrence of a phase transition to the high temperature disordered phase at 583 K further supported these findings. This study suggested for the first time that deficiencies of H in boron clusters that were stabilized by the cation, could be utilized to improve cationic mobilities, and has opened new opportunities for the design of this type of electrolytes.
Recently, inspired by the dramatic increase in the conductivity of LiBH4 following confinement in a nanoporous silica SBA scaffold, Li2B12H12 was encapsulated in this same scaffold in an attempt to induce similar effects [Reference Yan, Rentsch, Battaglia and Remhof53]. However, in this case, nanoconfinement of Li2B12H12 was not effective as evident from a very low conductivity compared to that of the bulk material (i.e., 10−7 S/cm at RT).
Carbaborate-based ionic conductors
The versatility and rich chemistry of boron clusters prompted investigating the effect of structural modifications on the compounds’ electrochemical properties. The first report that demonstrated the uniqueness and applicability of the carbahydroborate anions as electrolytes in multivalent batteries (i.e., magnesium) was reported by Carter et al. [Reference Carter, Mohtadi, Arthur, Mizuno, Zhang, Shirai and Kampf76], where the m-dicarborane anion C2B10H11− (two of the boron atoms were replaced by two carbons on the 1,7 positions) was used to demonstrate the solubility in ethers magnesium closo-borane compound that could efficiently deposit/strip Mg metal. The motivation for using the closo-carborane anion was its single charge, which made it less strongly coordinating to the cation compared to its divalently charged B12H122− counter, in addition to its high anodic stability. This proof of concept was the stepping-stone for the preparation of the Mg salt based on the closo-monocarborane anion CB11H12−, known for its high inertness and stability. It was a first demonstration of the simple and halogen-free salt that was compatible with the Mg metal and possessed the widest known electrochemical window amongst Mg electrolytes [Reference Tutusaus, Mohtadi, Arthur, Mizuno, Nelson and Sevryugina75]. This electrolyte has been recognized as the third major breakthrough in Mg battery electrolytes as it overcame major challenges in this battery-type [Reference Choi and Aurbach2].
In case of SSEs, the relatively high σ reported in the hydroborate salts represented an important milestone that highlighted a new potential of boron clusters as SSEs in Li- and Na-based batteries. However, for consideration in practical all-solid-state batteries (SSBs), it is necessary to show whether these high conductivities could be achieved at relevant temperatures. For example, the RT Li-ion conductivities for the sulfide based electrolytes are in the order of 10−2 S/cm (i.e., 0.025 S/cm for Li9.54 Si1.74P1.44S11.7Cl0.3) [Reference Kato, Hori, Saito, Suzuki, Hirayama, Mitsui, Yonemura, Iba and Kanno141], which are orders of magnitude higher than those reported for boron hydrogen compounds [Reference Manthiram, Yu and Wang4]. In pursuit of enhancing the cationic mobility in boron clusters, closo-carboranes, motivated also by their monovalent charge, Li and Na closo-carborane salts were examined [Reference Mohtadi and Orimo6]. The first report investigated LiCB11H12 and NaCB11H12 [Reference Tang, Unemoto, Zhou, Stavila, Matsuo, Wu, Orimo and Udovic55]. Similar to other solid-state boron clusters, LiCB11H12 and NaCB11H12 underwent transition to a superconducting (>0.1 S/cm) disordered phase, however, at much lower temperatures, 400 K and 380 K, respectively (Figs. 2 and 6). The high rate of anion reorientational jumps (1010–1011 jumps/s), its monovalent charge, and the presence of less neighbors (cation/anion molar ratio = 1:1), coupled with increased lattice constant compared to B10H102−, contributed to the enhanced conductivities. Recent studies, based on both ab initio molecular dynamics (AIMD) and QENS, have confirmed the high reported anion jump rates and showed that this behavior resulted not only from structural factors, such as anion packing or lowering in the anion charge, but also formation of a dipole, which significantly altered the energy landscape of the nearby cations. This frustrated lattice, created by carbon atoms, was suggested to counteract the ability of the phase to order and thereby reduce the transition temperature to superconducting phases [Reference Dimitrievska, Shea, Kweon, Bercx, Varley, Tang, Skripov, Stavila, Udovic and Wood142].
Ionic conductivities of boron clusters compared to other electrolytes as functions of inverse temperature. Reprinted with permission from Ref. Reference Tang, Matsuo, Wu, Stavila, Zhou, Talin, Soloninin, Skoryunov, Babanova, Skripov, Unemoto, Orimo and Udovic56, copyright 2016 WILEY‐VCH.
A follow up study examined the lithium and sodium salts of the cage-like anion CB9H10− and impressive RT conductivities of about 0.03 S/cm could be achieved in the Na salt but required preheating (i.e., sample conditioning to access the superconducting phase) to about 425 K (Fig. 6) [Reference Tang, Matsuo, Wu, Stavila, Zhou, Talin, Soloninin, Skoryunov, Babanova, Skripov, Unemoto, Orimo and Udovic56]. Note that systematic studies on the effect of the thermal cycling on the RT stability of the disordered superconducting phase are needed to discern the origin of these drastic improvements, especially given the hysteresis observed. For example, long-term stability of RT Na+ conductivity after the first heating cycle is currently unknown. Nonetheless, these findings have qualified the NaCB9H10 salt as the most Na+ conducting SSE reported to date. In addition, substantial improvements were observed for the Li-based salt (Fig. 6), in which conductivities reaching 0.03 S/cm could be achieved at 354 K. Similar to the case of the NaCB11H12 and LiCB11H12 salts, the dipole produced by the carbon atom could influence the anion orientations and create a frustrated landscape, which was akin to the high cationic mobility.
In an attempt to eliminate the need to preheat NaCB9H10 to achieve the RT high ionic conductivity and to further improve the conductivity of the respective Li-based salt, stabilization of the disordered phase was studied through the formation of what is suggested as mixed as [CB9H10CB11H12]2− salt [Reference Tang, Matsuo, Wu, Stavila, Unemoto, Orimo and Udovic50, Reference Tang, Yoshida, Soloninin, Skoryunov, Babanova, Skripov, Dimitrievska, Stavila, Orimo and Udovic57]. Simple mixing of CB9H10− and CB11H12− Li and Na salts in aqueous solutions resulted in the presence of the face centered cubic and hexagonal lattice mixtures, which were reminiscent of the disordered phases of the starting material. However, the presence of lattice disorder in both systems prevented detailed structural examination. Ball milling was also used to form the same complexes; however, it was less successful for Li-based salts. In any case, the absence of phase transitions suggested some sort of stabilization effect of the disordered phases at RT. In addition, the reported ionic conductivity of the Li-based salt was surprisingly very high (6 × 10⁻³ S/cm at 300 K), while the Na+ ion conductivity was very impressive and reached a value of 10−2 S/cm at 300 K. As the long-term stability of the superconducting phases at RT remains unclear, thermal studies coupled with thorough electrochemical analyses (i.e., anodic/cathodic stability window, impedance evolution) are needed for the carbaborate salts. In addition, battery cycling results are lacking and will be very important in further accessing the potential and challenges of these electrolytes. Similar studies on Na-ion conductivities were extended to other carborane-type derivatives based on several nido-carboranes. However, their RT conductivities were inferior to those reported for the closo-carboranes (i.e., the highest reported value was for what was described as α-NaCB11H14, 10−3 S/cm at 300 K, it remains unclear why in this case σ was much higher than that in typical NaCB11H14, 10−6 S/cm at 300 K). Although the electrochemical stabilities of these specific salts were not reported, they were expected to exhibit a much narrower window compared to the closo-boranes owing to the known limited stability of the nido-anions [Reference Tang, Dimitrievska, Stavila, Zhou, Wu, Talin and Udovic68].
Just recently, a new report demonstrated the possibility to prepare, for the first time, ionic liquids using closo-boranes that remained molten at very low temperatures (i.e., 221 K) [Reference Kar, Tutusaus, MacFarlane and Mohtadi143]. Ionic liquids are molten salts at temperatures below 373 K and offer thermally stable, non-volatile, non-flammable alternative solvents for batteries. They typically consist of an organic cation coupled with an inorganic anion. Formation of ionic liquids that are molten at low temperatures using the closo-boron clusters was not previously possible due to the rigid structure of the anion. To compensate for this, the ionic liquids were formed by coupling the closo-monocarobrane anion with an ammonium cation that was decorated with flexible alkoxy chains such as [N2(20,201)3]+. The resulting ionic liquid was found to have excellent dissociation and a high conductivity of 10−4 S/cm at 303 K.
Light-metal hydride complexes and 3D boron clusters in rechargeable battery cells: application review
The sections titled “Electrolytes in rechargeable Li- and Na-ion batteries,” “Electrolytes in rechargeable Mg batteries,” and “Interface stability in lightweight complex metal hydride-based all-SSBs” report examples of battery performances, involving the use of light-metal complex hydrides and boron clusters mostly as electrolytes (Table II). Although limited, there also exist exemplifications of the borohydride and alanate applications as negative electrode materials in rechargeable LIBs, as briefly summarized in the section titled “Light-metal hydride complexes as anode active materials in LIBs.”
Electrolytes in rechargeable Li- and Na-ion batteries
The emergence of the lightweight CMHs with high ionic conductivities in the solid-state resulted in exploration of their potential application in rechargeable LIBs and NIBs as SSEs. An acceptable σ value, though indispensable, is one of the crucial electrochemical requirements that must be met by materials to be integrated as SSE into a battery cell. Complex hydrides also possess other technical properties that make them suitable for this type of applications, such as (i) a wide electrochemical window that ensures compound stability in Li+ and Na+ environments; (ii) high mechanical plasticity that enables the formation of good interfaces between battery components and makes battery assembly easy and fast; (iii) high thermal stability as a result of covalent bonding in complex anions; and (iv) low material density (20–50% that of oxides and sulfides), which allows for a higher concentration of the active material and development of the lightweight solutions. Thanks to these characteristics, light-metal hydride complexes have been demonstrated as interesting solid-state alternatives to current liquid electrolytes and contributed to the advancement in the all-solid-state Li- and Na-ion battery technology.
LIBs
The first example of the LiBH4 application as SSE in all-solid-state battery was reported in 2013 by Takahashi et al. [Reference Takahashi, Hattori, Yamazaki, Takada, Matsuo, Orimo, Maekawa and Takamura77]. The compound was tested in an electrochemical cell with Li as an anode and LiCoO2 as a positive electrode. The battery performance was evaluated at 393 K, which ensured the stability of the highly conductive HT-LiBH4 phase. Although SSE showed a high compatibility with the Li electrode, at the same time, the reaction between LiBH4 and LiCoO2 occurred. As a result, a high interfacial resistance was observed, which in turn led to the significant capacity loss. To minimize this effect, an extra layer of amorphous Li2PO4 was introduced between SEE and the cathode material. This approach improved the battery cycle performance as it retained 97% of the initial discharge capacity (89 mA h/g) after 30 cycles. Sveinbjörnson et al. proposed an alternative approach and showed that coating was unnecessary for a cathode with a lower redox potential [Reference Sveinbjörnsson, Christiansen, Viskinde, Norby and Vegge78]. The study investigated the performance of SSB with Li4Ti5O12 (LTO) as a positive electrode. Lithium titanite has a redox potential of 1.55 V (versus Li/Li+), which is lower than that of LiCoO2 (3.9 V versus Li/Li+). The application of the LiBH4–LiI solid solution as SSE decreased the cell operation temperature to 333 K. The initial discharge capacity of the battery was 277 mA h/g and accounted for 81% of a LTO theoretical value. This was comparable with the results obtained for the same battery with a liquid electrolyte. Although the all-solid-state battery delivered the discharge capacity above 110 mA h/g (65% of a LTO utilization ratio) during the initial 10 cycles, its discharge capacity retention was worse than that of the liquid electrolyte counterpart. The increased resistance in the SSB cell, due to insufficient contact between SSE and LTO and/or formation of a passivation layer at their interface, was blamed for the observed capacity loss. In a later study, Yoshida et al. replaced the pure LTO cathode with a composite electrode, which consisted of homogeneously dispersed LTO/Li4(BH4)3I with conductive carbon additives [Reference Yoshida, Suzuki, Kawaji, Unemoto and Orimo79]. The highly deformable nature of the Li4(BH4)3I SSE resulted in the formation of a tight interfacial contact with the cathode and resulted in the stable battery operation in the range of 296–423 K. At the highest temperature, the battery delivered discharge capacities of 170 and 158 mA h/g, during the first and second cycles, which corresponded to 97% and 90% of a LTO utilization ratio, respectively. The battery capacity retention at this temperature was also very high, and after 100 cycles, it accounted for 140 mA h/g. At 296 K, the battery delivered 122 mA h/g during the initial discharge and its capacity retention was 91% after the fifth cycle. Regardless of the operation temperature, the Coulombic efficiency was nearly 100%, which indicated that the charge–discharge cycling proceeded without side reactions. A smooth operation of the cell was possible due to very limited charge transfer resistance at the SSE/cathode interface, resulting from a tight contact among electrode constituents. The successful demonstration of the all-solid-state LIB with Li4(BH4)3I at RT (298 K) was also reported by Unemoto et al. The cell comprised the LiNbO3-coated LiCoO2 and 80Li2S·20P2S5 (LPS) composite electrode, and the Li anode [Reference Unemoto, Nogami, Tazawa, Taniguchi and Orimo19]. At the C-rate of 0.1, the discharge capacity was reduced from 92 to 82 mA h/g between the 1st and 20th cycle and the capacity retention was 90%. Although the Coulombic efficiency was only 75% in the initial cycle, it recovered to almost 100% after the second one. The stable and repeated battery operation was possible exclusively by combining SSE electrolytes with different electrochemical stabilities. Another example of the application of Li4(BH4)3I as SSE in LIB was reported by Suzuki et al. [Reference Suzuki, Kawaji, Yoshida, Unemoto and Orimo80]. The tested battery consisted of a composite cathode, with LiNi1/3Mn1/3Co1/3O2 (NMC) as an active material and TiO2-doped Li3BO3, to avoid a direct contact between NMC and SSE. An additional LiBH4 + xLiNH2 (x = 1, 2) adhesive layer was introduced between the positive electrode and Li4(BH4)3I. LiBH4 + xLiNH2 has been reported to have the high Li-ion conductivity and a melting temperature of 323 K. Thus, by removing the surface roughness and imperfections, the compound was expected to improve the interface compactness and suppress the contact resistance. The study performed at 423 K demonstrated that the presence of the adhesive layer increased the first discharge capacity from 56 mA h/g to 114 mA h/g, in battery without and with LiBH4 + xLiNH2, respectively. However, it also increased the initial charge capacity above the theoretical value (234 mA h/g versus 115 mA h/g), which suggested the occurrence of side reactions. The presence of the adhesive layer also improved the cycling performance as the capacity retention increased from 29% to 71% for the battery without and with LiBH4 + xLiNH2, respectively.
The feasibility of HT-LiBH4 as SSE was also tested in the lithium–sulfur (Li–S) conversion batteries, characterized by high energy density [Reference Unemoto, Yasaku, Nogami, Tazawa, Taniguchi, Matsuo, Ikeshoji and Orimo81]. To enhance the electrochemical activity of insulating elemental S, a composite S/LiBH4 cathode with conductive carbon (C) was prepared by ball milling. The results demonstrated stable battery operations at 393 K and underlined the important role of borohydrides’ ductility, which ensured a good contact at the SSE–cathode interface, obtained exclusively by cold-pressing. The proposed Li–S cell configuration delivered 1140 mA h/g at the rate of 0.05C, during the first discharge, which corresponded to 70% of a sulfur utilization ratio. Over the next 45 cycles, the discharge capacity remained as high as 730 mA h/g with nearly 100% Coulombic efficiency. The Li–S battery operation with the S/C composite cathode was also evaluated with the LiBH4–LiCl solid solution as SSE [Reference Unemoto, Chen, Wang, Matsuo, Ikeshoji and Orimo82]. The homogeneous dispersion of the electrode constituents ensured a very good SSE/electrode contact and allowed for the reversible battery operation at 373 K, with the discharge capacity of 1377 mA h/g and 636 mA h/g during the initial and the fifth cycle, respectively. To further lower the operation temperatures of batteries, Das et al. applied nanoconfined LiBH4 as SSE in the Li–S cell [Reference Das, Ngene, Norby, Vegge, de Jongh and Blanchard83]. The battery containing S/C and Li as positive and negative electrodes, respectively, was evaluated at 328 K and various charge–discharge rates (0.03–0.12C). At higher C-rates, a higher drop of the C/S electrode potential was observed, which obstructed the efficient sulfur utilization. However, by lowering the discharge rate, a quick recovery of the full capacity was obtained. Over 40 cycles, the cell showed good performances and maintained the discharge capacity as high as 1220 mA h/g at 0.03C. Lithium borohydride SSE demonstrated high compatibility also with an all-solid-state metal hydride–sulfur LIB [Reference López-Aranguren, Berti, Dao, Zhang, Cuevas, Latroche and Jordy42]. The cell with Li2S/LiBH4 as a cathode, 0.8MgH2–0.2TiH2/LiBH4 as an anode, and LiBH4 as SSE was operated at 393 K. The reversible specific capacity reached 910 mA h/g, and after 25 charge–discharge cycles, the battery retained 85% of the initial capacity value.
Recently, the stability of LiCe(BH4)3Cl as SSE in a Li–S battery was investigated [Reference Nguyen, Fleutot and Janot84]. The compound was tested in a cell with a S/LiCe(BH4)3Cl composite as a positive electrode and the LiIn alloy as the negative one. The reversible reaction between Li and S was observed at 318 K and a rate of C/100. Although the capacity of the initial discharge and charge reached 1196 mA h/g (71% of the theoretical value) and 879 mA h, respectively, subsequent cycling resulted in significant capacity loss. Still, the capacity retention was satisfactory with the discharge capacity of 510 mA h/g after the ninth cycle.
Much better results and a stable interface formation between the HT-LiBH4 SSE and the active cathode material were reported for the TiS2–Li cell (Fig. 7 and Table II) [Reference Unemoto, Matsuo and Orimo12, Reference Unemoto, Ikeshoji, Yasaku, Matsuo, Stavila, Udovic and Orimo85]. A solid-state battery with a TiS2/LiBH4 composite positive electrode, LiBH4 and Li, as the electrolyte and the anode, respectively, was successfully cycled 300 times at 393 K and a rate of 0.2C. Although the initial discharge capacity was only 80 mA h/g (versus 239 mA h/g of the theoretical value), at the second cycle, the parameter reached 205 mA h/g with 100% Coulombic efficiency. This corresponded to 85% of a TiS2 utilization ratio. The battery did not reveal significant capacity fading and during the final discharge the cell delivered 180 mA h/g with the same Coulombic efficiency as in the second cycle. This good durability was explained by the chemical/electrochemical oxidation of the borohydride just below the TiS2 surface. This was accompanied by the hydrogen release and the new phase formation, most likely Li2B12H12, with high ionic conductivity. The compound revealed high oxidative stability toward LiBH4 and a charge transfer reactivity with the Li anode and as such was likely to act as a stable interfacial layer that enabled numerous charge–discharge cycles.
Discharge–charge profiles of the bulk-type all-solid-state TiS2/Li battery operated at 393 K and 0.2C (a). Graphical representation of the Li2B12H12 formation at the TiS2/Li interface as a result of the chemical/electrochemical reaction between LiBH4 and H2 (b). A photograph of the bulk-type all-solid-state TiS2/Li battery (c). A part of the Li negative electrode was delaminated for clarity of the battery configuration. Reprinted with permission from Ref. Reference Unemoto, Ikeshoji, Yasaku, Matsuo, Stavila, Udovic and Orimo85, copyright 2015 American Chemical Society.
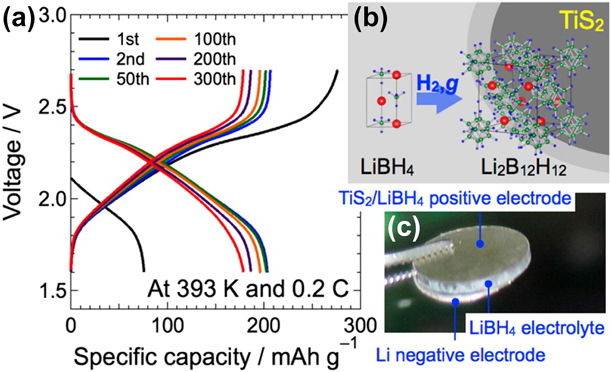
The oxidative stability of Li4(BH4)3I as SSE was evaluated based on the performance of TiS2–Li batteries with the TiS2/LiBH4 and TiS2/Li4(BH4)3I composite electrodes [Reference Unemoto, Nogami, Tazawa, Taniguchi and Orimo19]. Both cells were tested at 393 K with the discharge–charge rate of 0.05C. Similar to HT-LiBH4, the I−-substituted LiBH4 preserved the high mechanical plasticity, which ensured the formation of a robust and tight SSE/cathode interface. Due to the self-discharge reaction and formation of LixTiS2, the initial discharge capacity of the TiS2/LiBH4-based battery was 61 mA h/g but recovered to 216 mA h/g in the second cycle. On the other hand, the first charge capacity reached 419 mA h/g, which was far above the theoretical value and resulted from the oxidative decomposition of unreacted lithium borohydride. The battery was characterized by a high capacity retention (20 mA h/g) after the 15th cycle. In the cell with the TiS2/Li4(BH4)3I electrode, the first discharge capacity was only 49 mA h/g and recovered to 141 mA h/g during the second cycle. This low initial capacity value was due to the reaction between TiS2 and Li4(BH4)3I, which caused the battery self-discharge prior testing. Over the next 15 cycles, the cell capacity dropped significantly, which was correlated with the steady increase in the internal battery resistance and the lower interface stability between TiS2 and Li4(BH4)3I than between TiS2 and LiBH4. The integration of the crystalline 90LiBH4·10P2S5 (LPS) mixture as SSE in the TiS2–Li battery allowed for its reversible operation at 300 K [Reference Unemoto, Wu, Udovic, Matsuo, Ikeshoji and Orimo45]. The battery was tested against the InLi alloy anode and operated at the C-rate of 0.1. The first and second discharge capacity reached 192 and 228 mA h/g, respectively. After the 10th cycle, the capacity retention was 98% with almost 100% Coulombic efficiency. Recently, a mixture of Li4(BH4)3I and LPS was utilized as SSE in the same battery type [Reference El Kharbachi, Hu, Sorby, Maehlen, Vullum, Fjellvag and Hauback86]. The TiS2/Li4(BH4)3I–LPS composite electrode was tested with the Li4(BH4)3I–LPS electrolyte and Li as a counter electrode at 303 K. The results demonstrated the high compatibility of this SSE mixture toward the electrochemically active materials. The capacity of the initial discharge corresponded to 89% of the theoretical one. The lower C-rate ensured better battery cyclability with a higher Coulombic efficiency.
As soon as metal hydrides and complex transition metal hydrides were proposed as conversion-type anode materials in LIBs, due to their high theoretical Li storage capacity, low volume expansion, and suitable working potential, the possibility of designing SSB with LiBH4 as SSE has been explored [Reference Mohtadi and Orimo6, Reference Oumellal, Rougier, Nazri, Tarascon and Aymard144, Reference Aymard, Oumellal and Bonnet145]. It has been shown that electrochemical performance of the MgH2- and TiH2-based composite electrodes was much better with LiBH4 as SSE than with conventional organic liquid electrolytes [Reference Zeng, Kawahito, Ikeda, Ichikawa, Miyaoka and Kojima87, Reference Zeng, Kawahito and Ichikawa88, Reference El Kharbachi, Uesato, Kawai, Wenner, Miyaoka, Sørby, Fjellvåg, Ichikawa and Hauback90]. The results for LIB with the TiH2/LiBH4 composite electrode, operated at 393 K, showed that the Li insertion capacity faded little, from 1094 to 878 mA h/g between the 2nd and 50th charge–discharge cycle [Reference Zeng, Kawahito and Ichikawa88]. For SSB with the composite MgH2/LiBH4 and MgH2/LiBH4/Nb2O5 anodes, the initial discharge capacity was 1575 mA h/g and 1650 mA h/g at the C-rate of 0.8, which corresponded to 94% and 95% Coulombic efficiency, respectively. The reported numbers were lower than the theoretical value (2038 mA h/g), but much higher than those obtained for their counterparts with the liquid electrolyte. In addition, both SSBs had improved cyclic stability and better capacity retention. The battery with the carbon nanofiber supported MgH2/LiBH4 electrode and LiBH4 SSE was also reported to perform better than the same battery with LPS glass-type SSE [Reference Zeng, Ichikawa, Kawahito, Miyaoka and Kojima89]. The battery with LPS delivered an initial discharge capacity of 1214 mA h/g; however, within next 15 cycles, the value dropped rapidly to only 100 mA h/g. The first charge capacity reached only 575 mA h/g. In comparison, the battery with LiBH4 SSE showed an initial discharge capacity of 1728 mA h/g (94% Coulombic efficiency), which faded slowly with the increased cycle numbers and remained as high as 1017 mA h/g (99.5% Coulombic efficiency) after 50 cycles [Reference Zeng, Ichikawa, Kawahito, Miyaoka and Kojima89]. The suitability of LiBH4 as SSE was also demonstrated for all-solid-state LiB with the MgH2/CoO2 composite electrode [Reference El Kharbachi, Uesato, Kawai, Wenner, Miyaoka, Sørby, Fjellvåg, Ichikawa and Hauback90]. The studies concluded that in this battery-type, solid LiBH4 promoted the hydride conversion reaction due to its dual effect on the Li+ and H− conductivity. Additionally, a crucial role of the specific anode/electrolyte interface on the reaction kinetic was suggested [Reference Zeng, Kawahito, Ikeda, Ichikawa, Miyaoka and Kojima87, Reference Zeng, Kawahito and Ichikawa88, Reference Zeng, Ichikawa, Kawahito, Miyaoka and Kojima89]. Recently, the RT performance of conversion-type MgH2 anode with a mixture of Li4(BH4)3I and LPS as SEE, and lithium as a counter electrode, was reported and compared with the liquid electrolyte cell [Reference El Kharbachi, Hu, Sorby, Maehlen, Vullum, Fjellvag and Hauback86]. The liquid electrolyte-based battery showed higher discharge capacity, but SSB demonstrated a higher reversibility yield. Another recent example of the LiBH4 SSE application in hydride-based LiBs was reported for the Mg2FeH6-based conversion type anode [Reference Huen and Ravnsbæk91]. In comparison to a cell with a liquid electrolyte, this SSB exhibited a higher value of the initial discharge capacity, 1254 versus 1100 mA h/g, and significantly better Coulombic efficiency, 68 versus 27%. Also, after the 10th cycle, the retained capacity of the cell with the SSE electrolyte was above 3 times higher than that of the conventional counterpart.
The application of LiBH4 as SSE was reported for all-solid-state LIB with an aluminum composite anode (Al/LiBH4) [Reference Weeks, Tinkey, Ward, Lascola, Zidan and Teprovich92]. The cell operated at 408 K and the C-rate of 0.1 revealed the reversible capacity of 895 mA h/g during the initial cycle, which was close to the theoretical value (993 mA h/g). However, subsequent cycling of the material led to a significant capacity loss. Evaluation of the results obtained for charge–discharge cycles at various C-rates indicated that lithium borohydride could facilitate the reversible lithiation of aluminum up to 1C.
Recently, lithium borohydride as SSE was used in a battery cell with a nanostructured Bi2Te3/LiBH4 composite anode and Li as an active cathode material [Reference Singh, Kumari, Rathore, Shinzato, Ichikawa, Verma, Saraswat, Awasthi, Jain and Kumar93]. The electrochemical performances of SSBs with Bi2Te3 nanoparticles and nanosheets were tested. The initial discharge–charge capacities at a rate of 0.1C were 550 mA h/g and 540 mA h/g for nanoparticles and nanoplates-based batteries, respectively.
The suitability of the LiBH4–C60 nanocomposite as SSE in all-solid-state LIB was tested in a cell with a silicon/conductive carbon anode and the Li cathode, at 353 K and C-rate of 0.1C [Reference Teprovich, Colon-Mercado, Ward, Peters, Giri, Zhou, Greenway, Compton, Jena and Zidan36]. The first discharge capacity reached 91% of the theoretical value (4200 mA h/4 for Li4.4Si); however, only two charge–discharge cycles were performed due to the significant performance degradation. This was attributed to the conductivity loss in Si as a result of its large volume expansion upon cycling. The same SSE was also tested in a cell with LiCoO2 and Li, as a cathode and an anode, respectively [Reference Teprovich, Colon-Mercado, Ward, Peters, Giri, Zhou, Greenway, Compton, Jena and Zidan36]. The battery was cycled five times with a rate of 0.1C at 323 K and 353 K. The reversible capacity values reached only 8 and 10 mA h/g, respectively, and were explained by either poor contacts between SSE and the active material and/or side reactions between the electrolyte and LiCoO2.
Battery demonstrations were also reported for boron cluster-based electrolytes using different cathodes. These included battery cycling in H/B deficient Li2B12H12 at 353 K, where the Li metal anode and TiS2 (voltage approximately 2.6 V) were the negative and positive electrodes, respectively [Reference Kim, Toyama, Oguchi, Sato, Takagi, Ikeshoji and Orimo52]. The battery was cycled at low rates (0.05C) and showed a gradual capacity fade. The TiS2 cathode was also used to demonstrate the performance of the LiCB11H12 battery operated at 403 K and the C-rate of 0.2. As for Li2B12H12, also in this case, capacity fading was observed (i.e., the capacity dropped from 240 to 180 mA h/g by the fifth cycle). Batteries were also examined with higher voltage cathodes. The ball milled Li2B12H12 was used in a Li/LiCoO2 cell, which was run at 323 K and a rate of 0.2C. However, only 40% of the initial capacity was obtained by the 20th cycle.
Na-ion batteries
The Na3NH2B12H12 complex hydride, obtained from metal amide and higher borane, has been recently employed as SSE in the all-solid-state NIB, with the composite TiS2/Na3NH2B12H12 cathode and the Na anode [Reference He, Lin, Li, Filinchuk, Zhang, Liu, Yang, Hou, Deng, Li, Shao, Wang and Lu61]. The cell was reversibly operated at 535 K and a rate of 0.1C, over 200 cycles. During the second discharge, the battery delivered 146 mA h/g with almost 100% Coulombic efficiency, which indicated no significant side reactions. After 100 cycles, the capacity retention was as high as 102 mA h/g and dropped to 77 mA h/g during subsequent 100 cycles. Such behavior was likely due the partial decomposition of Na3NH2B12H12.
One of the most successful demonstration of the Na-ion battery was by employing Na(B12H12)0.5(B10H10)0.5 in a 3 V Na metal cell, which was operated for 250 cycles (Fig. 8 and Table II). This example has represented an important validation on the utility of hydroborates as practical SSEs for relatively high voltage Na ion batteries (Fig. 6) [Reference Duchene, Kuhnel, Stilp, Cuervo Reyes, Remhof, Hagemann and Battaglia99]. The key to this successful demonstration was a good contact between the cathode (NaCrO2, theoretical capacity of 120 mA h/g) and the electrolyte, accomplished by impregnating the cathode particles with the electrolyte. This was achieved by dissolving the latter in anhydrous methanol and dispersing NaCrO2 into the solution, followed by drying in a vacuum and heat treatment at 270 °C to recrystallize the electrolyte. This example highlighted the importance of the careful electrode design in enabling hydride-based batteries.
(a) Schematic and SEM cross sections of the device investigated in the 3 V Na battery showing the different components of the cell. (b) Charge/discharge profiles for the 1st, 2nd, and 20th cycle of Na|Na(B12H12)0.5(B10H10)0.5|NaCrO2 cells with mixed and impregnated cathode mixtures. (c) Long term cycling of a cell using the impregnated cathode. The cell was initially activated by 3 charge/discharge cycles at 0.05C and subsequently cycled 250 times at 0.2C. Charge and discharge capacity and efficiency are shown every 2 cycles. Reprinted with permission from Ref. Reference Duchene, Kuhnel, Stilp, Cuervo Reyes, Remhof, Hagemann and Battaglia99, copyright 2017 The Royal Society of Chemistry.
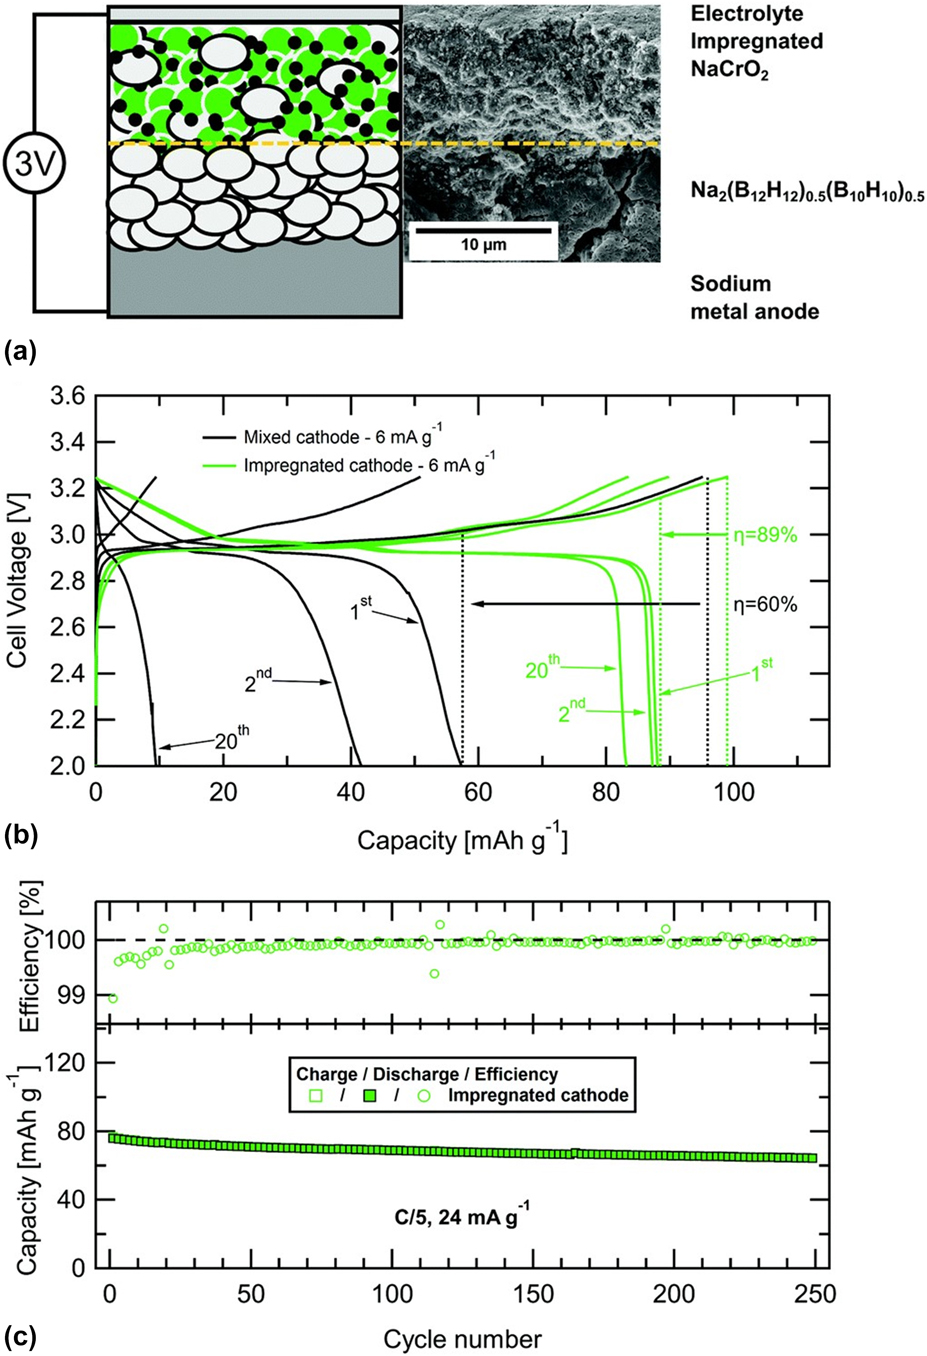
Electrolytes in rechargeable Mg batteries
Although an electrolyte plays a pivotal role in all battery systems, in the rechargeable magnesium batteries, it is particularly important. Organohalo/organo-based electrolytes are compatible with Mg and perform well; however, they are also corrosive. Lightweight metal hydrides have demonstrated the potential to overcome these problems and based on them a new family of halogen-free salts was reported (see the section titled “Conductivity of lightweight CMHs in Mg batteries”). Due to the high reductive stability of the [BH4]− anion, Mg(BH4)2 is able to withstand the electro/chemical reduction in a reactive environment. This, in turn, prevents the formation of a passivation, nonconductive layer at the magnesium metal anode, which is known to obstruct the battery operation [Reference Mohtadi and Orimo6, Reference Shao, Liu, Li, Gu, Nie, Engelhard, Xiao, Lv, Wang, Zhang and Liu71, Reference Mohtadi, Matsui, Arthur and Hwang128, Reference Mohtadi, Remhof and Jena129]. The performance of the magnesium borohydride-based electrolytes has been tremendously improved by the use of other light-metal hydride complexes: LiBH4 and NaBH4. Although the exact role of these additives is yet to be understood, their presence increases the current density and the efficiency of the plating/stripping processes [Reference Mohtadi and Orimo6, Reference Shao, Liu, Li, Gu, Nie, Engelhard, Xiao, Lv, Wang, Zhang and Liu71, Reference Mohtadi, Matsui, Arthur and Hwang128, Reference Mohtadi, Remhof and Jena129].
The first successful application of non-aqueous Mg(BH4)2–LiBH4 in DME electrolyte was demonstrated for a battery with a magnesium anode and a Chevrel phase Mo6S8 cathode [Reference Mohtadi, Matsui, Arthur and Hwang128]. In a following study, the same battery at a rate of C/10 delivered a capacity of 99 mA h/g during the initial discharge (versus 129 mA h/g of the theoretical value) and the reported capacity retention remained at the level of 90% over 300 cycles [Reference Shao, Liu, Li, Gu, Nie, Engelhard, Xiao, Lv, Wang, Zhang and Liu71]. Recently, Mg(BH4)2 in DGM/THFPB was employed in cells with a Mg anode and a Chevrel phase as well as a S/C composite cathode [Reference Xu, Zhang, Li, Qiao, Lu, Tang, Dong, Ma, Liu, Zhou and Cui74]. The Mo6S8-based battery, operated at various C-rates (0.1–2C), delivered averaged discharge capacities from 72 mA h/g to 21 mA h/g for the lowest and highest C-rates, respectively. At 0.2C, the maintained averaged capacity value was 78–80 mA h/g, over 600 cycles, with the 100% Coulombic efficiency. For the S–C-based battery, the initial discharge capacity reached 956 mA h/g but then dropped to 536 mA h/g after 30 cycles, which accounted for 55% of capacity retention. The most likely reason of the restricted cycling performance was the polysulfide dissolution, which caused the active material loss. The Mg(BH4)2 in TG as well as Mg(BH4)2–LiBH4 in TG was also integrated as SSE in a Mg–Mo6S8 battery, operated at RT and a rate of 0.05C [Reference Tuerxun, Abulizi, NuLi, Su, Yang and Wang72]. While the former delivered 66 mA h/g and 63 mA h/g during the initial discharge and charge, respectively, the latter reached 77 and 76 mA h/g during the first discharge–charge cycle. Also, the LiBH4-containg cell revealed stable operation over 107 cycles, with an average discharge of 71 mA h/g and 92% of capacity retention. Lower values were obtained for the same cell with Mg(BH4)2–LiBH4 in DGM/TG/PP14TFSI as SSE [Reference Su, Nuli, Wang, Yusipu, Yang and Wang73]. The initial discharge–charge capacity was 74 mA h/g and 57 mA h/g, respectively. The battery performed in a stable way over next 55 cycles, with the average discharge capacity of 55 mA h/g. The solution of Mg(BH4)2–LiBH4 applied as an electrolyte in the dual Mg–Li battery with the FeSx conversion cathode enabled a stable cell operation without dendrite growth [Reference Zhang, Xie, Han and Li101]. The reversible battery capacity at 0.1C varied between 350 and 400 mA h/g during the first 50 cycles and stayed above 200 mA h/g after the subsequent 150 ones. Interestingly, the solid electrolyte interface formation, containing electrolyte components, was observed at both the cathode and anode. Its presence was likely to suppress the polysulfide dissolution as well as fast passivation of the negative electrode, which resulted in the superior battery performance.
Evaluation of the Mg battery operation was done beyond the Mg(BH4)2-based liquid electrolytes and included its solid-state derivatives. Highashi et al. applied the synthesized Mg(BH4)(NH2) as SSE in the Mg–S, Mg–FeS, and Mg–Ag2S electrochemical cells, operated at 423 K, however did not report on the charge–discharge performance [Reference Higashi, Miwa, Aoki and Takechi69]. Shao et al. implemented the nanocomposite Mg(BH4)2–PEO–MgO SSE to the Mg SSB and demonstrated its high compatibility with the Chevrel phase as a cathode [Reference Shao, Rajput, Hu, Hu, Liu, Wei, Gu, Deng, Xu, Han, Wang, Nie, Li, Zavadil, Xiao, Wang, Henderson, Zhang, Wang, Mueller, Persson and Liu100]. The battery showed reversible Mg intercalation/deintercalation and stable operation over 150 cycles at 373 K. The magnesium borohydride-based SSEs may provide higher oxidative stability; however, better understanding of factors that govern their performance in a battery cell is needed.
Studies on the performances of closo-borane as electrolytes have also been executed. In particular, the m-dicarborane-based Mg salt Mg(C2B10H12)Cl in THF could deliver the expected performance with a Chevrel phase cathode, demonstrating good compatibility [Reference Carter, Mohtadi, Arthur, Mizuno, Zhang, Shirai and Kampf76]. The battery was cycled 30 times at 0.05C and a stable reversible specific capacity of 90 mA h/g was obtained, which corresponded to 90% of the Coulombic efficiency. Magnesium battery was also demonstrated using Mg(CB11H12)2 in TG with a Chevrel phase (a follow up work that combined the salt with Mgphenyl2 showed slightly lower performance) [Reference Tutusaus, Mohtadi, Arthur, Mizuno, Nelson and Sevryugina75, Reference McArthur, Geng, Guo and Lavallo146]. Most importantly, Mg(CB11H11)2 in TG was also used to cycle the high voltage cathode α-MnO2, with the initial discharge capacity of 170 mA h/g. This has been the first, successful example of a Mg coin cell operated at voltages exceeding 2.5 V, possible due to overcoming the corrosion problems encountered previously [Reference Tutusaus, Mohtadi, Arthur, Mizuno, Nelson and Sevryugina75].
Interface stability in lightweight complex metal hydride-based all-SSBs
Given the superior ionic conductivity of the reported light-metal hydride complexes, increase in their σ values is no longer a dominant factor in the development of SSBs. As it has been demonstrated, the focus has shifted toward challenges related to a battery cell integration, which involve the preservation of the electrochemical and mechanical stability of electrodes and SSEs. Understanding of factors that govern processes at the electrode/SSE interface is crucial for realizing a full potential of lightweight CMHs as SSEs in Li-, Na-, and Mg-based batteries.
Based on the presented examples, it appears that the chemical stability of the electrode/SSE interfaces is of particular importance for the steady SSB operation, as most of the reactions initiate there. While the high reducibility of borohydrides-based SSE provides their good compatibility with Li, Na, and Mg metals, the cathode/SSE contact is critical for the performance of both the SSE and the all-solid-sate battery. Among the identified problems that impede progress in the broad usage of light-metal hydride complexes as SSEs, there is high interfacial resistance, which occurs in a battery mostly due to the detrimental interphase layer formation [Reference Takahashi, Hattori, Yamazaki, Takada, Matsuo, Orimo, Maekawa and Takamura77] and/or disruption of the intimate contacts among the electrode, conductive phases, and SSE [Reference Sveinbjörnsson, Christiansen, Viskinde, Norby and Vegge78]. Various approaches have been applied to mitigate these undesired effects, as presented in the section titled “LIBs.” In the case of the LIB with the LiCoO2 cathode, the reaction observed between oxide and highly reductive LiBH4 SSE caused decomposition of LiCoO2 and deterioration of the cathode/LiBH4 interface, which resulted in capacity loss [Reference Takahashi, Hattori, Yamazaki, Takada, Matsuo, Orimo, Maekawa and Takamura77]. In general, formation of inactive by-products at the oxide/borohydride-based SSE contact increases the interfacial resistance, which eventually hinders the transfer of Li+/electrons in the cathode. To suppress this effect, various coating/buffer layers (e.g., LiNbO3 [Reference Unemoto, Nogami, Tazawa, Taniguchi and Orimo19], Li2PO4 [Reference Takahashi, Hattori, Yamazaki, Takada, Matsuo, Orimo, Maekawa and Takamura77], Li3BO3 [Reference Suzuki, Kawaji, Yoshida, Unemoto and Orimo80]) have been successfully applied and prevented undesired interactions between the cathode and SSE, which in turn improved the reversibility and durability of the investigated SSBs. The oxide-cathode batteries with borohydride-based SSE often also suffer due to poor electrode/SSE contacts. Thus, the buffer layers (e.g., LiBH4 + xLiNH2) were also proposed to eliminate surface roughness and to improve the interface compactness [Reference Suzuki, Kawaji, Yoshida, Unemoto and Orimo80]. On the other hand, the studied examples also demonstrate that the formation of a stable phase at the electrode/SSE contact does not always carry a negative effect. In the TiS2–Li cell with LiBH4 SSE, the reaction between the cathode material and SSE led to the formation of the interfacial layer of amorphous Li2B12H12, which appeared very beneficial. The high ionic conductivity of Li2B12H12, together with its higher oxidative stability as compared to LiBH4, played a key role in the stable and prolonged battery operation [Reference Unemoto, Matsuo and Orimo12, Reference Unemoto, Ikeshoji, Yasaku, Matsuo, Stavila, Udovic and Orimo85].
The reported examples of Na-based SSBs also suggest that the careful design of the battery components is essential for the improved cell operation. The battery with the solution-processed impregnated electrode (NaCrO2–Na2(B12H12)0.5(B10H10)0.5–super‐P) demonstrated the significant reduction of the internal resistance and much better cycling performance, due to a stable intimate contact ensured between the cathode and SSE, which could not be obtained with the same cathode fabricated by simple mixing of composite components [Reference Duchene, Kuhnel, Stilp, Cuervo Reyes, Remhof, Hagemann and Battaglia99].
The control of processes at the electrode/SSE interfaces is still very limited, and in-depth theoretical and experimental (operando) studies of their thermodynamics and kinetics are essential to evaluate their fundamental aspects, on the one hand, and to provide practical solutions to current challenges related to SSBs, on the other hand.
Light-metal hydride complexes as anode active materials in LIBs
Conversion reactions in Li-based batteries can be used as an alternative to intercalation [Reference Cabana, Monconduit, Larcher and Palacin147]. Their main advantage relies on a multielectron redox process, which could provide much higher specific capacity compared to currently utilized graphite-based anodes. Among various systems proposed as positive and negative materials, hydrides deserve particular consideration. Besides the high theoretical capacities, their electrochemical activity occurs in a safe potential region versus Li [Reference Oumellal, Rougier, Nazri, Tarascon and Aymard144]. Based on theoretical predictions, for batteries with lightweight CMHs, specific capacities in a range of 2000–4000 mA h/g can be achieved. Thus, the reactivity of selected groups of hydrogen complexes in Li-ion cells has been investigated [Reference Meggiolaro, Farina, Silvestri, Panero, Brutti and Reale94, Reference Silvestri, Forgia, Farina, Meggiolaro, Panero, La Barbera, Brutti and Reale95, Reference Silvestri, Farina, Meggiolaro, Panero, Padella, Brutti and Reale96].
Borohydrides
Meggiolaro et al. reported on the incorporation of the selected borohydrides as active anode materials in a Li-ion cell [Reference Meggiolaro, Farina, Silvestri, Panero, Brutti and Reale94]. The study spanned ball milled LiBH4, NaBH4, KBH4, Mg(BH4)2, and Ca(BH4)2, which were tested against Li with a solution of LiPF6 in the ethylene/dimethyl carbonate mixture as an electrolyte. Batteries were evaluated in a potential range of 2.5/2.0–0.01 V and at a rate of C/20. LiBH4, KBH4, and Ca(BH4)2 showed no or negligible electrochemical activity, which was likely due to limited electron/ionic conductivity of the materials and/or high activation energy of the conversion reaction. More encouraging results were obtained for NaBH4 and Mg(BH4)2, for which specific capacities reached approximately 200 mA h/g upon the first reduction. The study also emphasized the importance of the relationship between the duration of mechanochemical powder processing and material reactivity. For shorter milled Mg(BH4)2, a higher number of redox processes in a battery was observed with the first discharge capacity reaching 540 mA h/g. Although the measured capacities were much lower than the theoretical ones, the study showed possible enhancement of the battery performances by the optimization of the active material morphology.
Alanates
The first demonstration of alanates as conversion anodes in the Li-ion cell was presented for LiAlH4 and Li3AlH6 by Silvestri et al. [Reference Silvestri, Forgia, Farina, Meggiolaro, Panero, La Barbera, Brutti and Reale95]. The mechanochemically processed materials were tested in a three-electrode cell, with Li as a counter electrode and a solution of LiPF6 as an electrolyte, at a rate of C/20, in a potential range of 2.5–0.01 V. The study demonstrated that the reversible incorporation/de-incorporation of Li as well as the occurrence of a conversion reaction in both materials pointed to a high complexity of the reaction mechanism. Even though the capacities upon discharge were as high as 1180 mA h/g and 900 mA h/g for LiAlH4 and Li3AlH6, respectively (versus theoretical values: 2119 mA h/g and 1493 mA h/g), the reversibility of the processes was poor as only 16% and 22% of these values, respectively, were recovered during the subsequent charge cycle. Such behavior was associated with a large volume variation upon conversion (30%) and alloying reactions (100%). In another study, the performance of unprocessed LiAlH4 was tested in the same electrochemical environment at C/10 [Reference Teprovich, Zhang, Colón-Mercado, Cuevas, Peters, Greenway, Zidan and Latroche148]. The study also confirmed the occurrence of a poorly reversible, conversion reaction between LiAlH4 and Li, with an unclear reaction pathway.
The compatibility of NaAlH4, Na3AlH6, and LiNa2AlH6 with Li electrode in a solution of LiPF6 as an electrolyte was also explored [Reference Silvestri, Farina, Meggiolaro, Panero, Padella, Brutti and Reale96, Reference Teprovich, Zhang, Colón-Mercado, Cuevas, Peters, Greenway, Zidan and Latroche148]. While the electrochemical performances of both unprocessed and mechanochemically activated compounds were rather poor, the ball milling of NaAlH4 with the conductive carbon showed an impressive increase in the conversion reversibility. This resulted in a much greater value of the charge capacity (1 versus 2.65 lithium equivalents for unprocessed and processed sodium alanate, respectively; theoretical value: 4 lithium equivalents) with almost 70% of Coulombic efficiency [Reference Silvestri, Farina, Meggiolaro, Panero, Padella, Brutti and Reale96]. It was suggested that the mechanical powder processing promoted the creation of a highly reactive carbon-hydride composite, which permitted the formation of a solid–electrolyte interface without Li consumption [Reference Cirrincione, Silvestri, Mallia, Stallworth, Greenbaum, Brutti, Panero and Reale149]. The composite was also able to mitigate the electrode pulverization upon cycling, which prevented the loss of electronic contact between particles upon discharge–charge cycles. The studies indicated a multistep discharge reaction that proceeded via the formation of intermediate Na3AlH6 and/or LiNa2AlH6 phases; however, the complete mechanism of the NaAlH4 regeneration has not been fully understood. Further improvement in the performance was expected by integration of the nanoconfined sodium alanate in the electrochemical cell. In this case, the reversible conversion reaction in the Li-ion cell with the hydride-based electrode was demonstrated and high values of the initial discharge–charge capacity were reported [Reference Silvestri, Paolone, Cirrincione, Stallworth, Greenbaum, Panero, Brutti and Reale97, Reference Huen, Peru, Charalambopoulou, Steriotis, Jensen and Ravnsbæk98]. However, during the subsequent 20 cycles, the significant loss in the reactivity of nanoconfined NaAlH4 was observed, which caused the substantial fading of the battery reversible capacity.
Summary and outlook
In this review, we presented an overview of the lightweight CMHs and their composites, with documented ionic conductivity, as well as selected examples of these materials’ application in Li-, Na-, and Mg-based batteries.
The discovery of high solid-state ionic conductivity in HT-LiBH4 opened an extensive field of the research on SSEs. This was further stirred by the results showing the successful stabilization of the conductive phase down to RT, by simple halogen anion substitutions. It was found that the enhanced ionic conductivity observed in borhydrides has been due to several factors: disordered distribution of cations and high density of vacancies in the crystal structure of Li- and Na-ion conductors, modification of the structural aperture by the cation/anion substitutions, and high rotational mobility of the [BH4]− units decreasing activation energy and promoting the Li-ion diffusion. In the case of the hydride-based composites, the additional influence of material phase compositions, microstructural properties, and interfacial processes has been emphasized. The encouraging conductivity results obtained for a new type of compounds such as LiCa3(BH4)(BO3)2 call for investigation of other oxide-hydride compositions that could be important in terms of their high compatibility with the commonly used electrode materials. Also, the recently reported new concept of ammonia gas absorption by LiBH4 is worth exploring in detail to understand the factors of the excellent Li-ion mobility in Li(NH3)BH4 as it could inspire new approaches in designing of superconducting hydride-based materials. The discovery of record Na solid-state conductivities in closo-borane compounds represents an important milestone in the consideration of hydrides as SSEs. This area of research was further enriched by implementing concepts similar to those used to improve LiBH4 conductivities as outlined above. In particular, the mixed cluster anion salt systems such as that based on [CB9H10CB11H12]2−, which even elevated Li ion conductivities to the levels of most competent Li+ electrolytes, require particular attention. In this case, understanding of key structural factors that govern this performance and establishing the role of thermal treatments on generating these high conductivities are paramount.
In the field of liquid electrolyte research, advancements driven by the discovery of Mg metal compatibility with Mg(BH4)2 electrolytes have disrupted the field of electrolytes for multivalent batteries (Mg, Ca). Research demonstrated the important role BH4− plays through its synergy with ether solvent-Mg2+ coordination to produce highly performing electroactive species and Mg2+ permeable interfaces. These findings motivated investigating borohydride salts as SSEs, which produced the highest conducting Mg electrolyte to date. Highly efficient and practical non-corrosive simple electrolytes were demonstrated with wide electrochemical windows exceeding that of the solvent itself using the closo-borane Mg(CB11H12)2 salt. The scope of hydrides’ role in energy storage has been recently expanded beyond the “inorganic salts” form where organic salts based on closo-monocarbone have been reported as highly competent ionic liquid solvents for Mg and Li batteries. Current studies are demonstrating the richness as well as complexity of the hydride salt-solvent and the hydride salt-electrode interactions, so moving forward in-depth studies are needed to determine key bulk and interfacial phenomena at play.
The still limited studies on the application of the LiBH4-based materials as SSEs in Li- and Na-ion batteries have shown their good interfacial contacts with electrodes but also increased capacity and better cyclic stability of batteries using hydride anodes, as compared to their liquid electrolyte-based counterparts. This emphasizes that interfacial effects together with borohydrides’ high electrochemical stability and plasticity play an important role in the battery operation. However, further studies are necessary to understand both the nature of involved (electro)chemical processes, on the one hand, and modifications of the battery components in view of the fundament material properties, on the other hand. In the case of rechargeable Mg batteries, Mg(BH4)2 and its derivatives, applied as anhydrous or SSEs, were shown to support the battery function, where, in particular, Mg(CB11H12)2 in TG solvent enabled unprecedented charging of a Mg coin cell battery to high voltages. However, challenges with the available Mg battery cathodes have limited research of cathode-electrolyte interactions, establishing the true battery performances in such electrolytes. As new working and stable Mg cathodes emerge, it is critical that these electrolytes are studied in a battery setup to identify challenges and opportunities.


 Open access