

1. Introduction
Perceptual dialectology (PD) within cities allows for the study of language attitudes within a small, well-defined region that can inform existing and future research on local linguistic practices. Though previous studies of regional perceptual dialectology demonstrate that the Eastern New England dialect, with the city of Boston as its hub, is widely recognized across the country, few studies have systematically examined Bostonian’s attitudes about language spoken in and around their city. Even fewer have specifically examined attitudes from residents of color (e.g. residents who identify as Asian/Pacific Island American, Black/Caribbean/African American, Latinx/o/a, or Mixed/Multi-racial), who are often excluded from studies of local dialects and attitudes towards them (Browne & Stanford, Reference Browne and Stanford2018). Within and outside of Boston, there exists the idea of the “strong Boston accent,” typically attributed to speakers from historically White ethnic (often Irish or Italian) working-class neighborhoods like South Boston (Browne & Stanford, Reference Browne and Stanford2018; Stanford, Reference Stanford2019). However, local residents also acknowledge the ways in which such neighborhoods, and the speech within them, are changing due to a mixture of factors such as gentrification, an increase in transplants from other parts of the state and country, ethnic diversification, immigration, and younger residents’ favoring supra-regional over local dialect features (Stanford, Reference Stanford2019). In response, this paper asks whether the changing demographics of Greater Boston influence residents’ perceptions of speech within local neighborhoods, cities, and towns. In which areas do residents localize the “strong Boston accent”? Do they only identify historically White working-class neighborhoods, and if so, why? Do residents of different backgrounds perceive speech within these areas differently from each other? Are any other ways of speaking identified within Greater Boston? This study thus seeks to build on a tradition of PD as a means of examining language ideologies in urban spaces (Montgomery & Cramer, Reference Montgomery and Cramer2016; Preston, Reference Preston2016) and how they might differ based on a resident’s background or change over time within a community. It also expands on previous research of PD in the Boston area by providing insight into possible differences in language perception across the city, particularly among residents of color.
2. Situating the “Boston” accent
New England English (henceforth NE) is one of the most recognizable dialects of North American English, encompassing features that are widespread across the region (Labov et al., Reference Labov, Ash and Boberg2005; Stanford, Reference Stanford2019). Its production and perception have also been studied extensively over the course of the twentieth and twenty-first centuries (Kurath, Reference Kurath1949, Reference Kurath1973; Laferriere, Reference Laferriere1979; Nagy, Reference Nagy2001; Hartley, Reference Hartley2005; Nagy & Irwin, Reference Nagy and Irwin2010; Babcock, Reference Babcock2014; Fernandes et al., Reference Fernandes, Routhier and Ravindranath2014; Jones, Reference Jones2015; Browne & Stanford, Reference Browne and Stanford2018; Chartier & Jones, Reference Chartier and Jones2018; Chang & Dionne, Reference Chang and Dionne2022; Nesbitt et al., Reference Nesbitt, Jenkins and Robinson2024; for a full list of previous work, see Stanford, Reference Stanford2019:11). Most recently, Stanford (Reference Stanford2019) provides a large-scale examination of the features of NE and their use both across the region and in more localized spaces like the neighborhood of South Boston and the Cape Cod peninsula.
NE has traditionally been separated into Western and Eastern sub-dialects (henceforth WNE and ENE) along the Green Mountains of Vermont (Kurath, Reference Kurath1949), with Boston as the social and geographic “hub” of the region (Stanford, Reference Stanford2019:15, 66). New England’s east–west distinction results from English colonization of the two areas by populations speaking different regional dialects of English (Wells, Reference Wells1986; Trudgill & Gordon, Reference Trudgill and Gordon2006; Wolfram & Schilling, Reference Wolfram and Schilling2015:127). Over time, the two dialect areas have remained fairly distinct in their differential use of salient features like non-rhoticity, palm-fronting, and the “broad-a” in bath,Footnote 1 with ENE speakers using this set of features more prevalently. In recent decades, however, the distinction between the two dialects has begun to fade. This is particularly true because younger ENE residents are gradually abandoning local dialect features in favor of supra-regional norms, though some Boston neighborhoods like South Boston may be more conservative in maintaining traditional features (Stanford, Reference Stanford2019).
2.1. Perceptions of speech in New England and Boston
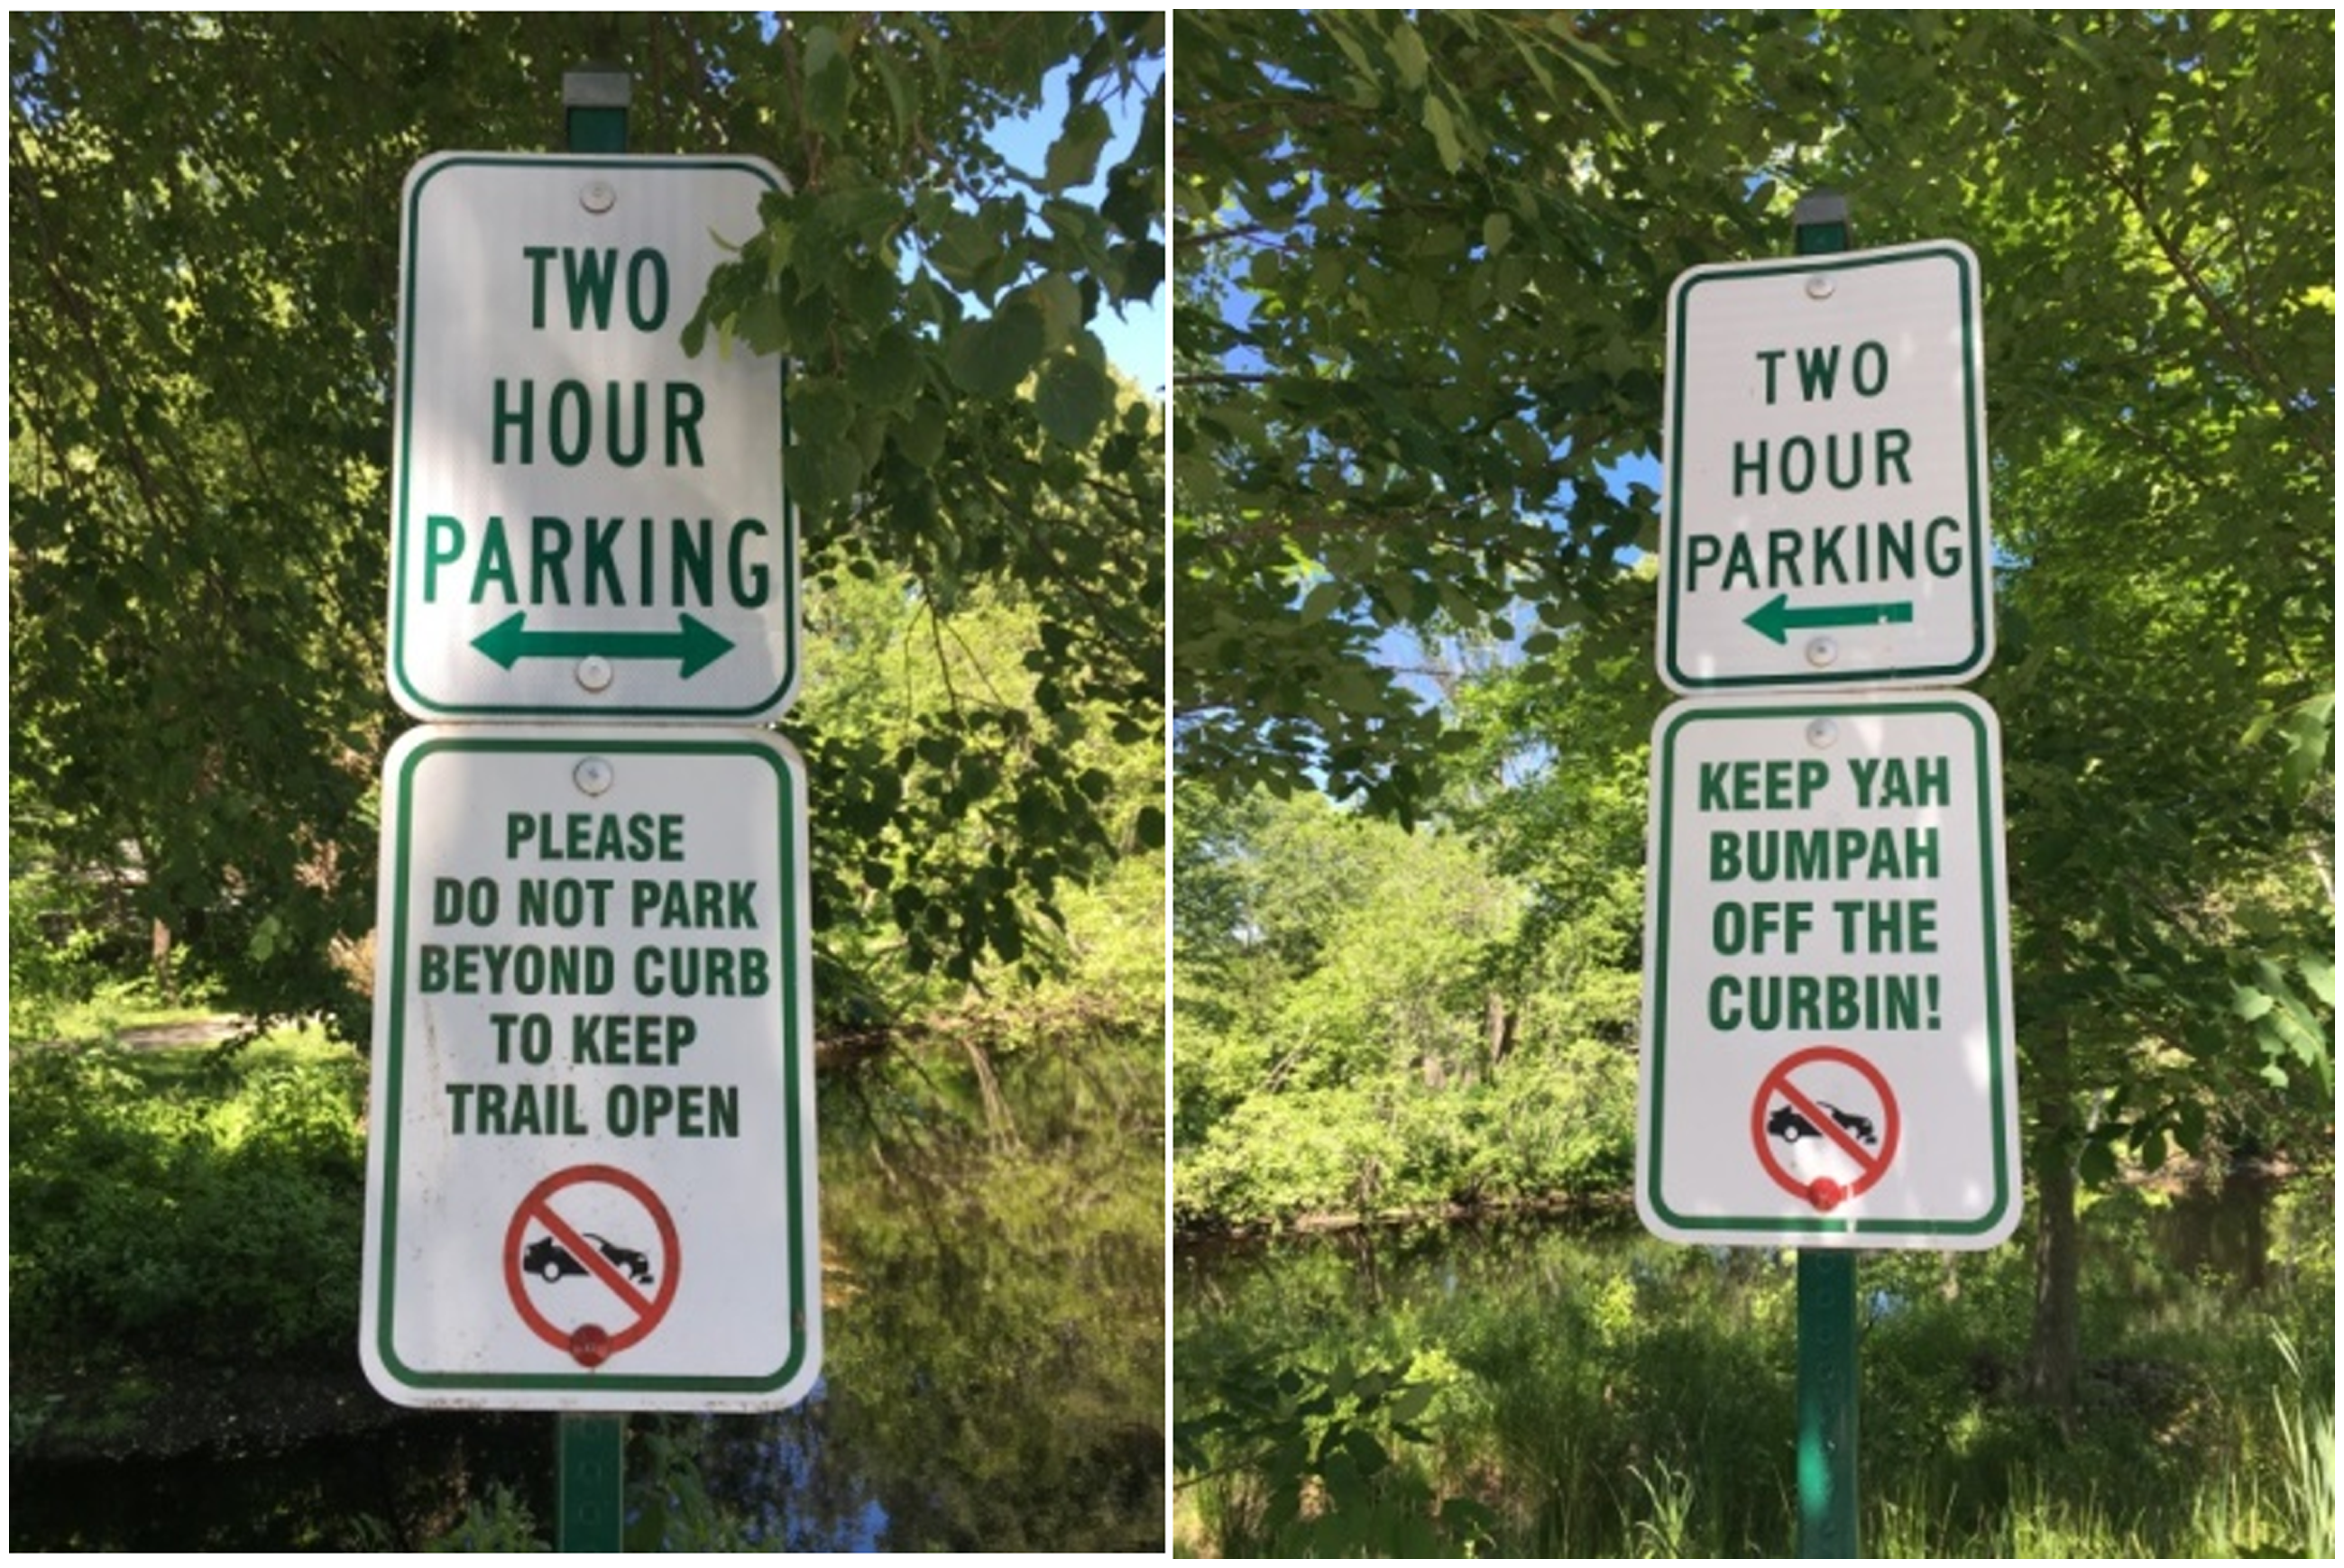
In large-scale PD studies, Americans frequently identify New England as a distinct sub-region within the Northeast, and many even single out the “Boston” accent and its stereotypical patterns of non-rhoticity (Hartley, Reference Hartley2005). Non-rhoticity is inarguably the most salient feature of ENE, and can be traced back to seventeenth-century colonists from southeastern England (Wells, Reference Wells1986; Trudgill & Gordon, Reference Trudgill and Gordon2006; Wolfram & Schilling, Reference Wolfram and Schilling2015:127). Frequently referred to as “dropped-r,” non-rhoticity is the variable non-use of post-vocalic /r/ when followed by a consonant or pause (Labov et al., Reference Labov, Ash and Boberg2005:47). Non-rhoticity is the subject of overt comment by folks inside and outside of New England, and can thus be considered a highly stereotyped feature, or shibboleth, of the dialect (Roberts & Nagy, Reference Roberts, Nagy, Kortmann and Schneider2008; Stanford, Reference Stanford2019). Within Eastern New England, reference to non-rhoticity appears on signs, advertisements, and clothing, including the parking signs (Figure 1) from a small park in the far-flung, affluent Metro West suburb of Wellesley, roughly 15 miles outside of Boston.
Two parking regulation signs from Fuller Brook Park in Wellesley, MA, one in standardized English and the other featuring more colloquial language (“curbin” vs. “curb” or “curbing”) and non-rhotic representations of the words “your” and “bumper”.
When New England residents are asked to describe local speech, most mention non-rhoticity, with many providing start words as examples (Stanford, Reference Stanford2019:116-118). start-fronting, or the production of a non-backed [aː] before /r/, is found in ENE as well as other parts of Northern New England (Labov et al., Reference Labov, Ash and Boberg2005; Stanford, Reference Stanford2019). This variable notably appears several times in the stereotypical stock phrase “Pahk ya cah in Hahvahd Yahd,” which both residents and non-residents alike frequently reference when asked about the local accent. Because start words combine both fronted [aː] and non-rhoticity, speakers most likely provide start words as examples of non-rhoticity rather than start-fronting, especially given that few speakers comment on the parallel fronting of [aː] in palm in ENE (Stanford, Reference Stanford2019). As Stanford notes, it is also possible that the stock phrase has become so associated with ENE features that such comments are not necessarily on any one specific feature. All other phonetic variables are commented on much less frequently in metalinguistic commentary and PD studies, suggesting that non-rhoticity is a major driver of perceptions of speech in New England. On the other hand, non-rhoticity is becoming increasingly restricted to older White non-Jewish metropolitan speakers with less education (Stanford, Reference Stanford2019). Many areas of Greater Boston are also becoming increasingly diverse (The Boston Foundation) and gentrified with rhotic speakers (Stanford, Reference Stanford2019).
Most work in PD reveals negative attitudes about ENE speech at the national and regional level (Nagy, Reference Nagy2001; Nagy and Irwin, Reference Nagy and Irwin2010; Fernandes et al., Reference Fernandes, Routhier and Ravindranath2014; Jones, Reference Jones2015; Chartier & Jones, Reference Chartier and Jones2018; Stanford, Reference Stanford2019:302). In fact, in 2014 the “Boston” accent came in third as a semi-finalist in Gawker’s America’s Ugliest Accent Tournament (Evans, Reference Evans2014). At a more local level, ambivalent attitudes toward ENE speech are the norm (Hartley, Reference Hartley2005; Babcock, Reference Babcock2014; Chartier & Jones, Reference Chartier and Jones2018). Chartier & Jones’s (Reference Chartier and Jones2018) ten participants from Massachusetts chose Greater Boston (and the shores) as being least similar to their own speech, mirroring the attitudes of participants from the other New England states. In their study, participants from every state, including MA, also chose Greater Boston as having the least correct and least pleasant speech. Work that has focused on residents of Eastern Massachusetts’s perceptions of speech in the state shows that they rate MA speech high when it comes to “correctness” and “pleasantness,” but do not rate MA as having the most “correct” or “pleasant” speech in all of New England. Hartley attributes this mismatch to an internalization of conflicting stereotypes of the “Boston” accent that exist nationally: that of the educated elite, contrasted with that of the working-class descendants of Irish or Italian immigrants.Footnote 2 As a result, participants who identify with the stereotype of the educated elite may rate residents highly on correctness but lower on pleasantness, while those who identify with the covert prestige of the working-class stereotype may rate speakers low on correctness but higher on pleasantness (Hartley, Reference Hartley2005).
These mixed feelings by (Greater) Bostonians toward speech associated with the local working class in particular are echoed in Babcock (Reference Babcock2014) and Stanford (Reference Stanford2019). In a semi-structured focus group of 11 White, middle- and working-class participants from Eastern Massachusetts, five of whom identified as Bostonians, Babcock (Reference Babcock2014) found that older, less educated participants were more tolerant of non-standard regional features than either younger or more educated ones. When discussing the speech of former Boston Mayor Tom Menino, Babcock’s participants expressed mixed feelings about whether his perceived inability to use the standard variety was a liability or made him a “man of the people.”Footnote 3 This also comes up in Stanford’s (Reference Stanford2019) fieldwork interviews in Eastern Massachusetts and Boston neighborhoods, where he finds that even when speakers express negative evaluations of the local accent, “there is often a general sense of pride in local Boston Hub place identity represented by these features” (2019:289). This may be what is reflected in low status yet high solidarity ratings of local speech.
2.2. Language, place, race, and class
The relationship between language, social categories, and geographic space has been noted in previous sociolinguistic studies on folk perceptions (Johnstone, Reference Johnstone, Auer and Schmidt2010; Gasquet-Cyrus, Reference Gasquet-Cyrus2016; Lonergan, Reference Lonergan2016; Becker & Newlin-Lukowicz, Reference Becker and Newlin-Lukowicz2018). Linguistic units, through use in context, come to be associated with and index the speakers who use them along with the social categories of those speakers, such as where they reside, their race, their gender, or their social class background (i.e. first order index) (Silverstein, Reference Silverstein and Duranti2001, Reference Silverstein2003; Eckert, Reference Eckert, Auer and Schmidt2010).
Becker & Newlin-Lukowicz’s (Reference Becker and Newlin-Lukowicz2018) experimental work on the Borough Accent Ideology (BAI) in New York City English found that both native and non-native New York listeners used accent as a proxy for social status, placing the talkers who displayed more advanced local accent features (in this case non-rhoticity and bought-raising) in outer boroughs like Brooklyn and Queens as opposed to the centralized borough of Manhattan, despite the fact that NYCE features can be heard from residents throughout the city. Becker and Newlin-Lukowicz conclude that terms like “Brooklynese” and “Bronxese” do not directly index borough residence, but the social identities associated with a stereotypical resident of a particular borough, which may include identities like older, working-class, and White ethnic (descended from eighteenth- and nineteenth-century European immigrants to New York). Similarly, Babcock (Reference Babcock2014) finds an indirect connection between language and class by way of location among ENE participants in a focus group. In a discussion of local speech, members of the focus group avoided linking speech directly to class or socioeconomic status, instead tying it to things like education/intelligence, race/ethnicity, and town of residence. However, they directly linked town of residence with socioeconomic status, with one member expressing that, “when you talk about how you identify yourself socioeconomically, I think around here people assume the socioeconomic group [by the town’s status]” (Babcock, Reference Babcock2014:422).
Perceptual dialectology in cities outside of the USA have shown that particular locations can become shorthand for the typical people who reside there (either historically or otherwise) and their stereotypical ways of speaking as well. For example, Lonergan (Reference Lonergan2016) finds that, though Dubliners perceive a difference between “Northside” and “Southside” accents, there is very little difference in their overall vowel productions. Instead, he argues that these terms do not directly index geographic location, but instead refer to social class distinctions that may be taboo to call attention to in Irish society. Likewise, in his work on urban accent perception in Marseille, Gasquet-Cyrus (Reference Gasquet-Cyrus2016) finds that each of the three distinct urban accents are indexed with specific parts of the city and the social types believed to live there, although the accents themselves may be heard elsewhere in Marseille. For example, the “traditional” accent of Marseille is seen as authentic (but also fading), and is associated with older, male speakers and the stereotype of the traditional fisherman. It thus gets relegated to the city’s port neighborhoods and peripheral neighborhoods that have small town feels and their own ports. Likewise, the upper middle-class accent, considered to be “lighter” and more in line with the Parisian standard, is associated with more affluent, residential city districts, while the so-called “Northern Neighborhoods” accent is associated with immigrant youth and frequently subject to negative evaluations, despite the recent spread of some accent features to older, middle-class speakers outside of northern neighborhoods (Gasquet-Cyrus, Reference Gasquet-Cyrus2016:166).
This also appears to be the case in Boston, though few studies have examined the perceived localization of ENE or the “Boston” accent within the metro area as their focus. Hartley (Reference Hartley2005) mentions that working-class and affluent Bostonians of Irish heritage evoke very different stereotypes among residents (e.g. Will Hunting and Chuckie Sullivan vs. the Kennedys) and may be associated with different geographic territory. Stanford also notes that “traditional ENE features of the enregistered ‘thick Boston accent’ are locally associated with place identity” (Reference Stanford2019:286). Folks both inside and outside of the region tend to attribute the strongest use of ENE features to speakers in neighborhoods like South Boston. Frequently referred to as “Southie,” South Boston is a densely populated, historically working-class enclave of the descendants of Irish immigrants that has become emblematic of “traditional Boston working-class culture” (Stanford, Reference Stanford2019:182). Though South Boston is the most named neighborhood of this nature, it is not the only one. The North End and East Boston, two traditionally Italian American working-class neighborhoods, are also frequently pointed out as “quintessential” Boston neighborhoods where one might find a “thick” accent. However, Laferriere (Reference Laferriere1979) finds evidence that “Boston Irish” is a stronger stereotype than “Boston Italian.” Nonetheless, for many residents, these neighborhoods stand in contrast to Boston’s Downtown and adjacent neighborhoods, which tend to be more commercialized and, as such, attract residents of higher status and those from outside of the region, similar to the relationship between New York’s outer boroughs and Manhattan (Becker & Newlin-Lukowicz, Reference Becker and Newlin-Lukowicz2018; Stanford, Reference Stanford2019).
As for residents of color, Stanford (Reference Stanford2019) reports that meta-linguistic commentary from some Bostonians suggests “a clear understanding that some ENE features are ethnically differentiated,” including a Black resident of Dorchester who replied, “you gotta get a White person for that” when asked about ENE dialect features (Stanford, Reference Stanford2019:194). However, Nesbitt et al.’s recent (Reference Nesbitt, Jenkins and Robinson2024) fieldwork among Black Boston area residents reveals more mixed perceptions, with some speakers expressing similar sentiments to the one above (“That’s the white people accent”), and others perceiving less or conditional ethnic differentiation, including differences based on location: “Some Black people have thick Boston accents,” “It depends on who you’re talking to and what neighborhood they’re from.” Production results also reveal lower-frequency use of ENE features like non-rhoticity by Black and Asian Bostonians (Nagy & Irwin, Reference Nagy and Irwin2010; Chang & Dionne, Reference Chang and Dionne2022; Nesbitt et al., 2023). White Bostonians may also perceive residents of color to speak in ways other than an ENE accent (Babcock, Reference Babcock2014).
2.3. A changing city
In recent decades, the Greater Boston Area has seen several demographic changes. The population of the city of Boston has grown since 1980, largely due to immigration from countries like China, the Dominican Republic, Haiti, and Cape Verde (Larson, Reference Larson2016). This has, in turn, shifted the ethnic demographics of the city and surrounding cities and towns (The Boston Foundation, 2019). The city itself went from 80% White in 1970, to residents of color outnumbering White residents by 2010 (Larson, Reference Larson2016). Though groups like African Americans are still geographically concentrated in areas like Roxbury, Dorchester, and Mattapan, they have increased their presence in those neighborhoods as well as in places like Hyde Park (Larson, Reference Larson2016). Meanwhile, the Latinx population has increased in neighborhoods like East Boston and Jamaica Plain (Larson, Reference Larson2016), and neighborhoods like Dorchester have seen significant increases in its Asian American population (Watanabe & Lo, Reference Watanabe and Lo2019; Dumcious, Reference Dumcious2021).
Many city neighborhoods are also changing economically. Many neighborhoods have experienced both growth in home values as well as increases in the number of residents with college degrees (Maciag, Reference Maciag2015). Governing.com analyzed data on home values and degree holders from the US Census’s 2009–2013 American Community Survey in Boston neighborhoods to observe how these indices have changed across the city since 2000. They found that the neighborhoods that changed the most (i.e. gentrified) were Jamaica Plain, Fenway, East Boston, South Boston, Dorchester, and the South End, with the South End appearing as an early gentrifier in 2000 (Maciag, Reference Maciag2015). Neighborhoods like Back Bay, which already rated as affluent and educated in 2009, did not meet the criteria to be considered for gentrification. It is also unclear to what extent the increases described represent across the board change for all residents or greater economic diversity within these areas (Lima & Melnik, Reference Lima and Melnik2014).
In any case, these cultural and economic shifts are perceptible in individual neighborhoods and communities. For example, South Boston’s association with Irish American identity followed several large waves of Irish immigration during the first half of the nineteenth century and was further solidified during the busing crisis of the 1970s (Buccitelli, Reference Buccitelli2016). However, starting in the 1980s and 1990s, it began to see a host of changes, such as increases in the population of working-age residents as well as rises in residents’ educational attainment and employment status. As these changes occurred, the neighborhood saw property values jump and businesses intended for upmarket clientele move in, contributing to an impression among some longtime residents that the neighborhood was being overrun with “newcomers” or “yuppies” (Reference Buccitelli2016:30). Not long after, South Boston started becoming more visibly ethnically diverse, which, in turn, has altered the linguistic profile and practices of community members. For example, the neighborhood has seen sizeable influxes of African American, Asian American, and Latinx populations, concomitant with the emergence of Spanish and Chinese as the home languages of many residents (Reference Buccitelli2016:31). Today, South Boston has a median household income of $89,069 (Statistical Atlas, 2018). Despite increases in ethnic diversity, it remains majority White and is frequently listed as one of the least diverse Boston neighborhoods (Lima & Melnik, Reference Lima and Melnik2014). Despite the continuing dominance of ethnic Irish identity, which survived through many symbols and cultural practices maintained in the neighborhood (Buccitelli, Reference Buccitelli2016), only 32.1% of South Boston residents claim Irish heritage today (Statistical Atlas, 2018).
East Boston similarly came to be dominated by Italian immigrants surrounding the turn of the twentieth century with an Italian American population of 95% in 1913 (Stanford, Reference Stanford2019:145), which remained largely homogenous until the 1980s (Buccitelli, Reference Buccitelli2016). Today, despite the persistence of a visible Italian American identity in the neighborhood (about 13.2% of the population), there have been sizeable increases in residents of color and immigrant populations such that the neighborhood is now dominated by residents of Latinx heritage, representing 56.2% of the population (Statistical Atlas, 2018). A similar trend can be witnessed in the North End, where only 29.9% of the population claim Italian heritage today, though the neighborhood remains majority White at 88.2% (Statistical Atlas, 2018). While East Boston has remained lower- to working-class with a median household income of $54,854, the North End’s median income is more similar to affluent neighborhoods like Back Bay and Beacon Hill and adjacent cities like Brookline.
As for Dorchester, prior to the 1960s and 1970s, it was mainly populated by residents of Irish, Italian, and Jewish backgrounds (Watanabe & Lo, Reference Watanabe and Lo2019). Since then it has become both the biggest Boston neighborhood, welcoming more than 8,000 new residents between 2010 and 2020, as well as the most diverse, boasting a particularly high increase of Asian and Latinx residents in intervening years (Lima & Melnik, Reference Lima and Melnik2014; Watanabe & Lo, Reference Watanabe and Lo2019; Dumcious, Reference Dumcious2021). Dorchester has been officially divided by many Boston city governments into North and South Dorchester since the early 2000s, though this division may feel somewhat arbitrary to many residents (City of Boston Parks and Recreation, 2006). Today, North Dorchester is still majority White (36.7%), but there are sizeable Black (22.2%), Latinx (16.3%), and Asian (15.3%) populations (Statistical Atlas, 2018). The largest share of the population in South Dorchester, however, goes to Black residents (46.2%) with White residents next (26.4%) before Asian (12.4%) and Latinx (9.6%) residents (Statistical Atlas, 2018). As one Dorchester resident is quoted in a piece for Boston’s National Public Radio, “one of the things that they get wrong [about Dorchester] is the whole ‘old Boston’ mentality, where people think Dorchester is super segregated, like how it used to be … It’s not like that anymore. There’s a lot of diversity out here now” (Rios & Kelly, Reference Rios and Kelly2023). Currently, the median income of both North and South Dorchester is approximately $60,000, putting it squarely in the working-class category for the Boston area (Statistical Atlas, 2018).
As these neighborhood snapshots demonstrate, the demographics of many working-class White ethnic enclave communities are changing due to a mixture of gentrification, influxes of both young urban professionals from outside of the region and immigrants of color, as well as increased mobility among younger, more educated speakers (Stanford Reference Stanford2019). As Stanford (Reference Stanford2019) and Babcock (Reference Babcock2014) both note, local residents frequently comment on these changes in reference to the declining prevalence of ENE features in and around the region. And they are not wrong, as Stanford’s (Reference Stanford2019) crowd-sourced and field recordings show a general decrease in the use of features like non-rhoticity and start-fronting in apparent time as well as stratification by social class and ethnicity. Furthermore, use of these features is becoming more and more restricted to more conservative neighborhoods like South Boston, though even it has been affected by demographic changes, particularly among younger speakers (Stanford, Reference Stanford2019).
Given that many residents are aware of these changes and their effects on local speech, a question to ask is whether this awareness has shifted perceptions of speech around the city, particularly in terms of where ENE features are prevalent. For example, do residents view South Boston as less accented than in the past due to perceived gentrification? If they view ENE as ethnically stratified, do they view the increasing diversity of some historically White working-class areas as changing their speech? It is, of course, possible that demographic changes do not greatly shift perceptions. As Lonergan (Reference Lonergan2016) finds, Dubliners are generally aware of and comment on the fact that the historical ties between social class and neighborhood have been complicated by recent real-estate development. Yet, they continue to use the terms “North side” and “South side” as short-hand for Dubliners of different social classes and speech. Similarly, it may be the case that folk associations between speech and place in Boston are equally entrenched. On the other hand, as Boston becomes more diverse and residents have different backgrounds and experiences, competing narratives about the relationship between place and ethnicity or class may emerge and make space for potential shifts in the dominance of traditional narratives about these relationships, particularly among younger residents and residents of color. In this case, we might expect to find differences in perceptions of where ENE features are used depending on residents’ ages, ethnicities, or other social characteristics. A handful of past studies have found differences in perceptual dialectology based on participant social background, looking at social factors like age and gender. These studies have also produced conflicting results about whether older, middle-aged, or younger participants, or male or female participants perceive more fine-grained distinctions between dialect areas in a given geographic space (Demirci, Reference Demirci, Long and Preston2002; Jeon, Reference Jeon2013; Al-Rojaie, Reference Al-Rojaie2021). Results with regard to gender seem to indicate some role of mobility (and perhaps, by extension, social networks) for male speakers in societies where men are more socially and geographically mobile (Demirci, Reference Demirci, Long and Preston2002; Al-Rojaie, Reference Al-Rojaie2021). Studies looking at differences in perceptual dialectology based on ethnic background are even less common.
In what follows, I use a perceptual dialectology task that asks current residents of the Greater Boston Area to identify areas where they believe residents have varying degrees of ENE dialect features by asking where they believe speakers have strong “Boston” accents. The choice of the term “Boston” accent deserves address. As Browne & Stanford (Reference Browne and Stanford2018) write:
In eastern Massachusetts, there is a commonly evoked notion of “quintessential Boston” and a “strong Boston accent” which in reality only represent certain types of communities. The use of these phrases generalizes these sociolinguistic traits to all groups of people in Boston. This can be a dangerous practice because it erases other speech patterns that belong to the multiple ethnic groups who share Boston and co-construct its cultures.
Consequently, this research also investigates whether residents, when faced with the term “Boston accent,” bring up other ways of speaking around the city, as in Gasquet-Cyrus’s work in Marseille, or whether “Boston accent” is simply a cover term for ENE dialect features typically associated with White New England communities such as non-rhoticity.
In its original goals, this study set out to capture the perceptions of area residents of color or those who identify as Asian/Pacific Island American, Black/Caribbean/African American, Latinx/o/a, or Mixed/Multi-racial, who are sometimes excluded from perceptual work on local dialects, and who may have differing experiences when it comes to perceptions of local speech. However, the start of the COVID-19 pandemic forced the intended methods to be revised from on-the-street data collection to an online model, making it more challenging to recruit participants of color from the Greater Boston Area. Despite that, the following study reports data from 111 participants (32% of which are participants of color) from an online dialect survey on perceptions and localizations of the “Boston” accent. Details of the data and methodology, including participant demographics, are presented in the following section.
3. Data and methods
3.1. Participant selection
This study deployed a Qualtrics survey on the online platform, Prolific during summer 2020. Access to the survey was restricted to Prolific users who listed their first language as English, their nationality and country of birth as the USA, and their current state and state of birth as Massachusetts. To further verify that respondents matched the study criteria in terms of dialect experience, the demographic part of the survey asked them to self-report the city, state, and zip code for the place(s) where they were born, had lived the majority of their childhood (0-12 years old) and adolescence (13+18 years old), had lived the majority of their adulthood (19 years old and older), and usually told people they were from. To verify native speaker status, participants were asked what language(s) they used to communicate with their caregiver growing up, what language(s) they used to communicate with siblings or peers, and whether they speak any additional languages. All speakers who spent ages 0–18 within the USA and used English to communicate with siblings or peers were considered native English speakers.
One drawback of using Prolific to recruit study participants is the limited number of participants of color who are signed up for the service, particularly those who identify as Black. Consequently, following an initial round of data collection, the survey was advertised an additional time with the pool of potential participants further restricted to those who identified as Black. In total, there were 137 survey respondents who, after exclusions, were trimmed down to the 111 participants whose data will be reported here. The main reasons for exclusions were participants not completing the survey, not residing within the appropriate region, not having grown up within the appropriate region, not speaking English as a native language, and taking the survey multiple times.
3.2. Participant demographics
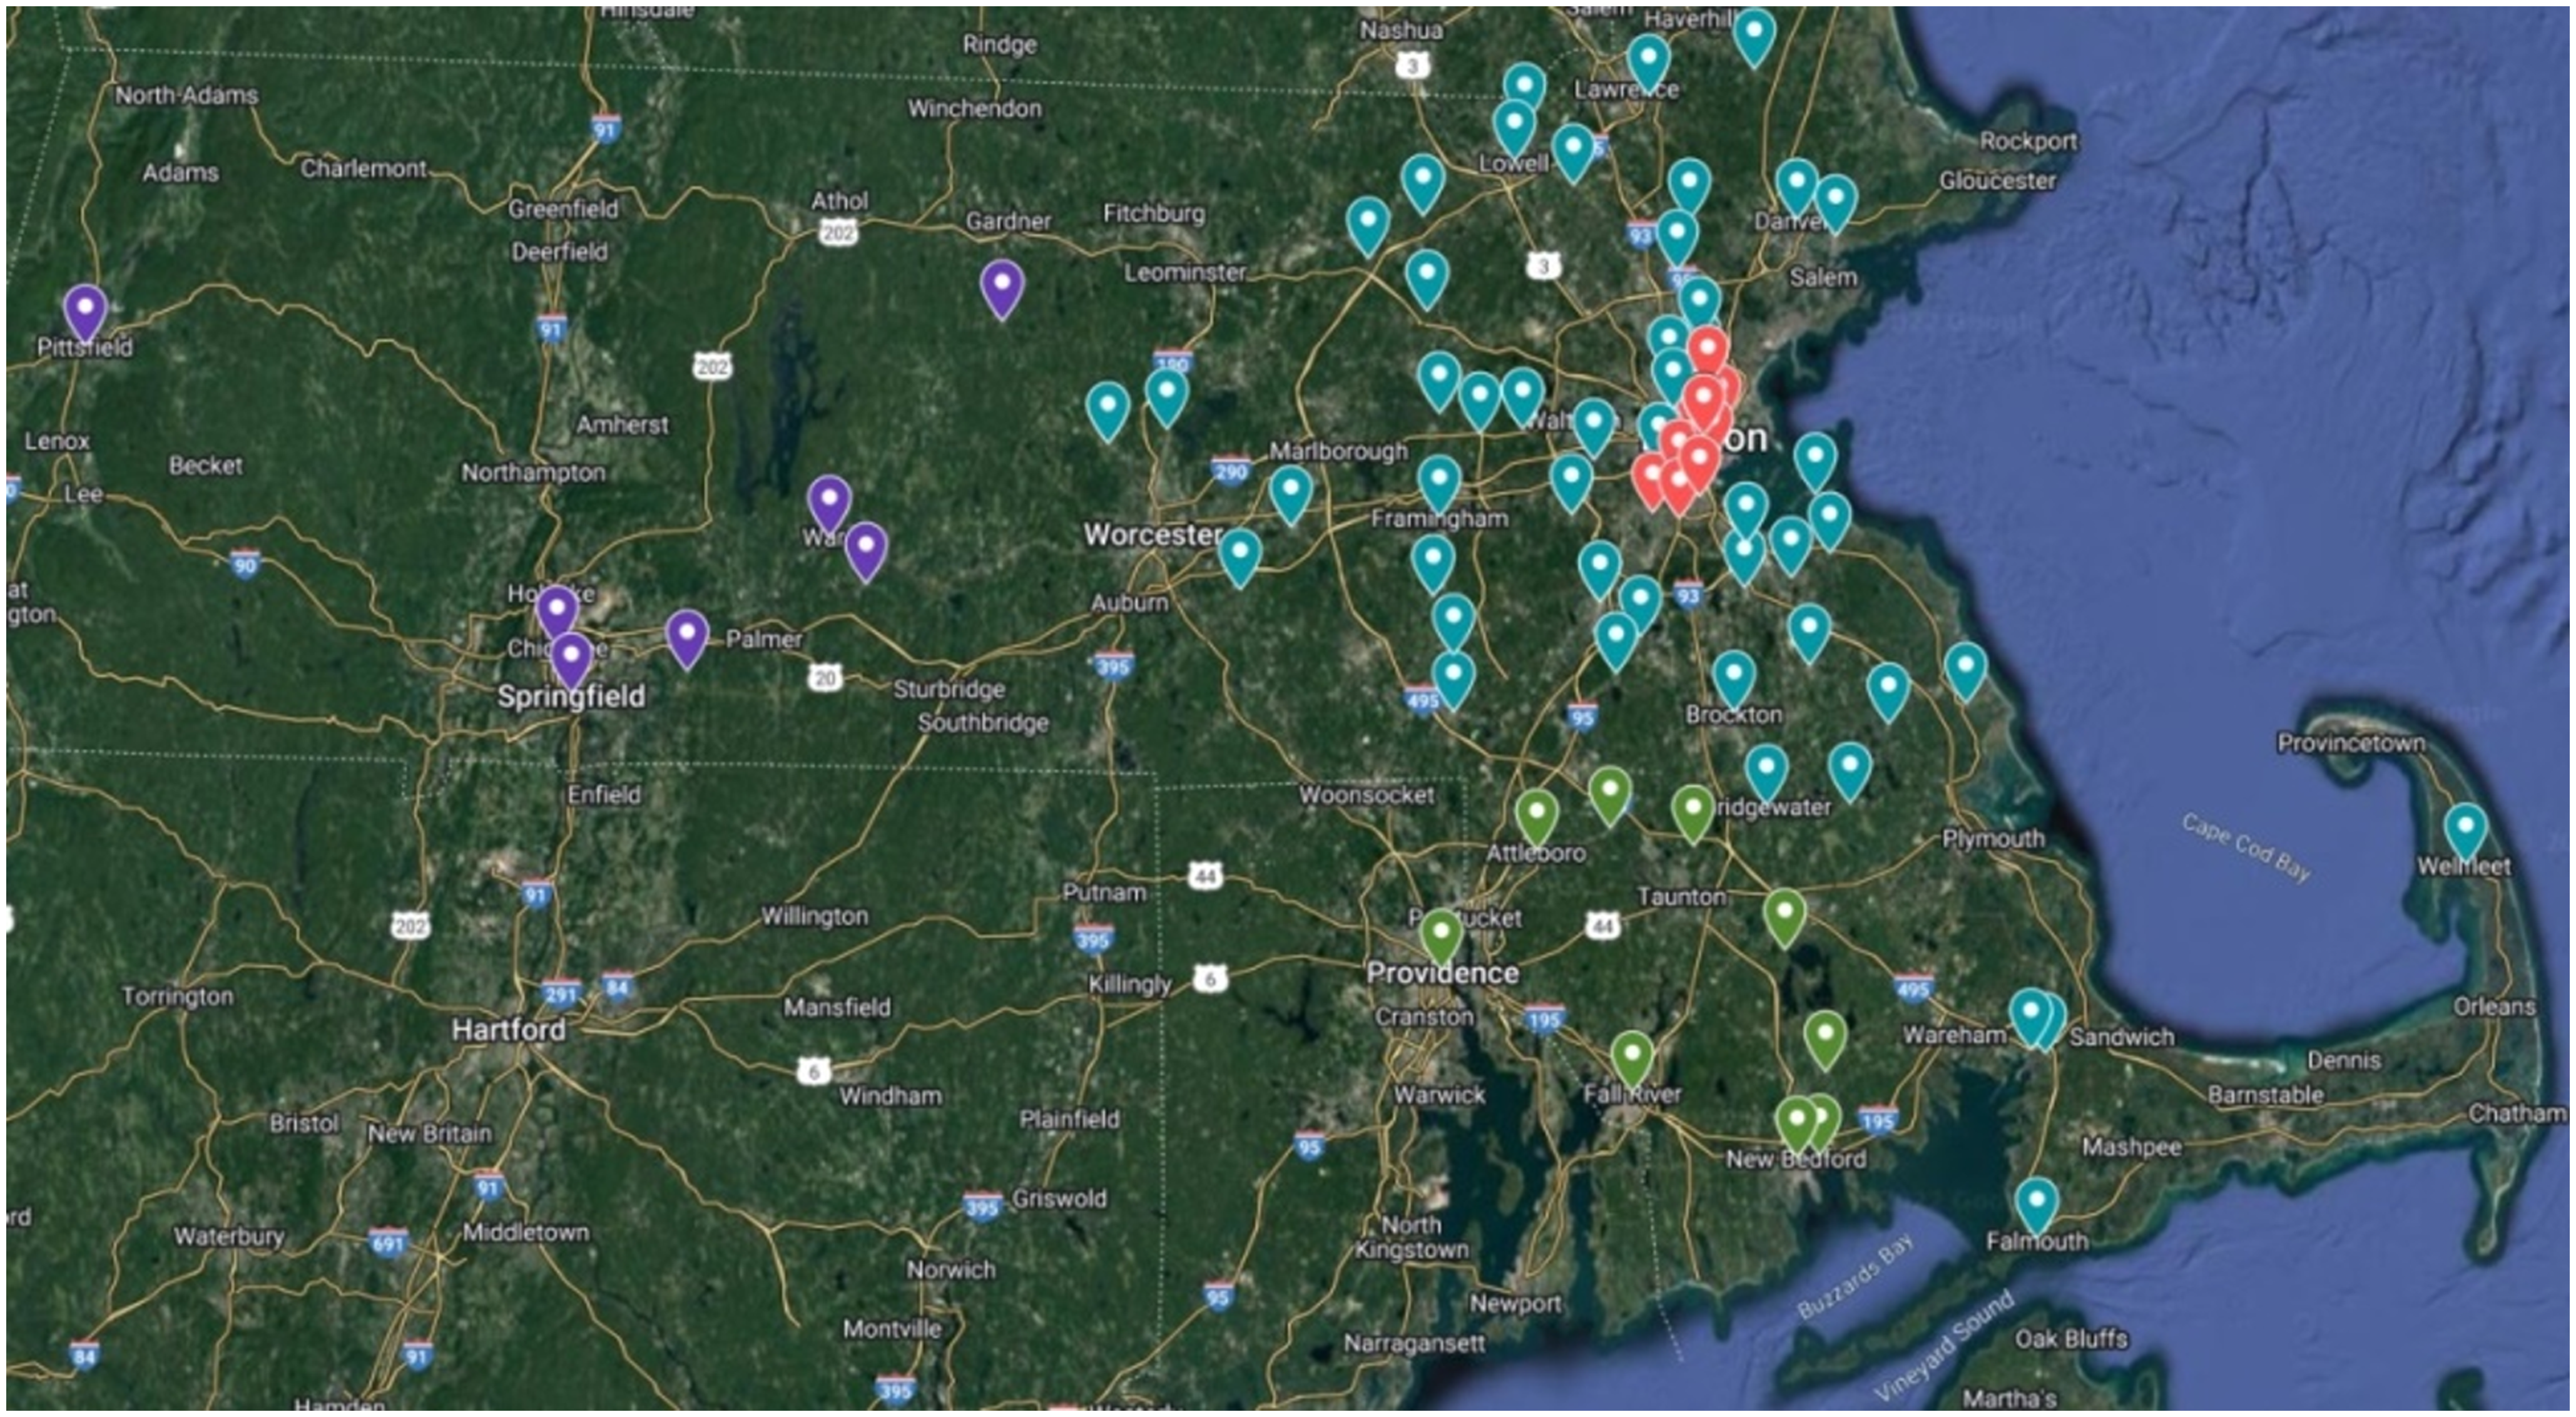
Participants were asked to self-report their current state, city, and zip code. At the time of the survey, all 111 participants were living in the Greater Boston Area. Participants’ answers to the questions of where they lived the majority of time during ages 0–12 and 13–18 were used to determine their dialect background. Most had lived in the same place at ages 0–12 and 13–18 or at least within the same dialect region. In total, 23 participants grew up within the city of Boston, while 69 were raised in Eastern Massachusetts, including the Greater Boston Area and adjacent suburbs. A smaller set of speakers grew up on the Cape or in Western Massachusetts (N = 7), or closer to the Providence, RI area (N = 12). Location flags in Map 1 are color-coded according to these four general regions, which roughly approximate the dialect regions of The Atlas of North American English (Labov et al. Reference Labov, Ash and Boberg2005).
Map showing where survey participants lived most of their lives from age 13 to 18. Flags are color-coded to roughly approximate the regions of The Atlas of North American English: red for the city of Boston, turquoise for areas of the North Shore, Metro West, South Shore, Cape Cod, and into Central MA, green for the South Coast and Greater Providence Area, and purple for Western MA and the Far West.
To better understand participants’ orientation toward the city of Boston, they were asked how they describe where they are from. Because the question was somewhat vague, participants’ responses may have depended on the context in which they imagined the question to be asked (e.g. while abroad vs. in a neighboring US state). Nearly all participants who grew up in the city of Boston (N = 22/23) reported that they would answer “Boston,” sometimes specifying a neighborhood, city, or town within the Greater Boston Area (e.g. Cambridge, Roslindale, etc.). Among ENE participants, 57% would say they were from Boston or Greater Boston, or else report that they lived a particular mileage East/North/South of Boston, especially if they were being asked by someone outside of Massachusetts. Orientation toward Boston was not as frequent among speakers from the Providence area or Western Massachusetts, with only 17% of RI and no WNE participants using Boston to orient where they are from.
Survey participants were asked to provide their age, gender, ethnicity, income, occupation, and highest level of education. For gender, ethnicity, income, and highest level of education, participants were presented with multiple choice boxes for which they could check only one option, though the questions for gender and ethnicity were followed by a free response field for participants to add nuance or further details if desired. Few respondents commented here, but those that did left responses like: “Cis-male” and “assigned female at birth, but identify as gender queer,” or “first generation American descended from South Korean immigrants” and “I am White and my family originates from Europe and Russia.” For age and occupation, participants wrote in their answers.
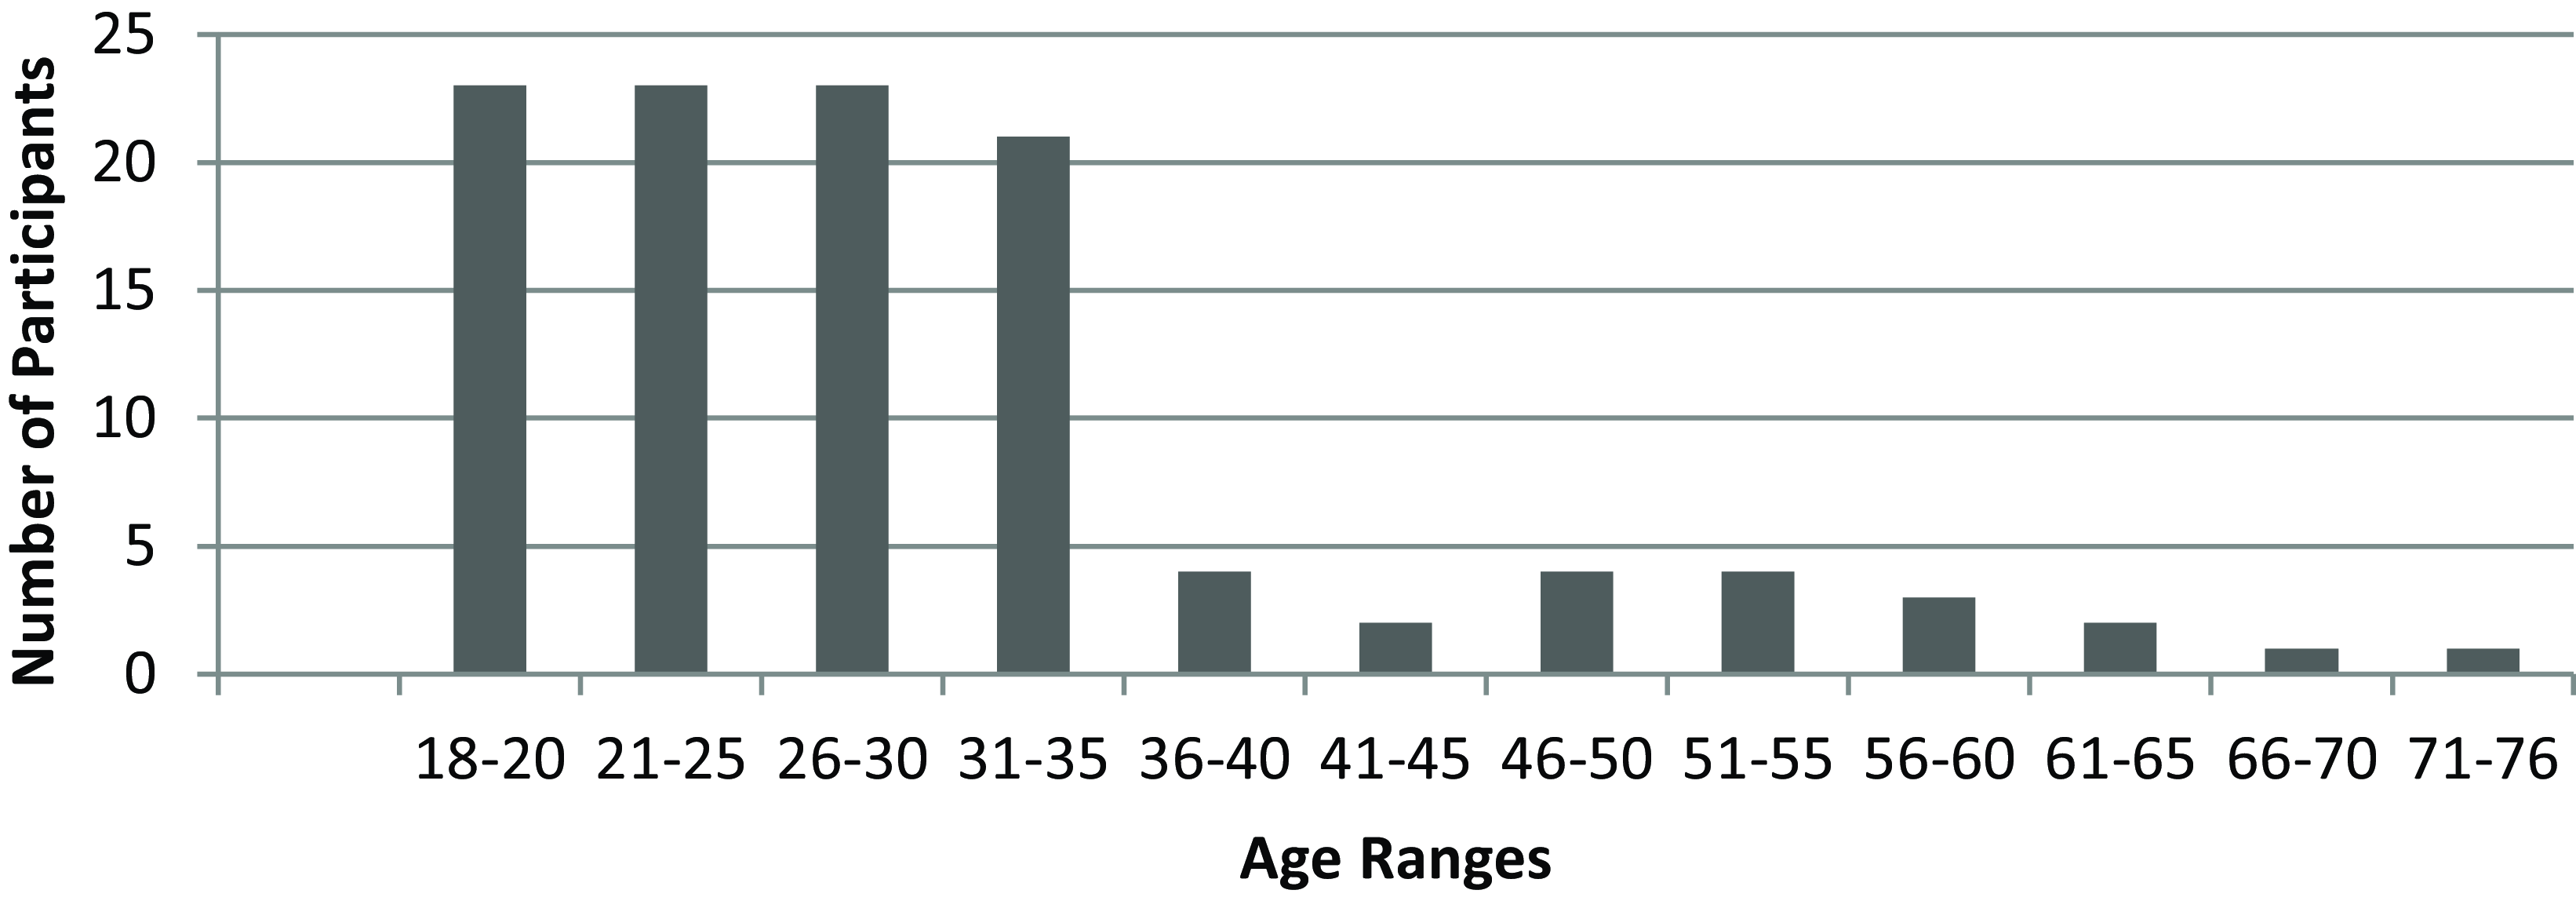
Respondents ranged in age from 18 to 76, though there are fewer participants aged 36 years and older (Figure 2). For gender, participants were more or less evenly split between female and male: female (N = 54), male (N = 56), non-binary (N = 1). For ethnicity, the traditional census categories were presented to participants for ease of analysis, and participants were distributed as follows: White/European American (N = 75, 68%), Asian/Pacific Islander (N = 14, 13%), Black/Caribbean/African American (N = 14, 13%), Mixed/Multiracial (N = 7, 6%), and Latinx/o/a (N = 1, <1%).
Age distribution of survey participants.
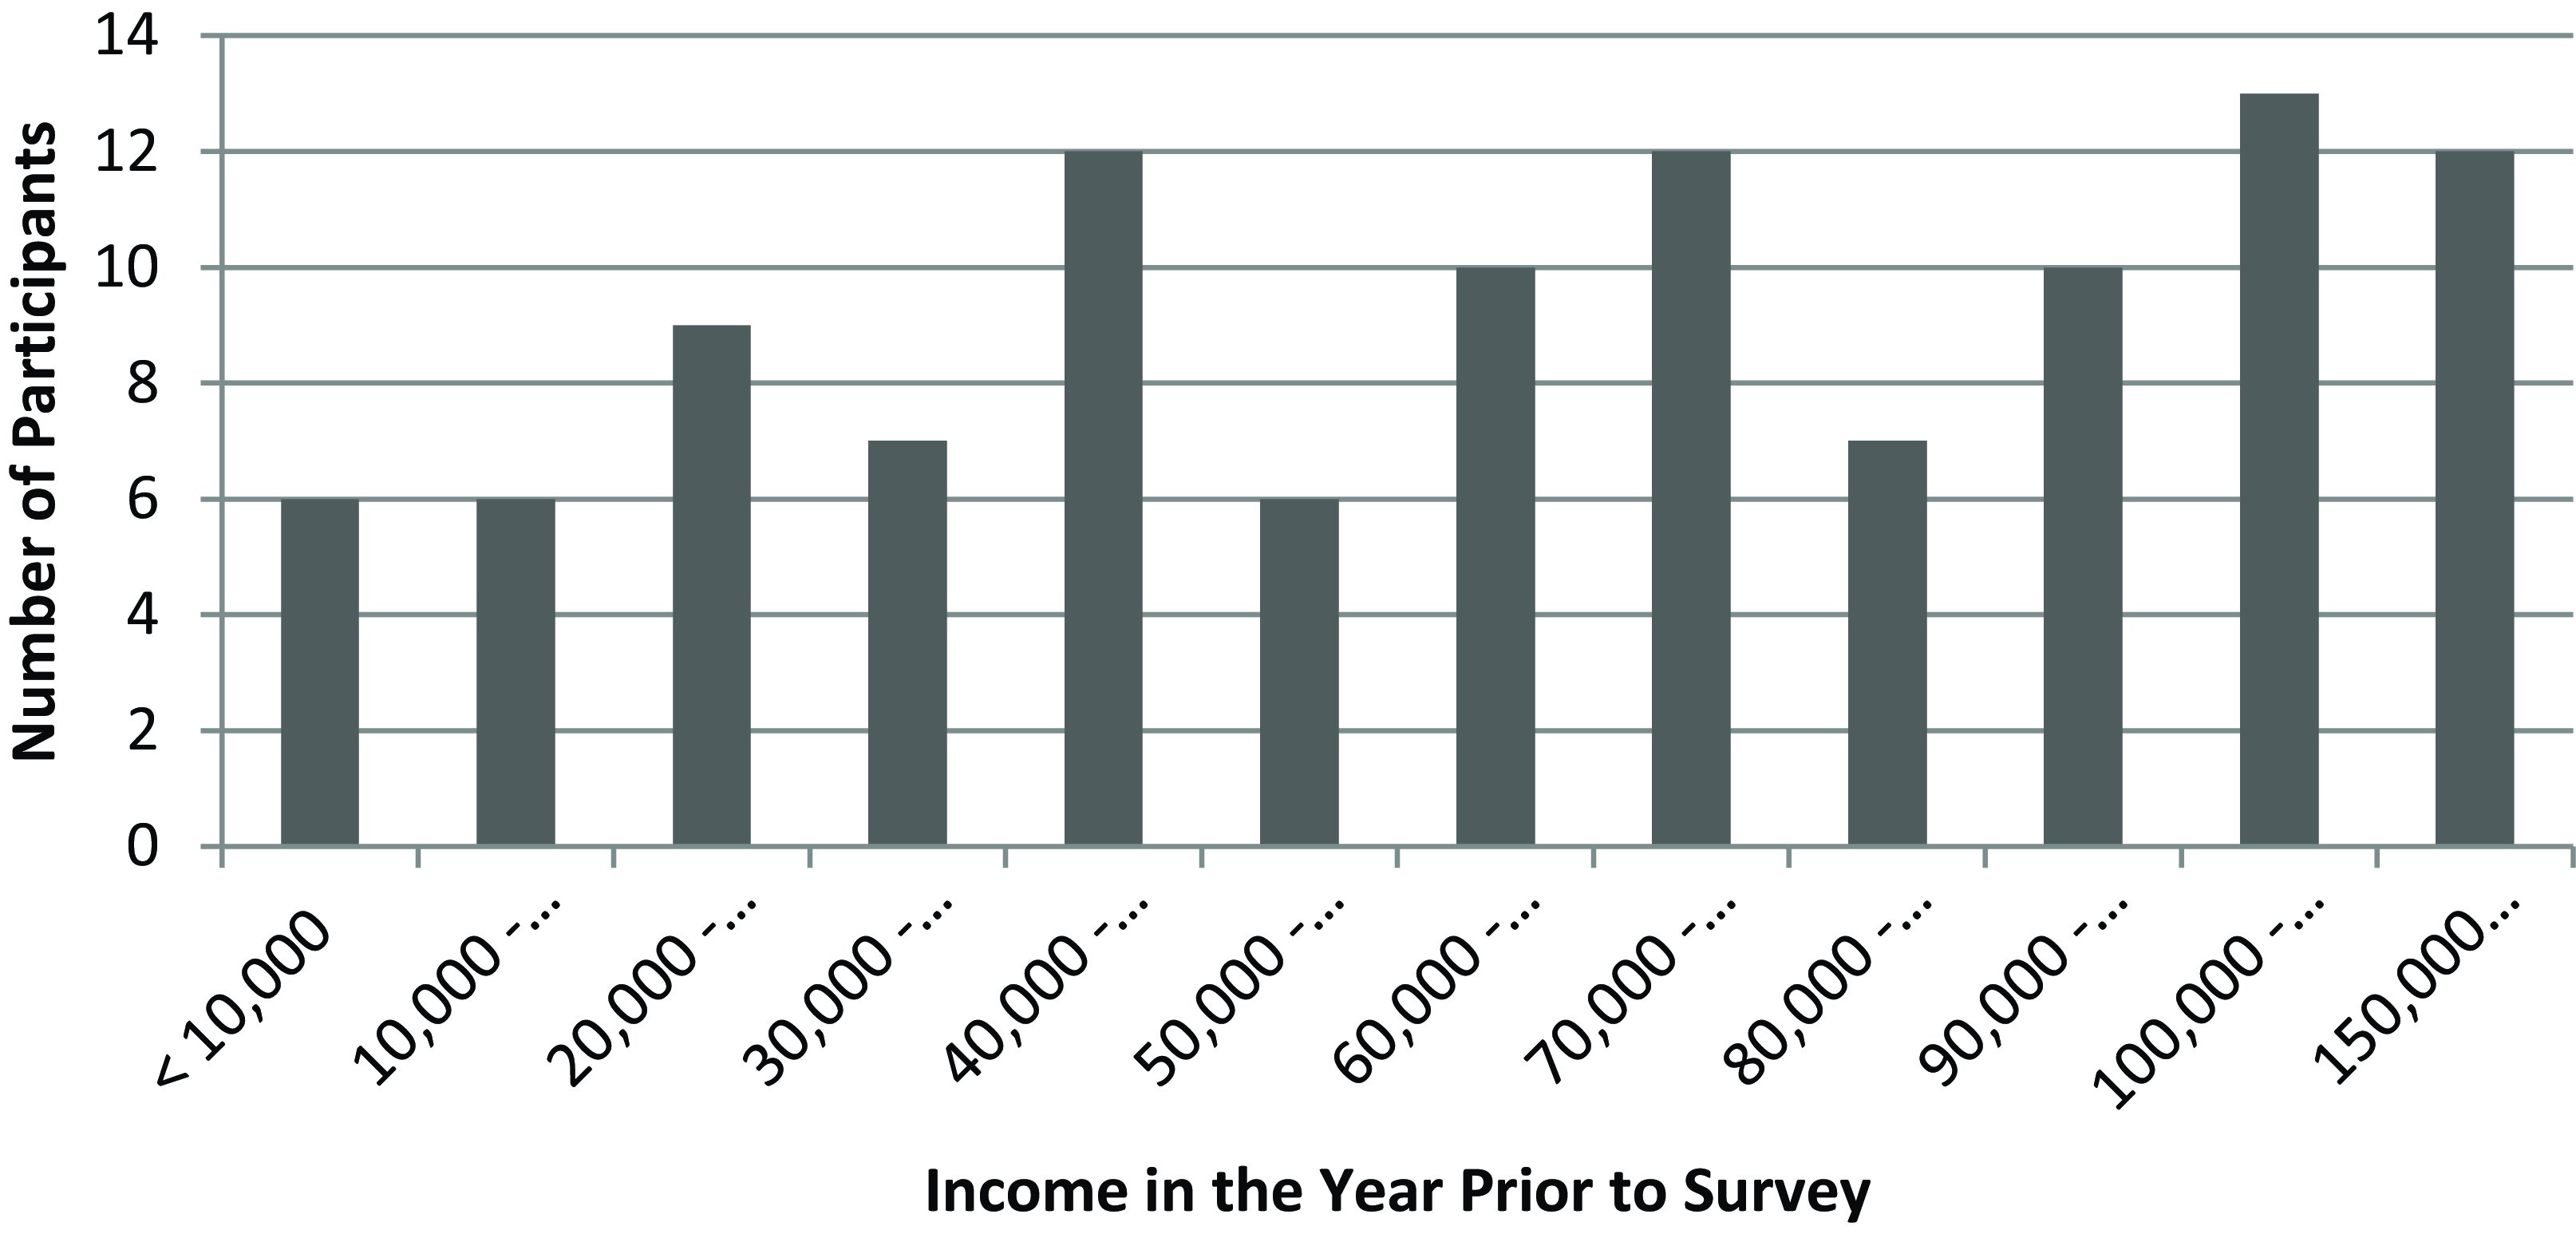
Household income in the year prior to the survey was recorded using 12 categories from “less than $10,000” to “$150,000 or more” (Figure 3). For the most part, participants’ listed occupations aligned with expected income from the previous year. For example, most participants who made less than $10,000 were students or unemployed, while those who made more than $100,000 for the most part listed occupations like software developer, lawyer, or portfolio consultant.Footnote 4
Participant-reported income ranges in the year prior to the survey.
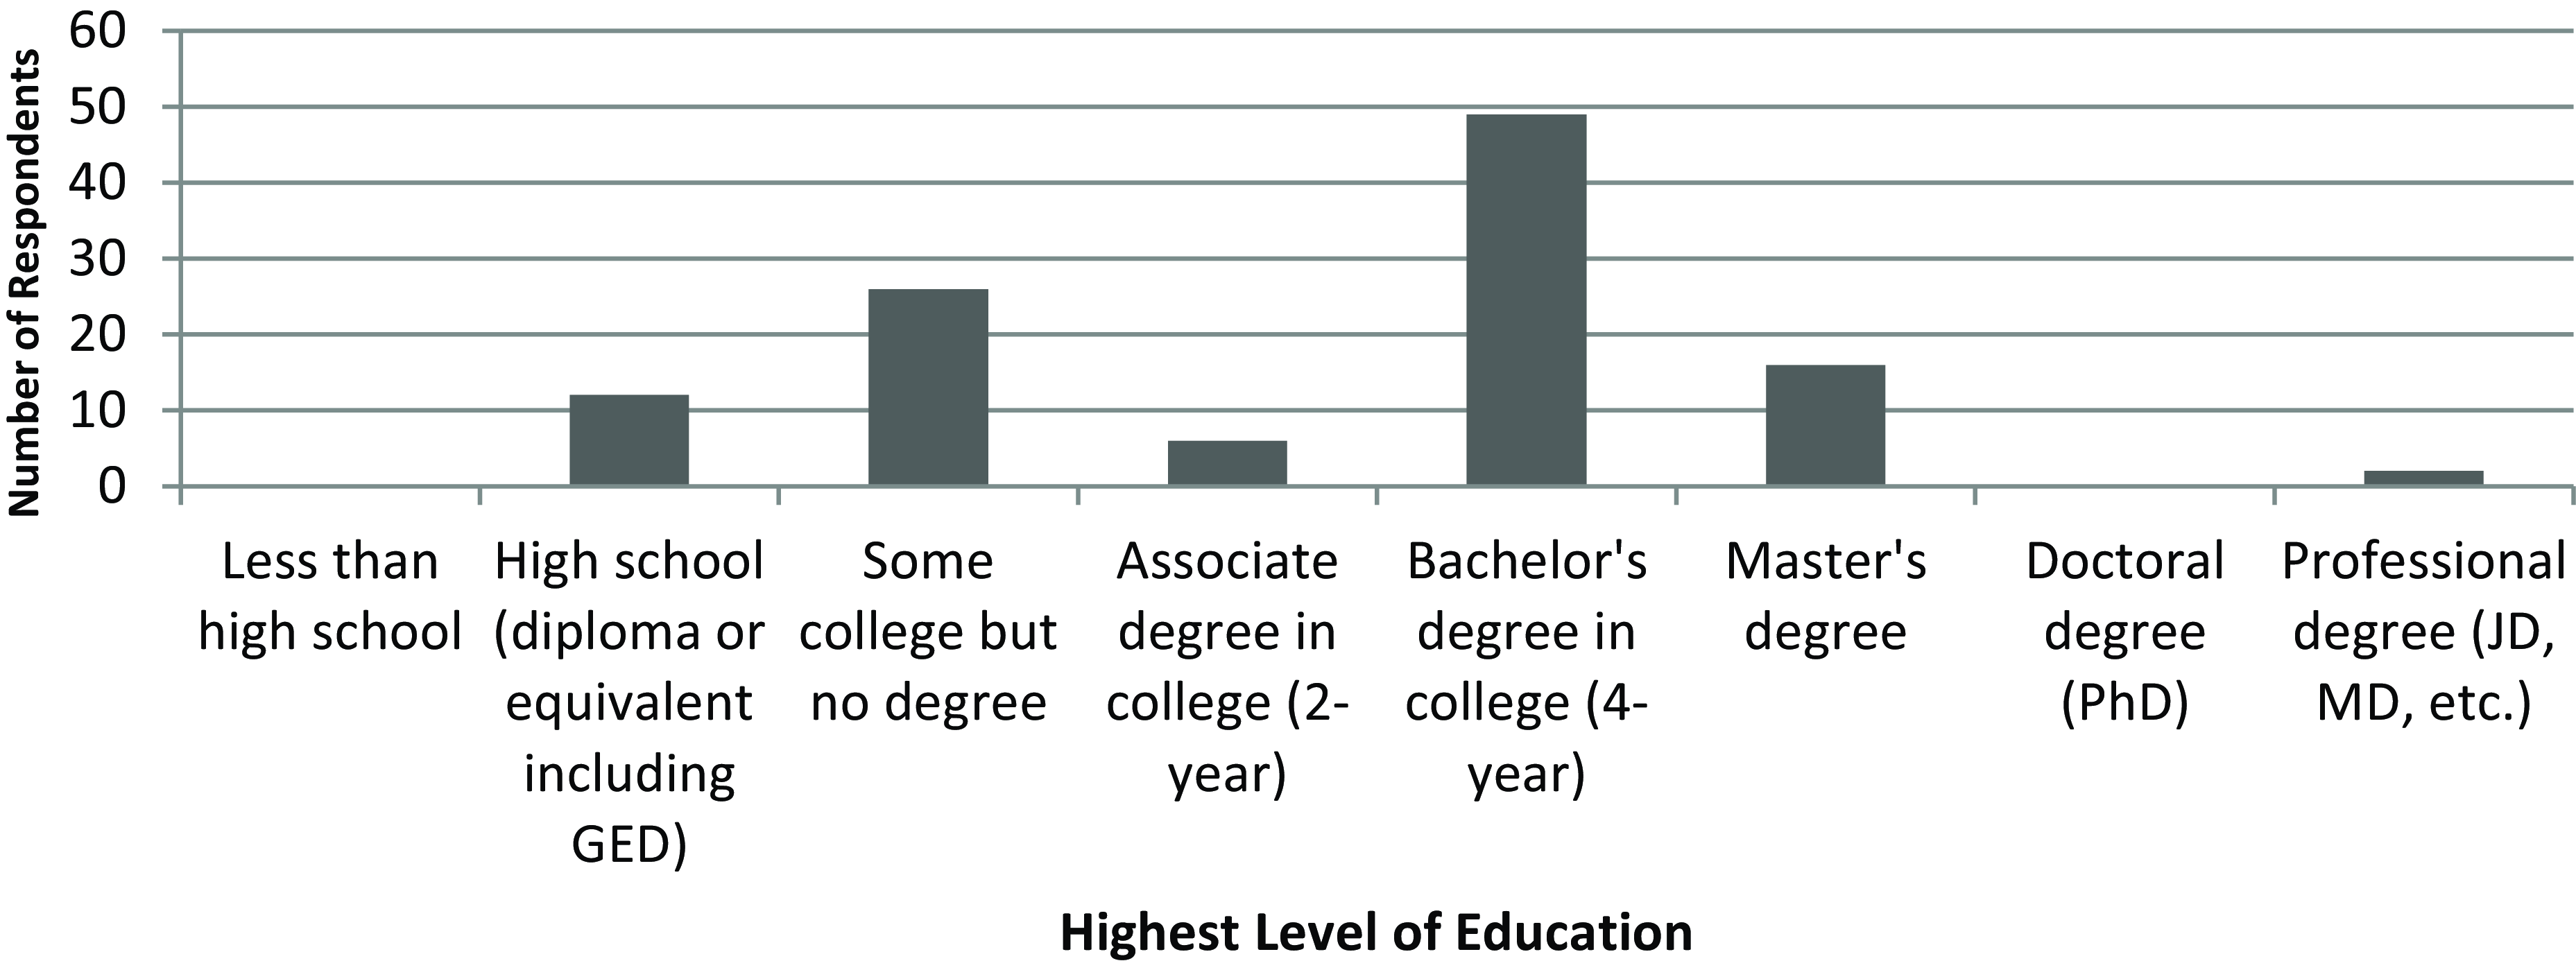
For highest level of education, participants could choose from among the eight options shown in Figure 4, from less than high school, to a Doctoral or Professional degree. 60% of participants possessed a bachelor’s degree from a 4-year college or higher. Overall, this sample of participants is more or less demographically comparable to that in Stanford’s (Reference Stanford2019) Mechanical Turk sample, with slightly more participants of color.
Distribution of highest level of education among survey participants.
3.3. Participant dialect experience
Participants were also asked to self-report their experience with and use of the “Boston” accent. What constituted a “Boston” accent was purposely not defined since one of the later questions participants would encounter was “what makes a Boston accent?” When asked whether they had heard a “Boston” accent before, all but two participants (one from Quincy, the other from Lowell) said that they had. The two participants who claimed not to have heard the accent later responded to a question about where they have heard a “Boston” accent by reporting that they had heard it in their neighborhood or community. Participants were also given a free response field to elaborate on their initial choice, though only respondents who chose “other” did so. “Other” respondents listed sources such as family members, friends, or associates, which were combined with the pre-existing category “neighborhood or community.”
The majority of participants reported hearing a “Boston” accent in their neighborhood/community (N = 68, 61%) compared to those who had heard it in their K-12 school (N = 5, <5%), college (N = 6, 5%), through travel (N = 1, <1%), or in entertainment/media (N = 31, 28%). The prevalence of native New Englanders who claim to have only heard a “Boston” accent in entertainment or media may reflect what some participants commented on as over-exaggerated media portrayals of local speech, which they view as contrasting with the lesser degree of accented speech they hear around them. However, if that is true, then answering the question in this way also indicates that these participants refer to the media stereotype of Boston speech when asked about the “Boston” accent, rather than what they actually hear around them.
Participants were also asked if they themselves had a “Boston” accent and were given the choices: “Definitely yes” (N = 11, 10%), “Sometimes yes” (N = 19, 17%), “A very light one” (N = 27, 24%), “I’m not sure” (N = 17, 15%), and “No” (N = 37, 33%). The majority of participants who reported not having an accent (N = 23) grew up either in Boston or Eastern Massachusetts. Overall, 51% of participants reported having some degree of accent.
3.4. Dialect perception experiment
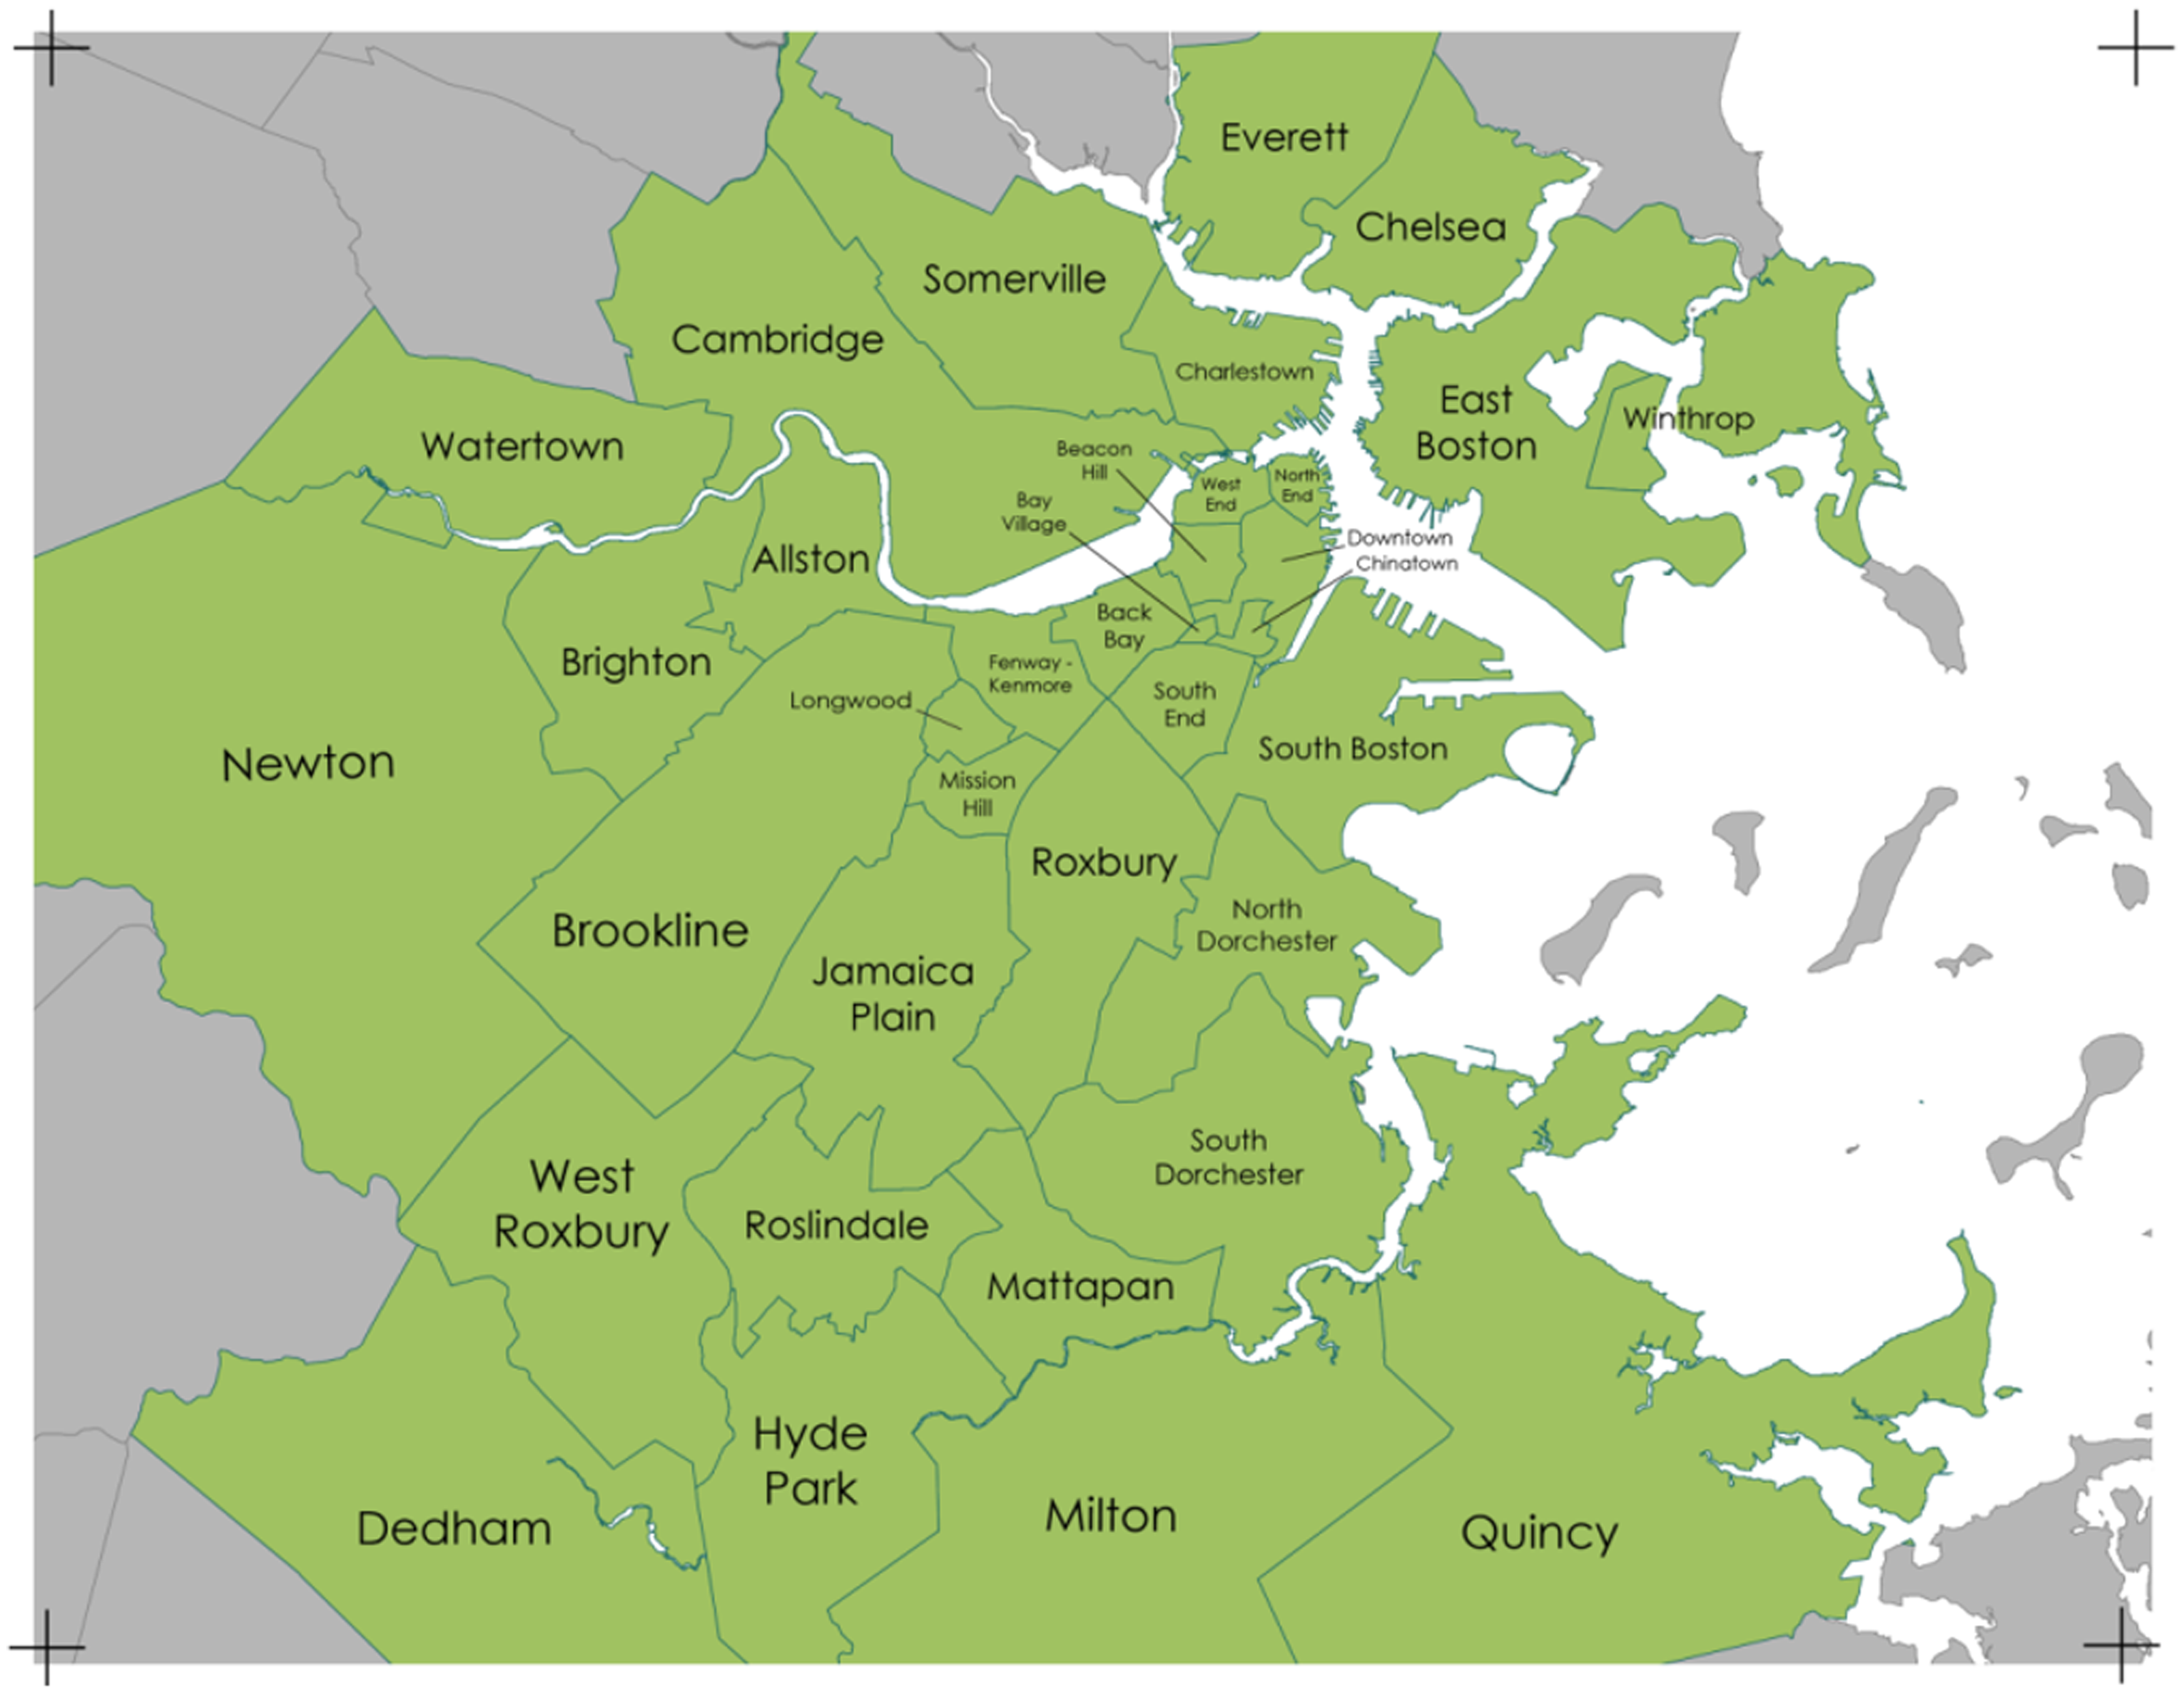
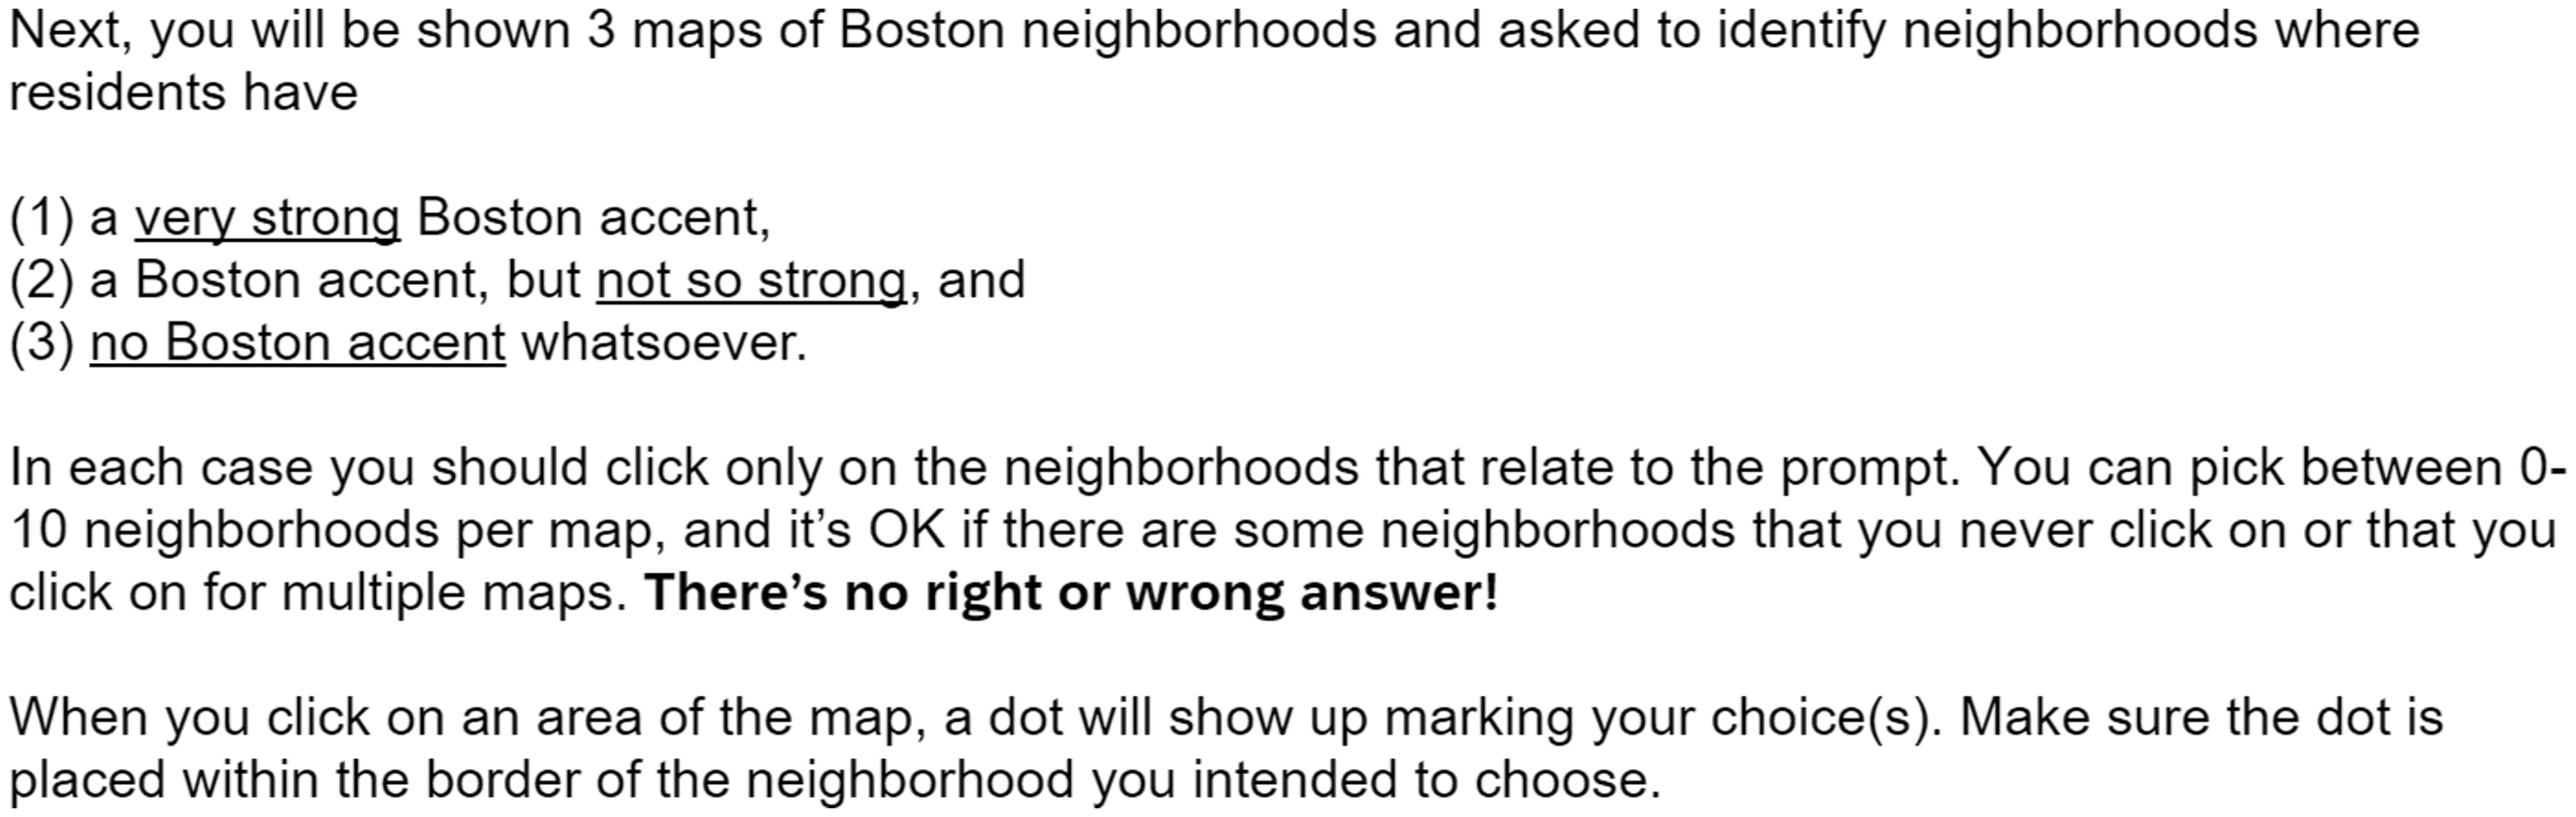
For the dialect perception experiment, participants were first asked to identify features of the “Boston” accent through two questions: What makes a “Boston” accent? Are there any pronunciations, words, or phrases specific to Boston? Next, they were asked what their opinion of the accent was and whether they considered it “a plus” or “a minus.” These questions were followed by a perceptual dialectology task wherein participants were presented with three customized blank maps, one at a time, of the Greater Boston Area and surrounding suburbs that included geographic boundaries for each area (Map 2)Footnote 5 and given the instructions shown in Figure 5. Though the areas defined on the map ranged from neighborhoods within the city of Boston (e.g. South Boston) to independent cities (e.g. Cambridge) and towns (e.g. Milton), they were all referred to as “neighborhoods” in the task. Additionally, Dorchester appears on the map divided into North and South Dorchester consistent with city of Boston municipal designations (City of Boston Parks and Recreation, 2006). Possible consequences of these design choices are discussed in the conclusion.
Map of the Greater Boston Area used in the perceptual dialectology task.
Perceptual dialectology task general instructions.
The prompt for each of the three individual maps was as follows:
Click only on the neighborhoods where you expect that people with strong Boston accents might live. Choose only 10 neighborhoods. Your 11th choice will erase your 1st choice.
The term “strong Boston accent” was replaced by “a Boston accent, but not so strong” and “no Boston accent whatsoever” in the second and third map respectively. The task was constructed in this way to test the belief that South Boston was the only neighborhood that residents believed to have a stronger than average ENE accent. It attempted to leave room for participants to associate other neighborhoods with accented speech, perhaps to a lesser degree, or to capture whether participants believed there were other ways of speaking around the city beside a “strong” ENE dialect.
The customized stimulus map was paired with the Heat Map Question tool in Qualtrics following Callesano (Reference Callesano2020). Using the tool, each neighborhood was designated its own geometric data field (polygon) so that the survey software recorded each time that a participant clicked inside each field. When participants clicked outside of an established polygon, their response was counted as “Other.” Given that there were three different maps, participants could choose the same neighborhood for all three accent values (strong, not so strong, no accent), though this seemed to happen infrequently. In addition to providing immediate visualizations of the results, the heat map tool also allowed for the click data from each polygon to be aggregated into the total number of clicks per neighborhood. This information was thus also used to generate a choropleth map representation of the results.Footnote 6
After each of the three maps, participants were given a free response field and asked to add any additional comments about the neighborhood(s) they selected. Finally, participants were asked whether they associate the “Boston” accent with a particular type of person in terms of age, gender, race, neighborhood, education, occupation, attitude, or friendliness. They were also asked a final time to add any additional comments they had about the survey, “Boston” accents, or Boston neighborhoods before being redirected to a page thanking them for completing the survey. The average time it took a participant to complete the entire survey was roughly 582 seconds, or 9.7 minutes.
4. Results and analysis
4.1. What makes a “Boston” accent?
In response to questions about what makes a “Boston” accent, consistent with Stanford (Reference Stanford2019), participants most frequently named non-rhoticity (77%), which was conveyed by comments like “the most classic, is the lack of r, so you get sounds like chow-dah or haw-vard.” Though start-fronting itself was not explicitly mentioned, 41% of participants mentioned start words in response to these questions (e.g. smahht for “smart,” pahk for “park,” etc.) and 16% mentioned the phrase “pahk ya cah in Hahvahd Yahd” or some variant of it. 11% of participants did make comments like “the A’s are pronounced differently,” but the examples they provided (or lack thereof) did not make clear whether these were restatements of non-rhoticity in start environments, start/palm-fronting, or something else entirely. Linking-R was also mentioned by 11% of participants, while some others made comments related to vowel quality, either mentioning other specific vowels (e.g. “Os,” “ow,” or “aw”) (8%) or just “vowels” in general (8%), and one participant made reference to “broad A sounds.” In general, participants did not mention morphosyntactic features of Boston area speech, though two people mentioned ING, consistent with previous work (Babcock, Reference Babcock2014). In response to the question about words or phrases that are specific to Boston, participants’ comments focused mostly on well-known New England lexical items.Footnote 7
In this section, participants infrequently mentioned linguistically related qualities attributed to “Boston” speech, such as volume (“Boston” accents are “usually very loud”), speed (“usually quick”), annunciation (“slurring some words”), prosodic elements (“certain emphasis put on certain syllables,” “specific words being elongated”), as well as character attributes (“tough sounding,” “uneducated,” “direct,” “sounding like a jerk,” “doesn’t sound very refined and lacks sophistication”). Comments were also made about the accent being “thick dialect,” harsh, “guttural,” or “throaty.” One participant simply said “Yankees suck.”
4.2. Attitudes toward the “Boston” accent
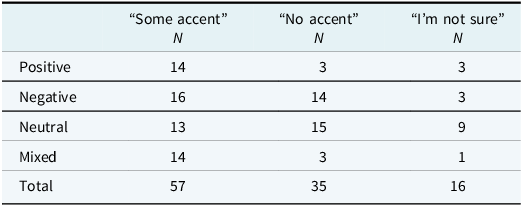
Next, participants were asked to answer the free response question what’s your opinion of the Boston accent? Is having one a plus or a minus? Their responses were categorized as “positive,” “negative,” “neutral,” or as “mixed,” expressing a combination of negative evaluation coupled with expressions of appreciation and/or covert prestige. While many attitudes coded as “positive” possibly also expressed covert prestige (referencing local pride, feelings of home, and uniqueness rather than appealing to correctness or widespread use), they differed from “mixed” attitudes because they did not also express linguistic insecurity or negative opinions that may have been external to the participant. 108 of the 111 participants responded to this question. Examples of each response category are shown in Table 1.
Participant opinions about the “Boston” accent.
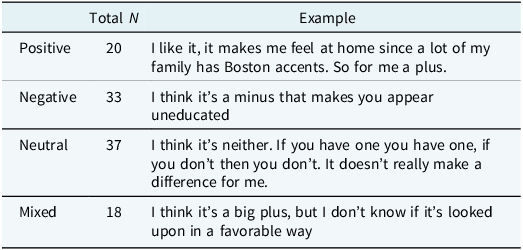
The majority of participants had either positive or neutral evaluations of the “Boston” accent (52% combined). 30% of respondents had an overtly “negative” attitude, which focused on stereotypes of local speech as unintelligent, uneducated, or lower-class. Negative attitudes that reference a lack of education or lower class seem to indicate that these participants were evaluating “Boston” speech based on the “working-class” stereotype rather than that of the “educated elite” (Hartley, Reference Hartley2005). It is unclear whether everyone in the survey did the same, but it is noteworthy that attributes like “educated” or “wealthy” were not found in any participant comments. Finally, 17% of respondents expressed attitudes best classified as “mixed.”
Interestingly, but perhaps unsurprisingly, when looking at a cross-tabulation of participant attitudes toward a “Boston” accent by whether that participant self-reported as having one (Table 2), participants who report having some accent (from “definitely yes” to “a light one”) express all attitudes fairly equally. On the other hand, those who report not having an accent overwhelmingly express attitudes that are either neutral or negative, to the exclusion of more overtly positive or even mixed positive attitudes.
Cross-tabulation of reported accent by attitude toward the accent for 108/111 participants.
4.3. Strong “Boston” accents
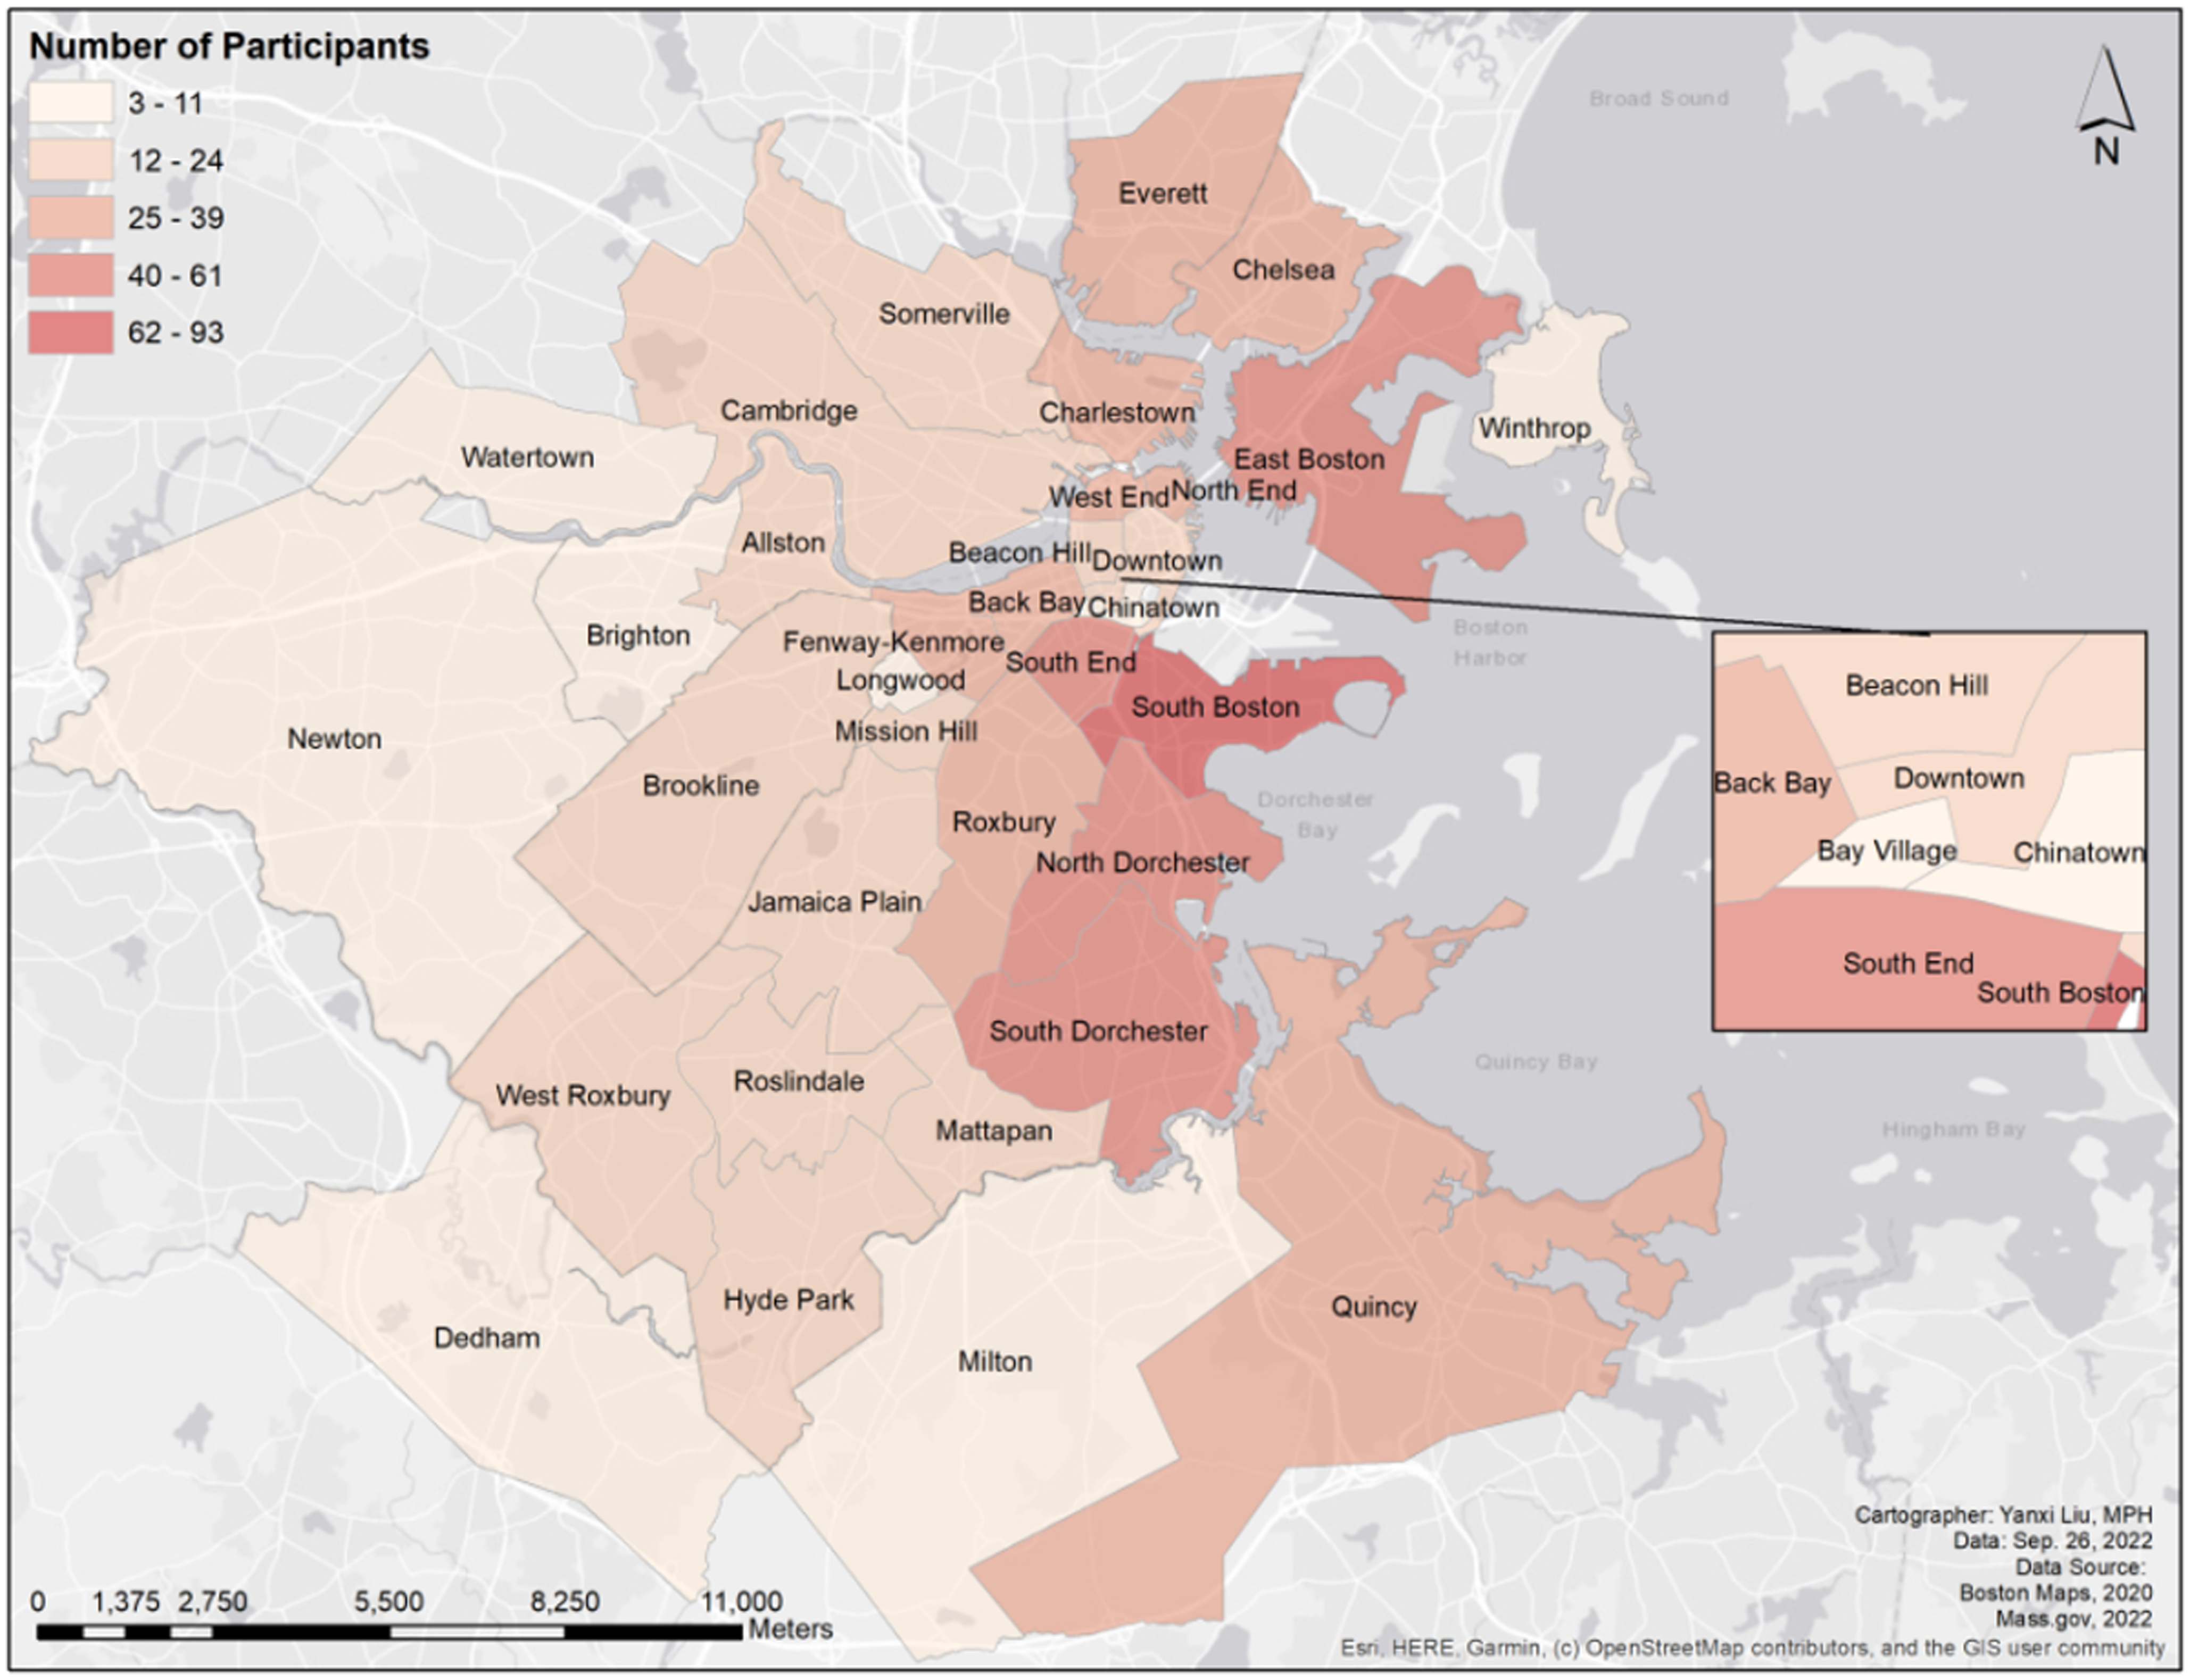
To reiterate, for the map task, participants were asked to click on the areas where they perceived residents to have a “strong Boston accent” (Map 3), “a Boston accent, but not so strong” (Map 4), or “no Boston accent whatsoever” (Map 5). The choropleth map for “strong Boston accent” (Map 3) makes it clear that South Boston was the most frequently chosen neighborhood (by N = 93/111, or 84% of participants), followed by East Boston (N = 61, 55%), North Dorchester (N = 58), South End (N = 54), and South Dorchester (N = 51). As one 22-year-old White female participant puts it, these neighborhoods represent “the heart of the city, where the accent’s the strongest.” In a paired t-test, the difference between a participant choosing South Boston or the next most chosen neighborhood, East Boston, was significant at p < 0.001. However, the differences between the remaining top five neighborhoods, or between South Dorchester and the next highest neighborhood of Charlestown, were not significant. No other neighborhoods had a bigger difference between them than between South Dorchester and Charlestown (a difference of 12 participants), so the incremental differences between remaining neighborhoods are most likely also not significant. However, there is a significant difference between the second highest neighborhood, East Boston, and the sixth highest, Charlestown (p < 0.01), indicating that, while there may not be incremental differences between neighborhoods, participants perceive real differences between groupings of neighborhoods. In other words, it seems to make little difference overall whether East Boston is ranked above or below North Dorchester, but on average, participants perceive them both to be more accented than neighborhoods like Charlestown/Back Bay, or West Roxbury/Cambridge.
Neighborhoods chosen by participants as having the strongest “Boston” accents. Number of participants is color-coded. Color/participant number divisions were determined using Jenks Natural Breaks (Jenks, Reference Jenks1967).
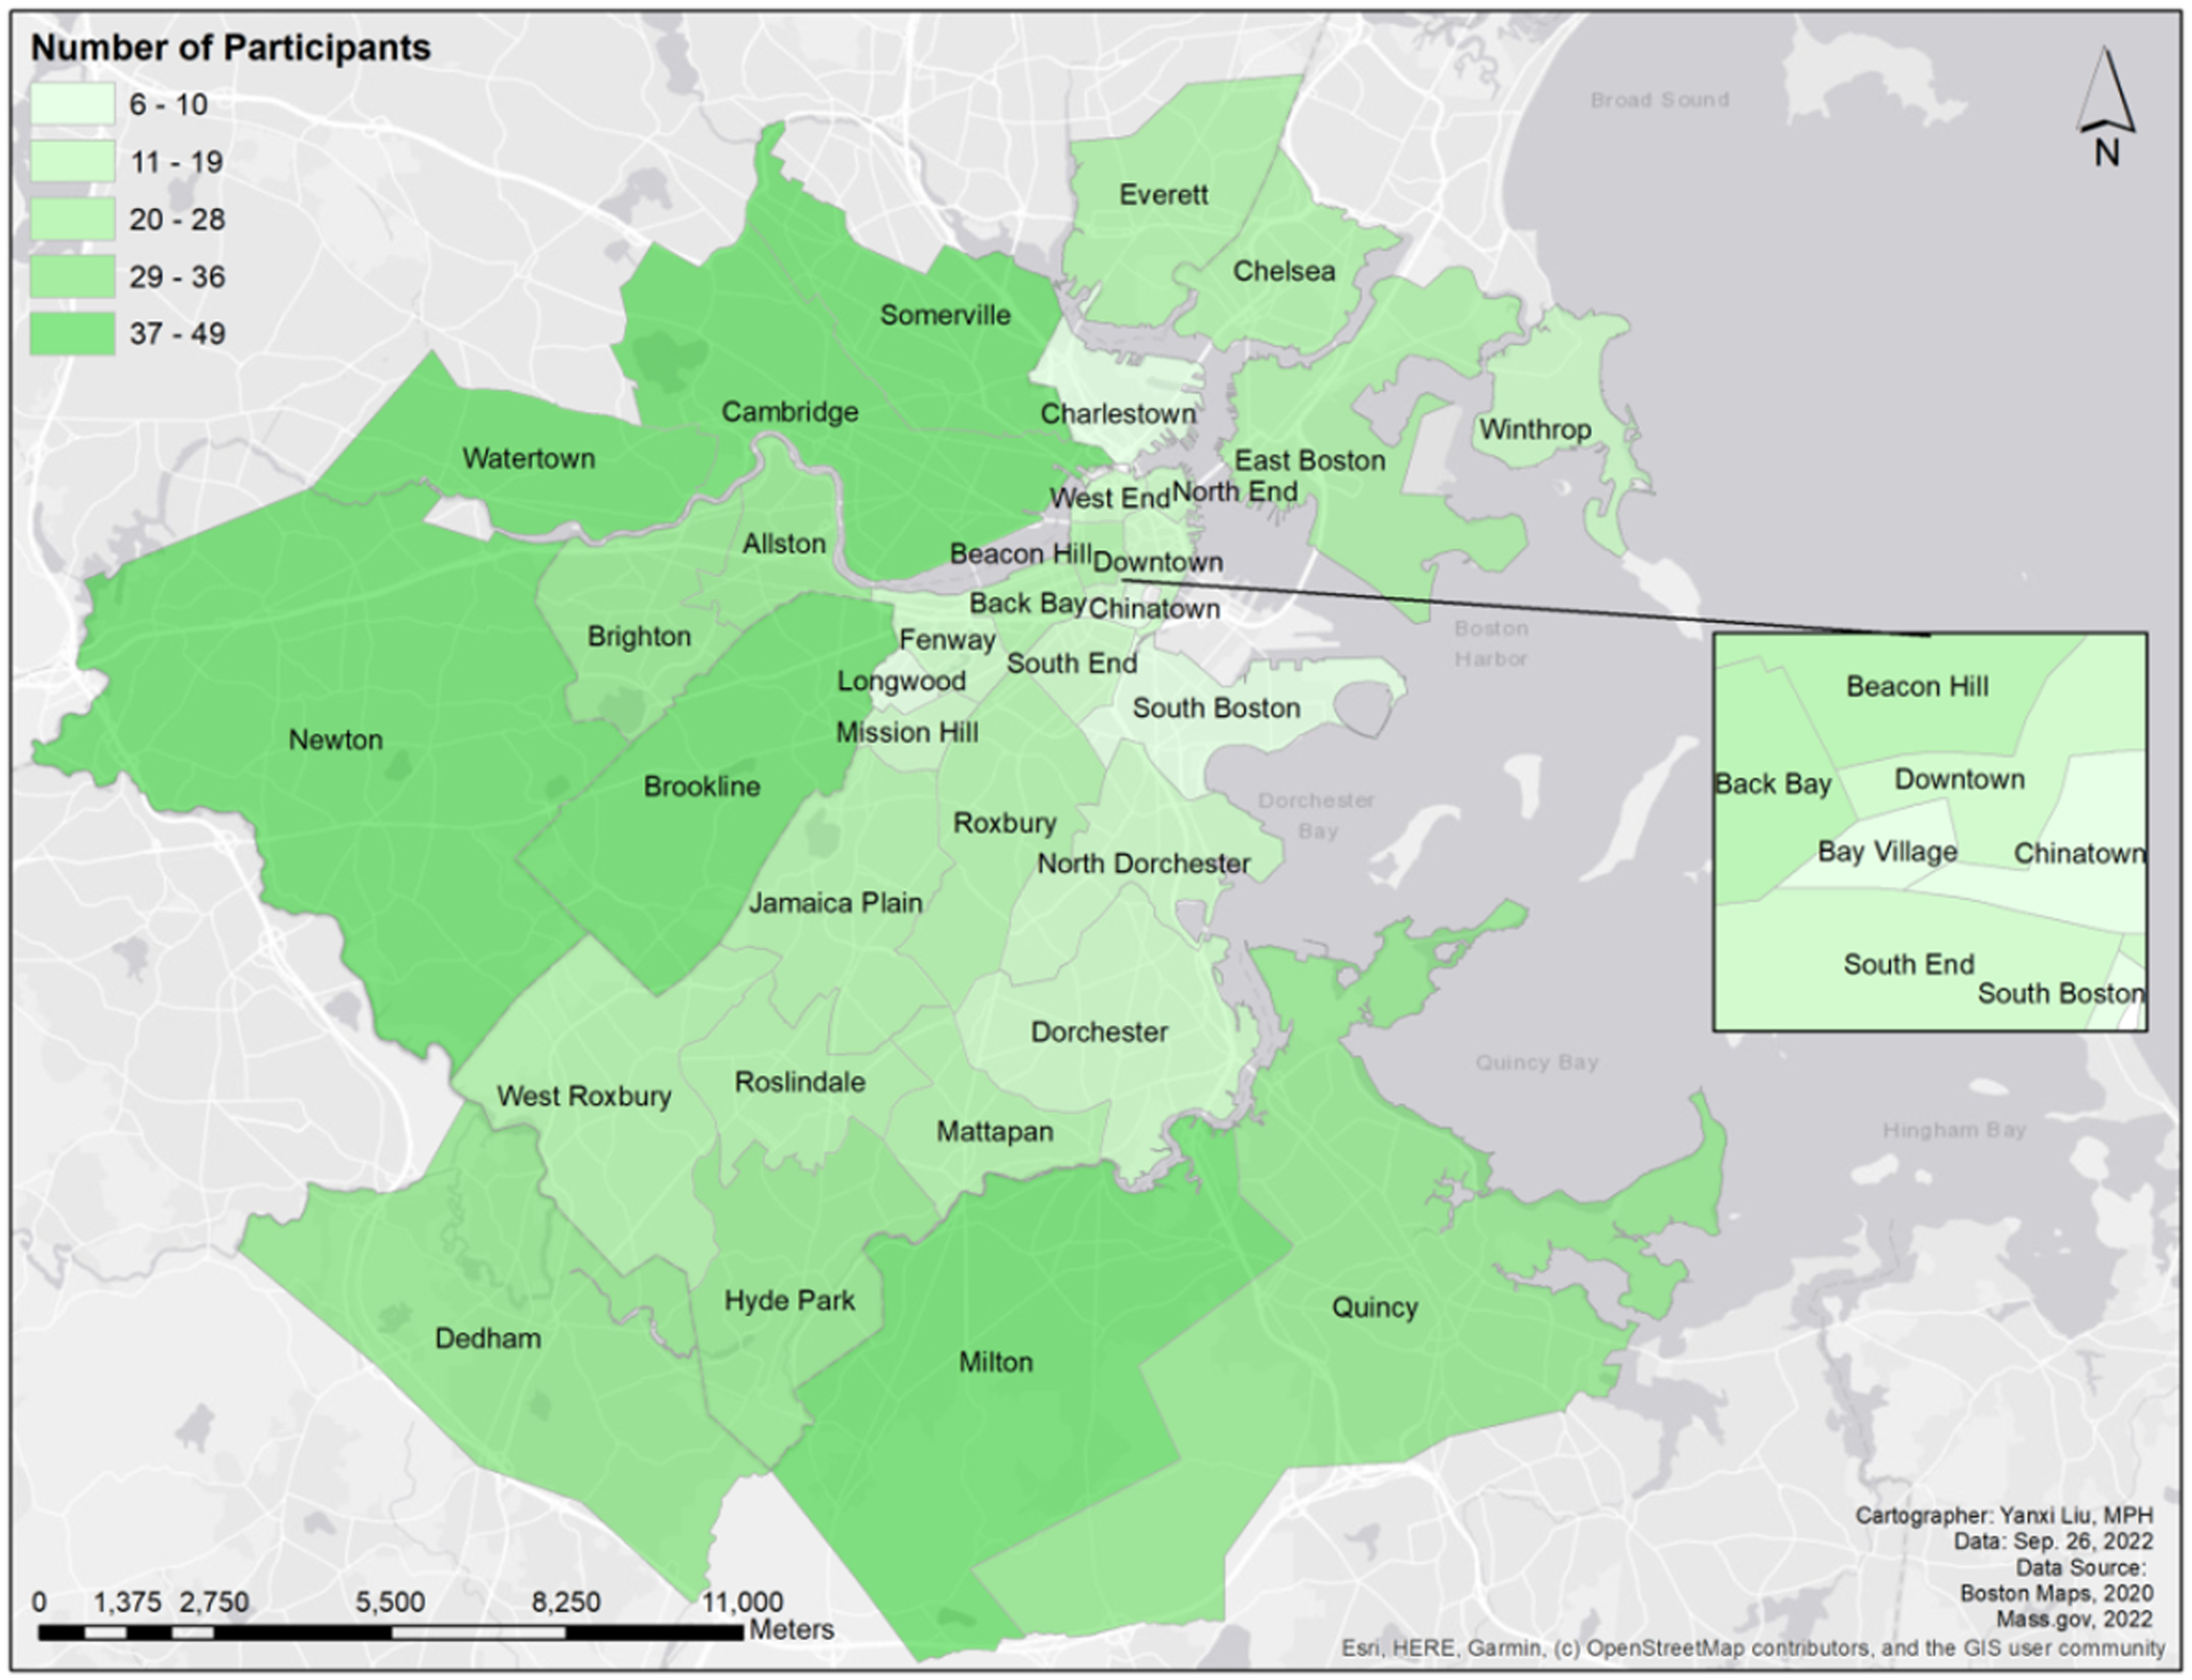
Neighborhoods chosen by participants as having a “Boston” accent that was not as strong as the stronger Boston accent. Number of participants is color-coded. Color/participant number divisions were determined using Jenks Natural Breaks (Jenks, Reference Jenks1967).
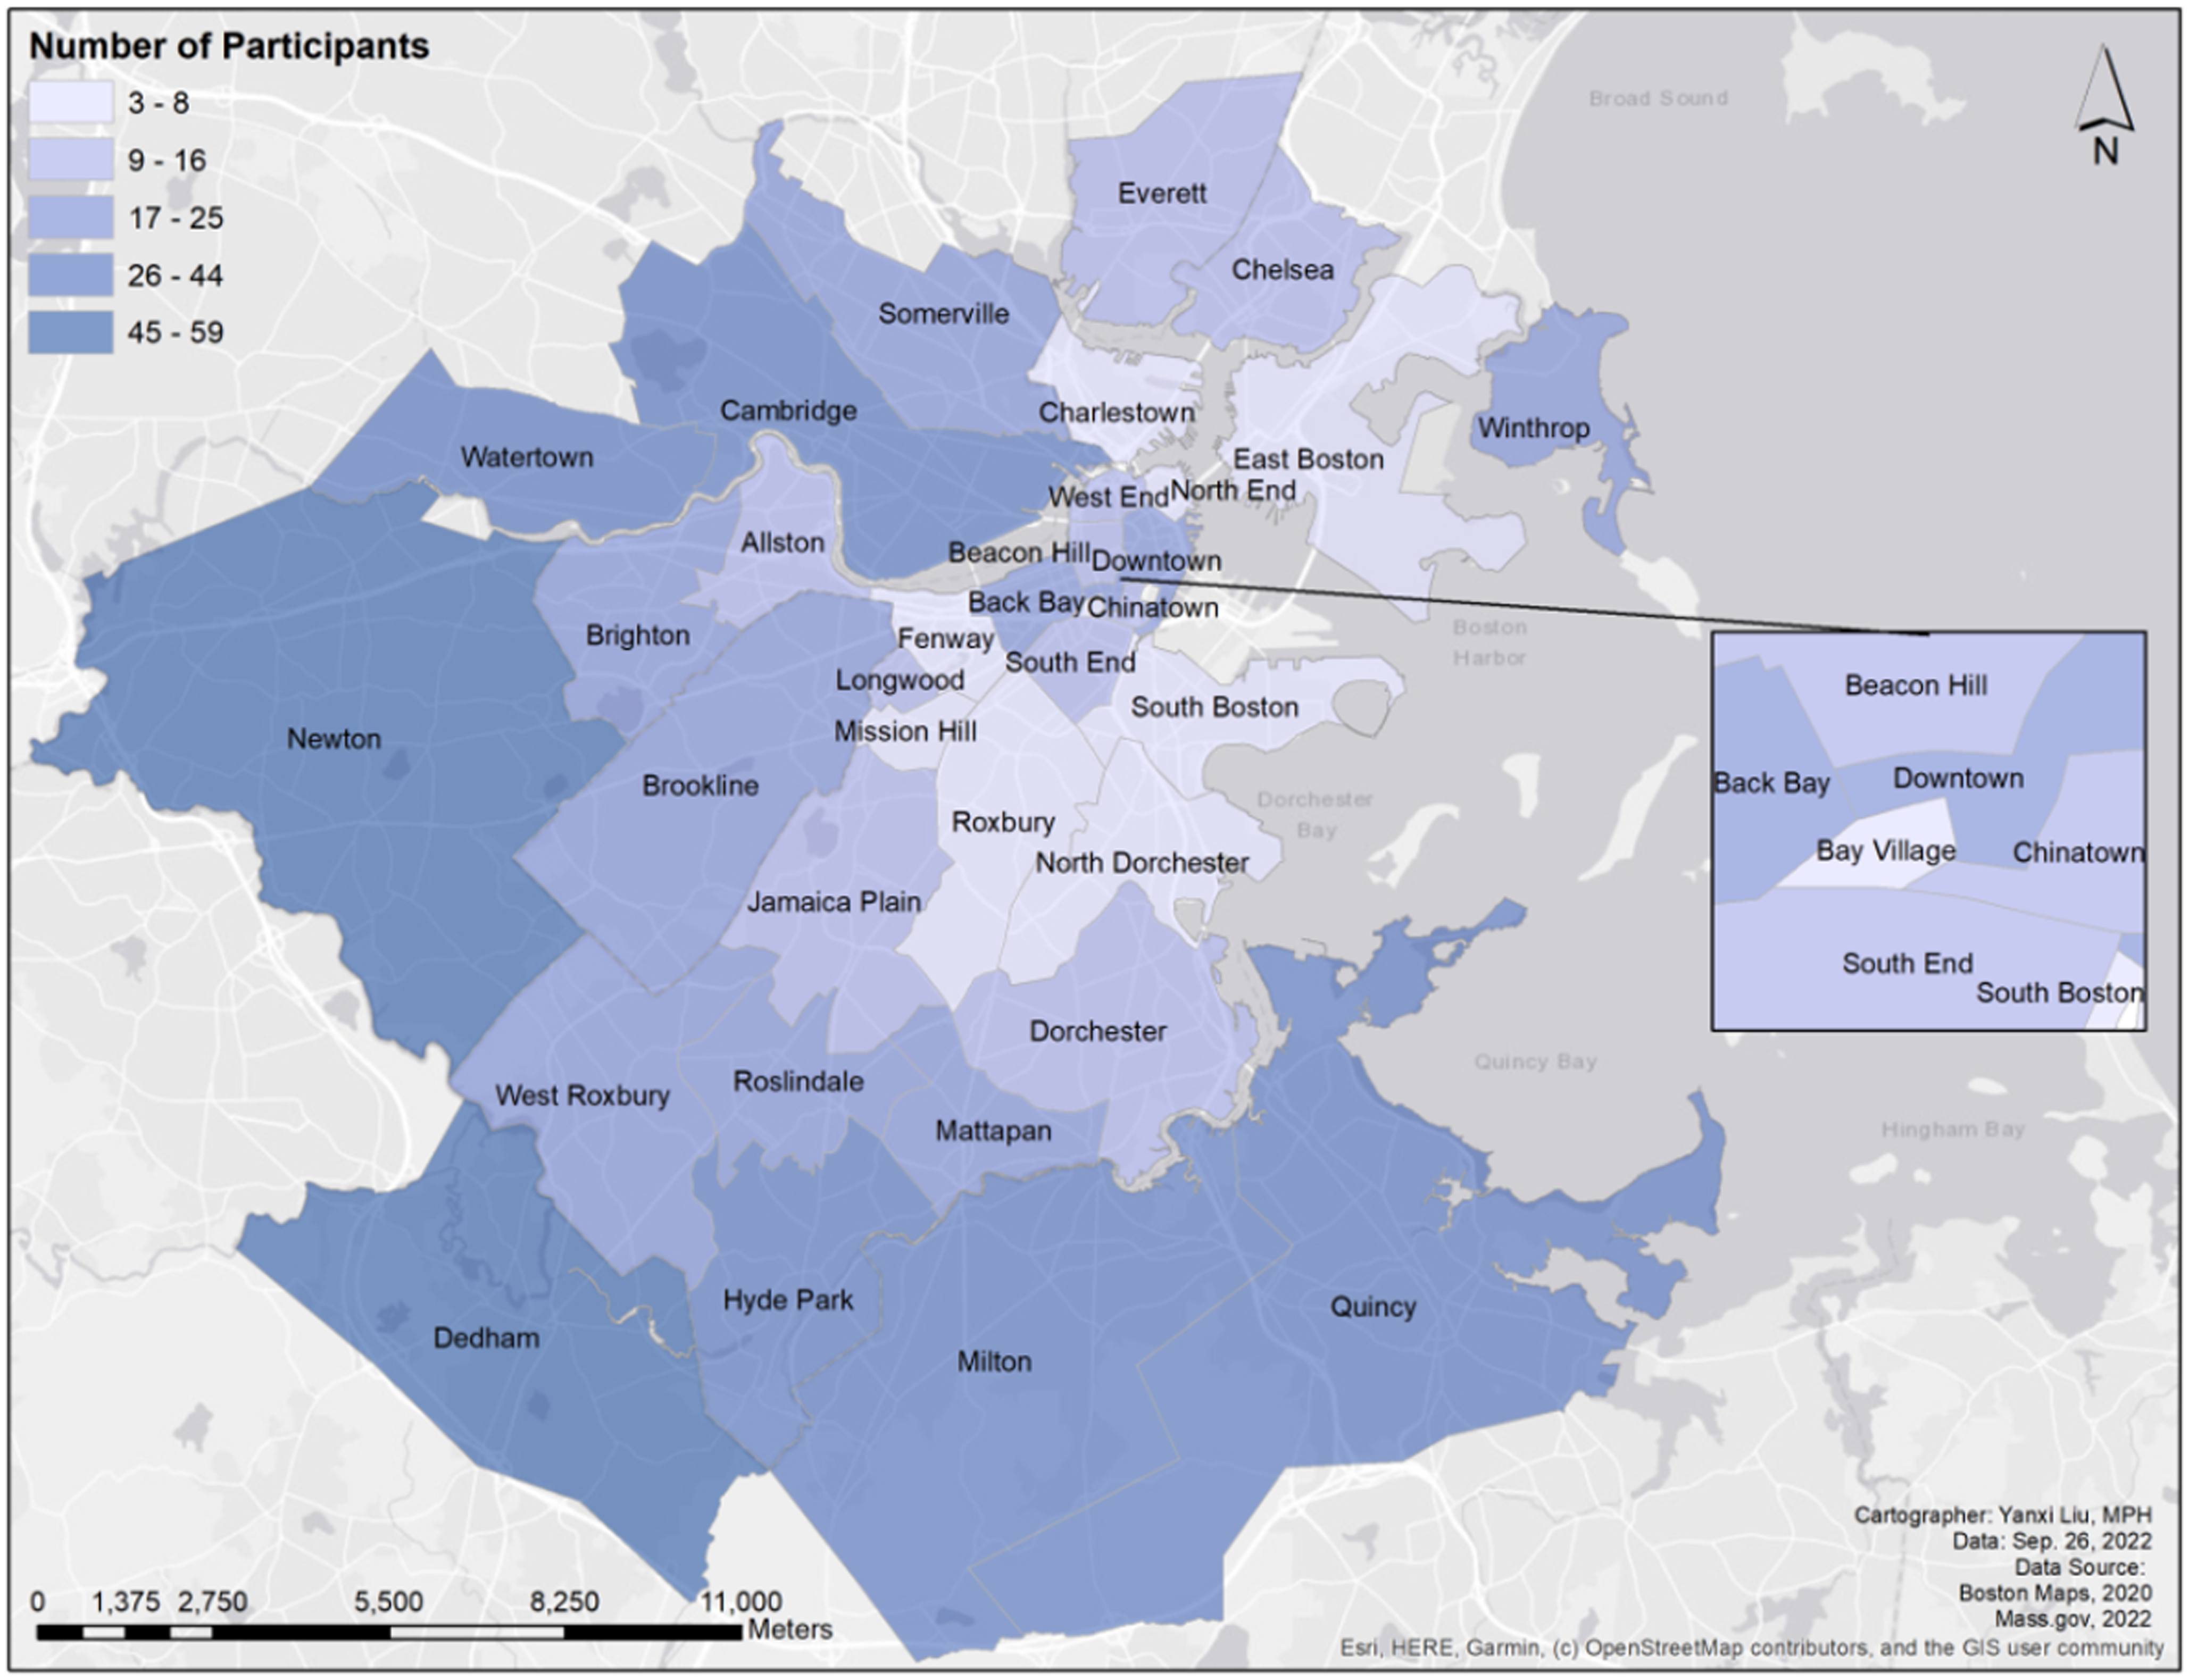
Neighborhoods chosen by participants as having no “Boston” accent whatsoever. Number of participants is color-coded. Color/participant number divisions were determined using Jenks Natural Breaks (Jenks, Reference Jenks1967).
Geographically, South Boston forms the perceptual epicenter of strong “Boston” accents. Not only is South Boston the darkest red neighborhood on the map, but the degrees of darkness of surrounding areas seem to radiate out from South Boston: from a slightly lighter West crescent of neighborhoods like East Boston, South End, and the Dorchesters, to a still lighter crescent from Chelsea to Roxbury to Quincy, another from Somerville to Hyde Park, and the outermost crescent of lightly colored suburban towns like Dedham and Newton.
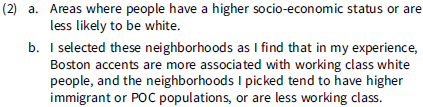
What prompted participants to choose these particular areas as the most strongly accented? The geographic patterning as well as the prompt to choose “neighborhoods” that are strongly accented raises the question of whether participants are simply choosing Boston neighborhoods as opposed to choosing areas where they believe residents use ENE features. This would be surprising given that the immediately preceding survey question asked them to describe “Boston” accent features, which should have primed them to base their choices on perceived dialect features. Participants also included areas that are not neighborhoods of Boston in their evaluation of strong accents like the adjacent city of Quincy. Furthermore, some participants (N = 25) commented on the motivations for their choices. A portion of participants reported that they based their choices of strongly accented areas on experience. For example, one participant said that they chose “based on the people I know personally and their accents,” while another said, “I have visited all of these neighborhoods and I think they have strong Boston accents.” Other participants mentioned that their perceptions of race and, particularly, class in each location played a role. These participants said things like “I mostly selected working-class neighborhoods,” “those are the more lower class, heavier Boston accents as opposed to like rich people Kennedy type accents,” or that the neighborhoods they chose were “generally white and with a lower socio-economic status.” This is consistent with previous findings and the BAI effect found in NYC (Babcock, Reference Babcock2014; Becker & Newlin-Lukowicz, Reference Becker and Newlin-Lukowicz2018; Browne & Stanford, Reference Browne and Stanford2018; Stanford, Reference Stanford2019). Unfortunately, the majority of participants did not provide insight into their motivations for their selection of areas on this task, but those who did suggest that participants made their choices based on personal experiences or beliefs about speech rather than simply choosing neighborhoods within the city and excluding those without.
The neighborhoods chosen by participants are somewhat aligned with attested associations of a strong Boston accent with Whiteness and a working-class identity. For example, Map 3 makes it clear that most participants do not associate the most central part of Boston (Downtown, Beacon Hill, Chinatown, Bay Village), peripheral cities and urban neighborhoods (Somerville, Brookline, Hyde Park), or the outer suburbs with particularly strong accents. These central neighborhoods also happen to be among the highest in median household income in the city. Beacon Hill, Chinatown, and Downtown all have median incomes greater than $102,000, while Bay Village rounds out at $76,652 (Statistical Atlas, 2018). Additionally, with the exception of Chinatown, these neighborhoods are also majority White. Bay Village, which is contiguous with Chinatown, is 62% White and 31% Asian, but all of the other neighborhoods have White populations above 80% (Statistical Atlas, 2018). Though the income and demographics of the more peripheral areas are mixed, four of the five that were least chosen in this task (Watertown, Newton, Dedham, and Milton) have incomes above $85,000 and White populations above 73%.
Of the five areas chosen as strongly accented, four of them (East Boston, North/South Dorchester, and South End) have a median household income between $54,854 and $69,855 (Statistical Atlas, 2018); they are neither the poorest nor the wealthiest neighborhoods.Footnote 8 If participants are basing their choices of which neighborhoods have strong accents on present-day class status, these choices make sense, except for South Boston. As previously discussed, South Boston has witnessed a host of demographic and economic changes over the past forty years. These days, it approaches the higher end of the income spectrum for the city ($89,069) (Statistical Atlas, 2018), and is considered by many to be gentrifying or becoming more economically diverse (Lima & Melnik, Reference Lima and Melnik2014; Maciag, Reference Maciag2015; Stanford, Reference Stanford2019). Some participants did comment that they were not choosing areas they perceived as gentrifying as having strong accents: “Because of gentrification, there are some areas I did not select [as having a strong accent] that I might have years ago.” However, other participants reported that, despite gentrification, their experience with speakers from these areas prevailed: “Some of these neighborhoods have been gentrified … but many of these are the areas my family (who have heavy Boston Accents) either grew up or live now.” No participant commented specifically on speech within South Boston in relation to gentrification, but whatever changes are happening there, ENE features are still perceived as prevalent. Though this may be indicative of Boston’s own Borough Accent Ideology, there is also empirical evidence that South Boston speakers may be more conservative speakers of ENE than elsewhere in Eastern New England (Stanford, Reference Stanford2019).
In general, participants commented on the perceived class associations of an area more frequently than its racial/ethnic demographics, though sometimes they commented on both. All five of the neighborhoods chosen as strongly accented are historically White ethnic enclaves. South Boston remains majority White (76.8%), though it now includes small Latinx (9.90%), Black (6.3%), and Asian (5.2%) populations as well (Statistical Atlas, 2018). However, today the other four neighborhoods are considered “majority minority” neighborhoods with White populations under 47%. Black and Latinx residents make up a large share of the population in both the South End (17.8% Latinx; 16.8% Black) and North Dorchester (16.30% Latinx; 22.2% Black) with Asian residents close behind in both (Statistical Atlas, 2018). Meanwhile, 46.2% of South Dorchester residents are Black and 56.2% of residents of East Boston are Latinx (Statistical Atlas, 2018). Some participants commented that they did not choose areas inhabited by residents of color or non-native English-speaking residents due to their perceived less frequent use of ENE accent features: “The accent is probably less common where more non-native English speakers have moved in,” and “I have rarely met other black Bostonians with really thick Boston accents.” Nonetheless, fairly diverse or “majority minority” neighborhoods were still chosen as strongly accented. There are a few possible explanations for participants perceiving areas inhabited by residents of color as strongly accented. One is that many participants, regardless of a few comments to the contrary, do not view ENE speech as ethnically stratified, potentially based on their personal experience. Another is that participants, though they might view speech as ethnically stratified, did not want to mention race as a possible factor influencing their decision. The time of data collection may be pertinent in this regard, as data was collected during July and August of 2020, following the murders of George Floyd and Breonna Taylor and associated demonstrations for racial justice, as well as an increase in the incidence and visibility of violent hate crimes toward people of Asian descent across the country. Therefore, participants might have been reluctant to call attention to any perceived racial differences. Finally, given that some residents view South Boston as gentrifying and neighborhoods like East Boston as no longer White ethnic enclaves but may still hold a strong association between particular areas and White working-class speech, it’s possible that some participants are choosing accented areas according to a BAI. Ultimately, these results show that, in general, participants did not discount areas that had become either more economically (South Boston), ethnically (East Boston, North/South Dorchester, South End), or linguistically diverse in recent decades when considering areas where residents have “Boston” accents. However, due to the voluntary nature by which participants were prompted to comment on why they made their choices (“Please add any additional comments you have about the neighborhood(s) you selected”), this result may not capture the full spectrum of participant motivations, and it does not definitively explain participant choices.
Given the changing demographics of Greater Boston neighborhoods like South Boston, it would be interesting to investigate whether there are any differences in accent evaluation among participants based on their background and social characteristics. For example, perhaps with increased ethnic diversity, immigration, and gentrification, the views of where people have strong accents is changing in such a way that younger residents or residents of color hold different views about who within the region has a strong accent and where they might live compared to older, White, Bostonians. In terms of participant comments, only seven participants commented on the city changing in reference to their choices for most strongly accented neighborhood. Five of these participants were White men under the age of 34 and the other two were women: a 20-year-old White woman and a 19-year-old Black woman. The latter participant said, “I don’t think many younger people have Boston accents. Growing up, my peers never had strong ones, and growing up around the Boston area, I really only heard the thick accents from teachers and older adults.” Despite these speakers commenting on changing neighborhoods, their choices were varied. In fact, only the Black woman whose comment is highlighted above did not choose South Boston as strongly accented. It’s also possible there are differences in participant behavior based on background that were not elucidated through comments.
To test whether participant background played a role in selecting neighborhoods perceived to have strong “Boston” accents, separate generalized linear models were run in R for the top four neighborhoods chosen (R Core Team, 2023). Since 84% of participants chose South Boston as the most strongly accented, it was not expected that participant background played a large role in this decision. Therefore, the remaining top three neighborhoods, each chosen by about 50% of participants, were examined with the expectation that background would play a greater role in their selections since there may have been more variation in who selected them.
Models were run using a step up strategy that tested the effect of the factors of Age (continuous), Gender (Male, Female), Ethnicity (White, POC), Education (High School, Some College, Bachelors, More than Bachelors), Region (Boston, Eastern MA, Other), and whether participants reported hearing a “Boston” accent internal to their community (Inside, Outside), indicating whether they perceive speech within their community as similar to their conception of a “Boston” accent. This factor will therefore be referred to as Community Dialect Perception (CDP). The best fit model for each neighborhood was chosen by comparing Akaike Information Criterion (AIC) for maximum likelihood estimation. Model results for three of the four neighborhoods are presented in Tables 3–5.
Best fit generalized linear model of participant social factors as predictors of choosing South Boston as a strongly accented neighborhood (AIC, 101.14)
Best fit generalized linear model of participant social factors as predictors of choosing North Dorchester as a strongly accented neighborhood (AIC, 145.34)
Best fit generalized linear model of participant social factors as predictors of choosing South Dorchester as a strongly accented neighborhood (AIC, 145.56)
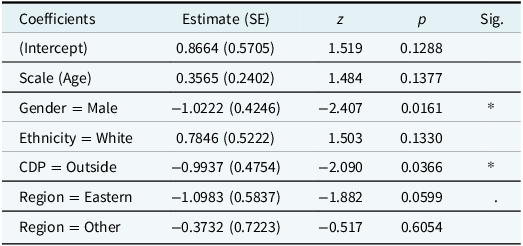
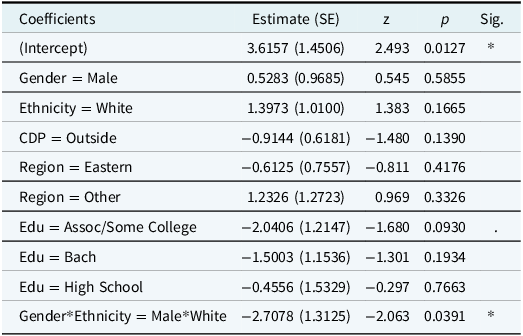
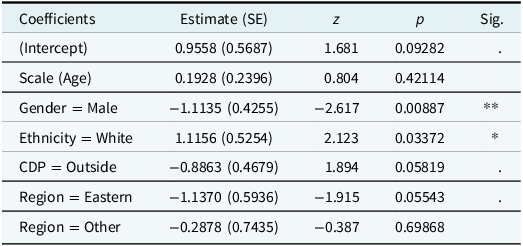
For South Boston (Table 3), chosen as having the strongest “Boston” accent, there is a significant interaction between Gender and Ethnicity (p = 0.0391) such that White male participants disfavor choosing South Boston as having a strong accent. For East Boston (chosen as having the second strongest “Boston” accent), no factors from participant background were found to have any effect (model not included). For North Dorchester (chosen as third strongest accent; Table 4), Gender (p = 0.00887) and Ethnicity (p = 0.03372) are significant, but with a different pattern than that for South Boston: here, male participants still disfavor North Dorchester as strongly accented while White speakers overall favor it. For South Dorchester (fourth strongest; Table 5), Gender (p = 0.0161) and CDP (p = 0.0366) are significant. The results indicate that, similar to what was found for North Dorchester, men disfavor choosing South Dorchester as a strongly accented neighborhood. Additionally, people who express linguistic distance from ENE by reporting hearing a “Boston” accent mostly outside of their community also disfavor choosing South Dorchester as strongly accented.
The first striking finding from these models is that Age does not emerge as a significant factor. If perceptions of where ENE is spoken are changing because neighborhood demographics are changing, one prediction would be that younger speakers perceive ENE features to be prevalent in neighborhoods that differ from those chosen by older speakers. The fact that no age differences are found could mean that perceptions are not changing over time, but most participants in this data sample are under the age of 36, so results should be representative of younger residents’ perceptions. In this case, comparing these findings to data that includes more older residents might reveal differences. The online format in which the survey was distributed may have contributed to a lack of participation by older adults.
Several models demonstrate an effect for Gender whereby male speakers seem to disfavor choosing South Boston and (North/South) Dorchester as having strong accents while women favor these choices. In the case of South Boston, this interacts with race, with White male participants being less favorable toward choosing South Boston. As previously mentioned, a handful of past studies have found differences in dialect perception based on aspects of participant background like gender, though their findings are conflicting and often tied to differential mobility among genders within a given society (Demirci Reference Demirci, Long and Preston2002; Jeon Reference Jeon2013; Al-Rojaie Reference Al-Rojaie2021). In this study, no major differences between men and women that would explain differences in perception were found. Male and female participants appear equivalent in terms of education, employment, and even evaluations of a “Boston” accent as positive, negative, or neutral.Footnote 9 Though a small portion (N = 5) of participants spent time outside of New England during adulthood, there are no clear gendered differences that indicate social or geographic mobility differences. It is possible that gender is masking some other aspect of social experience, like social network ties, but more information about participant networks in relation to use of ENE features would be needed to evaluate such a hypothesis.
Interesting results come from Ethnicity. White men are less likely to choose South Boston as a strongly accented neighborhood. Among the 18 speakers who did NOT choose South Boston, ten were White men, the majority of whom (N = 8) were between the ages of 35 and 88 (i.e. middle-aged to older). Unfortunately, these participants made few comments on their choices of strongly accented neighborhoods, except one participant who referenced “childhood memories” and another whose comment indicated that they had perhaps erroneously not chosen South Boston. Still, a hypothesis to test in future work is whether older White men or White men are more sensitive to the changing demographics of particular areas of Boston like South Boston (either through personal experience via social networks or from exposure to narratives surrounding changes) in a way that causes them to perceive use of ENE as shifting more so than other residents. Again, a comparable data set with more older participants is worth examining for that reason.
Additionally, White participants favor the choice of North Dorchester while participants of color (POC) do not. This could indicate POC’s sensitivity to increasing diversity in North Dorchester and a shift from the predominance of White working-class speakers in the area. Instead of choosing North Dorchester, POC seem to be choosing other predominantly middle-class White neighborhoods as strongly accented. For example, Black participants (N = 14) instead chose areas like Charlestown, the North End, and Somerville as strongly accented, though they also chose Chelsea, which is 64.3% Latinx and on the lower median income spectrum ($49,614). Otherwise, these neighborhoods are all majority White (69.9-88.2%) and are toward the higher end of the spectrum for median income (North End, $98,523; Charlestown, $94,579; Somerville, $78,673) (Statistical Atlas, 2018). Dorchester as a whole was historically Irish, Italian, and Jewish, but since the 1960s and 1970s has become one of Boston’s most diverse neighborhoods (Lima & Melnik, Reference Lima and Melnik2014; Watanabe & Lo, Reference Watanabe and Lo2019; Rios & Kelly, Reference Rios and Kelly2023). While it may be the case that Black participants do not view North Dorchester as strongly accented because it has moved away from a strong association with White working-class speakers, there are no participant comments that support this. Furthermore, that does not explain Black participants’ choices of East Boston and Chelsea, both majority Latinx, or South Dorchester, which is majority Black. Interestingly, though, no Black participant chose the historically Black or Asian neighborhoods of Roxbury and Chinatown as strongly accented. Similarly, Asian participants (N = 14) chose Back Bay (73.6% White; median income of $97,762) over North Dorchester, which also has a quickly growing Asian population (Watanabe & Lo, Reference Watanabe and Lo2019; Dumcious, Reference Dumcious2021; Ellin & Venkatesh, Reference Ellin and Venkatesh2021). Again, no participants commented on increasing diversity in North Dorchester. Still, a hypothesis to test going forward is whether groups perceive the individuals and communities in each of these areas differently and that impacts their perception of speech within them. Thus, even though rankings of individual areas as strongly accented may not make a difference on a larger scale, there do seem to be differences in how people rank areas based on their racial/ethnic background that are important. Of course, it is always possible that results would be different if South and North Dorchester were combined, as they may be mentally for many residents, though no resident commented on their split in the map task. Finally, this study only included one participant who identified as Latinx and seven as multi-racial. To further investigate the effect of participant background, a larger and more diverse sample of participants of color (balanced for age) would be necessary.
4.4. Less strong “Boston” accents and no accent
Map 4 highlights the outer edge of the Greater Boston Area, particularly northwest and southeast of the city center, as having accents that are not as strong as those areas chosen for Map 3. Interestingly, no more than 49 participants chose any single location for this question, indicating that participants had less strong collective feelings about which places have “light” accents. For this set of data, the difference between the highest neighborhood of Cambridge (N = 49) and the second highest of Newton (N = 44) was not found to be significant in a paired t-test (p > 0.05). Likewise, paired t-tests do not reveal significant differences among the top six neighborhoods.
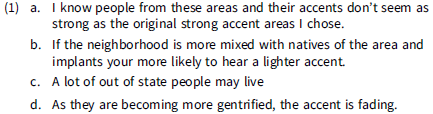
For this task, there were 17 comments. Participants describe these “lightly accented” areas as “further from the city’s heart” and “further out of Boston proper.” Though comments like these seem to reference spatial location rather than speech, some participants once again reported basing their choices on either personal experience (1a) or the perceived demographics of the area, mostly due to immigration and gentrification (1b–d).Footnote 10
These comments are particularly telling given that Cambridge, the top area in this category, is home to internationally recognized universities like Harvard and MIT. Many residents unsurprisingly associate these areas with non-locals, thus dampening the perceived “strength” of local accents in them. However, it is noteworthy that such places are not considered completely accent-free by many participants, owing to their perception of the continued presence of life-long residents.
On the other hand, less strong accents were linked with higher class status (or non-White status) by some participants (2).
Areas with high numbers of residents of color were not the top ones chosen on this task, but more affluent communities were. In terms of median household income, all of the top five municipalities (Cambridge, Newton, Brookline, Milton, and Watertown) have a median income above $83,000, and White populations greater than 62% (Statistical Atlas, 2018). Only one respondent in this section alludes to the fact that some of these areas may have their own accents, singling out Hyde Park. Since Hyde Park is 48.4% Black, it is possible that this participant is referring to African American English as in previous work (Babcock, Reference Babcock2014; Stanford, Reference Stanford2019), but their response does not make this clear. This is the only comment in the survey that references other ways of speaking within Boston that, according to this participant, fall outside of the “Boston” accent. Again, this participant may not directly reference race in their comment given the timing of the survey.
Finally, participants were asked to identify areas that did not have any Boston accent whatsoever. More people than in either of the other two map tasks (N = 7) did not choose any areas for this prompt. The results, as shown in Map 5, reinforce that participants overwhelmingly associate the peripheral suburbs and city center neighborhoods with lightly accented or unaccented speech.
The top five locations chosen as having no accent were Newton (N = 59), Dedham (N = 51), Milton (N = 44), Cambridge (N = 39), and Watertown (N = 37), several of which overlap with the lightly accented areas presented above. As in previous tasks, paired t-tests reveal no significant differences between the top five areas. For locations perceived as having no accent, there were a total of 22 comments that mostly echoed the sentiments expressed for not-so-strongly accented areas, though here there were fewer comments about non-native speakers of English or immigrants.
4.5. Who has a “Boston” accent?
At the end of the map identification task, participants were asked whether they associate the “Boston” accent with a particular type of person in terms of age, gender, race, neighborhood, education, occupation, attitude, or friendliness. This question was asked following the map tasks so that participants’ explicit thoughts on who speaks with a “Boston” accent would not prime their choice of locations on the maps and thus elicit a BAI. Consistent with Stanford (Reference Stanford2019) and the comments made on each map above, some portion of respondents associated a “Boston” accent with White ethnicity (41%), particularly Irish, Italian, or Polish ancestry, though two participants mentioned that it’s not limited to White ethnicity and two more described it as “primarily” or “mostly” associated with White residents. As one 32-year-old White female participant put it, “white people have it stronger but blacks have it too.” This indicates that at least 41% of participants view ENE as racially stratified, which supports the effect of a BAI in these results. This might explain why many participants chose historically White areas as strongly accented despite increased ethnic diversity. Once again, the strength of this effect could be lessened by the timing of the survey during a period of visible racial tension in the USA, potentially causing some participants to be reluctant to mention racial stratification.
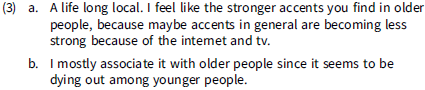
It was also associated with middle age or older (33%), with many participants mentioning specific generations like “boomer/gen-X.” Two participants commented in response to this question that many city accents seem to be dying out.
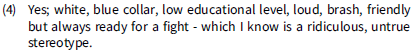
29% of participants mentioned socioeconomic status in response to this question in some way. Typically, they associated an accent with middle or working class or lower income. The phrase “blue collar” was used by 12 participants. Some also mentioned specific occupations like trade worker, fire fighter, or police officer. Relatedly, education was mentioned by 14% of participants who usually specified that a person with a “Boston” accent would be “less/un- educated,” “never went to college,” or “local college educated or less.”Footnote 11 Though the majority of participants did not comment on a class association, about a third of them directly associated ENE with working-class status, consistent with a BAI for Boston. This perhaps explains the inclusion of gentrifying South Boston in the strongly accented category due to its strong association with working-class Boston culture, though empirical evidence also confirms the conservation of traditional ENE features there.
These general results can be summed up by one 24-year-old White female participant’s description of someone in their “mid 40s white-probably irish or italian- construction worker with a dunkin coffee in his hand.” This image is also echoed in previous work (Hartley, Reference Hartley2005; Babcock, Reference Babcock2014; Browne & Stanford, Reference Browne and Stanford2018; Stanford, Reference Stanford2019), and as previously noted, is reinforced by cultural stereotypes in commercials, comedy sketches, television, and film. Only one participant overtly commented on this image being a stereotype.
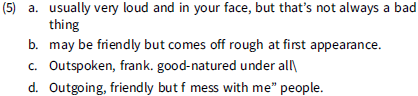
Stereotypical personal attributes of “Boston” accented speakers were commented on even less frequently, though some participants did note attributes like bluntness or straightforwardness, outgoing-ness or outspoken-ness, which was sometimes viewed both as rude and as friendly. Other characteristics mentioned more than once were “tough” or “rough,” “down to earth,” affinity for local sports teams, and “loud.” The mention of these characteristics is noteworthy given that 26% of participants associated a “Boston” accent with male gender, and it is well known that local, working-class speech is often tied up with ideas about working-class masculinity and the traits a given society bestows it (Trudgill, Reference Trudgill1974; Eckert, Reference Eckert2000, Reference Eckert, Auer and Schmidt2010; Niedzielski & Preston, Reference Niedzielski and Preston2010:191–6). Even though some of these characteristics seem negative, participants did not always feel they were so, or felt that a “Boston” accented speaker might appear one way on the surface while really being another deep down (e.g. “friendly”), which may indicate covert prestige, and mirrors Hartley’s (Reference Hartley2005) finding that people rate “working-class” Boston stereotyped speech as incorrect but pleasant. Again, it was not always clear whether the comment indicated a negative evaluation on the part of the participant or opinions external to the participant or community.
As for where the “Boston” accent is localized, despite having recently finished the map task, 19% of participants once again mentioned the area or type of area where they would expect to find a “Boston” accent in response to this question, doubling down on neighborhoods like “Southie” and areas like “inner Boston,” the “inner city,” or “the city itself” as opposed to the “suburbs,” further supporting the associations between the stereotypical “Boston” speaker and these areas.
Among participants of color, 6/14 Black participants and 6/14 Asian participants associated the accent with Whiteness. For Black participants, this was the primary attribute they commented on (3/14 said “older”; 1/14 “male”), while Asian participants also commented on working-class status (5/14), gender (4/14 “male”) and age (4/14 “older”). In either case, a sizeable portion of both Black and Asian participants associates ENE with Whiteness at around the same rate as the general participant pool (43%).
Consequently, this image of the White working-class heavily accented Bostonian indicates that some participants do see accent as gender, class, and ethnically stratified.
It’s important to note that no attribute was mentioned by the majority of participants. In fact, 19% of participants reported that they either did not associate any particular attributes with a “Boston” accented speaker or left this free response question blank, but, again, it is unclear what effect the timing of the survey had on participants’ willingness to mention race as a differentiating factor. Some participants also commented that simply growing up in Boston or having parents with the accent was enough to acquire it. This assertion was often based on experiential attitudes:
Models examining the relationship between the characteristics participants attributed to Boston speakers and participant choices of strongly accented areas revealed no significant results. In other words, models found no relationship between, for example, participants who said that a typical Boston speaker would be White and participants who chose South Boston, or other historically White working-class areas, as a strongly accented. Since participants were not required to respond to this question or to respond specifically to the question of a “Boston” speaker’s race, it’s possible that the lack of these results is due to gaps in the data collected.
Revealingly, few participants questioned the use of the term “Boston” accent to refer to a wider dialect area. There was only the one participant who commented on other ways of speaking in Hyde Park. Two comments were recorded that allude to other areas not pictured on the map also possibly containing speakers with strong accents (Revere and the North Shore). Though an anonymous abstract reviewer suggests that the South Shore (known as the “Irish Riviera”) might also evoke strong evaluations of accented speech, this area was not mentioned in this sample of residents. Finally, only one participant commented on the so-called “Boston” accent being heard throughout Massachusetts, in cities like Springfield and Worcester as well.
5. Conclusion
This study in perceptual dialectology confirms that residents of the Greater Boston Area perceive the neighborhood of South Boston to be the geographic epicenter of the “Boston” accent. Since study participants focused on non-rhoticity as the primary feature that makes a “Boston” accent, this finding matches recent production results showing that traditional ENE features like non-rhotic speech are becoming increasingly restricted to speakers in South Boston (Stanford, Reference Stanford2019). That South Boston is perceptually the geographic epicenter of “Boston” accented speech is seen not only in the fact that participants chose it most frequently as a strongly accented neighborhood, but also in the fact that participant perceptions of the relative strength of accents, from strong to non-existent, seem to radiate outward from it, putting South Boston in opposition to both center city neighborhoods as well as the outermost suburban towns. Given this perception of the geographic distribution of accents, some residents consider South Boston to be the true “heart of the city.” While the possibility that participants simply identified Boston neighborhoods against surrounding cities and towns cannot be completely ruled out, participants had been asked directly before the map task to describe the linguistic features of a “Boston” accent, which should have focused their attention on speech in designating areas as strongly accented or not. Some participants also referenced their experiences with individual and community speech in particular areas as motivating their choices on the map task.
This study also found that higher income majority White inner city neighborhoods and outer suburbs are perceived as lightly or unaccented, while the top areas chosen as most strongly accented correspond to city neighborhoods that have historically been White ethnic working-class enclaves, such as South and East Boston, despite changes to their demographics in recent decades from gentrification (South Boston) to ethnic diversification (North/South Dorchester) to reaching “majority minority” status (East Boston). Though some participants did base their choice of strongly accented areas on their personal experience as Boston area locals, others indicated that their choices were driven by their social class and racial associations with certain locations. Regarding class, if participants chose strongly accented neighborhoods based on their associations with working-class culture, their overall choices were in alignment with the current reality of the top five areas chosen (based on average neighborhood household income), aside from South Boston, which has seen an increase in average household income in recent decades and is widely considered to be gentrifying. Though some participants said that they chose White working-class areas as strongly accented, not all of the top five neighborhoods chosen were predominantly White. For example, neighborhoods like South Dorchester, which is majority Black, East Boston, which is majority Latinx, and North Dorchester, which has diversified in recent decades, still ranked highly as strongly accented neighborhoods. While this could indicate that ENE features are not perceived to be ethnically stratified, many participants did associate a “Boston” accent with White working-class (male) speakers, which suggests the presence of a BAI for Greater Boston. This could mean that the historical associations between particular areas, social class, ethnicity, and speech may be particularly strong for some Boston neighborhoods (Johnstone, Reference Johnstone, Auer and Schmidt2010; Becker & Newlin-Lukowicz, Reference Becker and Newlin-Lukowicz2018; Buccitelli, Reference Buccitelli2016; Gasquet-Cyrus, Reference Gasquet-Cyrus2016). Laferriere’s (Reference Laferriere1979) work predicts that this association should be stronger for historically Irish vs. Italian American neighborhoods, but both historically Irish (South Boston) and Italian (East Boston) neighborhoods were found among the top choices (with the historically Italian North End coming in seventh).
This study did find a difference in how participants of different ethnic backgrounds ranked strongly accented areas. For example, older White men were less likely to consider South Boston as strongly accented. Additionally, Black and Asian participants had different perceptions of speech in particular city neighborhoods, with neither viewing North Dorchester as strongly accented compared to White speakers. This raises the possibility that different groups are sensitive to or aware of different demographic changes around the city and how they might affect speech.
One possibility this work began with was that the term “Boston” accent might bias participants from all backgrounds toward only considering the speech of White working-class residents in their choices, as Browne & Stanford (Reference Browne and Stanford2018) suggest. This term clearly did not evoke an image of the affluent Kennedy-style Bostonian for participants, contrary to previous findings (Hartley, Reference Hartley2005). Again, the areas chosen as “Boston” accented were historically White working-class neighborhoods, so the influence of this use of terminology cannot be ruled out. Thus, it’s possible that the term “Boston” accent biased participants toward picturing a stereotypical White working-class speaker when asked about speech in South Boston or East Boston, and they based their localization of accented speakers on that. Nonetheless, there were many participants who indicated that they did not think of a particular type of person when imagining a “Boston” accent, and commented that many types of person could speak that way. To better understand this complex situation, a future study might use a methodology frequent in perceptual dialectology (Gasquet-Cyrus, Reference Gasquet-Cyrus2016; Lonergan, Reference Lonergan2016), which asks participants to identify areas of Greater Boston that they believe are linguistically distinct and use questionnaires to describe those differences. In Lonergan’s study, most participants marked between two and six distinct urban dialects within Dublin, while in Gasquet-Cyrus’s, three distinct accents associated with different neighborhoods of Marseille emerged, and a fourth emerging accent was identifiable based on participant commentary. A future study of this nature could take advantage of digital innovations in the study of perceptual dialectology, such as the Folk Linguistic Online Mapping program (FLOM).
In conclusion, these findings support Stanford’s (Reference Stanford2019) observations that residents of New England localize a strong “Boston” accent to South Boston and other historically White ethnic, working-class neighborhoods, as well as previous research on the relationship between social class, urban space, and perceptions of speech (Becker & Newlin-Lukowicz, Reference Becker and Newlin-Lukowicz2018; Gasquet-Cyrus, Reference Gasquet-Cyrus2016; Lonergan, Reference Lonergan2016). They also demonstrate the importance of eliciting folk perceptions from residents of diverse backgrounds in order to paint a more complete picture of language attitudes in a given community. Following in the footsteps of these studies, further fieldwork on production and folk perceptions of speech in Boston neighborhoods, particularly in communities of color (like that of Chang & Dionne, Reference Chang and Dionne2022, and Nesbitt et al., 2023), is needed to evaluate whether participant perceptions of speech by location maps onto actual differences in speech between neighborhoods. For example, Stanford (Reference Stanford2019) finds that South Boston speakers are more conservative when it comes to traditional ENE features like non-rhoticity and that, for mostly White speakers, the prevalence of ENE features like non-rhoticity in New England can be calculated based on distance from South Boston. However, Nesbitt et al. (2023) does not find this same relationship between ENE features and distance from Boston among Black speakers. Thus, a deeper examination and description of speech and folk attitudes in Boston’s diverse and changing communities is essential to understanding the linguistic landscape of the city and surrounding area. In contribution to this goal, it is hoped that this study can provide a context for future studies of language variation and attitudes within the Greater Boston Area and beyond, particularly with regard to how communities of color interact with dominant practices and ideologies.
Acknowledgements
This project greatly benefited from the work of undergraduate research assistants Jiahui Zhang (Wellesley College 2023) and Elizabeth Chen (Wellesley College 2024), financial support from the Knapp Center Summer Social Science Research Program at Wellesley College, assistance with cartography from Dani Brown and Yanxi Lui, assistance with statistical analysis from Cassandra Pattanayak, and comments from the audience of the American Dialect Society’s 2023 Annual Conference poster session (Denver, CO, January 5, 2023) as well as from two anonymous reviewers.
Competing interests
The author declares none.


 Open access