Within the colon, there is a dynamic interplay between the resident microbiota, the metabolites resulting from fermentation, and colonic mucosal cells( Reference Arasaradnam, Pharaoh and Williams 1 ). Modulating the substrates available for the colonic microbiota can influence the amount and type of metabolites produced. In particular, dietary interventions with prebiotics allow modifying the ratio of saccharolytic:proteolytic fermentation. At present, it is unclear whether these changes in fermentation are involved in the health benefits that are attributed to prebiotics. A potential health benefit is a reduction of the risk of developing colorectal cancer (CRC). Several animal studies investigating the effects of prebiotics on the development of CRC risk have shown promising results. A study by Reddy( Reference Reddy 2 ) was the first to show that inulin and fructo-oligosaccharides inhibit the development of pre-neoplastic lesions or aberrant crypt foci in the colon of rats treated with a colon carcinogen, which was confirmed by other studies( Reference Gourineni, Verghese and Boateng 3 – Reference Verghese, Rao and Chawan 5 ). Also in mice, the occurrence of aberrant crypt foci was reduced after an intervention with inulin and fructo-oligosaccharides compared with the control( Reference Buddington, Donahoo and Buddington 6 ). In pigs, a wheat fraction rich in arabinoxylans lowered DNA damage in colonocytes, as measured with the comet assay( Reference Belobrajdic, Bird and Conlon 7 ). In contrast, Lu et al. ( Reference Lu, Gibson and Muir 8 ) found that arabinoxylan supplementation to rats resulted in an increased mitotic index in the colon. Finally, arabinoxylan-oligosaccharides (AXOS) reduced aberrant crypt foci and mucin-depleted foci in carcinogen-treated rats( Reference Femia, Salvadori and Broekaert 9 ).
In human studies, the comet assay is often used to measure faecal water genotoxicity as a non-invasive early biomarker of CRC risk( Reference Wasson, Kelvey-Martin and Downes 10 ). For instance, two intervention studies in healthy human subjects with the soluble fibres polydextrose (PDX) and konjac glucomannan, respectively, have found reduced faecal water genotoxicity( Reference Costabile, Fava and Roytio 11 , Reference Wu, Cheng and Chen 12 ), while an intervention study with galacto-oligosaccharides has observed no effect on faecal water genotoxicity( Reference Walton, van den Heuvel and Kosters 13 ). When a synbiotic preparation (comprising oligofructose-enriched inulin, Lactobacillus rhamnosus GG and Bifidobacterium lactis Bb12) was administered to polypectomised and colon cancer patients for 6 months, DNA damage was reduced in the colonic mucosa of the polypectomised patients and epithelial barrier function was improved in these patients, whereas the number of aberrant crypt foci was not significantly reduced. Also, cell proliferation and apoptosis, secondary endpoints for CRC risk, did not change( Reference Rafter, Bennett and Caderni 14 ). However, none of these studies correlated the impact of prebiotic intervention on fermentation with the outcome variables measured as indicators of CRC risk.
In the present study, we performed a dietary intervention with wheat bran extract (WBE) in healthy subjects, and evaluated its effects on faecal water cytotoxicity and genotoxicity as markers of CRC risk. Colonic fermentation was investigated using a metabolomics approach, and correlated with the markers of CRC risk by applying cluster analysis.
Subjects and methods
Study population
Based on a pilot study in nine subjects, a sample size of eighteen healthy subjects was expected to provide an 80 % chance for detecting a difference of 15 (sd 10·05) % in faecal water genotoxicity (the primary outcome variable of the present study) between two dietary interventions at the 5 % level of significance. A total of twenty healthy subjects with a regular dietary pattern (three meals per d, at least 5 d/week) started the study. Exclusion criteria were abdominal surgery in the past (except from appendectomy) and history of liver or kidney failure, or chronic gastrointestinal conditions such as inflammatory bowel disease and irritable bowel syndrome. Also, subjects who consulted a dietitian in the 6-week period before the start of the trial or who were on a low-energy or vegetarian diet were excluded. Female subjects were excluded if they were pregnant or lactating. All subjects were free of medication influencing the gut transit or intestinal microbiota for at least 14 d and free of antibiotics for at least 1 month before the start of the trial. Intake of pre- and probiotics was prohibited during the complete study period. At the time of inclusion, subjects were informed about pre- and probiotics and the foods containing them. Participants were recruited by advertisement among the students of the KU Leuven and among the employees of the University Hospitals Leuven. All the twenty subjects (seventeen women and three men; age range 19–44 years; BMI range 18·7–24·3 kg/m2) completed the study. The study was conducted according to the guidelines laid down in the Declaration of Helsinki, and was approved by the Ethics Committee of the University Hospitals Leuven. The trial was registered at ClinicalTrial.gov (clinical trial no. NCT01656499). All subjects gave their written informed consent before participation.
Study design
In the present study, a randomised, placebo-controlled, double-blind, cross-over design was used. After screening and inclusion, all eligible subjects started with a 1-week run-in period followed by two 3-week intervention periods. Both intervention periods were separated by a 3-week washout period. Subjects were asked to maintain their normal diet throughout the entire study. During the first intervention period, ten subjects received two times 5 g WBE/d, while the other ten received two times 5 g maltodextrin/d (placebo). During the second intervention period, subjects switched from supplementation with WBE to maltodextrin or vice versa. Both WBE and placebo were provided in similar unlabelled containers, and subjects were asked to return all containers after the intervention. Subjects were randomised by an independent researcher not involved in the study using online randomisation software (www.randomizer.org).
During the study, participants made four visits to the Laboratory of Absorption & Digestion of the KU Leuven. At day 5 of the run-in period, subjects came to the laboratory after an overnight fast, where they received a 15N-labelled test meal. After ingesting the test meal, subjects collected urine for 48 h and faeces for 72 h. The test was conducted and samples were collected as described previously( Reference Windey, De P and Louat 15 ). The same test was repeated at the end of the first intervention period (day 26), the washout period (day 47) and the second intervention period (day 68). To determine whether no changes in dietary intake had occurred throughout the entire study, subjects also completed a 7 d dietary record during the run-in period and the last week of both intervention periods. They were asked to weigh all ingested foods and beverages and to take note of the type and brand of all ingested products. The compliance of the volunteers was estimated by asking them to return all containers of the study products (empty and not empty) at the end of each intervention period.
Study endpoints
The primary outcome variable of the present study was faecal water genotoxicity. Secondary outcome variables included faecal water cytotoxicity, urinary p-cresol excretion, dietary composition, energy need and intake, changes in metabolite profiles, colonic NH3 handling and microbiota composition.
Study products
WBE was produced from wheat bran by Fugeia NV, as described by Swennen et al. ( Reference Swennen, CM and GCJE 16 ). WBE was analysed for the content of AXOS, the average degree of polymerisation (avDP), the arabinose:xylose ratio, bound ferulic and glucuronic acids, glucose as part of poly/oligosaccharides, galactose as part of poly/oligosaccharides, free monosaccharides, moisture, protein and ash by analytical methods described previously( Reference Wu, Cheng and Chen 12 ). Lipid content and the presence of mesophilic bacteria, yeast, fungi and Salmonella were determined according to methods ISO 1443, ISO 4833, ISO 7954, ISO 7954 and ISO 5679/cor1, respectively. The presence of the heavy metals As, Cd, Pb and Hg was determined according to a Eurofins method based on ISO 17 294-1/2. WBE used in this study contained 74·7 % of AXOS, with an avDP of five and an arabinose:xylose ratio of 0·22.
Maltodextrin (Paselli MD6; AVEBE B.A. Food), an oligosaccharide that is obtained by enzymatic hydrolysis of potato starch and that is completely digestible in the human small intestine, was used as placebo.
Handling of the samples
Upon delivery, 10 g of each faecal sample were aliquoted for analysis of volatile organic compounds and denaturing gradient gel electrophoresis (DGGE). For the isolation of faecal water, 20 g of faeces were centrifuged at 50 000 g for 2 h at 4°C. The remaining portions of the faecal samples were weighed, combined and homogenised. Aliquots of these homogenised samples were lyophilised. Both wet and dry weights were measured to calculate faecal dry weight (expressed as a percentage). Faecal samples, faecal water and lyophilised faecal material were stored at − 20°C.
Upon delivery of the urine samples, the volume of each collection was measured and an aliquot was stored at − 20°C for further analysis.
Analytical procedures
Analysis of dietary intake
To assess actual dietary intake, 7 d dietary records were analysed using an online food calculator ‘Nubel’ (www.nubel.be) and information on standardised quantification of food products( Reference Gezondheidsraad 17 ). Intakes of placebo and WBE were not considered in the analysis. All dietary records were processed by the same person. Analyses yielded information on average daily energy intake (kcal) and intake of carbohydrates (g), proteins (g), fat (g), fibre (g) and Ca (mg).
Analysis of urinary creatinine, urea and p-cresol
To assess completeness of urine collections, the ratio of observed:calculated creatinine excretion was calculated as proposed by Knuiman et al. ( Reference Knuiman, Hautvast and van der Heyden 18 ). Collections with a ratio lower than 0·6 were considered incomplete and the corresponding data were omitted from statistical analysis. Urinary urea concentration was measured as a biomarker for protein intake. Urinary creatinine and urea concentrations were quantified using standard laboratory techniques. Total p-cresol concentration is a measure for colonic protein fermentation and was measured in urine samples using GC–MS, as described previously( Reference de Loor, Bammens and Evenepoel 19 ).
Analysis of total nitrogen content and 15N enrichment in the urine and faeces and 3H in lyophilised faeces
Total N content and 15N enrichment levels in the urine and faeces and [3H] polyethylene glycol content in the faeces were measured according to the method described by Windey et al. ( Reference Windey, De P and Louat 15 ). The 3H content in the faecal samples was used to correct 15N enrichment data for gastrointestinal transit by dividing the cumulative percentage of the administered dose of 15N in the faecal samples recovered over 72 h by the cumulative percentage of the administered dose of 3H recovered over 72 h.
Analysis of metabolite profiles in the faeces
Metabolite profiles were analysed in each faecal sample using GC–MS according to a method described by De Preter et al. ( Reference De Preter, Van Staeyen and Esser 20 ). Relative indices of all compounds were calculated using 2-ethylbutyric acid as the internal standard. A number of metabolites, selected as markers for saccharolytic fermentation (SCFA: acetic acid, propionic acid and butyric acid) and proteolytic fermentation (branched-chain fatty acids (BCFA): isobutyric acid and isovaleric acid, dimethyl sulphide and p-cresol), were absolutely quantified using 2-ethylbutyric acid as the internal standard, whereas p-cresol was quantified using 2,6-dimethylphenol and dimethyl sulphide using diethyl sulphide.
Analysis of the gut microbiota composition using denaturing gradient gel electrophoresis
Total bacterial DNA was extracted from the faecal samples using a slightly modified version of the method proposed by Pitcher et al. ( Reference Joossens, Huys and Van 21 , Reference Pitcher, Beatty and Cummings 22 ). Next, DGGE profiling of V3-16S rRNA amplicons obtained using universal bacterial PCR primers and digital analysis of the resulting DGGE profiles were performed as described elsewhere( Reference Joossens, Huys and Van 21 ). DGGE profiles were normalised using reference lanes included in each run. Different bands were allocated to arbitrarily generated band classes that were designated based on their relative position in the profile compared with the standard reference used. DGGE bands that were significantly different between the intervention periods were purified by excision from the gel. DNA was eluted from the excised gel slices by heating the gel in 15 μl Tris–EDTA buffer for 10 min at 65°C. The eluted DNA solution was reamplified and reanalysed by DGGE using an adjusted gradient. This process was repeated until one single band was obtained, which was again excised and the DNA eluted. To ensure that the correct band was sequenced, this DNA was checked against the original sample. It was then amplified using universal primers F357 (without GC clamp) and R518 and purified by adding 4 μl ExoSAP-IT to 10 μl DNA solution. After heating for 15 min at 37°C and 15 min at 80°C, the mixture was cooled to 4°C and the DNA was used for sequencing PCR from both directions with primers F357 (without GC clamp) and R518, respectively. Sequencing was performed using an ABI Prism 3130 Genetic Analyzer (Applied Biosystems).
The obtained DNA sequences were assembled using Vector NTI Advance 11.5, and their homologies were compared for taxonomic positioning in the GenBank DNA database using the BLAST algorithm.
Real-time PCR
Significant differences in the presence or intensity of band classes that were taxonomically assigned to specific bacterial species after DGGE analysis were confirmed by real-time PCR (RT-PCR). Bacterial DNA was quantified using the 7500 Fast Real-Time PCR System (Applied Biosystems) in the fast cycling 7500 mode. A species-specific primer set and probe were developed, targeting the 16S rRNA gene of Bifidobacterium adolescentis. The forward and reverse primers were, respectively, 5′-CGAAGGGCTTGCTCCCAGT-3′ and 5′-TGCTCCAGTTGGATGCATGT-3′, and the probe was 6-carboxyfluorescein (6FAM)-CCTCTCAGGCCGGCTACCCAT-black berry quencher (BBQ), with 6FAM as the fluorescent reporter at the 5′ end and BBQ as the quencher at the 3′ end. A BLAST search was used to ensure specificity of the primer set and probe. Primers and a probe were designed to quantify total bacteria( Reference Byun, Nadkarni and Chhour 23 ). The forward and reverse primers were, respectively, 5′-TGGAGCATGTGGTTTAATTCGA-3′ and 5′-TGCGGGACTTAACCCAACA-3′, and the probe was 6FAM-CACGACCTGACGACATCCATGCA-BBQ, with 6FAM as the fluorescent reporter at the 5′ end and BBQ as the quencher at the 3′ end. All RT-PCR amplifications were performed in a total volume of 20 μl per reaction mixture containing 4 μl of the appropriately diluted DNA, 10 μl Taqman® Universal PCR Master Mix, 300 nm of each primer and 150 nmof probe. The conditions for amplification and detection included one cycle at 95°C for 20 min followed by forty-five cycles of amplification (3 s at 95°C and 30 s at 60°C). In RT-PCR analysis, a standard curve was constructed by serial dilutions of genomic DNA from a control strain (B. adolescentis LMG 10 502T), for which the number of bacteria was determined by plate counting. For this purpose, LMG 10 502T was cultured on reinforced clostridial medium (OXOID CM151) at 37°C under anaerobic conditions. For quantification of total bacteria, a standard curve was constructed by serial dilutions of genomic DNA from Desulfovibrio vulgaris LMG 7563. This DNA was prepared from cultures in which the bacterial concentration was determined by plate counting on Belgian Coordinated Collection of Microorganisms/Laboratory of Microbiology–Ugent (BCCM/LMG) bacterial medium 104 without FeSO4 at 37°C under anaerobic conditions. All quantifications were performed in triplicate and verified for a maximum variation of < 0·5 C t. The mean C t was used to calculate the bacterial counts (colony-forming units/g faeces). Bacterial counts below the detection limit of 6310 colony-forming units/g faeces may not in all cases be truly zero. Therefore, these samples were given a value corresponding to the detection limit of the RT-PCR assay. Bacterial counts were expressed as log10 colony-forming units/g faecal wet weight.
Cell culture
Human colonic adenocarcinoma HT-29 cells were obtained from the ECACC (European Collection of Cell Cultures) and grown in Roswell Park Memorial Institute-1640 medium (Lonza Group Limited) with 10 % faecal calf serum (Lonza Group Limited) and antibiotics (5 μg gentamicin sulphate/ml; Lonza Group Limited) at 37°C and 5 % CO2.
Cytotoxicity of faecal water: WST-1 assay
Cytotoxicity of faecal water was measured on HT-29 cells using a colorimetric cell viability assay based on the cleavage of a tetrazolium salt in the mitochondria of living cells to produce a coloured formazan derivative, as described previously( Reference Windey, De P and Louat 15 ). Briefly, after growing for 24 h, HT-29 cells were exposed to serial dilutions of faecal water samples (1/4–1/1024) for 72 h. Cell viability was checked by adding 10 μl of the tetrazolium salt, 4-[3-[4-iodophenyl]-2-4-(4-nitrophenyl)-2H-5-tetrazolio-1,3-benzene disulfonate] (WST-1; Roche Diagnostics), to the cells. Triton X-100 (0·5 %) was used as the positive control and medium as the negative control. After 4 h, absorbance (abs) at 450 nm was measured with a spectrophotometer (2103 Envision Multilabel Reader; Perkin Elmer). The percentage of survival was calculated as follows:
 $$\begin{eqnarray} Survival\,(\%) = (abs_{sample} -- abs_{pos.controle})/(abs_{neg.controle} -- abs_{pos.controle})\times 100. \end{eqnarray}$$
Results are expressed as fold dilution at which 50 % of the cells died (FD50).
Genotoxicity of faecal water: comet assay
Genotoxicity of faecal water was analysed using the comet assay based on Singh et al. ( Reference Singh, McCoy and Tice 24 ) with slight adaptations as described previously( Reference Windey, De P and Louat 15 ). Briefly, HT-29 cells were grown for 3 d before incubation with 10 % dilutions of faecal water for 24 h. All samples were tested in duplicate. After collection, the cells were fixed in low-melting-point agarose. The cells were lysed for 1 h and underwent electrophoresis for 30 min.
To quantify DNA damage, slides were stained with SYBR Green I (Trevigen, Inc.) and evaluated microscopically (Nikon eclipse Ti inverted microscope; Nikon Instruments) using dedicated software (LUCIA Comet Assay; Nikon Instruments). On each slide, DNA damage in fifty nuclei was determined. Tail length, the length between the centre of the head and the end of the tail, was quantified as a measure of DNA damage.
Statistical analysis
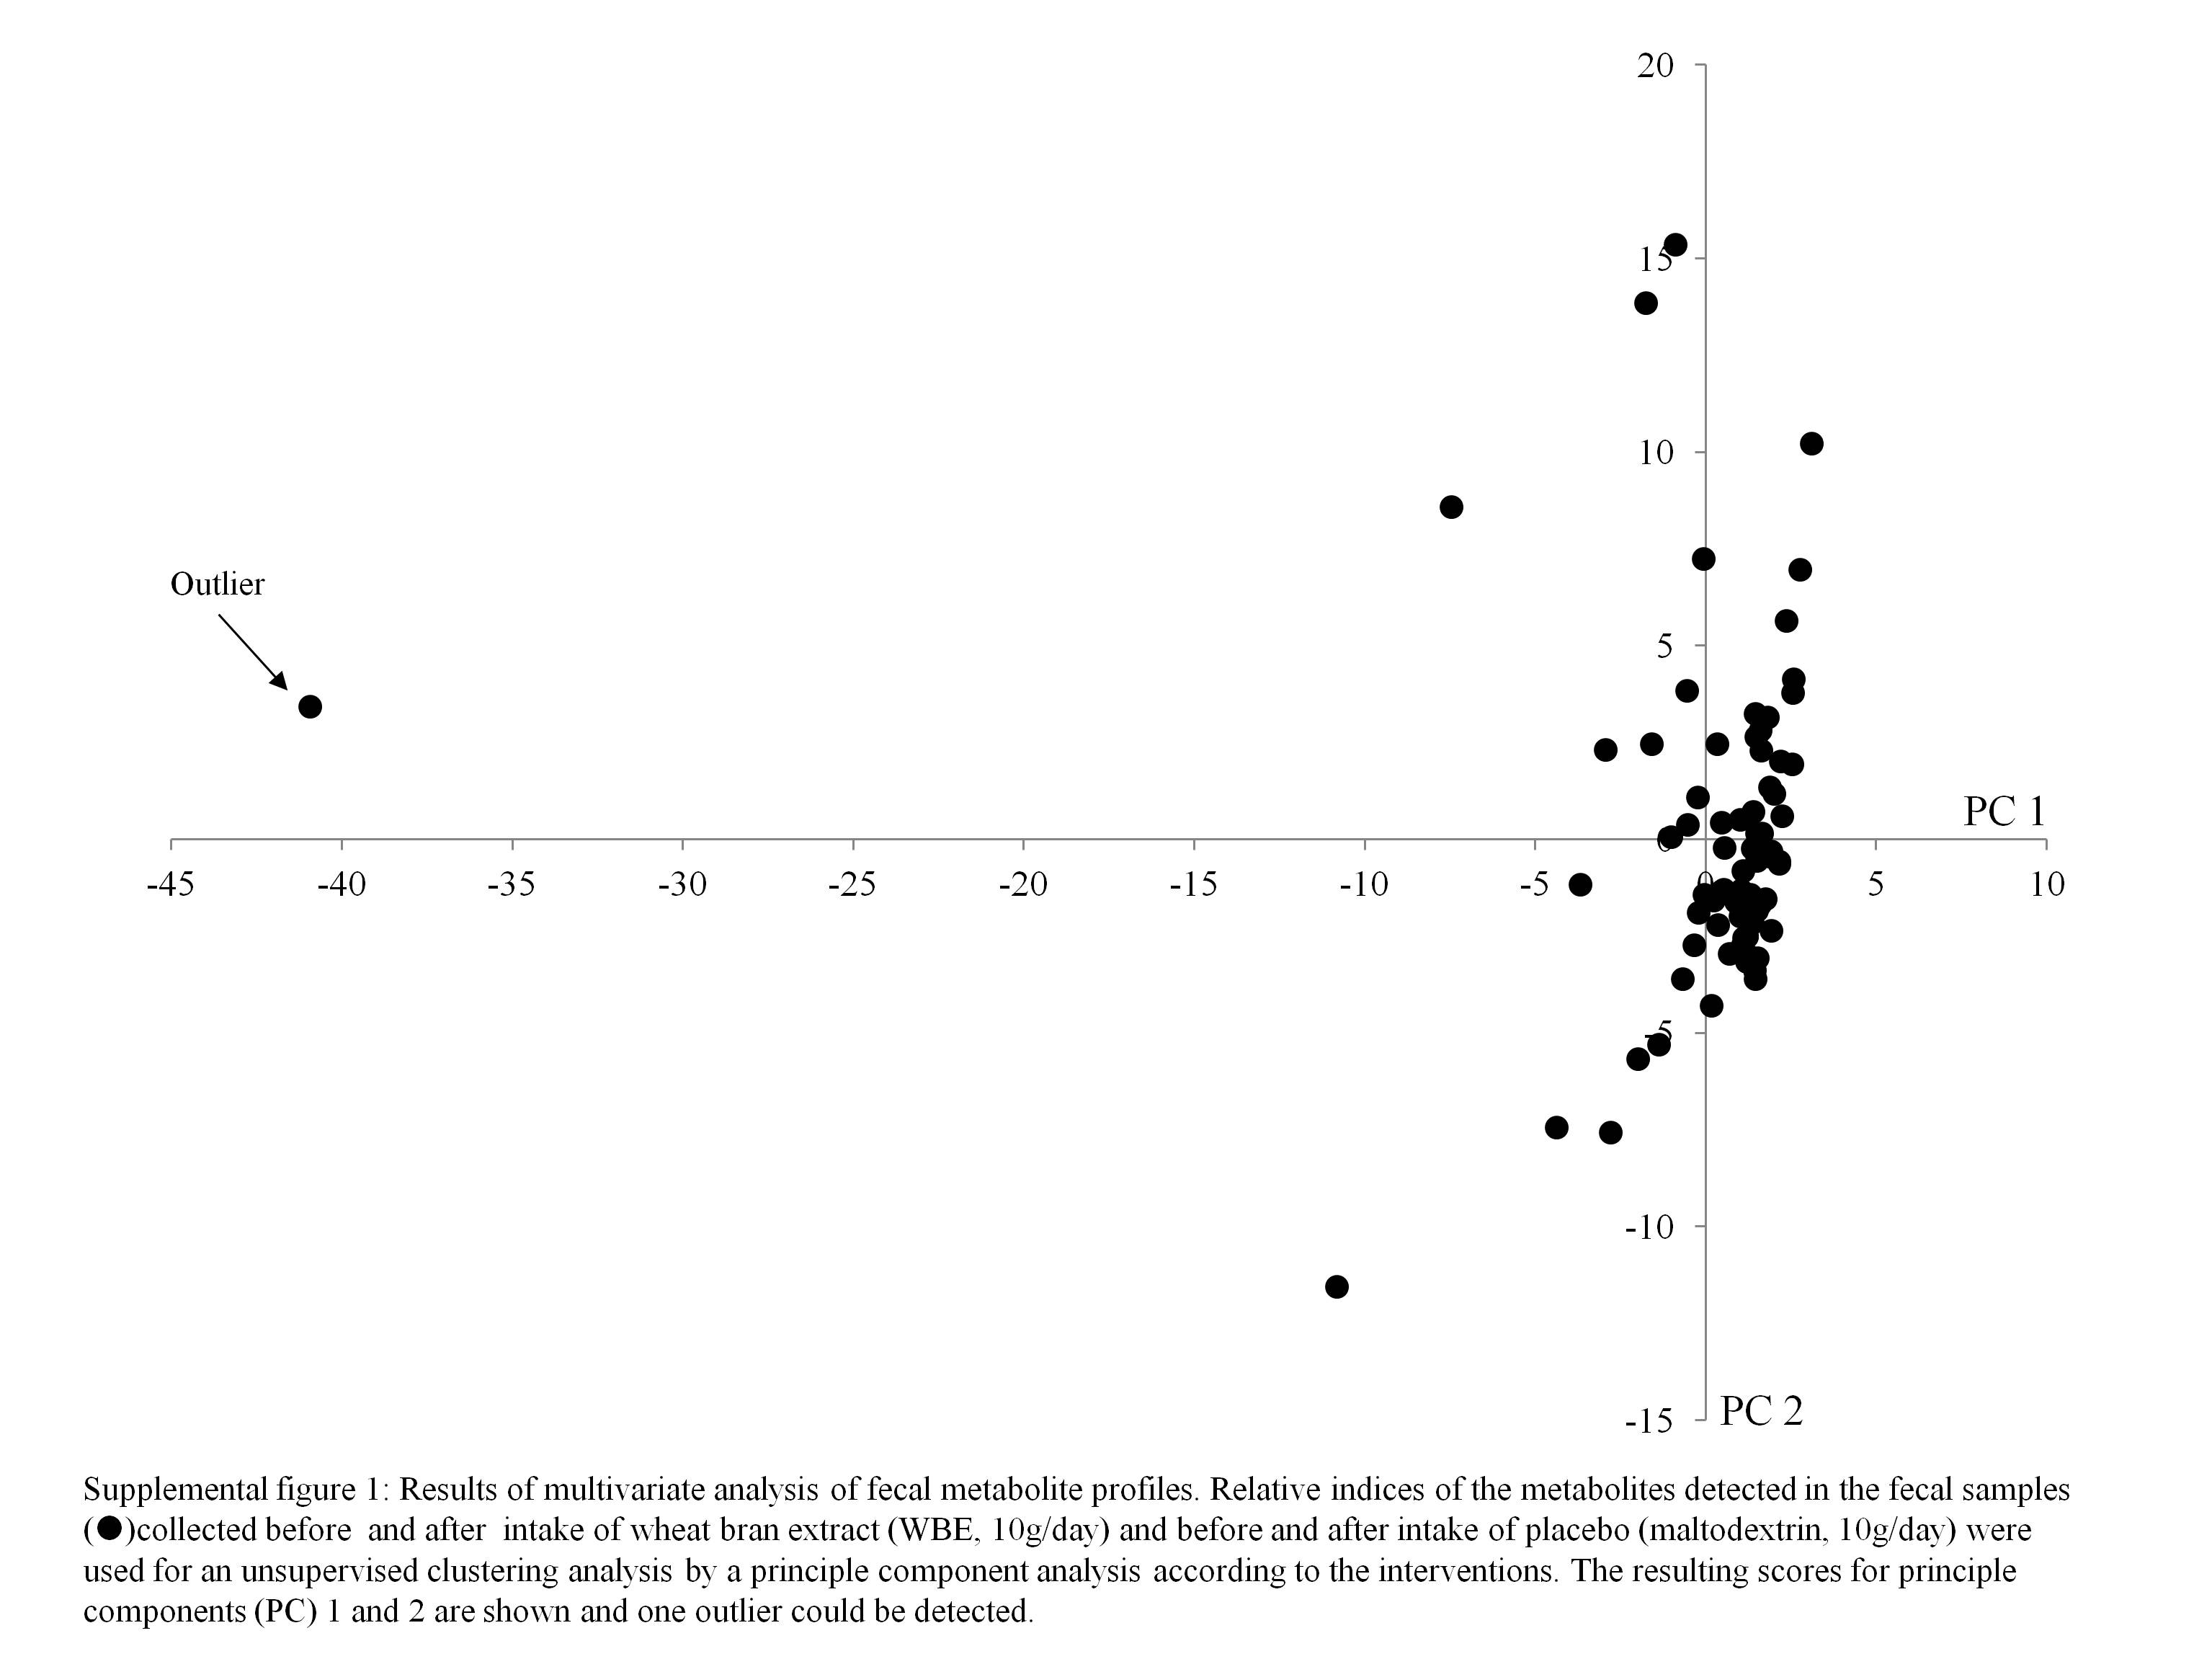
Statistical analysis was performed using IBM SPSS Statistics 20 (SPSS, Inc.). The effect induced by the treatments (WBE effect and placebo effect) was calculated as the difference between the results obtained at the end of the intervention (WBE or placebo) and the period preceding the intervention (run-in or washout). Results are expressed as means with their pooled standard errors. Data were analysed using a linear mixed model with treatment and sequence as fixed effects and subject (sequence) as the random effect. Correlations were made using a Pearson correlation. The level of statistical significance was set at P< 0·05, whereas P< 0·1 was considered as a tendency. The Unscrambler X version 10·2 (CAMO) was used to perform cluster analyses of metabolite profiles. Principal component analysis was applied to detect outliers, which were excluded from further analysis. Cluster analysis of similar metabolite patterns of the samples based on the intervention, the degree of cytotoxicity or the degree of genotoxicity was performed using a partial least-squares discriminant analysis, validated using full cross-validation and presented as a score plot. The correlating loading plots, showing the metabolites, were used to identify discriminating metabolites. Significantly different metabolites were identified and differences in band classes were detected by conducting multivariate analysis of variance statistics using Bionumerics version 6.6 (Applied Math). P values were corrected using false discovery rate correction( Reference Benjamini and Hochberg 25 ). The level of statistical significance was set at P< 0·1. Significantly different metabolites were further analysed using ANOVA followed by a Tukey test.
Results
Study population
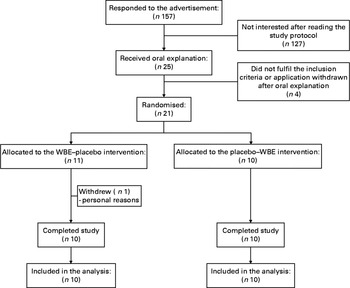
In total, 157 individuals responded to the advertisement and received the study protocol, of which twenty-five received oral explanation. Among these, twenty-one subjects signed the informed consent. Only one subject withdrew the informed consent before the start of the study for personal reasons. Finally, twenty subjects started and completed the study according to the protocol (Fig. 1).
Enrolment of the study volunteers. WBE, wheat bran extract.
Of the eighty urine collections from two subjects, four were incomplete. The results on urinary 15N, urea and p-cresol excretion from these collections were excluded from the statistical analysis. Only one subject did not return any dietary record; therefore, no results on dietary intake of this subject were included in the statistical analysis. Principal component analysis revealed one outlier, which was omitted from further analysis using partial least squares (see online supplementary Fig. S1).
Dietary intake
The results on dietary intake during the different intervention periods are summarised in Table 1. Total energy intake, absolute and relative intake of macronutrients (carbohydrates, protein and fat), and Ca intake did not differ between the run-in and intervention periods. Apart from WBE intake, subjects did not alter the intake of fibre during the study. Absolute protein intake and urinary urea excretion, a marker for protein intake, were significantly positively correlated (Pearson's ρ = 0·643; P< 0·0001), confirming the reliability of the dietary analysis.
Summary of the dietary records during the run-in period, intake of wheat bran extract (WBE, 10 g/d) and intake of placebo (10 g maltodextrin/d) (Mean values with their standard errors, n 19)
* P values refer to the overall significance of the linear mixed model (within-row comparison).
Faecal parameters
Subjects collected all faecal samples for 72 h. There were no differences between the interventions with respect to faecal output, faecal dry weight or 3H recovery as a measure of transit time (Table 2). Also, the effects of WBE and placebo on total faecal output (20·8 v. 38·7 g, sem= 60·2, P= 0·83), faecal dry weight ( − 0·6 v. − 0·4 %, sem= 1·2, P= 0·91) or 3H recovery (0·6 v. 7·9 dose %, sem= 6·8, P= 0·34) were not different.
Summary of the parameters of faecal output before and after the intake of wheat bran extract (WBE, 10 g/d) and before and after the intake of placebo (10 g maltodextrin/d) (Mean values with their standard errors, n 20)
* P values refer to the overall significance of the linear mixed model (within-row comparison).
Evaluation of colonic metabolism
Table 3 summarises the results on colonic metabolism.
Summary of the parameters of colonic metabolism before and after the intake of wheat bran extract (WBE, 10 g/d) and before and after the intake of placebo (10 g maltodextrin/d) (Mean values with their standard errors, n 20)
BCFA, branched-chain fatty acids.
a,bMean values with unlike superscript letters were significantly different (P< 0·05).
* P values refer to the overall significance of the linear mixed model (within-row comparison).
Colonic ammonia handling: 15N excretion in the urine and faeces
To evaluate the colonic handling of NH3, a test meal containing lactose[15N, 15N′]ureide was administered to the subjects. The labelled substrate allowed bringing a known amount of 15NH3 into the colon, which is either absorbed by colonocytes and excreted in the urine or used by the bacteria and excreted in the faeces. WBE significantly decreased urinary 15N excretion compared with the placebo intervention (P= 0·007) and before the intake of WBE (P= 0·005). This effect of WBE (6·8 Δdose %) was significantly different from the effect of placebo (2·3 Δdose %, sem= 2·3, P= 0·006). Concomitantly, WBE increased faecal 15N-excretion (6·7 Δdose %), which tended to be different from the effect of placebo (1·9 Δdose %, P= 0·06).
Effect of wheat bran extract on colonic protein fermentation: urinary p-cresol excretion
Urinary p-cresol concentrations tended to be lower during the WBE intervention than during placebo intake (P= 0·08), although this decrease (4·9 mg/24 h) was not different from the effect of placebo (6·9 mg/24 h, sem= 4·2, P= 0·98). Urinary p-cresol excretion was significantly positively correlated with absolute protein intake (Pearson's ρ = 0·355; P= 0·007), indicating that protein fermentation increased with higher protein intake.
Effect of wheat bran extract on faecal metabolome
In total, 285 metabolites were identified and relatively quantified in all faecal samples collected during this study with on average 91 (sd 10) compounds per sample. SCFA, BCFA, p-cresol, indole and dimethyl sulphide were absolutely quantified (Table 3). No intervention-related changes in the faecal concentrations of any of these metabolites were detected. No difference in effect on total SCFA excretion was found when comparing the WBE effect (0·54 mm) and the placebo effect ( − 1·8 mm, sem= 1·0, P= 0·49) or on total BCFA excretion between the WBE effect ( − 18·5 μm) and the placebo effect ( − 7·2 μm, sem= 35·0, P= 0·22); however, total BCFA excretion was significantly lower during the WBE intervention than during the placebo intervention. This can be attributed to both a significant reduction in isobutyric acid (P= 0·04) and isovaleric acid (P= 0·02) during WBE intake compared with placebo intake.
Metabolites associated with intake of wheat bran extract
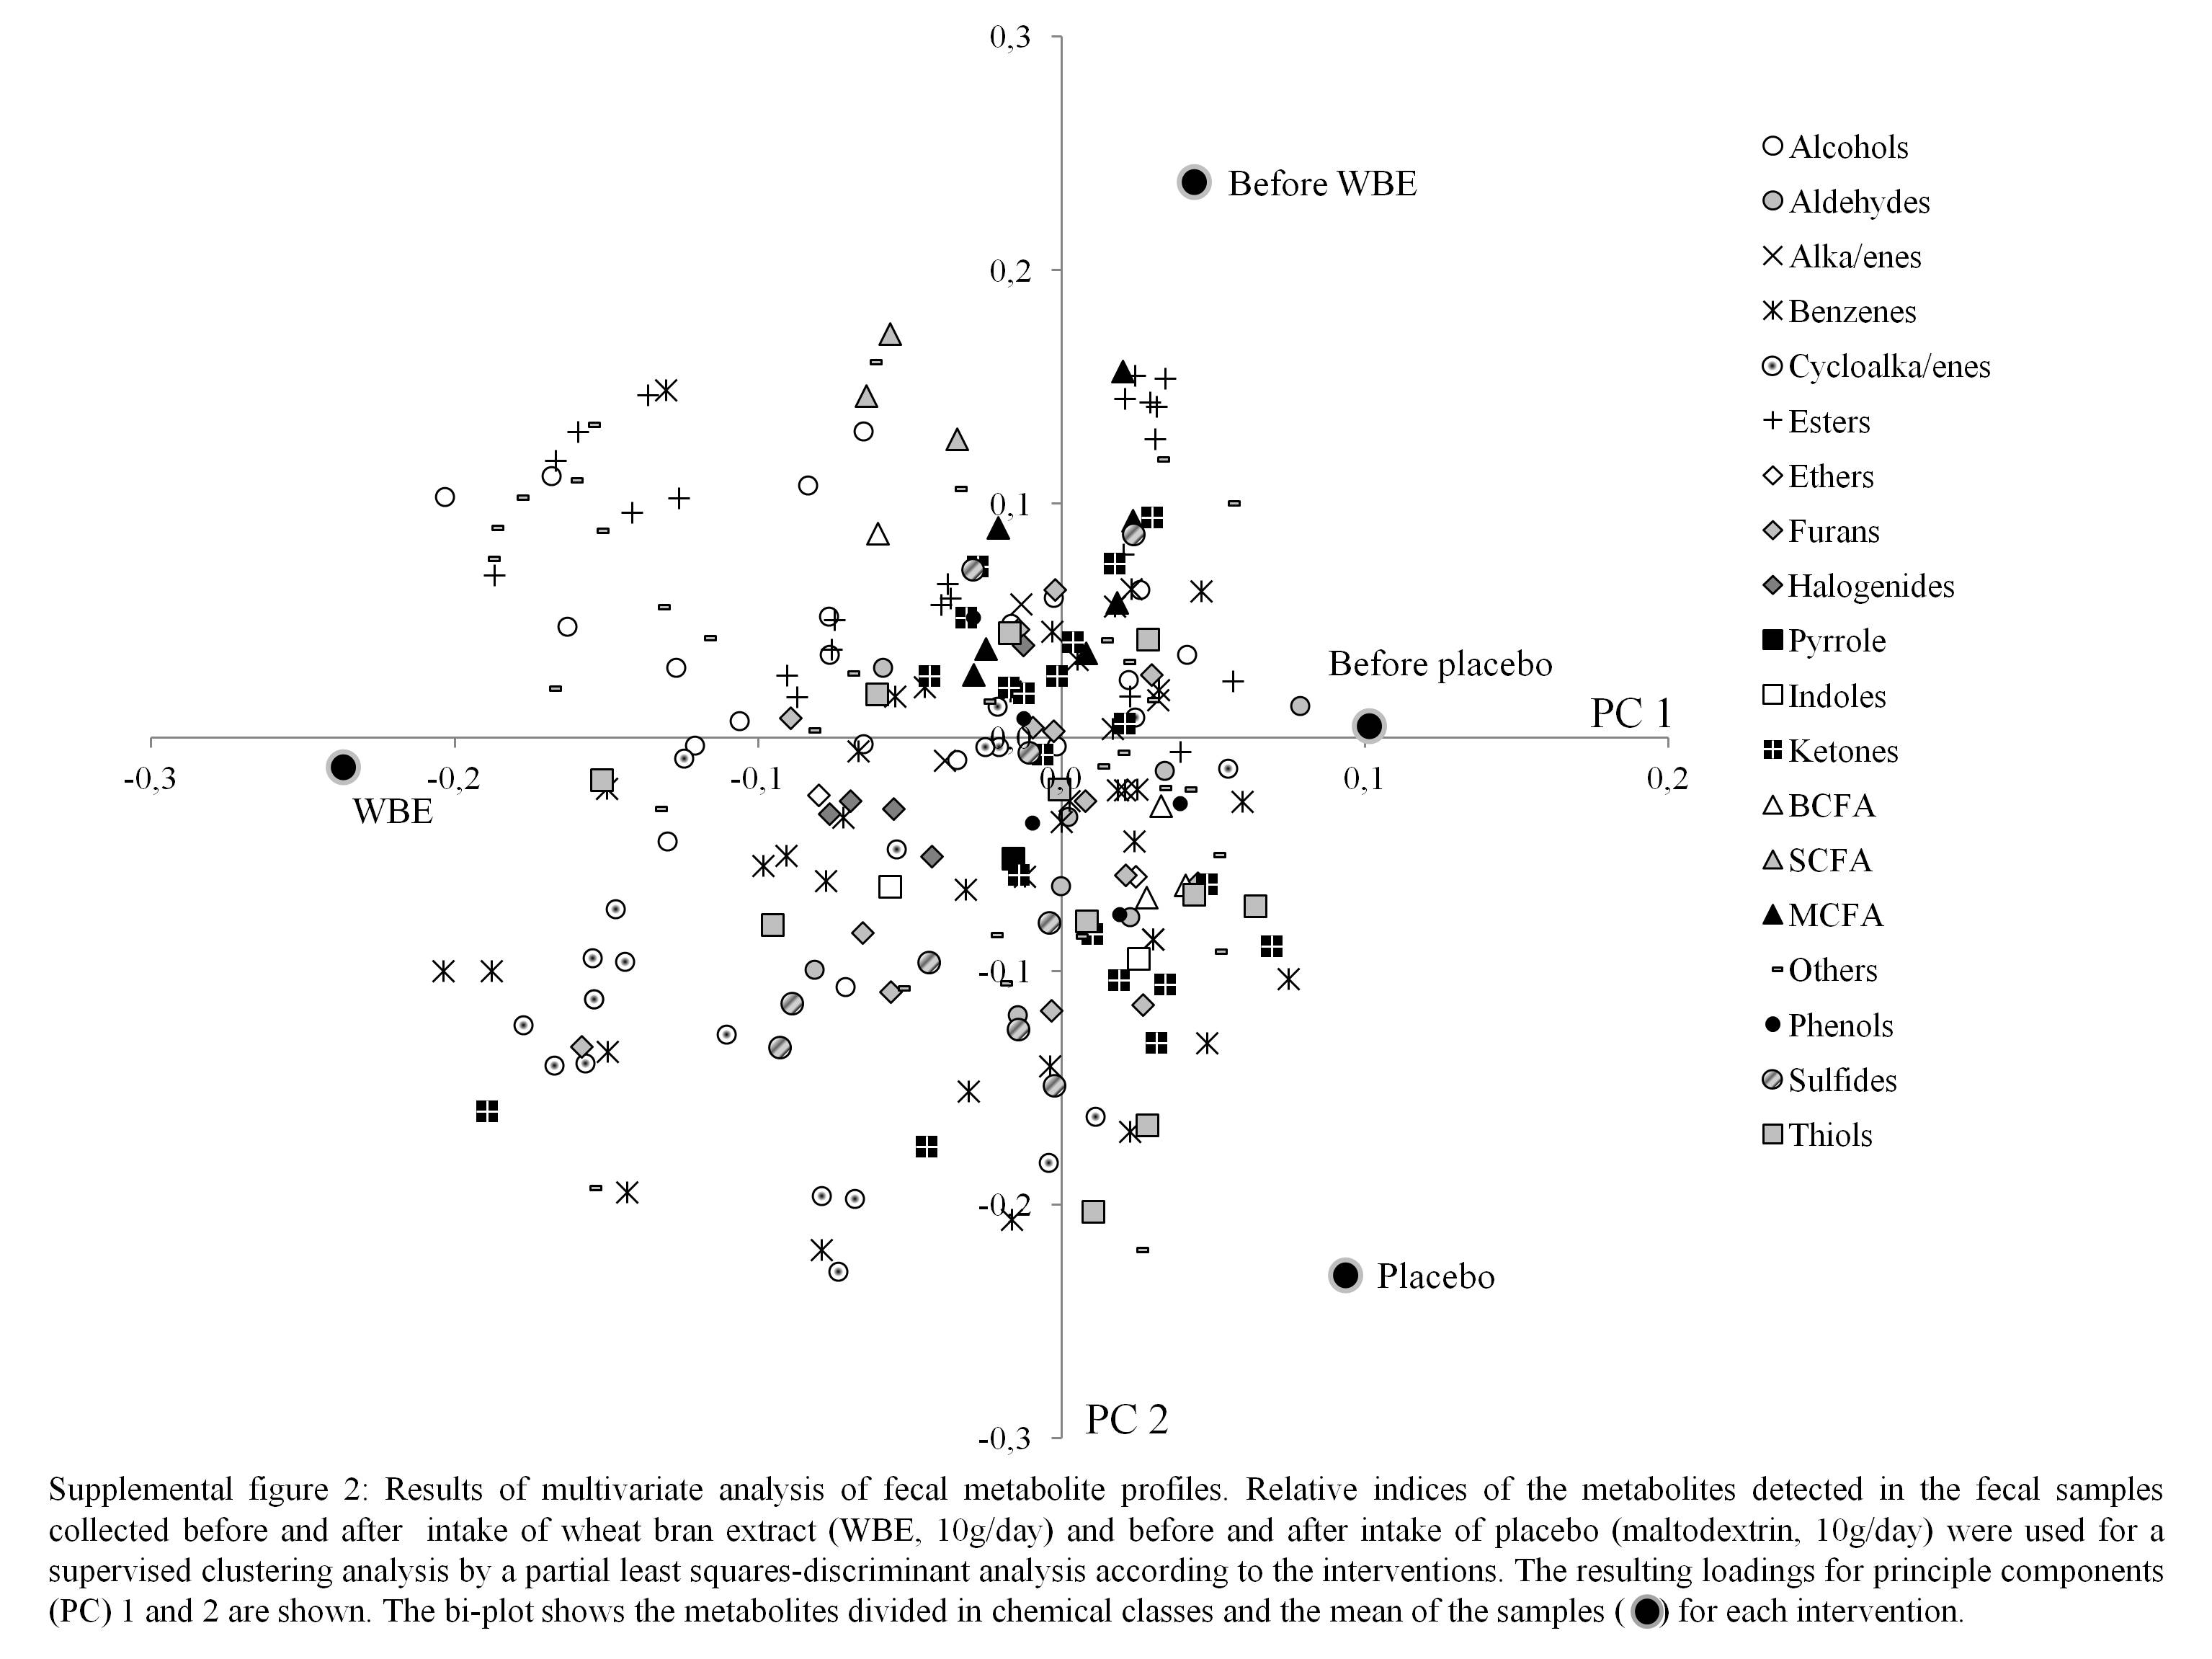
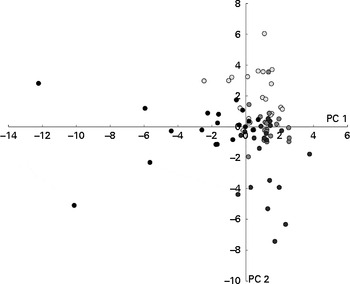
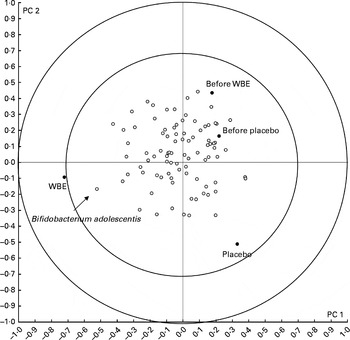
Metabolite profiles were clustered using the partial least-squares discriminant analysis, with intervention (before WBE intake, before placebo intake, after WBE intake and after placebo intake) as a category variable. In the score plot, samples collected during the periods before the intake of placebo and WBE and after the intake of placebo cluster together on the right side, while the those collected during the intake of WBE cluster together on the left side, indicating that WBE influences the metabolite pattern (Fig. 2). The corresponding loading plot revealed that samples collected after the intake of WBE are associated with higher levels of cycloalkanes, cycloalkenes, alcohols and esters (see online supplementary Fig. S2). BCFA are associated with the samples collected during the periods before the intake of placebo and WBE and after the intake of placebo. SCFA are not clearly associated with any of the intervention periods. Multivariate analysis of variance with false discovery rate correction did not reveal any significantly different metabolites.
Results of the multivariate analysis of faecal metabolite profiles. Relative indices of the metabolites detected in the faecal samples collected before (○) and after (●) the intake of wheat bran extract (10 g/d) and before (![]() ) and after (
) and after (![]() ) the intake of placebo (maltodextrin, 10 g/d) were used for supervised clustering by applying a partial least-squares discriminant analysis based on the interventions. The resulting scores for principal components (PC) 1 and 2 are shown.
) the intake of placebo (maltodextrin, 10 g/d) were used for supervised clustering by applying a partial least-squares discriminant analysis based on the interventions. The resulting scores for principal components (PC) 1 and 2 are shown.
Evaluation of faecal water cytotoxicity and genotoxicity
Faecal water cytotoxicity (P= 0·66) and faecal water genotoxicity (P= 0·29) did not differ between the different study periods (Table 4). Also, the effect of WBE on faecal water cytotoxicity ( − 2·1 FD50) and genotoxicity ( − 5·6 μm) was not different from that of placebo (cytotoxicity: FD50 4·0, sem= 3·5, P= 0·15; genotoxicity: − 2·8 μm, sem= 2·5, P= 0·16). Cytotoxicity levels were weakly positively correlated with the levels of genotoxicity (Pearson's ρ = 0·276; P= 0·016).
Summary of the parameters of faecal water toxicity before and after the intake of wheat bran extract (WBE, 10 g/d) and before and after the intake of placebo (10 g maltodextrin/d) (Mean values with their standard errors, n 20)
FD50, fold dilution at which 50 % of the cells died; TL, tail length.
* P values refer to the overall significance of the linear mixed model (within-row comparison).
Metabolites associated with cytotoxicity
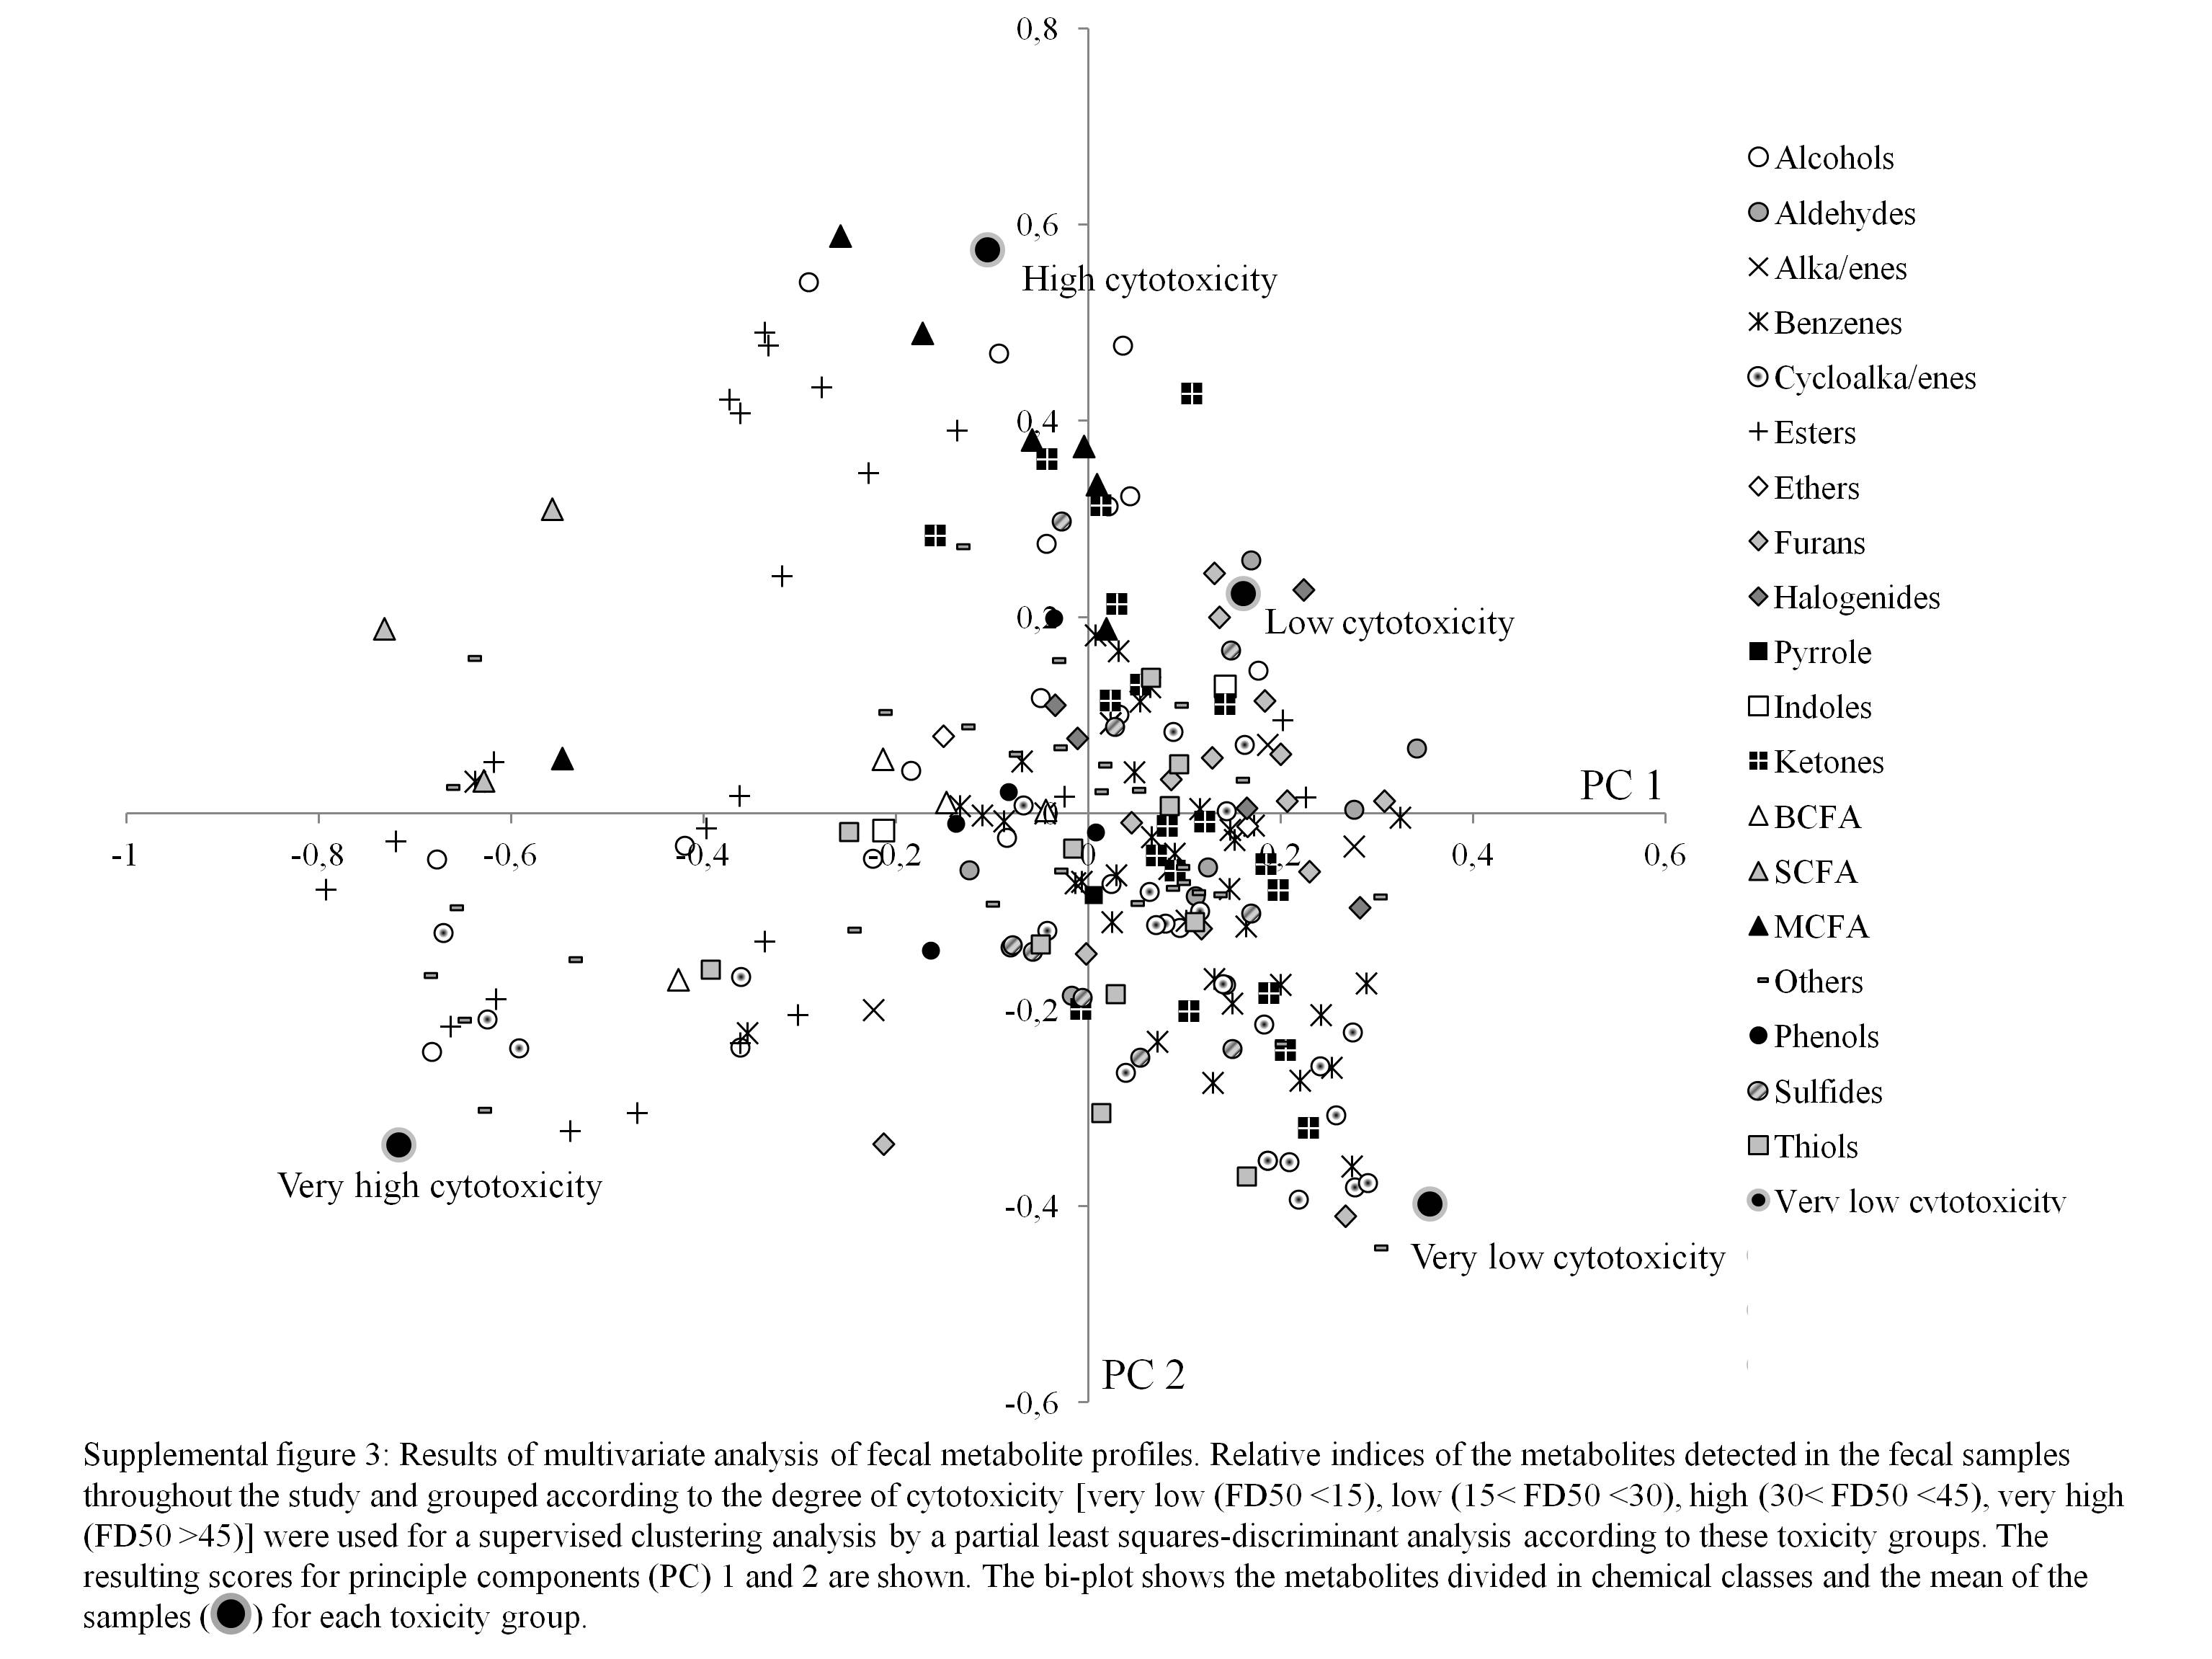
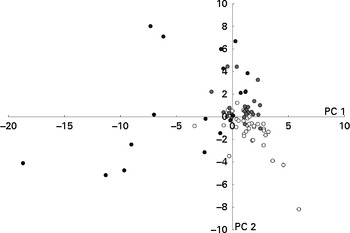
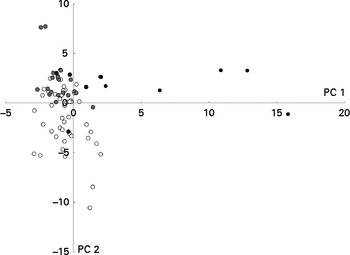
The partial least-squares discriminant analysis based on the degree of cytotoxicity allowed the separation of highly cytotoxic samples from samples of low cytotoxicity (Fig. 3) . The corresponding loading plot revealed that acids, alcohols and esters are associated with highly cytotoxic samples (see online supplementary Fig. S3). This was confirmed by the multivariate analysis of variance. Table 5 presents the significantly different metabolites. Furthermore, samples with very low cytotoxicity were associated with the presence of cycloalkanes and cycloalkenes, such as α-pinene, α- and β-phellandrene, limonene, 3-carene and camphene.
Results of the multivariate analysis of faecal metabolite profiles. Relative indices of the metabolites detected in the faecal samples throughout the study and clustered based on the degree of cytotoxicity (very low (○; FD50 (fold dilution at which 50 % of the cells died) < 15), low (![]() ; 15 < FD50< 30), high (
; 15 < FD50< 30), high (![]() ; 30 < FD50< 45) and very high (●; FD50>45)) were used for supervised clustering by applying a partial least-squares discriminant analysis based on these toxicity groups. The resulting scores for principal components (PC) 1 and 2 are shown.
; 30 < FD50< 45) and very high (●; FD50>45)) were used for supervised clustering by applying a partial least-squares discriminant analysis based on these toxicity groups. The resulting scores for principal components (PC) 1 and 2 are shown.
Chemical class, mean relative indices (RI) and percentage of the occurrence of significantly different volatile organic compounds in faecal samples according to faecal water cytotoxicity
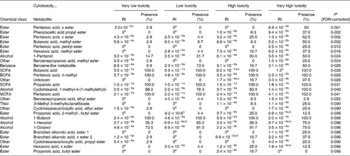
FDR, false discovery rate; x ester, unidentified ester; BCFA, branched-chain fatty acids; MCFA, medium-chain fatty acids.
a,bMean values with unlike superscript letters were significantly different between the interventions (P< 0·05).
* P values refer to the overall significance of the multivariate analysis of variance (within-row comparison, P< 0·1).
Metabolites associated with genotoxicity
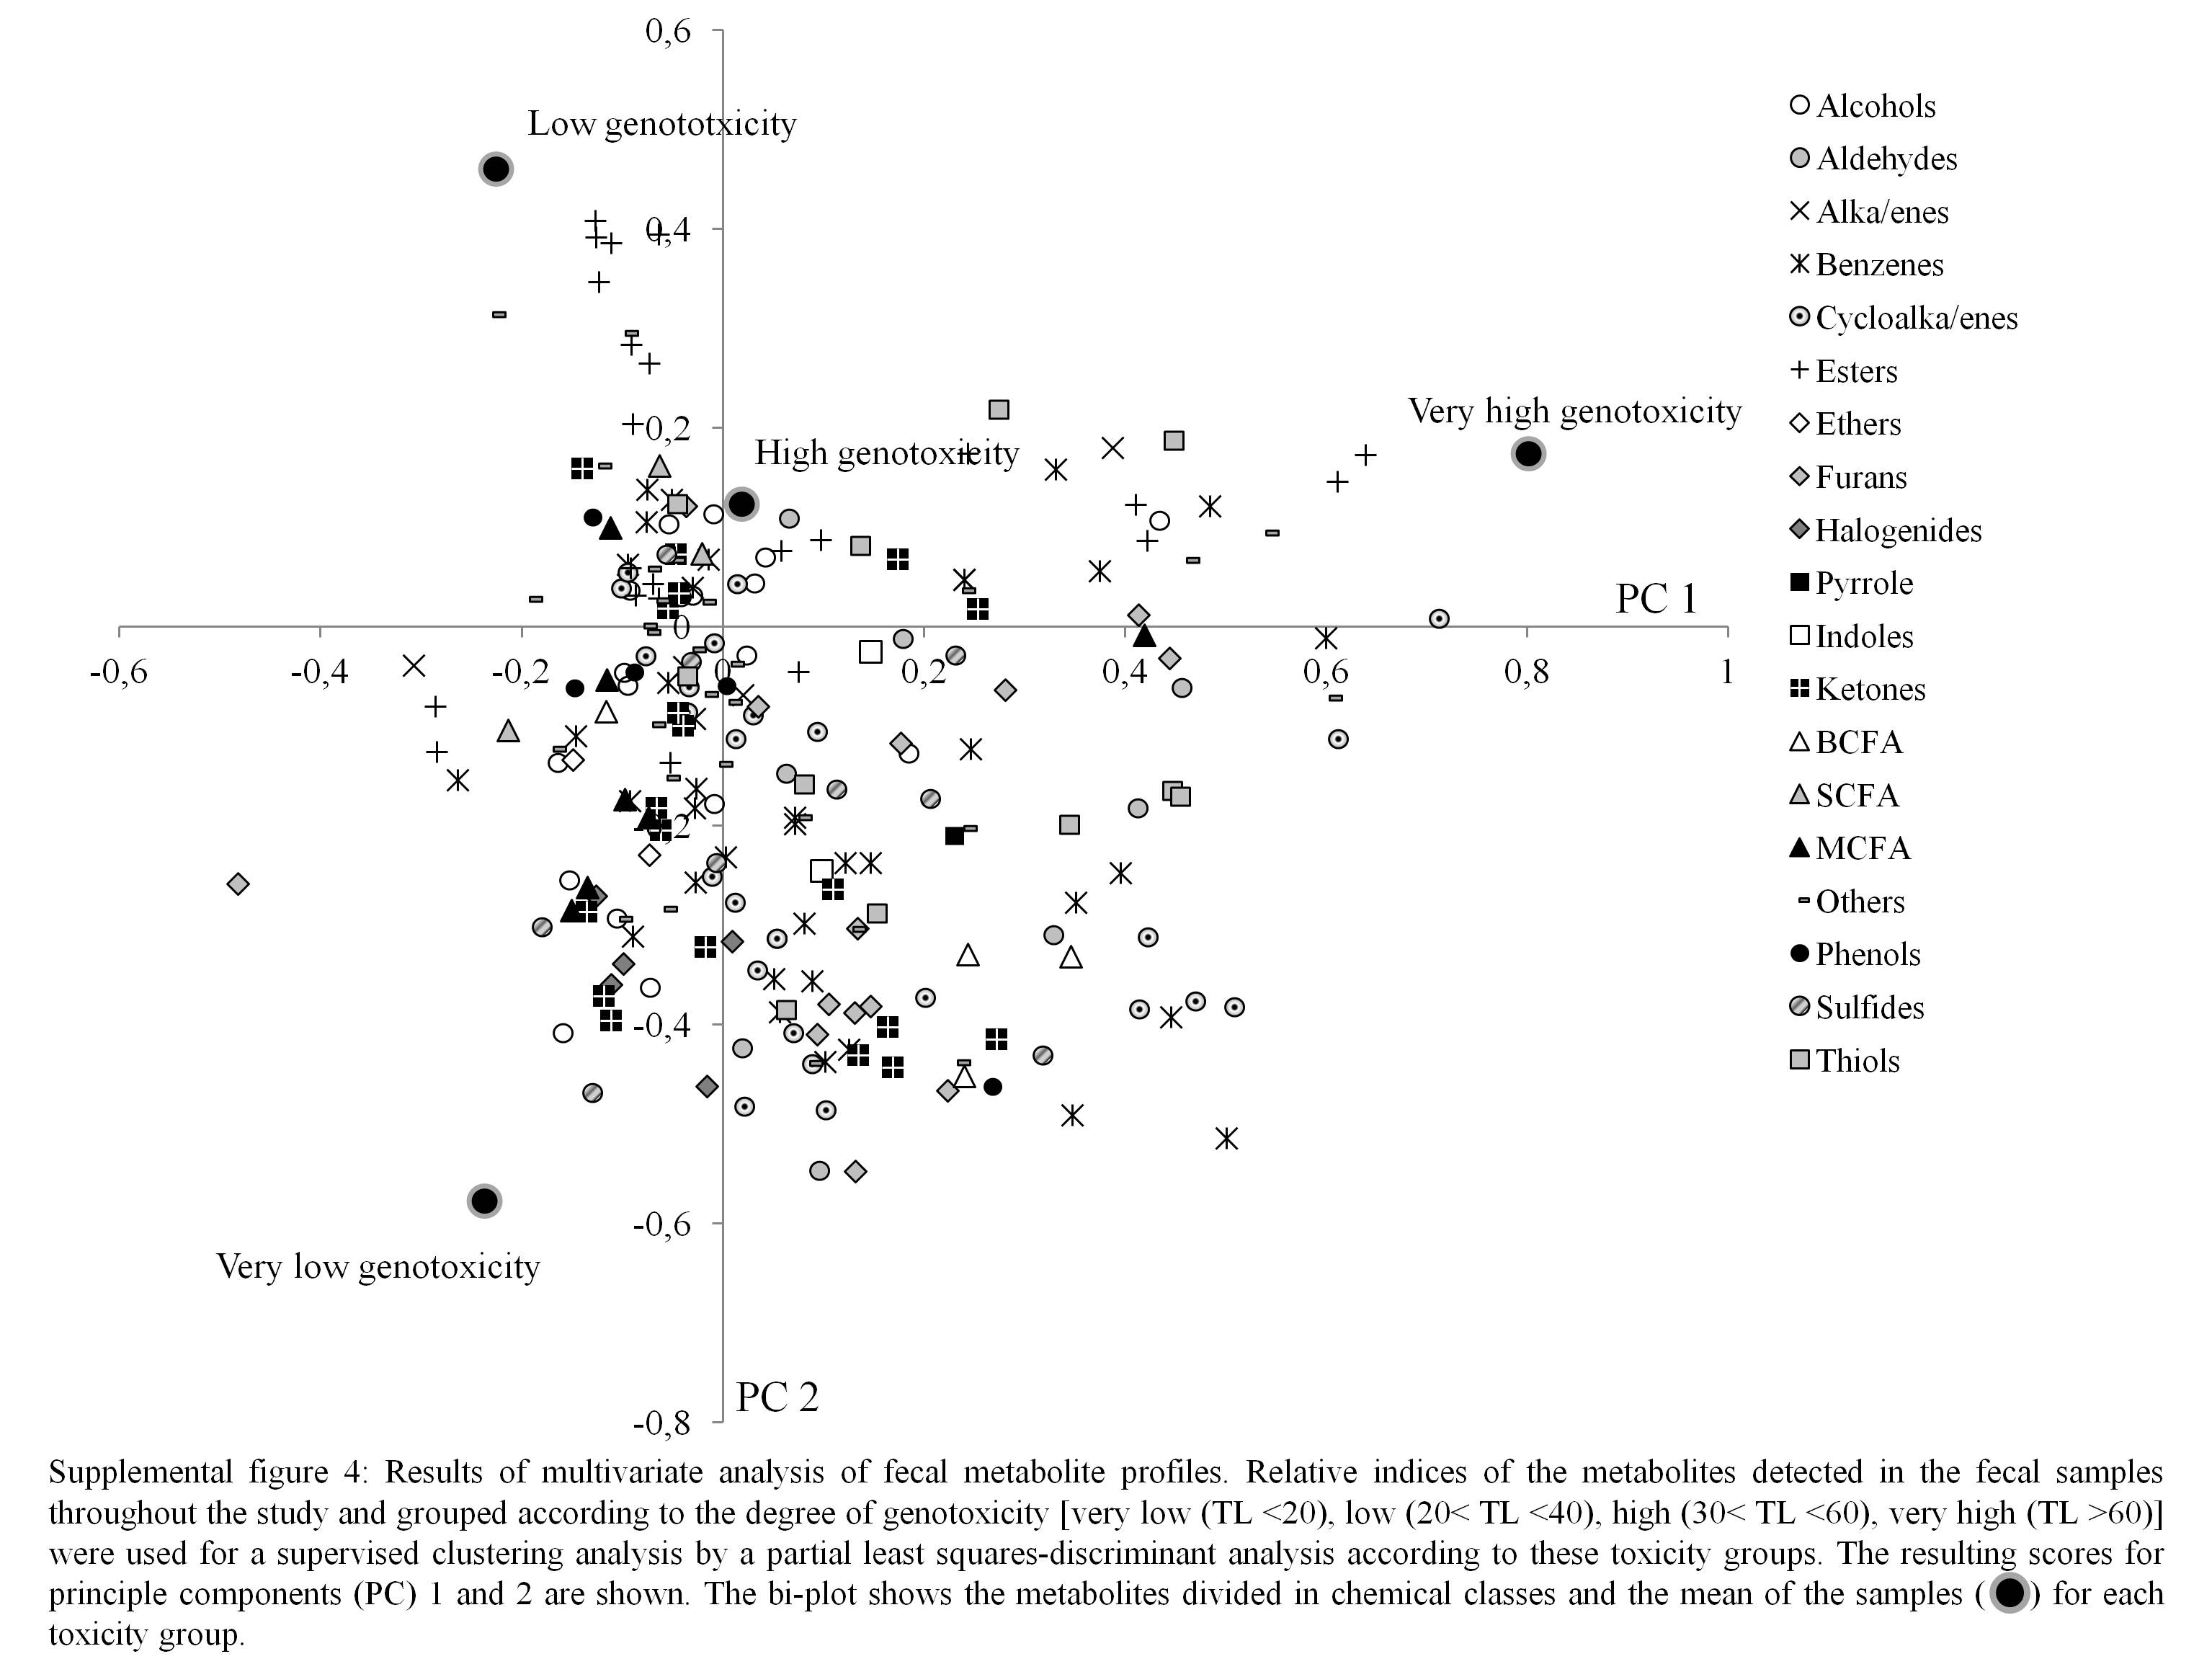
Figure 4 shows clustering of the metabolite profiles based on the degree of genotoxicity. No specific chemical class of the metabolites could be associated with high genotoxicity, although a few specific metabolites, such as some esters and a ketone, were more prevalent in the samples with high genotoxicity (see online supplementary Fig. S4). Of these esters, one was identified as a pentyl ester of pentanoic acid and one was an unidentified ester of pentanoic acid, and the ketone was identified as cyclohexanone. This was confirmed by the multivariate analysis of variance (Table 6).
Results of the multivariate analysis of faecal metabolite profiles. Relative indices of the metabolites detected in the faecal samples collected throughout the study and clustered based on the degree of genotoxicity (very low (○; tail length (TL) < 20), low (![]() ; 20 < TL < 40), high (
; 20 < TL < 40), high (![]() ; 30 < TL < 60) and very high (●; TL>60)) were used for supervised clustering by applying a partial least-squares discriminant analysis based on these toxicity groups. The resulting scores for principal components (PC) 1 and 2 are shown.
; 30 < TL < 60) and very high (●; TL>60)) were used for supervised clustering by applying a partial least-squares discriminant analysis based on these toxicity groups. The resulting scores for principal components (PC) 1 and 2 are shown.
Chemical class, mean relative indices (RI) and percentage of the occurrence of significantly different volatile organic compounds in faecal samples according to faecal water genotoxicity
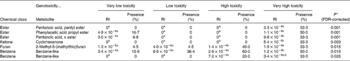
FDR, false discovery rate; x ester, unidentified ester.
a,bMean values with unlike superscript letters were significantly different between the interventions (P< 0·05).
* P values refer to the overall significance of the multivariate analysis (within-row comparison, P< 0·1).
Evaluation of colonic microbiota composition
In total, eighty-eight band classes were allocated. Significantly less band classes were present during the intake of placebo than before the intake of placebo (P= 0·01) and after the intake of WBE (P= 0·02). Only one band class (16·11) was significantly higher after the intervention with WBE than before the intake of WBE (P= 0·007), after the intake of placebo (P< 0·001) and before the intake of placebo (P< 0·001) (Table 7). The increase in the intensity of this band class (+2·69) was significantly higher after the intervention with WBE than after the intake of placebo (+0·09, sem= 0·77, P= 0·02). Similarly, cluster analysis on the DGGE profiles based on the interventions revealed that the composition of the microbiota as a result of the WBE intervention was different from that found in the other study periods, with band class 16·11 as one of the major discriminating ones (Fig. 5). The sequence analysis of the purified DNA and the subsequent BLAST analysis revealed 100 % homology with the species B. adolescentis (NCBI reference sequence: NC_008618·1). The RT-PCR analysis confirmed the significant increase in the number of B. adolescentis after the intervention with WBE compared with the periods before the intake of WBE (P= 0·017), after the intake of placebo (P< 0·001) and before the intake of placebo (P= 0·017) (Table 7).
Summary of the results on microbial composition before and after the intake of wheat bran extract (WBE, 10 g/d) and before and after the intake of placebo (10 g maltodextrin/d) (Mean values with their standard errors, n 20)
a,bMean values with unlike superscript letters were significantly different between the interventions (P< 0·05).
* P values refer to the overall significance of the linear mixed model (within-row comparison).
Results of the multivariate analysis of faecal microbiota composition. Band classes representing the predominant bacteria in the faecal samples collected before and after the intake of wheat bran extract (WBE, 10 g/d) and before and after the intake of placebo (maltodextrin, 10 g/d) were used for supervised clustering by applying a partial least-squares discriminant analysis based on the interventions. The biplot shows the band classes (○) and the mean of the samples (●). The resulting scores for principal components (PC) 1 and 2 are shown. The inner and outer circles indicate the 70–100 % importance interval.
Discussion
Major candidates to beneficially affect gastrointestinal health are prebiotics. Mainly animal studies have underlined the positive effects of prebiotics on the progression of CRC( Reference Gourineni, Verghese and Boateng 3 – Reference Verghese, Rao and Chawan 5 ); however, more research in human subjects is necessary( Reference Clark, Robien and Slavin 26 ). In the present intervention study, we aimed to evaluate whether the effects of prebiotic intervention on the development of CRC risk could be attributed to a change in colonic fermentation. Therefore, we correlated the effect of WBE (a novel prebiotic preparation mainly consisting of AXOS) on colonic microbiota and fermentation with its effect on the markers of CRC risk. We preferred to characterise colonic fermentation by metabolite profiles rather than to focus on typical fermentation metabolites such as SCFA. This approach obviated the need for an a priori hypothesis and allowed the association of compounds present in the colonic lumen that had not been associated with toxicity before. To assess the effect of WBE on the risk of developing CRC, two non-invasive markers (i.e. faecal water cytotoxicity and genotoxicity) were measured. Cell death and DNA damage result in increased cell turnover and mutations, which are key elements in the initiation of carcinogenesis( Reference Pearson, Gill and Rowland 27 ). Metabolite profiles were clustered based on the degree of genotoxicity or cytotoxicity of the samples, resulting in the separation of samples with high toxicity from those with low toxicity. Some acids, alcohols and esters were found to be more abundant in the highly cytotoxic samples. An association between alcohols and acids and faecal water cytotoxicity has also been found in a previous study( Reference Windey, De P and Louat 15 ). The fact that alcohols and esters are present in the same cytotoxic samples might be explained by the bacterial esterification of alcohols regarded as a microbial strategy to remove toxic molecules from the colonic lumen, as suggested by Vitali et al. ( Reference Vitali, Ndagijimana and Cruciani 28 ). A study comparing faecal volatile organic compounds between diarrhoea-predominant irritable bowel syndrome (IBS) patients and healthy controls has found esters to be significantly more present in samples from IBS patients( Reference Ahmed, Greenwood and Costello 29 ). Also consistent with our previous study( Reference Windey, De P and Louat 15 ), cluster analysis revealed a clear association of cycloalkanes and cycloalkenes, compounds more abundant in the samples after the intake of WBE, with very low cytotoxic samples. This chemical class includes terpenes such as α- and β-pinene, limonene, camphene, carene and α- and β-phellandrene. These terpenes are secondary metabolites produced by plants( Reference Zwenger and Batta 30 ). Terpenes are major constituents of essential oils, which have antioxidant and antimicrobial characteristics( Reference Lang and Buchbauer 31 ). Limonene, for example, a monoterpene, occurs in citrus fruit and has anticancer capacities( Reference Campos, Logullo Waitzberg and Kiss 32 ), while α-pinene and 3-carene originate from pine wood and show no cytotoxicity towards lung epithelial cells( Reference Gminski, Tang and Mersch-Sundermann 33 ).
In contrast to our findings, AXOS reduced the occurrence of pre-neoplastic lesions in the colon of rats treated with a colon carcinogen( Reference Femia, Salvadori and Broekaert 9 ). In humans, PDX (8 g/d) and konjac glucomannan (4·5 g/d) reduced faecal water genotoxicity, while galacto-oligosaccharides (4 g/d) did not( Reference Costabile, Fava and Roytio 11 – Reference Walton, van den Heuvel and Kosters 13 ). It has been suggested that the ability of dietary fibre to reduce the risk on developing CRC is related to its ability to increase the production of butyric acid( Reference Perrin, Pierre and Patry 34 ). Several in vitro fermentation studies have shown increased SCFA production upon fermentation of AXOS( Reference Sanchez, Marzorati and Grootaert 35 , Reference Grootaert, Van den Abeele and Marzorati 36 ). Nevertheless, in the present study, faecal concentrations of SCFA did not change during the interventions, which might be due to the rapid fermentation of AXOS. As the WBE used in the present study contained relatively short AXOS (avDP 5), it is likely to be fermented in the proximal part of the colon( Reference Macfarlane, Gibson and Cummings 37 ), with the SCFA being largely absorbed before ending up in the faeces. Therefore, the contribution of SCFA production in reducing the development of CRC risk cannot be estimated from the analysis of faecal water toxicity in case of rapidly fermentable carbohydrates. The present results do not allow excluding an effect of SCFA on local toxicity in the proximal colon, which cannot be measured in faecal water. The lack of changes in faecal SCFA concentrations also explains the fact that SCFA did not emerge as discriminating metabolites in the cluster analysis.
In contrast to the present results, konjac glucomannan increases the faecal concentrations of SCFA( Reference Chen, Cheng and Wu 38 ), while data on PDX are conflicting. Some human intervention studies( Reference Boler, Serao and Bauer 39 , Reference Timm, Thomas and Boileau 40 ) have reported no significant increase in faecal SCFA concentrations, whereas one study has observed a significant increase in faecal acetate and butyrate concentrations at an intake of 8 and 12 g PDX/d for 28 d( Reference Jie, Bang-Yao and Ming-Jie 41 ). PDX is only partially fermented in the large intestine and up to 30–50 % is excreted intact in the faeces( Reference Achour, Flourie and Briet 42 , Reference Auerbach, Craig and Howlett 43 ), indicating slow and incomplete fermentation along the entire colon and suggesting a more constant production of SCFA.
Metabolites from protein fermentation such as NH3 and phenols are often considered as potentially toxic. The toxic potential of NH3 is based on the reports that NH3 increases intestinal permeability in vitro ( Reference Leschelle, Robert and Delpal 44 ), stimulates the progression of colonic adenocarcinomas in rats( Reference Clinton, Bostwick and Olson 45 ), inhibits SCFA metabolism in colonocytes( Reference Cremin, Fitch and Fleming 46 ), alters the synthesis of DNA and RNA in colonocytes( Reference Bartram, Scheppach and Schmid 47 , Reference Topping and Visek 48 ), and dose-dependently inhibits mitochondrial oxygen consumption( Reference Davila, Blachier and Gotteland 49 ). Several studies, both in animals and human subjects, have reported a shift in N excretion from urine to faeces after an intervention with fermentable carbohydrates( Reference Younes, Garleb and Behr 50 , Reference Tetens, Livesey and Eggum 51 ). In the present study, total urinary and faecal N excretion was not affected by the intervention. However, the use of the labelled biomarker lactose[15N, 15N′]ureide enabled us to selectively analyse the colonic handling of NH3. Supplementation with WBE stimulated bacterial growth or activity in the colon( Reference De Preter, Vanhoutte and Huys 52 ), which was reflected in a shift from urinary 15N excretion to faecal 15N excretion. Indeed, increased bacterial activity results in increased bacterial uptake of NH3 and thus the removal of NH3 from the colonic lumen, leaving less available for absorption through the colonocytes, which explains the reduced urinary 15N excretion. Similar results were obtained with longer-chain AXOS (10 g/d, avDP 15) and other prebiotics such as oligofructose/inulin and lactulose( Reference De Preter, Vanhoutte and Huys 52 – Reference Cloetens, De Preter and Swennen 54 ). This stimulation of bacterial growth was found to be relatively selective as analysis of the predominant microbiota using DGGE only showed a significant increase in the number of B. adolescentis after the intake of WBE. The selective stimulation is a prerequisite for WBE to be classified as a prebiotic, and confirms previous results that showed a significant increase in the number of bifidobacteria in general( Reference Cloetens, Broekaert and Delaedt 55 , Reference Francois, Lescroart and Veraverbeke 56 ) and more specifically in the levels of B. adolescentis after the intake of AXOS( Reference Cloetens, Broekaert and Delaedt 55 ). Similarly, inulin also increases the levels of B. adolescentis ( Reference Ramirez-Farias, Slezak and Fuller 57 ).
Administration of prebiotics increases the ratio of available carbohydrate:protein in the proximal colon, resulting in decreased protein fermentation( Reference De Preter, Hamer and Windey 58 ). In the present study, we measured the urinary excretion of p-cresol to estimate the degree of protein fermentation. After the intake of WBE, urinary p-cresol excretion tended to be reduced compared with the intake of placebo. In previous studies( Reference Cloetens, Broekaert and Delaedt 55 , Reference Francois, Lescroart and Veraverbeke 56 ), urinary p-cresol excretion has been shown to be significantly decreased after the intake of AXOS (avDP 6, two times 5 g/d) for 2 weeks. Similarly, high doses of lactulose (20 or 30 g/d) significantly decreased urinary p-cresol excretion in healthy volunteers( Reference De Preter, Coopmans and Rutgeerts 59 ). Other markers of protein fermentation include levels of faecal BCFA. Faecal isobutyric acid concentration was significantly reduced and isovaleric acid concentration tended to be reduced after the intake of WBE compared with placebo, resulting in an overall tendency for reduced faecal BCFA concentrations after the intake of WBE. Overall, these results provide evidence for reduced protein fermentation due to the intake of WBE. Nevertheless, none of the protein fermentation metabolites emerged as discriminating compounds responsible for the separation between low toxicity and high toxicity samples.
A limitation of the present study is related to the use of faecal water to assess the risk of CRC. Analysis of faecal water is non-invasive, allows repeated measurements over time and can directly reflect the effects of diet. However, faecal water analysis may not always be truly representative of the processes occurring in the colon because of the modulation of intestinal contents before faecal excretion.
Second, in many studies on faecal water toxicity, including the present study, considerable inter- and intra-individual variability is observed, which hampers reaching statistical significance. To reduce analytical variability, we included the same control sample in each experiment. A CV of 4·7 and 5·6 % was obtained for the comet assay and the WST-1 assay, respectively, indicating that the high variation found in the present study cannot be explained by analytical variability and might be due to other parameters, including host-specific factors such as age and sex and environmental factors such as differences in dietary intake. In conclusion, supplementation of the diet with WBE clearly altered fermentation in the colon, as it modified the colonic handling of NH3, reduced colonic protein fermentation, altered the colonic metabolite pattern and selectively stimulated the growth of bifidobacteria. Nevertheless, these changes in fermentation were neither associated with faecal water cytotoxicity nor with genotoxicity. In contrast, WBE-associated cycloalkanes and cycloalkenes were also associated with low cytotoxicity.
Supplementary material
To view supplementary material for this article, please visit http://dx.doi.org/10.1017/S0007114514003523
Acknowledgements
The authors acknowledge G. Vandermeulen, E. Houben and A. Luypaerts from the TARGID, KU Leuven, Belgium for their skilful assistance with the analytical procedures, K. Van Belle from IVAP, KU Leuven, Belgium for her assistance with cell culture, and C. Snauwaert from BCCM/LMG Bacteria Collection for helping with Bifidobacterium culturing and DNA extraction. K. V. and J. A. D. are W.K. Kellogg Chairs in Cereal Science and Nutrition at KU Leuven.
The present study was financially supported by the Fund for Scientific Research – Flanders (FWO Vlaanderen), Belgium (FWO project G.0674.10)
The authors’ contributions are as follows: K. V., V. D. P. and K. W. designed the study; K. W., T. L. and J. H. conducted the research; G. H. provided DNA of B. adolescentis for the RT-PCR analysis; W. F. B. and J. A. D. provided the WBE; K. V., V. D. P. and K. W. analysed the data; K. W. and K. V. wrote the paper; K. W. had primary responsibility for the final content.
W. F. B. is presently employed by FUGEIA NV, which manufactures the WBE product. None of the other authors had a conflict of interest.