


Aside from temple-pyramids, ballcourts may be the most iconic form of architecture in the Maya lowlands. The ballgame combined sport, spectacle, politics, and religion, unifying “the social and ideological fabric” of Maya society (Scarborough Reference Scarborough, Scarborough and Wilcox1991:130). Scholars have used the presence or absence of a ballcourt to rank Maya sites regionally (De Montmollin Reference De Montmollin1997) and considered ballcourts as urban service facilities that “served to organize and shape ancient behavior,” while archaeologically reflecting “physical infrastructural power” (Chase Reference Chase2021:116). Ashmore (Reference Ashmore1991:200) viewed ballcourts as architectural transition points in Maya city plans, reflecting Classic Maya worldview, and Fox (Reference Fox1996:493) considered ballcourts to be “public arenas in which power relations were negotiated, reproduced, and occasionally transformed through rituals in which the layered symbols of ballgames and feasts were alternately evoked.” Studying the form, dating, and distributions of ballcourts is a way to investigate political centralization versus competition (see Fox Reference Fox1996:489) and “reveal some of the forces at work within and between society” (Scarborough Reference Scarborough, Scarborough and Wilcox1991:130).
As part of the special section on “The Archaeology and Landscapes of the Southeastern Three Rivers Adaptive Region” (Houk et al. Reference Houk, Thompson and Novotny2026), this study compiles data on 26 ballcourts, many of them reported for the first time here. Prior to the use of lidar in the region in the past decade, archaeologists knew little about ballcourt variability and distribution in the eastern half of the Three Rivers adaptive region (TRR). Lohse et alia (Reference Lohse, Sagebiel, Baron and Lohse2013:101) reported 11 ballcourts from seven sites in the northeastern TRR, and, as of 2019, archaeologists had documented only six ballcourts in the southeastern TRR including one at San José (Thompson Reference Thompson1939) and five in the Belize Estates Archaeological Survey Team’s (BEAST) 560 km2 permit area. Of those six, archaeologists had excavated or tested ballcourts at San José (Thompson Reference Thompson1939), Chan Chich (Ford Reference Ford and Houk1998), Punta de Cacao (Robichaux et al. Reference Robichaux, Hartnett, Pruett and Miller2015), and Tikin Ha (Houk et al. Reference Houk, Zaro and Willis2020).
Visual inspections of the 647 km2 block of contiguous lidar data collected by BEAST in 2022 identified 24 probable ballcourts (De Gregori Reference De Gregori2025), to which we add Ball Court 1 at Tikin Ha (see Houk et al. Reference Houk, Zaro and Willis2020), which the lidar survey missed but we had previously mapped (Figure 1). This large sample of ballcourts with high-resolution spatial data affords us an opportunity to examine variability in location, size, type, and orientation in this important type of architecture in the southeastern TRR and to make comparisons to other published data from the rest of the region and adjacent areas (see General Methods in Supplementary Material 1). While De Gregori (Reference De Gregori2025) previously reported ballcourt dimensional and locational data from the BEAST dataset, this report includes new comparative data and statistical analyses.
Map of the BEAST lidar survey, showing major and minor Maya sites and ballcourts (map by Amy E. Thompson). (Color online)

Ballcourts in the Southeastern TRR
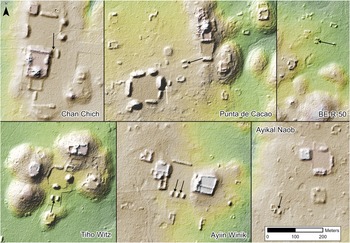
Project staff members identified 20 “new” probable ballcourts in the lidar data, including three at previously recorded sites (Kaxil Uinic, Punta de Cacao, and Ix Naab Witz). Three sites have two ballcourts: Tikin Ha, Ayiin Winik, and Punta de Cacao. Metric data from the ballcourts are presented in Supplementary Material 2. Two (8%) ballcourts are in “rural” locations outside of known civic-centers (Figure 2). While rural ballcourts are rare, Stan Walling et alia (Reference Stanley, Davis, Dias and DeVito2005) documented a Late Classic example at Chawak But’o’ob, a hinterland settlement southwest of Dos Hombres in the northeastern TRR. Our rural ballcourts include BE-R-50, between approximately 1 km from three minor centers (BE-29, BE-35, and BE-36) in the northwestern quarter of the permit area, and BE-R-30, 1.5 km southeast of the minor center of Tiho’witz in the southwest quadrant of the permit area. BE-R-30, which is near the southern edge of the lidar data, may be part of an unrecorded site just outside of our lidar survey area.
Example ballcourts in the BEAST lidar survey. (Color online)

Endzone Plans and Intrasite Locations
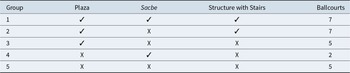
The open-ended ballcourt plan (Figure 3) is the most common style in the assemblage, accounting for 19 of 26 (73%) examples. It is also the only plan found in all intrasite location groups. The other endzone plans are represented by one or two examples. The majority (n = 16; 62%) of ballcourts have intrasite locations that suggest associations with processions (Groups 1 and 4), spectacles (Group 2), or both (Table 1). Ballcourts in plazas but not associated with a sacbe or obvious viewing stands account for 19% (n = 5) of the examples and, given their public locations, may also have been associated with spectacles. Five ballcourts (19%) are outside of plazas and not associated with a sacbe or obvious viewing stands, including Ball Court 2 at Punta de Cacao (see Figure 2), the ballcourts at San José and BE-24, and the two rural ballcourts.
Ballcourt plans in the southeastern TRR: (a) open-ended; (b) open-ended with one axial structure; (c) open-ended with two axial structures; (d) open-ended with one U-shaped terminal structure (after Taladoire Reference Taladoire1981).

Groups Showing Varying Degrees of Ballcourt Integration within Processional Architecture.

Types of Ballcourts
The majority (n = 22, 85%) of ballcourts in the sample are free standing, unattached to other large buildings. Free-standing ballcourts occur in all intrasite location groups. Four ballcourts (15%) have one structure physically attached to a larger structure. Ayiin Winik possesses the only double ballcourt—formed by three mounds and two parallel alleys—in the sample (see Figure 2). Although both types are uncommon, Xultun and La Honradez (Von Euw and Graham Reference Von Euw and Graham1984) in the western TRR each have a double ballcourt that is also attached to a larger structure.
The subject of excavations in 2024, the parallel courts at Ayiin Winik occupy the southern end of Plaza A-1 and date to the Late Classic. De Gregori’s (Reference De Gregori2025) excavations and pXRF analysis detected elevated phosphorus on plaza surfaces around the ballcourts, consistent with residues from food and discard seen at other Maya courts (see Dahlin et al. Reference Dahlin, Bair, Beach, Moriarty, Terry, Staller and Carrasco2010). Although middens are scarce immediately around the court—likely due to post-ceremony sweeping—a midden associated with the adjacent sacbe contained numerous serving vessels, food-preparation tools, and ritual items (e.g., drum fragments and serpentine celt), suggesting communal events tied to the ballgame or processions.
Orientation
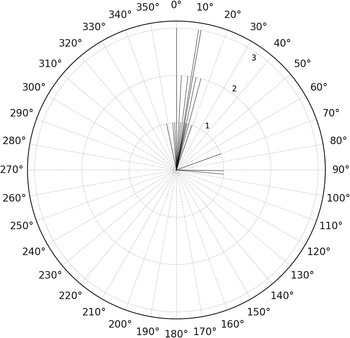
The majority (n = 15; 58%) of ballcourts in the sample are oriented 10° east or west of UTM grid north (Figure 4). Eight ballcourts (31%) are oriented between 10° and 20° east or west of UTM grid north. That 23 (88%) of the ballcourts are aligned within 20° of UTM grid north conforms with the widespread lowland preference for a generally north–south orientation (see Scarborough Reference Scarborough, Scarborough and Wilcox1991:138). Only three ballcourts (11%) have a general east–west orientation, including BE-R-50, a rural ballcourt (see Figure 2).
Orientation of ballcourts in the southeastern TRR.

Size
Alley lengths range between approximately 10.5 m and 20.5 m, with Chan Chich’s playing alley being the single outlier above 30 m; the median and mean lengths are 17 m and 17.9 m, respectively. The widths are less variable, ranging between 3.5 m and 11 m, with a median of 7.5 m and a mean of 7.4 m. The ballcourt at Chan Chich is the largest, featuring the longest and widest playing alley. In contrast, BE-22 has the smallest dimensions, with an alley length of 10.5 m and a width of 3.5 m. Average height of the ballcourt mounds is 3 m. Fourteen ballcourts (54%) are above average, the two tallest being Ball Court 1 at Tikin Ha and the ballcourt at Tiho’witz (see Figure 2), both measuring almost 5 m high. The ballcourts at Gallon Jug, BE-22, and BE-42 are particularly small, with the shortest alley lengths and widths in the dataset. Not surprisingly, they also have the lowest mounds, measuring 1.00–1.25 m high.
The standard deviations (SD) and coefficients of variation (CV) highlight meaningful differences in the degree of dimensional consistency across the dataset. Alley length (SD = 4.03 m; CV = 22.5%) demonstrates the lowest proportional variability, indicating adherence to a relatively stable regional template. Width (SD = 2.07 m; CV = 27.9%) displays greater flexibility, suggesting that lateral dimensions were more readily adapted to local spatial or constructional conditions. Mound height (SD = 0.98 m; CV = 31.7%) exhibits the highest proportional variability, pointing to substantial divergence in how monumental scale was realized.
Comparisons
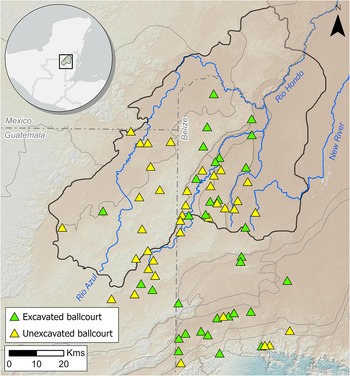
The 26 ballcourts in the southeastern TRR are a large sample to compare to other sites in the TRR and in neighboring areas (Figure 5). We used multiple statistical methods, all described in Supplementary Materials 3–16, to compare architectural variability of the ballcourts in the BEAST dataset to that in ballcourts in the northeastern TRR (n = 10), the western TRR (n = 14), the Belize River Valley (BRV, n = 27), and the Holmul area (n = 11) (De Gregori and Houk Reference De Gregori and Houk2025). We analyzed 88 ballcourts to determine whether regional differences exist in alley and mound dimensions and whether there is a relationship between alley length and width.
Map showing sites in the TRR and neighboring areas with excavated and unexcavated ballcourts (map by Amy E. Thompson). (Color online)

The data show that, while ballcourts across the five regions share many similarities, there are also some important regional differences that reflect local choices in construction and design. Mound dimensions are largely consistent across regions, with comparable average lengths, widths, and heights observed in the TRR, the BRV, and Holmul datasets. While certain areas—such as the western TRR—feature slightly taller mounds, these deviations do not appear to reflect systematic regional differences. Alley length similarly exhibits minimal regional variation. Mean values differ only slightly across regions, and the considerable internal variability within each area, particularly in the BRV, underscores a degree of flexibility in alley design. In contrast, alley width demonstrates clear regional patterning. Ballcourts in the southeastern and western TRR and Holmul area tend to exhibit wider alleys, while those in the northeastern TRR and the BRV are notably narrower. The southeastern TRR data align closely with the Holmul data. Both areas exhibit nearly identical average lengths—17.2 m and 17.3 m, respectively—and very similar average widths (7.44 m versus 7.31 m). Additionally, the maximum lengths (31 m versus 30 m) and widths (11 m versus 12 m) also closely match, suggesting comparable construction practices. Given their geographic connection via the Rio Bravo, these similarities likely reflect shared cultural influences (see Houk Reference Houk2015:276–277).
Correlation and linear regression analyses present varying relationships between alley length and alley width. Only the southeastern TRR exhibits a consistent, proportional relationship between alley length and width. In this area, longer alleys are reliably associated with greater widths, suggesting a more deliberate approach to proportion and symmetry. Elsewhere, this relationship is absent, pointing to greater flexibility or differing priorities in court layout and construction.
Collectively, these results suggest that Maya communities appear to have drawn from a common architectural template while selectively adapting its elements to reflect regional identities and perhaps vernacular ballcourt architecture. The broad uniformity in mound dimensions and alley length indicates widespread adherence to common standards, perhaps tied to the rules of play or shared cultural expectations (see Scarborough Reference Scarborough, Scarborough and Wilcox1991:137). However, the regional distinctions in alley width—and the presence or absence of proportional design—highlight the influence of local traditions, spatial constraints, or divergent ritual practices.
Conclusion
The BEAST lidar dataset has more than tripled the number of known ballcourts in the southeastern TRR and revealed a density of one ballcourt per 26 km2. Most ballcourts are open ended, freestanding, and located in civic-ceremonial cores, often associated with processional architecture or in public plazas. While alley width varies significantly across adjacent regions—with southeastern TRR ballcourts being notably wider than those in the BRV—no significant differences were found in alley length or mound dimensions. A strong, significant correlation between alley length and width was found only within the BEAST dataset, suggesting localized architectural standardization. However, wide scatter in the regression models and limited predictive accuracy highlight the complexity of interpreting ballcourt dimensions across regions. These findings underscore the value of lidar in identifying and analyzing architectural patterns, while also pointing to the need for further excavation and contextual study to fully understand the social and political roles of ballcourts in Maya cities.
Acknowledgments
We would like to thank the Belizean Institute of Archaeology for permitting our research in the area and the Alphawood Foundation for funding the 2022 lidar acquisition and 2024 excavations. Andrew Kinkella and two anonymous reviewers provided helpful peer review.
Funding Statement
The Alphawood Foundation funded this research.
Data Availability Statement
Data used in this report are on file with Brett A. Houk and maintained at Texas Tech University.
Competing Interests
The authors declare none.
Supplementary Material
The supplementary material for this article can be found at https://doi.org/10.1017/laq.2026.10176.
Supplementary Material 1. General and Statistical Methods (text).
Supplementary Material 2. Descriptive Statistics of Ballcourts (table).
Supplementary Material 3. Map showing sites in the Three Rivers Region and neighboring areas with and without ballcourts, with names. Base map by Amy E. Thompson (figure).
Supplementary Material 4. Linear relationship between playing alley width and length among ballcourts in the (a) southeastern TRR, (b) northeastern TRR, (c) western TRR, (d) Belize River Valley, and (e) Holmul region (figure).
Supplementary Material 5. Shapiro-Wilk Test of Normality (table).
Supplementary Material 6. Levene’s Homogeneity Test (table).
Supplementary Material 7. One-Way ANOVA Results (table).
Supplementary Material 8. Kruskal-Wallis Results (table).
Supplementary Material 9. One-Way ANOVA Effect Size (table).
Supplementary Material 10. Post hoc Test for Playing Alley Width (table).
Supplementary Material 11. Mann-Whitney U Results for Playing Alley Width (table).
Supplementary Material 12. Correlation Results (table).
Supplementary Material 13. Correlation Intervals (table).
Supplementary Material 14. R Squared (table).
Supplementary Material 15. ANOVA Regression and Residuals Results (table).
Supplementary Material 16. Correlation Coefficients (table).




 Open access

