

In 2014, the WHO( 1 ) reported that, worldwide, 39 % of adults over 18 years of age were overweight and 13 % were obese. Obesity is one of the most important health concerns, as a major risk factor for the metabolic syndrome, type 2 diabetes mellitus (T2DM), CVD, chronic kidney disease (CKD) and some cancers( Reference Rosengren, Wedel and Wilhelmsen 2 – Reference de Mutsert, Sun and Willett 4 ). Recently, the number of patients with T2DM has increased markedly, in association with increased obesity, in many countries. The International Diabetes Federation estimated that 382 million people had diabetes worldwide in 2013, and this number was predicted to approach 592 million by 2035( Reference Guariguata, Whiting and Hambleton 5 ). T2DM leads to various complications affecting the eyes, kidneys, heart, blood vessels, nerves and teeth. Moreover, in patients with T2DM, there are race-associated differences in the incidence of these complications and in their risk factors. Of patients with T2DM, diabetic renal disease and dialysis dependence are more common in African-Americans and Asians than in Caucasians, whereas CVD is more common in Caucasians than in other races( Reference Young, Maynard and Boyko 6 ). Indeed, in Japan, diabetic nephropathy, occurring in approximately 42 % of those with T2DM, is the most prevalent cause of end-stage renal disease( Reference Yokoyama, Kawai and Kobayashi 7 ). Furthermore, Neuschwander-Tetri & Caldwell( Reference Neuschwander-Tetri and Caldwell 8 ) reported that T2DM induced certain forms of fatty liver in 75 % of patients. Recent reports suggested that non-alcoholic fatty liver disease (NAFLD) is closely related to CKD, although the mechanism underlying this relationship is not known( Reference Targher, Bertolini and Rodella 9 – Reference Orlić, Mikolasevic and Bagic 11 ).
Restricting dietary protein intake is believed to be an effective nutritional intervention to delay progression of kidney disease, including diabetic nephropathy( Reference Ciavarella, Di Mizio and Stefoni 12 – Reference Hansen, Tauber-Lassen and Jensen 14 ). However, some reports identified no clear beneficial effects of protein restriction on kidney function( Reference Robertson, Waugh and Robertson 15 , Reference Otoda, Kanasaki and Koya 16 ), and thus the effectiveness of this diet in kidney disease remains controversial. Recently, some studies focused on manipulating dietary protein quality instead of reducing protein intake, in particular replacing animal protein with vegetable protein( Reference Williams and Wallis 17 – Reference Trujillo, Ramírez and Pérez 21 ).
Rice is an important food in most Asian countries, serving as a primary energy and protein source. According to a National Health and Nutrition Survey in Japan ( 22 ), Japanese people in their 20s receive 12·8 % of their daily protein intake from rice. This is the third highest contribution to their protein intake following meat and fish, and twice the amount of protein obtained from soya. Various reports described beneficial effects of rice endosperm protein (REP), through promoting improved lipid metabolism( Reference Morita, Oh-hashi and Kasaoka 23 – Reference Um, Ahn and Jung 25 ) and suppressing oxidative stress( Reference Yang, Chen and Xu 26 , Reference Cai, Yang and He 27 ). In addition, we reported that REP, compared with casein (C), ameliorated progression of early diabetic nephropathy in non-obese, spontaneous type 2 diabetic Goto–Kakizaki (GK) rats, an animal model for the non-obese T2DM seen in most Asian patients( Reference Kubota, Watanabe and Kabasawa 28 ). However, because these rats did not show apparent abnormalities in glucose homoeostasis and hepatic lipid accumulation, we were unable to demonstrate the effects of REP on symptoms of obese T2DM, including metabolic links between the liver and kidney. An alternative animal model mimicking the obese T2DM prevalent in Caucasians would be required to investigate the universal effects of REP on diabetes.
The aim of the present study, therefore, was to clarify the effects of REP on fatty liver, glucose homoeostasis and diabetic nephropathy in Zucker diabetic fatty (ZDF) rats, an animal model for obese T2DM. Our results showed that dietary REP markedly suppressed lipid accumulation in the liver and ameliorated important metabolic parameters of glucose homoeostasis, such as HbA1c levels, and delayed progression of renal failure in ZDF rats.
Methods
Materials
REP with more than 80 % crude protein (CP) was prepared using an alkali extraction method reported by Kumagai et al.( Reference Kumagai, Kawamura and Fuse 29 ) The CP content of REP was analysed by the Kjeldahl method using an N-to-protein factor of 5·95( Reference Miller and Houghton 30 ). C was from Funabashi Farm Co.
Animal experiments
In total, 6-week-old male ZDF (Lepr fa/fa ) rats, weighing 160–180 g each, and their control lean ZDF (Lepr fa/+ or +/+ , Lean) rats, weighing approximately 130 g each, were from Charles River Laboratories Japan, Inc. The Lean rats were used as non-diabetic controls to assess all experimental parameters in healthy rats. Rats were housed in individual stainless steel cages with wire screen bottoms in a room under controlled temperature (22±2°C) and lighting (lights on from 06.00 to 18.00 hours). To allow them to adapt to housing conditions, rats were fed commercial pellets (Labo MR Stock; Nosan) for 1 week before the start of the experiment. After adaptation, the ZDF rats were divided into two groups on the basis of their body weights and fasting blood glucose levels (eight ZDF rats per group) and fed experimental diets, using either REP or C as a protein source, for 8 weeks (Table 1). The ZDF rats fed the REP diet and Lean rats fed the C diet were allowed free access to the diet, whereas the ZDF rats fed the C diet were limited to the same amount of diet, by weight, consumed by the REP group the day before. The reason for this feeding protocol was that, in our preliminary study (data not shown), ZDF rats in the REP group had slightly lower food consumption than did those in the C group. Therefore, food intake of ZDF rats was controlled because differences in energy intake could critically affect results, including the diabetic symptoms. Body weights were measured every other day and food intake was measured each morning before feeding. To collect urine, rats were transferred to individual metabolic cages for 2 d before the experiment (0 week), and at 4, 6 and 8 weeks. Urine samples were stored at −80°C until analysis. At the end of the experiment, after 18 h of fasting, rats were anaesthetised with sodium pentobarbitone (50 mg/kg body weight), blood samples were withdrawn from the inferior vena cava using heparinised syringes and the rats were euthanised by exsanguination. A portion of the collected blood was used for HbA1c analysis and the remainder was centrifuged at 9500 g for 3 min to collect plasma, which was stored at −40°C until analysis. The viscera were collected and weighed. The livers and right kidneys were immediately frozen in liquid N2 and stored at −80°C until analysis. The left kidneys were immediately fixed for histology. All animal experiments were reviewed by the Institutional Animal Care and Use Committee and approved by the President of Niigata University (permit number: 24 Niigata Univ. Res. 93-13).
Composition of the experimental dietsFootnote *

C, casein diet; REP, rice endosperm protein diet.
* Experimental diets were prepared according to the AIN-93G formula( Reference Reeves, Nielsen and Fahey 31 ).
† The crude protein in casein and rice endosperm protein was 83·4 and 90·9 %, respectively.
‡ AIN-93G mineral mix( Reference Reeves, Nielsen and Fahey 31 ).
§ AIN-93G vitamin mix( Reference Reeves, Nielsen and Fahey 31 ).
Analysis of blood parameters
Blood parameter analysis was conducted as described previously( Reference Kubota, Watanabe and Kabasawa 28 ). Fasting blood glucose levels were measured each week in blood collected from the tail vein after 18 h of fasting, using the Medisafe GR-102 blood glucose meter (Terumo). Fasting blood insulin and adiponectin levels were measured at the end of the experimental period using an ultrasensitive rat insulin kit (Morinaga Biological Science) and a mouse/rat adiponectin ELISA kit (Otsuka Pharmaceuticals), respectively. HbA1c was measured using an HbA1c analyser (DCA2000; Bayer HealthCare). Other blood parameters were measured using a Roche/Hitachi Modular System (Roche). The homoeostasis model assessment of insulin resistance index (HOMA-IR) was calculated from fasting glucose and insulin levels according to the formula glucose (mmol/l)×insulin (pmol/l)/3·4.
Analysis of hepatic lipids
Extraction of total lipid (TL) from the liver was performed by the Folch method( Reference Folch, Lees and Sloane-Stanley 32 ). Each liver sample (0·5 g) was homogenised and the lipids extracted in chloroform–methanol (2/1, v/v). The lower layer was filtered through filter paper and the filtrate volume was adjusted to 25 ml with the chloroform–methanol solvent. The resulting solution was considered to contain the TL fraction of the liver. TL in the liver was gravimetrically measured after evaporating the solvent in an evaporator (Rotavapor R-114; Sibata Scientific Technology Ltd). To determine TAG and total cholesterol (TC) levels in the liver, aliquots of the TL solution (20 and 50 μl, respectively) were dried under reduced pressure. After resuspension of each dried sample in 20 µl of 10 % Triton X-100 in isopropanol, TAG and TC were measured spectrophotometrically with commercial assay kits (triglyceride E-test Wako and cholesterol E-test Wako, respectively; Wako Pure Chemicals).
Analyses of the liver metabolome
Approximately 50 mg of frozen tissue was rapidly immersed in acetonitrile–Milli-Q water (1/1, 1500 µl; Merck Millipore Co.) containing internal standards (H3304-1002; Human Metabolome Technologies Inc.) at 0°C to inactivate enzymes. The tissue was homogenised three times at 1500 rpm for 120 s with a tissue homogeniser (Micro Smash MS-100R; Tomy Digital Biology Co. Ltd) and the homogenate was centrifuged at 2300 g at 4°C for 5 min. Subsequently, the upper aqueous layer (800 µl) was centrifugally filtered through a Millipore 5-kDa cutoff filter (Merck Millipore Co.) at 9100 g at 4°C for 120 min to remove proteins. The filtrate was then centrifugally concentrated and resuspended in Milli-Q water (50 µl) for capillary electrophoresis time-of-flight MS (CE-TOFMS) analysis. Metabolome measurements were conducted through a facility service at Human Metabolome Technology Inc.
Analysis of kidney function and morphology
Urinary albumin excretion (UAE), a parameter indicating early diabetic nephropathy, was determined using a Rat Albumin EIA kit (Panapharm Laboratories) to assess progression of diabetic nephropathy in ZDF rats. N-acetyl-β-d-glucosaminidase (NAG), used as a marker of proximal tubular damage, was measured spectrophotometrically using an NAG Rate Test kit (Shionogi & Co. Ltd).
To assess histological damage, the left kidneys were fixed in 4 % paraformaldehyde phosphate buffer solution (Wako) immediately after collection from the rats. Kidneys were embedded in paraffin, cut into 4 μm sections and stained with periodic acid–Schiff (PAS) stain. Morphological observations were conducted on 10 randomly selected glomeruli per section, selected from among those not sectioned at their vascular poles or artificially compressed, in the juxtamedullary cortex of each rat. Degrees of glomerular mesangial matrix area were determined as mesangial matrix scores by assessing the ratio of the mesangial PAS-positive and nucleus-free area in each glomerular area. Mesangial matrix and glomerular areas were measured using Image-Pro (Media Cybernetics Inc.). An investigator blinded to sample identity performed the image analysis.
Statistical analysis
Results are expressed as mean values with their standard errors. Statistical comparisons were conducted between ZDF rat groups, using the Student’s t test. The criterion for significance was P<0·05. Principal component analysis (PCA) of the metabolome measurements was performed by Human Metabolome Technologies’ proprietary software, SampleStat version 3.14.
Results
Growth performance
The growth performance of ZDF and Lean rats is shown in Table 2. The final body weights and weight gains of REP-fed ZDF rats were 8·5 and 17·8 % higher, respectively, than those of C-fed ZDF rats (P<0·01). The mean liver weight of ZDF rats was almost double that of Lean rats, but that of REP-fed ZDF rats was 21·7 % lower than that of C-fed ZDF rats (P<0·01). These results predicted that ZDF rats would have excess hepatic lipid accumulation and that REP feeding would suppress this more effectively than C feeding. Polyuria is one of the typical symptoms of diabetes, and ZDF rats had much more urine excretion than Lean rats, with massive water consumption, after 6 weeks (data not shown). REP feeding suppressed urine excretion significantly compared with C feeding (P<0·01), indicating a slowed progression of diabetes. Fat depots in ZDF rats were the same size in both diet groups, and more than double those in Lean rats. This clearly demonstrated the obesity in ZDF rats.
Growth performance (Values are means with their standard errors, n 6–8 per group)
ZDF, Zucker diabetic fatty; C, ZDF rats fed a casein diet; REP, ZDF rats fed a rice endosperm protein diet; L, Lean rats fed a casein diet.
** Significantly different within the ZDF rat groups (P<0·01).
† Fat depots (g)=epididymal fat depots (g)+perirenal fat depots (g).
Effect of rice endosperm protein on glucose homoeostasis and blood parameters
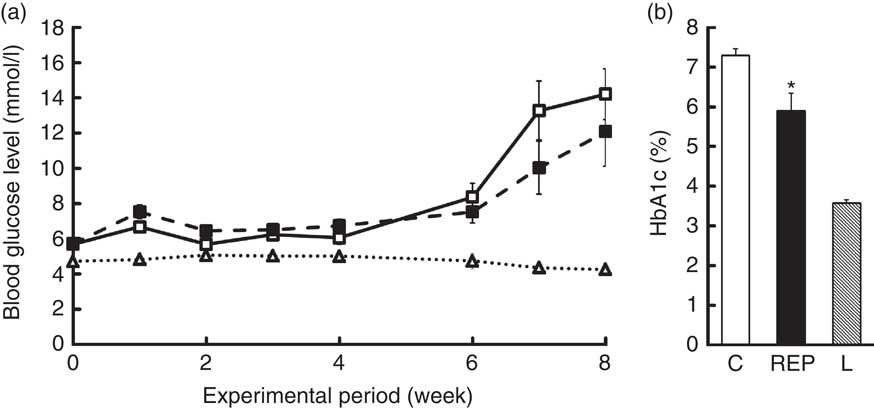
Fasting blood glucose levels were monitored for 8 weeks (Fig. 1(a)). Blood parameter values are shown in Table 3. The blood glucose levels of ZDF rats markedly increased from 6 to 8 weeks, with no significant differences between the two feeding groups. HbA1c levels in the C group at 8 weeks were about twice those of non-diabetic animals, whereas the REP group showed significantly suppressed HbA1c levels, with a mean 19·2 % lower than that of the C group (P<0·05, Fig. 1(b)). However, there were no significant differences in plasma levels of insulin and adiponectin in the two ZDF groups (Table 3). REP tended to suppress HOMA-IR, one of the indexes for insulin resistance, by 32 % (C v. REP: 100·0 (sem 15·2) v. 67·6 (sem 9·7) %, P=0·076). There were no differences in plasma total protein and albumin concentrations in the two ZDF groups. This suggested that REP was not inferior to C in its protein nutritional value. The finding that aspartate aminotransferase and alanine aminotransferase levels in both ZDF groups were much higher than in rats under non-diabetic or non-obese conditions indicated the presence of serious liver damage. ZDF rats fed REP had lower alkaline phosphatase (ALP) levels, by 19·3 %, than those fed C (P<0·05). Plasma creatinine, a standard marker for kidney function, was no different in the two ZDF rat feeding groups. Blood urea nitrogen (BUN), another marker for kidney function in CKD, was 28·4 % lower in the REP group than in the C group (P<0·01). In contrast, in our previous report, REP did not affect BUN in GK rats( Reference Kubota, Watanabe and Kabasawa 28 ).
Effects of rice endosperm protein (REP) on fasting blood glucose and HbA1c levels in Zucker diabetic fatty (ZDF) rats. ZDF rats at 7 weeks of age were fed a casein (C) or an REP diet for 8 weeks. Blood samples were collected after 18 h of fasting once per week. (a) Fasting blood glucose levels were measured every week. ![]() and
and ![]() , ZDF rats fed C and REP diets, respectively;
, ZDF rats fed C and REP diets, respectively; ![]() , Lean (L) rats fed a C diet. (b) HbA1c levels were measured at 8 weeks.
, Lean (L) rats fed a C diet. (b) HbA1c levels were measured at 8 weeks. ![]() ,
, ![]() and
and ![]() , data from C, REP and L groups, respectively. Values are means (n 7–8 per group), with their standard errors represented by vertical bars. * Significantly different between the C and REP groups (P<0·05).
, data from C, REP and L groups, respectively. Values are means (n 7–8 per group), with their standard errors represented by vertical bars. * Significantly different between the C and REP groups (P<0·05).
Effects of Zucker diabetic fatty (ZDF) rats fed a rice endosperm protein diet (REP) on blood and urine parameters in ZDF ratsFootnote † (Mean values with their standard errors, n 6–8 per group)
C, ZDF rats fed a C diet; L, Lean rats fed a C diet; AST, aspartate aminotransferase; ALT, alanine aminotransferase; ALP, alkaline phosphatase; LD, lactate dehydrogenase; LAP, leucine aminopeptidase; Cre, creatinine; BUN, blood urea nitrogen; TC, total cholesterol.
Mean values were significantly different between the C and REP groups: * P<0·05 and ** P<0·01.
† Blood samples were withdrawn after 18 h of fasting at 8 weeks. Urine sampling was conducted with rats in metabolic cages for 2 d at the end of the experimental period.
Effect of rice endosperm protein on lipid accumulation in the liver
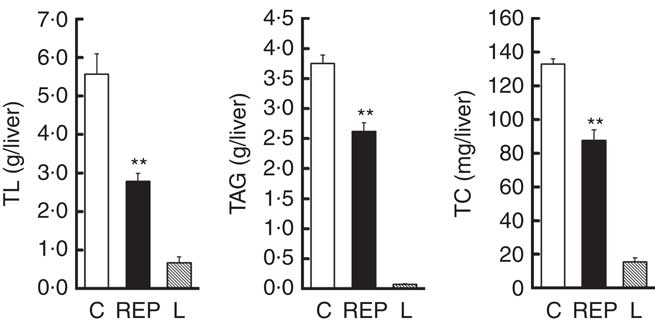
There was extremely high hepatic lipid accumulation in ZDF rats, as shown in Fig. 2. This effect was much greater than in GK rats( Reference Kubota, Watanabe and Kabasawa 28 ). NAFLD is defined as having lipid accumulation in the liver exceeding 5–10 % by weight( Reference Neuschwander-Tetri and Caldwell 8 ). On the basis of this definition, both ZDF groups clearly exhibited NAFLD, with hepatic lipid percentages in the C and REP groups of 22·7 and 14·1 %, respectively. In ZDF rats, REP had a markedly suppressive effect on accumulation of these lipids, with TL, TAG and TC levels that were 50·1, 30·1 and 34·0 %, respectively, lower than those in the C group (P<0·01).
Effects of rice endosperm protein (REP) on lipid accumulation in the livers of Zucker diabetic fatty (ZDF) rats. Livers were collected at the end of the experiment and subjected to lipid analyses. After chloroform–methanol extraction, total lipid (TL), TAG and total cholesterol (TC) were measured by gravimetric and spectrophotometric methods. ![]() and
and ![]() , ZDF rats fed casein (C) and REP diets, respectively;
, ZDF rats fed casein (C) and REP diets, respectively; ![]() , Lean (L) rats fed the C diet. Values are means (n 6–8 per group), with their standard errors represented by vertical bars. ** Significantly different between the C and REP groups (P<0·01).
, Lean (L) rats fed the C diet. Values are means (n 6–8 per group), with their standard errors represented by vertical bars. ** Significantly different between the C and REP groups (P<0·01).
Effects of rice endosperm protein on metabolite profiles in the liver
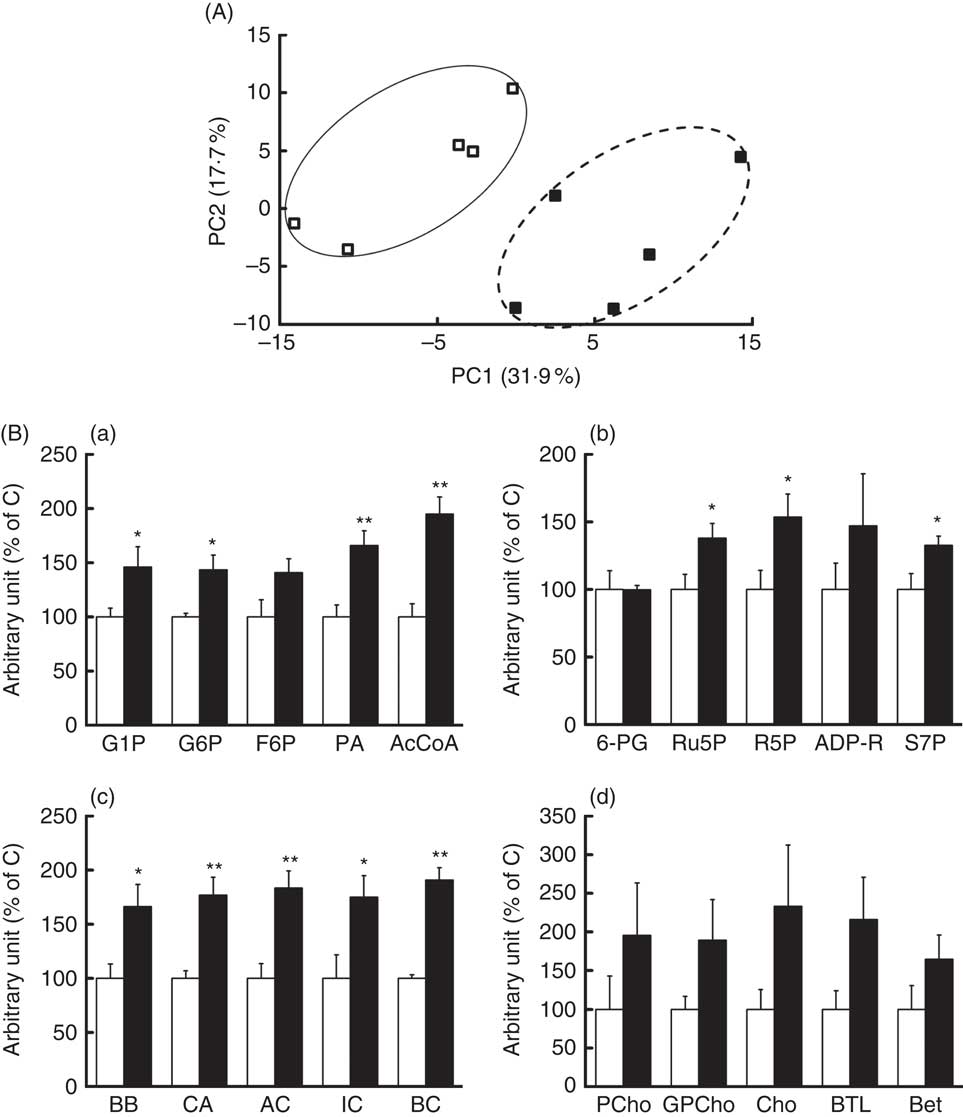
To investigate the mechanism of suppression of hepatic lipid accumulation by REP, metabolic profiles in pooled liver extracts from the C and REP groups were first analysed by CE-TOFMS and liquid chromatography-TOFMS. In these preliminary analyses, only CE-TOFMS showed apparent changes associated with metabolic pathways (data not shown). For definitive statistical evaluation, we then re-analysed the water-soluble hepatic metabolites from each rat using CE-TOFMS. We detected 221 metabolites, and PCA analysis showed clearly different metabolic profiles in the two groups (Fig. 3(A)). The REP group significantly differed from the C group in fifty-five metabolites (P<0·05). Fig. 3(B) shows changes in representative metabolites involved in several metabolic pathways. Increases in some metabolites associated with glycolysis (a), pentose phosphate pathways (b), carnitine metabolism (c) and choline metabolism (d) were observed in the REP group. As shown in Fig. 3(B(a)), glucose-1-phosphate, glucose-6-phosphate, pyruvic acid and acetyl-CoA levels were increased in response to REP feeding, showing stimulation of glycolysis. Ribulose-5-phosphate, ribose-5-phosphate and sedoheptulose-7-phosphate were also increased in the REP group (Fig. 3(B(b)), P<0·05), suggesting acceleration of the pentose phosphate pathway, another glucose-consuming process. The increases in carnitine, butyrobetaine (a precursor of carnitine) and short-chain acylcarnitines in the REP group were 1·7–1·9-fold their levels in the C group (Fig. 3(B(c)), P<0·05). Metabolites involved in the choline/betaine pathway showed a tendency to be increased with REP, but this was not statistically significant (Fig. 3(B(d))).
Effects of rice endosperm protein (REP) on metabolites in the livers of Zucker diabetic fatty (ZDF) rats. Livers were collected at the end of the experiment and extracted with 50 % acetonitrile–Milli-Q water. Water-soluble metabolites in the livers of ZDF rats were analysed using capillary electrophoresis time-of-flight MS (CE-TOFMS). (A) Principal component analysis on CE-TOFMS data from the livers of ZDF rats. PC1, first principal component; PC2, second principal component. Each symbol represents data from an individual rat. ![]() and
and ![]() , Data from ZDF rats fed casein (C) and REP diets, respectively. (B) Distinct metabolites identified in CE-TOFMS data. (a) AcCoA, acetyl-CoA; F6P, fructose-6-phosphate; G1P, glucose-1-phosphate; G6P, glucose-6-phosphate; PA, pyruvic acid. (b) ADP-R, ADP-ribose; R5P, ribose-5-phosphate; Ru5P, ribulose-5-phosphate; S7P, sedoheptulose-7-phosphate; 6-PG, 6-phosphogluconic acid. (c) AC, acetylcarnitine; BB, butyrobetaine; BC, butyrylcarnitine; CA, carnitine; IC, isovalerylcarnitine. (d) Bet, betaine; BTL, betaine aldehyde; Cho, choline; GPCho, glycerophosphocholine; PCho, phosphorylcholine.
, Data from ZDF rats fed casein (C) and REP diets, respectively. (B) Distinct metabolites identified in CE-TOFMS data. (a) AcCoA, acetyl-CoA; F6P, fructose-6-phosphate; G1P, glucose-1-phosphate; G6P, glucose-6-phosphate; PA, pyruvic acid. (b) ADP-R, ADP-ribose; R5P, ribose-5-phosphate; Ru5P, ribulose-5-phosphate; S7P, sedoheptulose-7-phosphate; 6-PG, 6-phosphogluconic acid. (c) AC, acetylcarnitine; BB, butyrobetaine; BC, butyrylcarnitine; CA, carnitine; IC, isovalerylcarnitine. (d) Bet, betaine; BTL, betaine aldehyde; Cho, choline; GPCho, glycerophosphocholine; PCho, phosphorylcholine. ![]() and
and ![]() , Data from ZDF rats fed C and REP diets, respectively. The data from the REP group are shown as values relative to those from the C group. Values are means (n 4–5 per group), with their standard errors represented by vertical bars. Significantly different between the C and REP groups: * P<0·05, ** P<0·01.
, Data from ZDF rats fed C and REP diets, respectively. The data from the REP group are shown as values relative to those from the C group. Values are means (n 4–5 per group), with their standard errors represented by vertical bars. Significantly different between the C and REP groups: * P<0·05, ** P<0·01.
Effect of rice endosperm protein on kidney function
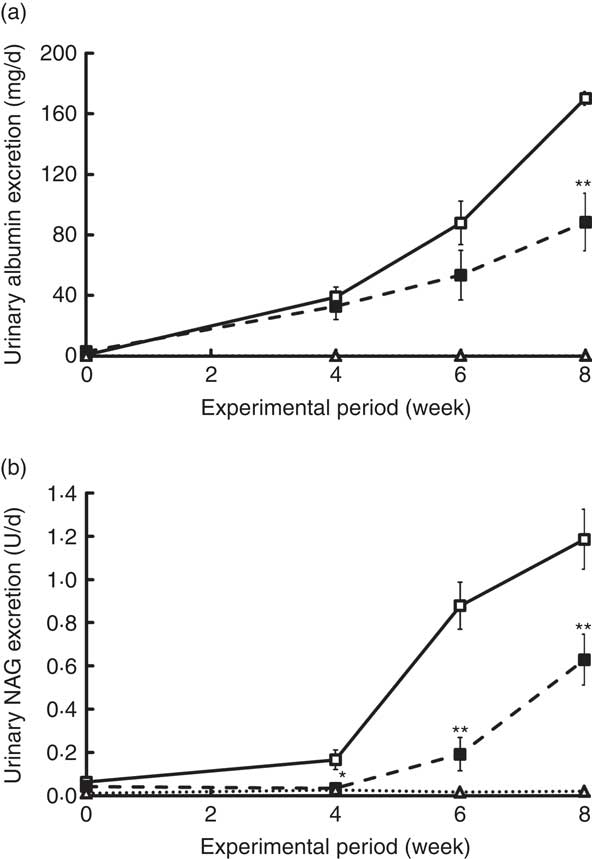
Changes in UAE and NAG excretion are shown in Fig. 4. UAE is caused by dysfunction of the glomerular podocyte filtration barrier or reabsorption in the renal tubule and is an important marker for assessing progression of diabetic nephropathy. UAE in the ZDF rats increased markedly beginning at 4 weeks, eventually exceeding 170 mg/d in the C group at the end of the experiment (Fig. 4(a)). Because UAE in ZDF rats was much higher than that previously observed in GK rats( Reference Kubota, Watanabe and Kabasawa 28 ), <650 μg/d at 10 weeks, ZDF rats developed a much more advanced-stage diabetic nephropathy in this study. Despite the severe damage, UAE at 8 weeks in the REP group was 50 % lower than that in the C group (P<0·01). NAG excretion, a sensitive, persistent and robust urinary marker for proximal tubule damage( Reference Moresco, Sangoi and De Carvalho 33 ), was also significantly suppressed in the REP group from 4 weeks until the end of the experiment (Fig. 4(b), P<0·05). The kidneys play an important role in P homoeostasis via excretion and reabsorption. Urinary P excretion in the REP group was 1/8 that in the C group (P<0·01), although there was no change in blood concentration of P (Table 3).
Effects of rice endosperm protein (REP) on urinary excretion of albumin and N-acetyl-β-d-glucosaminidase (NAG) in Zucker diabetic fatty (ZDF) rats. Urine was collected in metabolic cages for 2 d at 0, 4, 6 and 8 weeks. Urinary excretion of albumin (a) and NAG (b) was measured by ELISA and spectrophotometric analysis, respectively. ![]() and
and ![]() , ZDF rats fed casein (C) and REP, respectively;
, ZDF rats fed casein (C) and REP, respectively; ![]() , Lean rats fed a C diet. Values are means (n 6–8 per group), with their standard errors. Significantly different between the C and REP groups: * P<0·05, ** P<0·01.
, Lean rats fed a C diet. Values are means (n 6–8 per group), with their standard errors. Significantly different between the C and REP groups: * P<0·05, ** P<0·01.
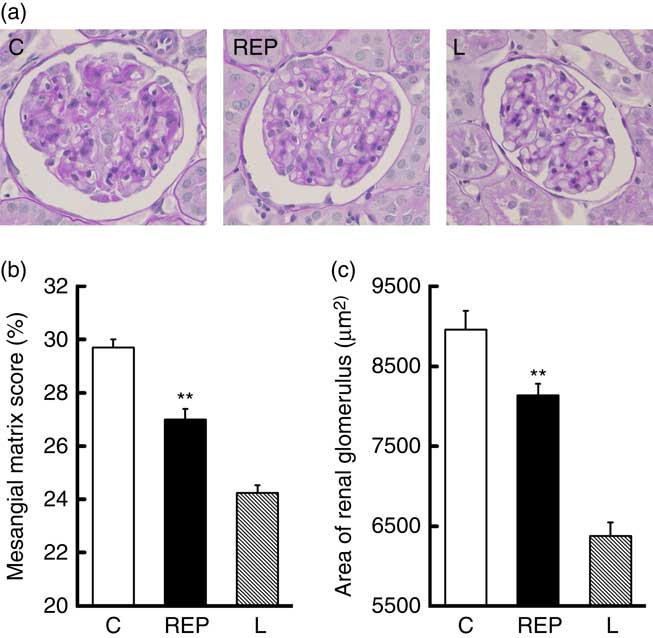
Next, we performed morphological observations of the renal glomeruli. Typical images of glomeruli are shown in Fig. 5(a). Mesangial matrix expansion in the glomeruli, a typical histological abnormality in diabetic nephropathy, was more evident in the C group than in the REP group (Fig. 5(b), P<0·01), and the mean area of the glomerulus was also higher in the C group (Fig. 5(c), P<0·01). These results provided clear evidence that REP was renoprotective in this obese rat model of T2DM, as it was in GK rats( Reference Kubota, Watanabe and Kabasawa 28 ).
Effects of rice endosperm protein (REP) on morphology of kidney tissue from Zucker diabetic fatty (ZDF) rats. Kidneys were harvested at the end of the experiment and immediately fixed with 4 % paraformaldehyde in phosphate buffer. Samples were sectioned (4 µm) and stained with periodic acid–Schiff stain. A typical image from each group is shown in (a). The mesangial matrix score (b) and glomerular area (c) were measured using Image-Pro. ![]() and
and ![]() , Data from ZDF rats fed casein (C) and REP diets, respectively;
, Data from ZDF rats fed casein (C) and REP diets, respectively; ![]() , data from Lean (L) rats fed a C diet. Values are means (n 8 per group), with their standard errors represented by vertical bars. ** Significantly different between the C and REP groups (P<0·01).
, data from Lean (L) rats fed a C diet. Values are means (n 8 per group), with their standard errors represented by vertical bars. ** Significantly different between the C and REP groups (P<0·01).
Discussion
ZDF rats, an animal model for spontaneous obese T2DM, are produced by selective breeding of Zucker rats that have a mutation in the leptin receptor( Reference Peterson, Shaw and Neel 34 ). ZDF rats develop hyperglycaemia, hyperinsulinaemia and hyperlipidaemia by 13 weeks of age, followed by various complications such as diabetic nephropathy( Reference Peterson, Shaw and Neel 34 , Reference Mega, de Lemos and Vala 35 ). In fact, recent studies used ZDF rats to assess the effects of food components and bioactive compounds against diabetes and its complications( Reference Agil, Rosado and Ruiz 36 – Reference Salmanoglu, Gurpinar and Vural 40 ). We therefore selected ZDF rats as an appropriate animal model for assessing the effects of dietary REP on T2DM and its complications caused by obesity. In this study, we confirmed that ZDF rats developed T2DM, as evidenced by blood glucose, insulin and TAG levels that were markedly higher than those of Lean rats (Fig. 1 and Table 3).
Although, previously, REP did not affect blood glucose control in GK rats( Reference Kubota, Watanabe and Kabasawa 28 ), REP substantially decreased HbA1c levels in ZDF rats. It is likely that the discrepancy between the two studies, using GK and ZDF rats, respectively, was caused by differences in their elevations of glucose – that is, the level in GK rats (<7·8 mmol/l) was not sufficiently high to detect any effects of REP. Results of the hepatic metabolome analysis (Fig. 3) suggested that the metabolites involved in glycolysis and the pentose phosphate pathway were increased in ZDF rats fed REP. Effects on both metabolic pathways might lead to stimulation of glucose consumption in the liver. In addition, with REP feeding, carnitine, synthesised primarily in the liver and kidneys, was significantly higher in the liver (Fig. 3), and this might have contributed to improved glucose metabolism in that group. In fact, Salmanoglu et al.( Reference Salmanoglu, Gurpinar and Vural 40 ) reported that carnitine supplementation suppressed fasting blood glucose levels in streptozotocin-induced diabetic rats fed a high-fat diet. Although the mechanism underlying REP effects on blood glucose control was not identified in this study, the high content of arginine in REP (2·5 times higher than in C)( Reference Kubota, Watanabe and Kabasawa 28 ) may have played a role. Fu et al.( Reference Fu, Haynes and Kohli 41 ) reported that high-level supplementation with arginine (five times higher than in the control group) significantly reduced blood glucose levels, without increasing serum insulin, in ZDF rats. Jobgen et al.( Reference Jobgen, Meininger and Jobgen 42 ) reported that substantial arginine supplementation (five times higher than in the control group) decreased white fat mass and blood glucose levels in a diet-induced obesity rat model. It seems likely that the high arginine content in REP partially contributed to its suppression of HbA1c levels though the arginine intake in our study was less than those used by the other investigators. The decreased plasma ALP levels in animals consuming REP in our study agreed with previous results in GK rats( Reference Kubota, Watanabe and Kabasawa 28 ). This reduction implied suppression of T2DM progression and inflammation because, in some cohort studies, serum ALP activity was significantly correlated with C-reactive protein, an inflammation marker, and with a higher incidence of diabetes( Reference Cheung, Ong and Cheung 43 , Reference Webber, Krishman and Thomas 44 ). REP also reduced plasma TC levels in ZDF rats, a result consistent with our previous findings in normal and GK rats( Reference Yang, Kumagai and Kawamura 24 , Reference Kubota, Watanabe and Kabasawa 28 ). In addition, the final body weights and body weight gains were significantly increased in rats consuming REP, compared with C (Table 2). We recognised that these findings reflected improvement in the diabetic condition of rats in the REP group because weight loss is one characteristic of advanced T2DM. Brockman et al.( Reference Brockman, Chen and Gallaher 37 ) reported that barley flour with high β-glucan improved blood glucose control and reduced fatty liver in ZDF rats and that the body weights of the barley flour group were higher than those of an obese control group. Suppressed body weight gain in the C group may represent increased energy loss into urine because, in another study, we found that ZDF rats fed the C diet had markedly increased urinary glucose excretion at 6 weeks compared with those fed the REP diet (2549·6 (sem 740·4) v. 4·6 (sem 0·6) mg/d, respectively).
REP strongly suppressed accumulation of lipids, including TL, TAG and TC, in the livers of ZDF rats (Fig. 2), although we did not previously observe this effect in GK rats. This discrepancy between studies may be attributed to the greater degree of lipid accumulation in ZDF compared with that in GK rats. Insulin resistance and hyperinsulinaemia are considered to be important factors for the pathogenesis of NAFLD. REP consumption might improve insulin resistance because ZDF rats fed the REP diet had significantly reduced HbA1c levels (Fig. 1). They also showed a tendency for improved HOMA-IR, as compared with those fed the C diet (P=0·076). Thus, it may be inferred that REP decreased hepatic lipid accumulation by improving insulin resistance. To identify potential alternative mechanisms of hepatic lipid accumulation suppression, hepatic metabolome analysis was performed. REP significantly increased levels of carnitine and its derivatives, which are involved in the transfer of long-chain fatty acids into mitochondria (Fig. 3(B(c))). Supplementation with carnitine was reported to increase mRNA expression of carnitine palmitoyltransferase, a key enzyme in fatty acid oxidation, in the liver of a non-alcoholic steatohepatitis–cirrhosis–hepatocarcinogenic mouse model( Reference Ishikawa, Takaki and Tsuzaki 45 ). This indicated that increased carnitine in the REP group activated β-oxidation of fatty acids, preventing lipid accumulation in the liver. It was reported that, in mice, supplementation with betaine, which also reduced lipid accumulation in the liver, significantly increased carnitine and low-molecular-weight acylcarnitine in the muscle( Reference Pekkinen, Olli and Huotari 46 ). In our study, some metabolites of the choline/betaine pathway in the REP group were increased 1·6–2·3-fold compared with levels in the C group, although this effect was not statistically significant (Fig. 3(B(d)): P=0·14, 0·06 and 0·14 for choline, betaine aldehyde and betaine, respectively). Thus, the increase in carnitine levels might have been caused by activation of the choline/betaine pathway in the REP group.
Our study also showed that REP decreased UAE and NAG excretion and delayed progression of renal damage (Fig. 4 and 5). These beneficial effects of REP on diabetic nephropathy, a common feature of obese and non-obese diabetes, were also observed in the previous GK rat study( Reference Kubota, Watanabe and Kabasawa 28 ). With the ZDF rats, these renoprotective effects may have been mediated by direct and/or indirect routes. Among possible indirect routes are improvement of blood glucose control and suppression of fatty liver (Fig. 1(b) and 2). Because impaired blood glucose control is one of the most serious pathogenic factors in diabetic nephropathy, it is reasonable to predict that improved blood glucose control would delay its progression. Suppressive effects on NAFLD by REP consumption may also contribute to improving glucose metabolism because ectopic lipid accumulation in the liver and muscle can impair insulin signalling( Reference Samuel and Shulman 47 ). On the basis of data from various cohort studies, it was recognised that NAFLD may be closely related to CKD. Thus, decreased hepatic lipid accumulation may have delayed progression of CKD in our study, although the mechanism of this is not yet clear. Therefore, suppression of albuminuria in the REP group might be mediated by improved glucose homoeostasis and suppression of fatty liver. With regard to a potential direct effect on the kidneys, the high arginine content of REP might cause suppression of diabetic nephropathy. Arginine is a physiologic precursor of nitric oxide (NO), and it was reported that NO generation was reduced in ZDF rats and that soya protein, known to have a high arginine content, was renal protective by restoring NO generation( Reference Trujillo, Ramírez and Pérez 21 ). In addition, Fu et al.( Reference Fu, Haynes and Kohli 41 ) reported that arginine supplementation increased serum NOx (oxidation products of NO) concentrations and NO production in adipose tissues, but decreased serum levels of asymmetric dimethylarginine, an endogenous NO synthase inhibitor. These reports indicated that the renoprotective effects of REP may have been mediated by enhanced NO generation because of its high arginine content. Together, these findings indicated that the renoprotective effects of REP were either additively or synergistically mediated by such direct and indirect routes. The metabolic profile in the kidney, however, was not clearly affected by REP, based on preliminary metabolome analysis (data not shown), unlike the liver metabolic profile. Although our study clearly showed that REP had beneficial effects against diabetes, diabetic nephropathy and fatty liver, further studies will be needed to clarify its underlying mechanisms.
In addition, it is notable that REP has very low P content( Reference Kubota, Watanabe and Kabasawa 28 ), which may provide additional benefits with respect to CKD. Kidney dysfunction in CKD leads to impaired P excretion, causing hyperphosphatemia. Because hyperphosphatemia increases cardiovascular calcification and mortality, avoiding excess phosphate intake from the diet may be critical for CKD patients( Reference Kalantar-Zadeh, Gutekunst and Mehrotra 48 ). In our study, urinary P excretion in the REP group was significantly lower than in the C group (Table 3), although blood phosphorus levels were no different. The low P content in REP might have prevented hyperphosphatemia.
In conclusion, our data indicated that REP had beneficial effects on obese T2DM and diabetic nephropathy through suppression of HbA1c and hepatic lipid accumulation, as well as protection of kidney function.
Acknowledgements
This study was supported in part by a grant for research ‘Development of fundamental technology for analysis and evaluation of functional agricultural products and functional foods’ from the Japanese Ministry of Agriculture, Forestry and Fisheries to M. Kadowaki and a Grant-in-Aid for Scientific Research (no. 21500812) from the Japan Society for the Promotion of Science to R. W.
The authors’ contributions are as follows: M. Kubota and R. W. conceived, designed and conducted the study and analysed data. M. Y. conducted animal experiments and analysed data. M. F. prepared REP and M. H. performed histology. M. Kubota, R. W., M. Kadowaki, M. H., A. S. and S. F. interpreted the data. M. Kubota and R. W. wrote the manuscript. M. Kadowaki had primary responsibility for the final manuscript. All authors read and approved the final version of the manuscript.
All authors declare that they have no conflicts of interest.


