National food-based dietary guidelines (FBDG) are developed to help consumers make healthy food choices and to improve public health(Reference Brown, Timotijevic and Barnett1). For example, the official Danish FBDG directed at the healthy population over 3 years of age recommend an intake of 350 g of fish per week, of which 200 g should be fatty fish(Reference Tetens, Andersen and Astrup2). If the population would follow these FBDG, a considerable public health gain is expected(Reference Thomsen, Pires and Devleesschauwer3). However, according to national dietary survey data (n 3016), only about 15 % of the Danish adult population follow the national recommendation for fish(Reference Pedersen, Christensen and Matthiessen4). Furthermore, the variation in fish intake between individuals is large, partly due to the fact that 11 % did not report consumption of fish. The compliance to other Danish FBDG is low as well; for example, reducing saturated fat, it is as low as 3 %, and for increasing dietary fibre, 16 % of the adult Danes comply with the recommendation(Reference Pedersen, Christensen and Matthiessen5).
The proportion of the Danes that are aware of the FBDG is unknown, and among the aware individuals, there is likely a range of factors limiting their adherence. The relationship between awareness of dietary recommendations and behaviour change is complicated by several components(Reference Brown, Timotijevic and Barnett1). Food choice is a complex behaviour that is influenced by many interacting factors, and the understanding of the determinants of food choice is limited(Reference Leng, Adan and Belot6, Reference Kö7).
Food cost is known to influence diet quality(Reference James, Nelson and Ralph8–Reference Aggarwal, Monsivais and Cook11). Groups with lower incomes are less likely to make food purchasing choices consistent with dietary guideline recommendations(Reference Turrell, Hewitt and Patterson12, Reference Giskes, Van Lenthe and Brug13). Hence, fish cost may make the Danish national recommendation for fish unattractive and maybe not feasible for some individuals in the population. Another possible, more general reason for the low adherence (15 %) may be that the recommendation deviates too much from the current fish consumption for a large part of the population. Consumers may not be motivated to follow national FBDG if they differ a great deal from individual food preferences.
Since national guidelines have limited effect(Reference Brown, Timotijevic and Barnett1, Reference Pedersen, Christensen and Matthiessen5, Reference King14), alternative and/or complimentary ways to improve public health by modifying consumption patterns are relevant. Previous studies suggests that consumers may perceive personalised dietary advice as more relevant and motivational than ‘one size fits all’ generic guidelines since they can take personal characteristics such as preference and needs into account(Reference Brug, Campbell and van Assema15–Reference Celis-Morales, Livingstone and Marsaux17).
Mathematical optimisation of food intakes (‘diet optimisation’) have been applied to analyse several aspects of diet sustainability(Reference Gazan, Brouzes and Vieux18). Mathematical optimisation methods are suitable for this purpose, thanks to their ability to deal with several factors simultaneously; they provide a multi-dimensional approach. Dimensions of diet sustainability include environmental impact, nutritional adequacy, affordability, cultural acceptability and accessibility, for example. The goal of a diet optimisation problem is to optimise a combination of food items subject to some predefined criteria. Diet modelling has been applied at individual(Reference Maillot, Vieux and Amiot19–Reference Persson, Fagt and Nauta22) and population level(Reference Barré, Vieux and Perignon23–Reference Sirot, Leblanc and Margaritis25). The majority of the previous diet optimisation studies have considered nutritional recommendations as criteria, and few studies also included contaminant exposure limits(Reference Gazan, Brouzes and Vieux18). Several diet optimisation studies have assessed the cultural acceptability dimension of diet sustainability by modelled combinations of foods that deviate as little as possible from observed intake(Reference Maillot, Vieux and Amiot19–Reference Barré, Perignon and Gazan24). The advantage of such food combinations is that they minimise the behavioural changes necessary. Smaller deviations from observed intakes may be more culturally acceptable than larger deviations, but no formal definition of minimum deviation from observed intake exists(Reference Gazan, Brouzes and Vieux18). Hence, different methods to minimise this behavioural change can be applied. Linear programming (LP) and quadratic programming (QP) are two alternative approaches for minimising behavioural change subject to a set of constraints, giving different outputs. Diet affordability has been analysed in previous diet optimisation studies, and it has been concluded that a cost constraint can impact diet quality negatively(Reference Darmon and Drewnowski9, Reference Darmon, Ferguson and Briend26).
This study presents a novel model for generating personalised fish intake recommendations by accounting for two factors that are likely to affect consumption: personal preference and fish cost. These two factors are minimised simultaneously subject to constraints on nutrients and contaminants. Hence, the modelled individual combinations of fish species may be perceived as more sustainable than national FBDG, since the model accounts for cultural acceptability and affordability while considering nutritional adequacy and contaminant limits. Fish consumption provides health benefits mainly due to its content of the nutrients such as EPA, DHA and vitamin D, but fish consumption also constitutes health risks, mainly due to the presence of the contaminants such as methyl mercury, dioxins and dioxin-like polychlorinated biphenyls (dl-PCB) in fish(27). In the previous studies, we modelled personalised fish intake recommendations by applying a QP model that minimises the deviation from personal preference (defined as observed individual intake), while ensuring that constraints on these nutrients and contaminants are fulfilled(Reference Persson, Fagt and Pires21, Reference Persson, Fagt and Nauta22). Hence, personalised recommendations for fish intake that differed as little as possible from individual preference were generated. The results suggest that an intake of 350 g of fish per week, of which 200 g should be fatty fish, as recommended by the Danish food authorities, is not necessary(Reference Persson, Fagt and Pires21, Reference Persson, Fagt and Nauta22). These studies concluded that meeting the official recommendation is healthy and safe, but does require larger behaviour changes in the population than necessary, which may lead to lack of compliance. This suggests that personalised recommendations for fish can work as compliments to the FBDG in favour for improving healthier consumption patterns. In this study, the food choice determinant cost was also modelled and analysed.
The objective of this study was to present a method for modelling and analysing the trade-off between deviation from preference (defined as observed individual intake) and cost for optimised personalised intake recommendations. As this is a novel method, we wish to point out that this study is first and foremost methodological. Fish intake in Denmark demonstrates the use of the model.
Methods
Data
Observed intake and body weights
The observed intake (7-d estimated records) and self-reported body weights were obtained from the Danish National Survey of Diet and Physical Activity (DANSDA)(Reference Pedersen, Christensen and Matthiessen4) (n 3016, aged 18–75 years). We excluded the species garfish and saithe from the optimisation variable, which were less than 2 % of the individuals reported. Garfish and saithe were instead defined as background exposure foods. The remaining nine reported species were included, denoting the nine elements of the optimisation variable in the model. The observed intake data are shown in Table 1. The observed intakes of five representative individuals in the study population with different personal preference are shown in Table 2. Other than to some extent having a clear preference (further explained in the ‘Results’ section), the individuals were arbitrarily chosen. Two of these individuals already fulfilled their nutrient and contaminant constraints, that is, their observed intakes were within the feasible region of the model.
Observed fish intake(Reference Pedersen, Christensen and Matthiessen4) and prices of fish (n 3016, aged 18–75 years)
(Numbers of individuals with reported intake (n r), mean values and standard deviations; medians and interquartile ranges (IQR))

DKK, Danish krone; smo, smoked; mar, marinated.
Observed fish intake(Reference Pedersen, Christensen and Matthiessen4) and observed total background nutrient intake/contaminant exposure for five selected individuals in the study population

smo, Smoked; mar, marinated; dl-PCB, dioxin-like polychlorinated biphenyls; TEQ, toxic equivalency.
Nutrient compositions, contaminant concentrations and limit values
The average nutrient compositions (EPA + DHA and vitamin D) and the average contaminant concentrations (methyl mercury and dioxins + dl-PCB) for the fish species were calculated as in our previous study(Reference Persson, Fagt and Nauta22) (see Table 3). Nutrient compositions for species subcategories such as raw, smoked, canned and marinated were extracted from a Danish food composition database(28). Nutrient compositions for the fish species were calculated as weighted averages of the extracted data with weights equal to the reported intake amounts of the different subcategories. Contaminant concentrations for fish subcategories were extracted from two Danish chemical contaminant reports(29, 30). The same procedure as for the nutrients was applied to calculate the contaminant concentrations, but since there were two contaminant reports, the extra step of calculating the weighted averages of the two contaminant reports with the number of samples per report serving as weights was performed. The conservative approach regarding methyl mercury as used by the European Food Safety Authority (EFSA)(31) was applied: 100 % of the total mercury in fish was considered as methyl mercury, and 80 % of the total mercury in seafood other than fish was considered as methyl mercury.

Recommended daily intakes for the nutrients and tolerable weekly intakes for the contaminants (see Table 4) were used for calculating limit values for the constraints in the model. The recommendations and tolerable weekly intakes are regarding total exposure, and therefore background exposure amounts are subtracted. Daily values are converted to weekly values in the model by multiplying daily recommendations by seven, and per-body-weight values are converted to per-individual values in the model by multiplication with individual body weight, as available from the data.
Recommendations for nutrients and contaminants

BW, body weight; dl-PCB, dioxin-like polychlorinated biphenyls; TEQ, toxic equivalency.
Prices of fish
The average price of each fish species product (raw, smoked, canned or marinated) was calculated from prices collected from three Danish online supermarkets (nemlig.com, mad.coop.dk and osuma.dk) and two Danish online fish stores (fiskehuset.dk and fish4you.dk) in April 2018. The prices of the fish species in the model (see Table 1) were calculated as weighted averages of the fish products, with the mean reported intake of the different products serving as weights. This means that each fish product was assigned a weight determining its relative importance for the total price of the corresponding fish species. The prices for lean and fatty fish, as well as all fish, were calculated as weighted averages of the fish species, with the mean intake of the study population for the different species serving as weights.
Background exposure
Fish is not the only source of the nutrients and contaminants included in the model. Background exposure can be due to consumption of several other foods than fish, dietary supplements and potentially also by other environmental sources. Background exposure amounts were subtracted from the recommendations for EPA + DHA, vitamin D, methyl mercury and dioxins + dl-PCB, as in our previous study(Reference Persson, Fagt and Nauta22). The background exposure sources included were foods other than fish, vitamin D supplements, sun and air. For foods other than fish and vitamin D supplements, individual background exposure was calculated from observed intake data(Reference Pedersen, Christensen and Matthiessen4) combined with composition and concentration data(28–30) (see Table 5). No EPA + DHA supplementation data were available, and we decided to not include EPA + DHA supplementation in the model.
Observed nutrient intake and contaminant exposure*
(Mean values and standard deviations; medians and interquartile ranges (IQR))

dl-PCB, dioxin-like polychlorinated biphenyls; TEQ, toxic equivalency.
* Observed intake(Reference Pedersen, Christensen and Matthiessen4) multiplied with nutrient composition and contaminant concentration data(28–30), supplement intake(Reference Pedersen, Christensen and Matthiessen4) and estimated average environmental exposure (n 3016, aged 18–75 years).
For the environmental background exposure, no individual data were available. Therefore, estimated average values calculated in our previous study(Reference Persson, Fagt and Nauta22) were used for all individuals in the study population (see Table 5). For EPA + DHA, there is no environmental background exposure. For vitamin D, UVB radiation from the sun (that gets synthesised in the skin) is a significant source in Denmark(Reference Andersen, Brot and Jakobsen32, Reference Hansen, Tjønneland and Køster33). The seasonal variation of the radiation is large; the highest level is in summer, and the lowest in winter. In this study, a so-called ‘mid-season’ scenario is used, which is the average of a summer scenario and a winter scenario(Reference Persson, Fagt and Nauta22). For methyl mercury exposure, fish and seafood consumption is the major source(31, Reference Hong, Kim and Lee34). We assumed food to be the only source of exposure which was considered appropriate since we used conservative assumptions for the methyl mercury concentrations in fish. For dioxins, food consumption contributes to more than 90 % of the total exposure(35). We assumed that the remaining 10 % are from air and calculated an estimated average airborne dioxin exposure using this 9:1 relationship and inserting the average exposure due to food consumption (376 pg toxic equivalency (TEQ) per week). The total background exposure for five representative individuals in the study population is shown in Table 2.
Model overview
Quadratic programming model
The QP model of the study is expressed as
 $$\mathop {{\rm{minimize}}}\limits_{\rm{x}} {\rm{x}} - {\rm{x}}_{{\rm{obs}}}}_2 + {\it{\lambda}} {\rm{Cx}}{\rm{,}}$$
 $${\rm{subject\,\,to}} \ {\rm{Bx}} \ge {\rm{b}},$$
 $${\rm{Rx}} \le {\rm{r}},$$
 $${\rm{x}} \ge {\rm{0}},$$
where the vector x (d × 1) is the optimisation variable describing weekly intake amounts of d number of different fish species (g/week) for one individual, the vector xobs (d × 1) describes the individual observed intake amounts of the corresponding fish species (g/week), the parameter  $\it\lambda \,\left( { \ge 0} \right)$ is a constant that determines the relative importance of the cost of fish intake, the vector C (1 × d) describes the prices of the different fish species (Danish krone; DKK/g), the matrices B (m × d) and R (k × d) denote the average of the nutrient compositions and contaminant concentrations in fish (mg/g, µg/g or pg TEQ/g), respectively, and the vectors b (m × 1) and r (k × 1) describe the weekly lower and upper intake amounts of the nutrients and contaminates (mg/week, µg/week, µg/kg body weight per week or pg TEQ/kg body weight per week).
The solution of this optimisation problem, which is a fish intake recommendation for the individual, is the vector x that fulfils the constraints (equations 2a–2c) and minimises the objective function (equation 1). The model is nine-dimensional, since nine fish species are considered (d = 9). A QP model punishes large deviations and may make small changes in all nine elements in the optimisation variable. Our assumption is that many smaller are realistic and achievable for consumers, which corresponds to the minimum total deviation possible (the shortest distance between the model recommendation and the observed intake, as explained below).
Objective function
The objective function of an optimisation problem choses the optimal solution for x among the feasible solutions. In our model, the vector xobs (d × 1) of the objective function (equation 1) is a constant vector with the observed fish intake amounts (g/week) of an individual, which is defined as individual preference. The vector C (1 × d) is a constant vector with the prices of the different fish species (DKK/g). The L2-norm of the difference between the optimisation variable and the observed intake,  ${\rm{x}} - {{\rm{x}}_{{\rm{obs}}}}_2$, describes the deviation from the observed intake. This is a straight-line distance, which is the shortest distance between the modelled recommendation and the observed intake, a distance in a d-dimensional space (d = 9 in our case):
 $$\eqalign{{\rm{x}} - {{\rm{x}}_{{\rm{obs}}}}_2 = \sqrt {{{\left| {{{\rm{x}}_1} - {{\rm{x}}_{{\rm{obs}},1}}} \right|}^2} + {\rm{}}{{\left| {{{\rm{x}}_2} - {{\rm{x}}_{{\rm{obs}},2}}} \right|}^2} + \ldots + {{\left| {{{\rm{x}}_{\rm{n}}} - {{\rm{x}}_{{\rm{obs}},{\rm{d}}}}} \right|}^2}}.$$
The product Cx is the total weekly cost of fish intake (DKK/week) for the individual when the amount of fish described by vector x is consumed. Hence, the objective function (equation 1) of the model minimises the deviation from the individual observed fish intake (the preference) and the corresponding cost of fish intake simultaneously. The parameter  ${{\it\lambda}} \,\left( { \ge 0} \right)$ is a constant that determines the relative importance of the cost for the optimisation. With $\it\lambda \, = 0$, the model is identical with the model from our previous studies in which the cost was not considered, but only deviation from personal preference was minimised(Reference Persson, Fagt and Pires21, Reference Persson, Fagt and Nauta22). The model of this study can be modified to minimise only cost of fish intake by eliminating the L2-norm. Then, the following alternative objective function is used:
 $$\mathop {{\rm{minimize}}}\limits_{\rm{x}} {\rm{Cx}}.$$
With this cost objective function, the model becomes an LP instead of a QP. When  $\it\lambda \to \infty $ in the original model, its objective function becomes equal to the cost objective function.
Feasible region
The feasible region of an optimisation problem is the set of all possible (feasible) solutions to the problem from which the objective function chooses the optimal solution. It is the set of vectors that fulfil the constraints. The constraints of our model ensure that the modelled recommendation for an individual meets the lower limits on the nutrients EPA + DHA and vitamin D (equation 2a) without violating upper limits on the contaminants methyl mercury and dioxins + dl-PCB (equation 2b), and makes sure that no modelled recommendations are negative (equation 2c). The vector b (m × 1) describes the weekly lower limits for the nutrient intake amounts due to fish intake (m = 2: EPA + DHA and vitamin D), and r (k × 1) describes the weekly upper limits for the contaminant intake amounts (k = 2: methyl mercury and dioxins + dl-PCB). The elements of limit vector b are recommended intakes for the nutrients subtracted with the individual background intake. For vector r, the elements are tolerable intakes for the contaminants minus the individual amount due to background exposure. The matrices B (m × d) and R (k × d) denote the nutrient compositions and contaminant concentrations in fish, respectively. The feasible region of an individual, made up by her/his constraints, is body weight dependent (due to the contaminant constraint (equation 2b) and also dependent on her/his background exposure (due to the nutrient and contaminant constraints (equations 2a and 2c).
Optimal trade-off curve
In general, there is a trade-off between deviation from personal preference x–xobs2 and cost Cx, when an individual’s preference is not the combination of fish species that minimises the cost while fulfilling the model constraints. Analysing the trade-off between these two implies analysing how much an individual has to deviate from her/his preference if a lower cost of consumption is desired. We achieved an optimal trade-off curve between deviation from preference and cost by defining different parameter values λ and running the QP model with these, whereby λ parametrises the optimal trade-off curve. We used the arbitrary numbers λ = 0, 0·2, 0·4, 0·6, 0·8, … up to a number that minimises the cost for each individual. For comparison, the model was also run with the cost objective function (equation 4) that only minimises the cost of fish intake.
Software
To solve the QP problem, we used CVX, a Matlab (R2015b, version 8.6) package for specifying and solving convex programs(Reference Grant and Boyd36, Reference Grant and Boyd37).
Results
National food-based dietary guidelines and current consumption
The cost of consuming 350 g of fish per week, of which 200 g is fatty fish, as recommended in the official Danish FBDG, is 61 DKK per week. Currently, the average woman in Denmark consumes 186 (78 + 108) fish per week and the average Danish man consumes 234 g (100 + 134) fish per week, which cost 33 (13 + 20) and 40 (17+23) DKK per week, respectively (see Table 6).
Observed fish intakes(Reference Pedersen, Christensen and Matthiessen4) and modelled fish intake recommendations with different objective functions and corresponding costs
(Mean values and standard deviations; medians and interquartile ranges (IQR); minimum (Min) and maximum (Max) values)

DKK, Danish krone.
* Modelled recommendation minus observed intake.
Personal preference
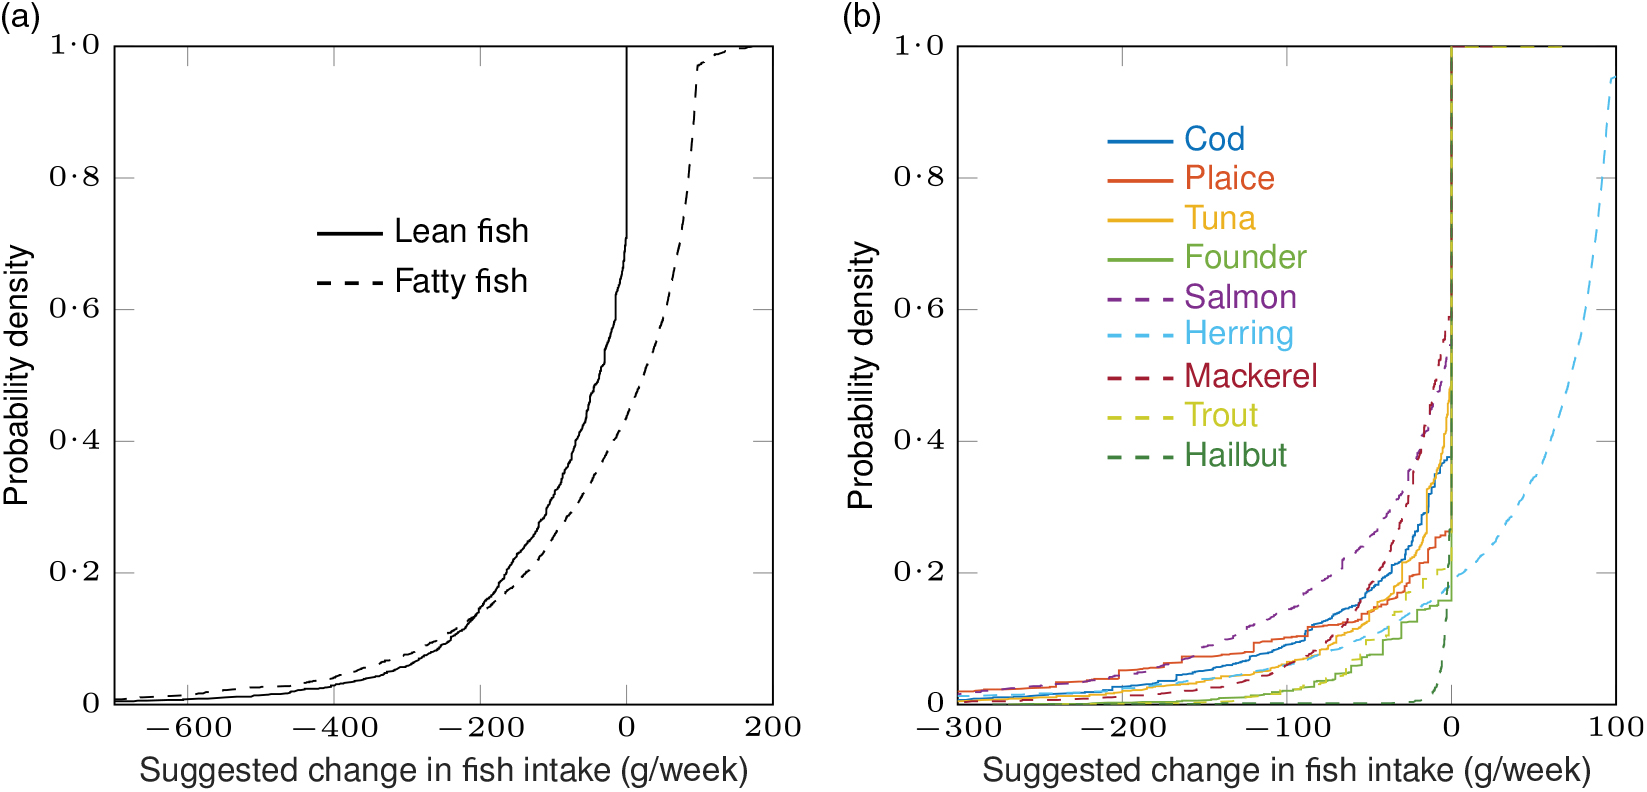
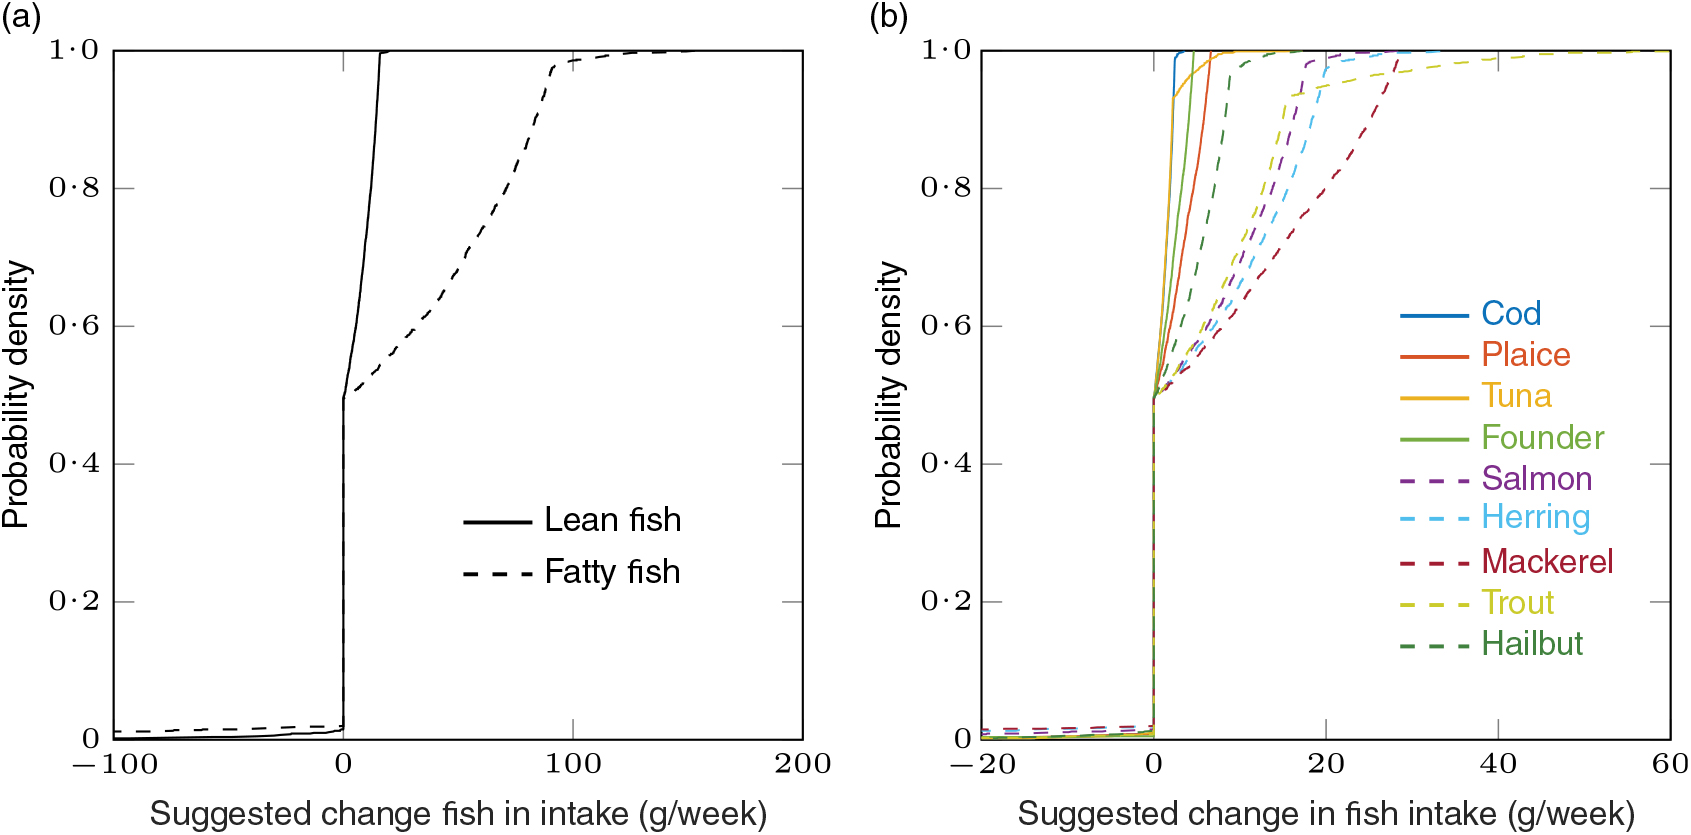
When only the deviation from individual preference is minimised (λ = 0 in equation 1), the average values for the modelled recommendations of the study population were 82 g of lean fish and 134 g of fatty fish per week for women and 104 g of lean fish and 156 g of fatty fish per week for men (Table 6). The suggested changes in fish intake (modelled recommendation minus observed intake) with λ = 0 are visualised with an empirical cumulative distribution function in Fig. 1. From this figure, we can see that the species that should be recommended to be increased the most are mackerel, herring, salmon and trout, in that given order. A total of 48 % of the 3016 individuals (741 women and 703 men) already fulfilled their model constraints (for EPA + DHA, vitamin D, methyl mercury and dioxins + dl-PCB) with their observed consumption, that is, had current consumption within her/his feasible region. These individuals should be recommended to retain their fish consumption pattern. Half of the study population, 50 % (788 women and 723 men), should be suggested to increase their fish intake with up to 173 g of fish per week in order to meet the lower constraints of the nutrients. A small fraction of the study population, the remaining 2 % (twenty-three women and thirty-eight men), should be suggested to decrease their fish intake due to too high exposure to contaminants with their current consumption. There were twenty-two individuals (thirteen women and nine men) who had too high of a background exposure to dioxins + dl-PCB to obtain a feasible solution. For these participants, no personalised fish intake recommendation could be generated. Instead, these individuals should be suggested to modify their background exposure, typically by consuming less animal products(Reference Persson, Fagt and Nauta22). From now on, we exclude these individuals from the discussion of the results. The cost for the average modelled fish intake recommendations are 39 (14 + 25) and 45 (17 + 28) DKK per week for women and men, respectively (see Table 6).
Deviation from personal preference is minimised: empirical cumulative distribution functions for the suggested changes in fish intake (modelled recommendation minus observed intake) for the study population with λ = 0. Total lean fish and total fatty fish (a) and all nine species (b). The value on the y-axis corresponding to a specified value of change in fish intake on the x-axis is the fraction of individuals in the study population that should be suggested to make a change less than or equal to the specified value on the x-axis. Original to this manuscript.
Cost
When only cost is minimised (the alternative cost objective function (equation 4) is used), the cost of the average modelled recommendations are 7·4 (0·0 + 7·4) and 7·1 (0·0 + 7·1) DKK per week for women and men, respectively (Table 6). When preference is not considered, but the aim is to recommend the cheapest fish consumption that fulfils the nutrient requirements, 99 % of the study population should be recommended to only eat various amounts of herring. The exceptions are two women who should be recommended to consume mackerel and trout, and twelve women and twenty-two men who should be recommended to not consume fish at all, since their background exposure to the nutrients and contaminants fulfilled the constraints of the model. The average values for the modelled recommendations of the study population were 82 g of fatty fish (81·8 g herring, 0·034 g mackerel and 0·089 g trout) per week for women and 79 g of herring per week for men. See the empirical distribution function for the suggested changes (modelled recommendation minus observed intake) when only cost of fish intake is minimised in Fig. 2.
Cost is minimised: empirical cumulative distribution functions for the suggested changes in fish intake (modelled recommendation minus observed intake) for the study population with the alternative cost objective function (equation 4). Total lean fish and total fatty fish (a) and all nine species (b). The value on the y-axis corresponding to a specified value of change in fish intake on the x-axis is the fraction of individuals in the study population that should be suggested to make a change less than or equal to the specified value on the x-axis. Original to this manuscript.

Personal preference and cost
The optimal trade-off curve for an individual can be visualised by plotting, with different parameter values for λ, the minimised change in cost (modelled cost minus observed cost) Cx–Cxobs (DKK/week) on the x-axis and the corresponding minimised deviation from her/his preference x–xobs2 (g/week) on the y-axis. For all individuals in our study population, there is a trade-off between deviation from preference and cost. This is illustrated for five representative individuals with different personal preference. The aim when choosing the individuals was to illustrate the variation in trade-off curves. Two individuals who fulfilled their nutrient and contaminant constraints were chosen, that is, their observed intakes were within the feasible region of the model. Three who did not meet their model constraints were chosen. Other than these criteria, the individuals were arbitrarily chosen. Below is a list of these five individuals (see their recorded fish intakes in Table 2).
Observed intake within feasible region:
(1) a woman consuming all fish species
(2) a woman only consuming fatty fish.
Observed intake outside feasible region:
(1) a man with the highest fish consumption in the study population
(2) a woman not consuming fish
(3) a man only consuming lean fish.
In Figs. 3–7, the optimal trade-off curves for the five individuals along with the modelled recommended fish intake (g/week) for different parameter values λ are shown. In Table 7, the modelled recommendations with a few different λ are given. As shown in Figs. 3(b)–7(b)and Table 7, with large enough λ, all individuals should be recommended to consume only herring. The rightmost point on any trade-off curve equals λ = 0, which corresponds to the recommended fish intake that minimise the deviation from the individual’s preference (Figs. 3(a)–7(a)). With this parameter value, the cost of the fish intake is not considered. When λ > 0, the cost is included in the objective function. When λ is increased (moving left on the trade-off curve), the cost of fish consumption is decreased. Simultaneously, the deviation from the individual’s preference is increased. The deviation from the preference is always a positive number, but the change in cost can be both positive and negative. When the cost of the modelled fish intake recommendation is larger than the cost of the observed intake, the change is positive; otherwise, it is negative. The leftmost point on a trade-off curve corresponds to the parameter value λ that minimises the cost for the individual. As mentioned, when λ becomes large, the objective function of the model (equation 1) approaches the alternative objective function (equation 4) that only minimises cost.
Optimal trade-off curve between deviation from preference and change in cost (modelled cost minus observed cost) (a) and modelled fish intake recommendation for different parameter values λ (b) for a woman consuming all nine fish species (individual 1). Original to this manuscript. DKK, Danish krone.

Optimal trade-off curve between deviation from preference and change in cost (modelled cost minus observed cost) (a) and modelled fish intake recommendation for different parameter values λ (b) for a woman only consuming fatty fish species (individual 2). Original to this manuscript. DKK, Danish krone.

Optimal trade-off curve between deviation from preference and change in cost (modelled cost minus observed cost) (a) and modelled fish intake recommendation for different parameter values λ (b) for a man with the highest fish consumption in the study population (individual 3). Original to this manuscript. DKK, Danish krone.

Optimal trade-off curve between deviation from preference and change in cost (modelled cost minus observed cost) (a) and modelled fish intake recommendation for different parameter values λ (b) for a woman not consuming fish (individual 4). Original to this manuscript. DKK, Danish krone.

Optimal trade-off curve between deviation from preference and change in cost (modelled cost minus observed cost) (a) and modelled fish intake recommendation for different parameter values λ (b) for a man only consuming lean fish species (individual 5). Original to this manuscript. DKK, Danish krone.

Modelled fish intake recommendations with different values for λ for five selected individuals in the study population

For individual 1 consuming all species of fish and individual 2 consuming only fatty fish (Figs. 3 and 4), both the change in cost and the deviation from preference are 0 when the cost part of objective function is removed and only the deviation from personal preference is minimised, that is, λ = 0. This is because the observed intake of these individuals already fulfils the nutrient and contaminant constraints, and they would therefore be recommended to retain their fish consumption pattern when cost is not considered. As mentioned, this is the case for 43 % of the study population (Fig. 1(a)). An increased λ (>0) corresponds to a decreased (change in) cost (which, as mentioned, applies to all individuals) and a larger deviation from the preference. Individual 3 (Fig. 5) has an observed intake that is larger than the constraints allow. Hence, the change in cost is negative and the deviation from the preference is larger than 0 for all parameter values λ. This individual should be suggested to decrease fish intake for any λ, and the larger the λ, the larger the decrease in both fish intake and cost. For individual 4 who does not consume any fish (Fig. 6), the change in cost is positive and the deviation from the preference is larger than 0 for all parameter values λ. This individual should be suggested to increase fish intake for all λ, and the larger the λ, the larger the increase in fish intake and decrease in cost. When only minimising the deviation from preference (λ = 0), this non-fish consuming individual will be recommended the combination of species that gives the minimum total fish intake (g/week). Lastly, for individual 5 only consuming lean fish (Fig. 7), the change in cost is positive and the deviation from the preference is larger than 0 when λ = 0. Between λ = 2·2 and λ = 2·4, the change in cost goes from positive to negative. Hence, for λ < 2·2, the individual would save money by following the generated recommendation as compared with consuming the observed intake; and for λ > 2·4, the modelled recommendation would be the less expensive option. A recommendation that costs as much as the observed consumption can be given to this individual.
Discussion
To our knowledge, this is the first intake optimisation study that simultaneously minimises deviation from preference, which is defined as observed intake, and food cost. This allows for analysing the optimal trade-off curve between these two factors that may affect consumer choice. Fish consumption in Denmark was used for demonstrating the method and the model. As food choice is complex, it is not known with certainty to what extent and in which direction personal preference and cost affect individual’s food choices. With this complexity, the model developed enables analysing the combination of these two important food choice determinants on individual level. We concluded that an optimal trade-off curve between deviation from fish intake preference and cost of fish could be generated for each individual in our study population of 3016 adult Danes, aside from twenty-two individuals who had a too high background exposure to the contaminates we included in the study (methyl mercury and dioxins + dl-PCB). In order to obtain a trade-off curve, these individuals would need to modify intake other than fish.
When only minimising the deviation from preference for the individuals in the study population, 50 % should be suggested to increase their fish intake. This was also concluded in our previous fish intake optimisation study(Reference Persson, Fagt and Nauta22). The species that should be recommended to be increased the most are mackerel, herring, salmon and trout, in that given order. These are all fatty fish species, which are highest in EPA + DHA and vitamin D. The costs for the ‘average recommendations’ are 39 and 45 DKK per week for women and men, respectively. As compared with the cost when consuming 150 g of lean fish and 200 g of fatty fish, which is 61 DKK per week, the modelled recommendations that minimise the deviation from preference would be 20 and 14 DKK less expensive per week for the average woman and man, respectively.
When only minimising the cost, the vast majority of the study population (99 %) should be recommended to only consume herring. This is due to the fact that herring is the least expensive fish, while its nutrient compositions and contaminant concentrations allow for a feasible solution for all individuals except two women, who should be recommended to include mackerel and trout as well. However, it is not realistic to recommend almost a whole population to consume only herring. First, the recommendations generated by minimising cost do not account for preferences that probably make them unrealistic in the first place. As the constant λ determines the relative importance of the preferred diversity of an individual, in this ‘extreme case’ when λ → ∞, a potential preference for diversity in fish species consumed is not considered separately in the model. Second, overfishing would most likely be a problem if the proportion of individuals that should be recommended to only consume herring as derived in this study is extrapolated to the general population. Third, the price of herring would eventually increase if the demand suddenly increased dramatically. Fourth, the recommendation would likely lead to discontent among the fish industry.
We argue that it is appropriate to minimise the deviation from the preference and cost simultaneously when generating personalised fish intake recommendations, since both factors may affect consumer choice and the aim is to obtain as realistic and achievable fish intake recommendations as possible. For example, salmon and trout, which are two of the species that should be increased the most when only minimising deviation from preference, are relatively expensive fish species. Hence, recommending these species to some individuals may result in lower adherence as compared with a recommendation that deviates more from their current preference, but to a lower cost. However, the relative importance of the cost is hard to draw conclusions on; we cannot define the best value for λ as it is a specific and subjective individual choice. Data on correlations between cost and consumer choice are needed in order to draw conclusions on the optimal trade-off between cost and personal preference.
Communication of the personalised recommendations generated with this model is a future research topic. A prospective utilisation of the model could be to apply it in a user-friendly software tool (e.g. an application (app) or a computer program) that the population could access. This would allow individuals to generate personalised recommendations themselves and analyse her/his personal trade-off curve between deviation from preference and cost. If an individual is not interested in, for example, minimising the cost, the parameter λ can be set to 0. The model can be modified to not allow undesired species in the recommendation, which allows individuals to personalise their trade-off curves further. Data on preference regarding undesired fish species would have benefitted the analysis in this study, but no such data were available. However, if applied in an app, such data could easily be inserted by the user.
Previous studies have applied LP to model diets that deviate as little as possible from individual observed diets(Reference Maillot, Vieux and Amiot19, Reference Maillot, Vieux and Ferguson20). In general, QP may make small changes to all elements of the optimisation variable, whereas LP typically makes large changes in a few elements and leaves the others unchanged. What is perceived as realistic changes in intake is probably individual specific. Some individuals may prefer to make several small changes, and others may prefer fewer larger changes. We had no data on this preference, but we made the assumption that QP modelling generates more acceptable fish intake recommendations for our study population. This assumption is based on the fact that a recommendation would be ineffective if an individual was suggested to only consume a lot (more) of a species that she/he did not want to consume (more of). We argue that several small changes may be less likely to be deemed unacceptable, especially when new species are recommended to be introduced. As mentioned, it would be best if data regarding individual undesired species were available. A future research topic could be to perform a sensitivity analysis on the difference between QP and LP when minimising the optimal trade-off curve between personal fish intake preference and cost.
Recently, more and more countries have stated to incorporate sustainability considerations into their FBDG, for example, the environmental dimension(Reference Gonzalez Fischer and Garnett38). Fish consumption raises a significant trade-off between health (e.g. nutritional goals) and environmental impact. Therefore, consumption of fish from sustainable stocks is increasingly incorporated in recommendations. This study on fish intake assessed the nutrition/health, the economic/affordability and the cultural acceptability dimensions of diet sustainability. Several diet optimisation studies have analysed the environmental dimension when generating sustainable diets(Reference Gazan, Brouzes and Vieux18, Reference Perignon, Masset and Ferrari39–Reference Kramer, Tyszler and Veer42), by including one or more environmental metrics such as greenhouse gas emissions, land use and fossil use. Our model could in a future study, in line with the developments of the FBDG and the focus on sustainable fish species, be modified to include some environmental metric.
The prices of the fish species used in this study were collected in the month of April. However, there may well be a seasonal variation in the prices. Also, average values were used, which may not reflect the behaviour of the population; some individuals may consequently prefer to buy low-price products, whereas others may choose the more expensive options. The nutrient compositions and contaminant concentrations for different fish species were described by average values in the model. This can be argued to reflect a realistic long-term consumption and exposure. Furthermore, there may be variation in nutrient compositions and contaminant concentrations depending on region and season of capture, whether the fish is wild-caught or farmed-raised, etc.(27), but the intake data did not provide such information, and the model could not be personalised considering this.
Only EPA + DHA, vitamin D, methyl mercury, dioxins and dl-PCB were included in the modelling in this study. To make the results more precise, additional nutrients and/or contaminants present in fish could be included in the model. We considered it suitable to only include these nutrients and contaminants that present the major benefits and risks, since this paper is mainly methodological. Also, substitution with other foods was not considered in the model. It is likely that an individual would modify some other food intake if increasing or decreasing the intake of fish, which would change her/his background exposure(Reference Thomsen, Pires and Devleesschauwer3). The approach of this paper could be extended to optimise the intake of several foods or whole diets. With whole diet optimisation(Reference Maillot, Vieux and Amiot19, Reference Maillot, Vieux and Ferguson20, Reference Barré, Vieux and Perignon23), the substitution between foods is naturally covered in the model. The whole diet approach can also cover all dietary recommendations, and not only those associated with fish, as in this study. This, however, requires a lot of additional data, in terms of compositions, concentrations, prices, limit values, etc.
Furthermore, the results of this method should be applied in a real-life setting in order to validate their impact. In this paper, we assumed that the personalised dietary recommendations deviating as little as possible, to possibly at a lower cost, will have higher adherence than general FBDG, but it is not certain and we found no literature verifying this. Exploring this would require knowledge from other research fields.
Acknowledgements
We thank Sara M. Pires and Morten Poulsen for the valuable discussions and for critically reading the manuscript.
The preparation of this manuscript was funded through the Metrix project by the Ministry for Environment and Food in Denmark. The Ministry for Environment and Food in Denmark had no role in the design, analysis or writing of this article.
The authors’ contributions are as follows: M. P. and M. J. N. formulated the research question, designed the study and drafted the manuscript; S. F. provided essential material; M. P. carried out the study and analysed the data; all the authors approved the final version of the manuscript.
None of the authors has any conflicts of interest to declare.