


1. Introduction
Progress towards universal access to affordable electricity and clean cooking in sub-Saharan Africa remains slow – not only due to underinvestment in infrastructure (IEA, 2023) but also because of limited household uptake where infrastructure is available (see Schmidt and Moradi (Reference Schmidt and Moradi2026) and Masselus et al. (Reference Masselus, Ankel-Peters, Gonzalez Sutil, Modi, Mugyenyi, Munyehirwe, Williams and Sievert2025) for recent examples from Burkina Faso and Rwanda). Scaled-down transitional energy technologies offer improved energy services for populations outside the reach of electricity grids and cooking gas supply chains, but they also face adoption challenges. Energy-efficient biomass cookstoves (EEBCs) and small solar systems are such devices that provide essential lighting and cooking energy services more efficiently than traditional technologies and at low cost, although not entirely emissions-free. Despite high private and plausibly positive social returns documented in lab settings and in randomized field trials, many households continue using inefficient, costly and unhealthy technologies (Mobarak et al., Reference Mobarak, Dwivedi, Bailis, Hildemann and Miller2012; Grimm et al., Reference Grimm, Lenz, Peters and Sievert2020). This pattern of under-adoption mirrors findings for other high-return products such as malaria bed nets and water disinfectants (see, for example, Luby et al., Reference Luby, Mendoza, Keswick, Chiller and Hoekstra2008; Cohen and Dupas, Reference Cohen and Dupas2010).
In this paper, we focus on individual-specific behavioural factors as potential reasons for the under-adoption of our two transitional energy technologies. Households’ willingness-to-pay (WTP) revealed in real-purchase offers serves to compare potential driving factors that we derive from the psychological, economic and marketing literature. We use WTP data collected with a method that incentivizes the disclosure of truthful preferences, the Becker–DeGroot–Marschak (BDM) method, combined with detailed information about consumer behaviour from Senegal for EEBCs and from Rwanda for solar devices.
We first review the evidence to show that private returns to households are indeed positive for both devices. Using standard econometric analyses, we also show that liquidity constraints matter but can hardly explain the dominant part of the observed variance in uptake. We then motivate the role of various behavioural constraints including risk aversion, innovation resistance, time preferences and beliefs and analyse their importance empirically using the same econometric framework to assess whether these factors correlate with households’ WTP for the new technologies.
More generally, our findings contribute to a growing literature that seeks a better understanding of consumer demand for socially desirable household technologies designed for price-sensitive, resource constrained ‘base’ or ‘bottom of the pyramid’ (BoP) consumers (Prahalad, Reference Prahalad2012). BoP markets present significant departures from the assumptions of theories developed in an industrialized country context and decision-making behaviour of the poor differs significantly relative to the middle or upper class (Burgess and Steenkamp, Reference Burgess and Steenkamp2006; Narasimhan et al., Reference Narasimhan, Srinivasan and Sudhir2015). Market information is often not readily available in rural areas of low-income countries and, if it is, it is less trusted (Lascu, Reference Lascu2014).
More specifically, our findings add to the literature on household-level determinants of fuel and stove transitions (Lewis and Pattanayak, Reference Lewis and Pattanayak2012; Bonan et al., Reference Bonan, Pareglio and Tavoni2017; Kar et al., Reference Kar, Tawiah, Graham, Owusu-Amankwah, Daouda, Malagutti, Chillrud, Harned, Iddrisu, Apraku and Tetteh2024).Footnote 1 Methodologically, our contribution is to add evidence based on WTP to a literature that relied on stated preference methods and focused on technical parameters (e.g., Abdullah and Jeanty, Reference Abdullah and Jeanty2011; Johnson and Takama, Reference Johnson, Takama, Janssen and Rutz2012; Sievert and Steinbuks, Reference Sievert and Steinbuks2020), partly also assessing risk and time preference (Jeuland et al., Reference Jeuland, Bhojvaid, Kar, Lewis, Patange, Pattanayak, Ramanathan, Rehman, Tan Soo and Ramanathan2015; Carrasco-Garcés et al., Reference Carrasco-Garcés, Vásquez-Lavín, Oliva, Pincheira and Barrientos2021; Talevi et al., Reference Talevi, Pattanayak, Das, Lewis and Singha2022). Previous research has emphasized the role of liquidity and credit constraints as well as imperfect information, yet they can typically only explain some of the variance observed in take-up (Gaurav et al., Reference Gaurav, Cole and Tobacman2011; Tarozzi et al., Reference Tarozzi, Mahajan, Blackburn, Kopf, Krishnan and Yoong2014; Beltramo et al., Reference Beltramo, Blalock, Levine and Simons2015; Grimm et al., Reference Grimm, Lenz, Peters and Sievert2020). Lee et al. (Reference Lee, Miguel and Wolfram2020) underpin the dominant role of costs by finding a sharp decrease in electricity connection rates in Kenya as fees increase: while almost all households connected if connection was for free, a subsidy equivalent to 57 or 29 per cent increased connection rates by only 23 and 6 percentage points, respectively. Mekonnen et al. (Reference Mekonnen, Hassen, Jaime, Toman and Zhang2023) find a similar pattern for solar lanterns subsidies.
In their survey of the literature on the diffusion of agricultural technologies, Foster and Rosenzweig (Reference Foster and Rosenzweig2010) conclude that ‘ultimately the interplay between behaviour, market settings, traditional institutions and technology payoffs need to be addressed to more fully understand the variety of experiences over time and across countries in utilizing productive resources and adopting new technologies’ (Foster and Rosenzweig, Reference Foster and Rosenzweig2010: 420). In light of this interplay, this study does not aim to completely separate the influence of income and market imperfections, such as credit constraints, from our behavioural factors. Both types of factors have origins in rational decision-making and utility maximization. Instead of pinpointing which factors are the ultimate root causes, our objective is to enhance our understanding of how behavioural factors relate to technology adoption. This exploration seeks to determine whether the behavioural factors offer additional avenues for enterprises and policy to facilitate households’ transition to clean energy.
The remainder of this paper is organized as follows. In Section 2, we provide the theoretical framework of our study, followed by the empirical set-up in Section 3, where we also show the operationalization of the behavioural factors from our theoretical framework. Main results are presented in Section 4. We end the paper with a brief conclusion in Section 5.
2. Theoretical framework
This section lays out the theoretical framework on behavioural factors that may influence purchase decisions with respect to energy use, in order to derive hypotheses about the WTP for EEBCs and solar lighting devices. We rely on consumer behaviour economic theory in general and innovation decision theory more specifically, accounting for the context of resource-poor consumers in developing countries. In line with the literature, we consider three types of household-specific behavioural factors: (1) risk aversion and consumer resistance, (2) time preference and (3) experience and beliefs. We therefore do not address group-specific factors that may also affect purchase patterns, such as local cultural features (Petersen et al., Reference Petersen, Kushwaha and Kumar2015) and social interaction (Miller and Mobarak, Reference Miller and Mobarak2014; Bonan et al., Reference Bonan, Battiston, Bleck, LeMay-Boucher, Pareglio, Sarr and Tavoni2021; Alem and Dugoua, Reference Alem and Dugoua2022).
2.1. Risk aversion and innovation resistance
Innovations carry risks for consumers. The psychology and marketing literature captures risk aversion through consumer resistance, driven by perceived risk and habit (Ram, Reference Ram1989; Ram and Sheth, Reference Ram and Sheth1989). Perceived risk, in turn, includes the factors physical risk, economic risk and functional risk. These risk perceptions are all readily conceivable for our energy-access technologies. Not least, poor people may be reluctant to take the economic risk of larger initial investments, especially if there is a functional risk of new technologies in the form of faulty and counterfeit devices, as is the case in some small-scale solar markets (Mills et al., Reference Mills, Tracy, Alstone, Jacobson and Avato2015). The second dimension of consumer resistance, habit, makes it difficult, and psychologically costly, for consumers to break with traditions and existing values and thereby to adopt new technologies (Rogers, Reference Rogers2003). Traditional cooking practices are deeply embedded within cultural and social norms and households could, for instance, prefer food prepared over an open fire (Herington et al., Reference Herington, Lant, Smart, Greig and van de Fliert2017). People may also overestimate the necessary behavioural adjustment required to use a new stove (Dupas, Reference Dupas2014). This innovation resistance could again impede the adoption of modern technologies. What is perceived as innovation resistance may, however, also reflect ability to pay or consumer choices for alternative frugal innovations, such as battery-driven lamps in the case of off-grid lighting solutions (Bensch et al., Reference Bensch, Peters and Sievert2017). Similarly, how risk aversion affects the purchase decision eventually depends on the relative riskiness of old and new technologies as perceived by an individual, since sticking with an old technology obviously involves risks as well (Marra et al., Reference Marra, Pannell and Ghadim2003).
For the products considered in our analysis, Jeuland et al. (Reference Jeuland, Bhojvaid, Kar, Lewis, Patange, Pattanayak, Ramanathan, Rehman, Tan Soo and Ramanathan2015) find in their study relying on contingent valuation that risk-taking households place a lower WTP on fuel-efficient stoves.
Guided by these theoretical considerations, we test the following hypotheses:
H1: The WTP decreases with risk aversion.
H2: The WTP decreases with innovation resistance.
2.2. Time preference
Poor consumers face more serious liquidity and credit constraints, making it difficult to smooth consumption over time through savings or financing. As a result, immediate necessities take precedence, and future benefits are more strongly discounted. This leads to relatively high time discount rates, which can discourage the adoption of new technologies that resemble investment goods. In addition, households may exhibit hyperbolic discounting or present bias in that they put more weight on consumption in  $t$ vs. $t + 1$ than on vs. $t + 2$. This pattern is incompatible with standard assumptions of intertemporal utility maximization (see, for example, Duflo et al., Reference Duflo, Kremer and Robinson2011; Mahajan et al., Reference Mahajan, Michel and Tarozzi2026).
In the context of clean energy, Talevi et al. (Reference Talevi, Pattanayak, Das, Lewis and Singha2022) used contingent valuation in their study on biogas cooking in rural India and found a lower WTP for fuel efficiency among households with a higher preference for the present.
Hence, we test the following hypothesis:
H3: The WTP decreases with time preference, that is, a preference for the present.
2.3. Experience and beliefs
Consumers form beliefs about the usefulness of a new technology. In the absence of own experience in using a new technology, households may rely on other sources of information about its benefits and inconveniences and how to use it appropriately (see, e.g., Foster and Rosenzweig, Reference Foster and Rosenzweig2010). The literature describes this problem with three attributes of an innovation: ‘complexity’, i.e., the degree to which an innovation is perceived as being difficult to use; ‘observability’, i.e., the degree to which the results of an innovation are observable to potential customers; and ‘trialability’, i.e., the degree to which an innovation may be experimented with before adoption (Rogers, Reference Rogers2003; Arts et al., Reference Arts, Frambach and Bijmolt2011).
For the products considered in our analysis, Yoon et al. (Reference Yoon, Urpelainen and Kandlikar2016) tested whether trial periods increase the WTP for solar lanterns in rural India but did not find any significant effect, in contrast to Levine et al. (Reference Levine, Beltramo, Blalock, Cotterman and Simons2018) who observed WTP-increasing learning effects from a free trial for EEBCs. The findings from Bensch and Peters (Reference Bensch and Peters2020) and Meriggi et al. (Reference Meriggi, Bulte and Mobarak2021) – like those of Yoon et al. (Reference Yoon, Urpelainen and Kandlikar2016) and Levine et al. (Reference Levine, Beltramo, Blalock, Cotterman and Simons2018) based on real-purchase offers – also suggest that a (full life cycle) trial has a positive effect on households’ WTP for transitional energy technologies.
Hence, the final hypothesis we test is:
H4: The WTP increases with experience with and positive beliefs about the new product.
In our context, the two transitional energy technologies differ in their level of innovativeness, with plays a critical role for the behavioural factors as outlined below. The studied EEBC rather represents a continuous innovation characterized by only minor changes in either product type or existing purchasing behaviour. In contrast, the solar lighting devices share attributes of a discontinuous innovation as they involve new consumption patterns and the creation of previously unknown products (Robertson (Reference Robertson1967) calls such a hybrid case a dynamically continuous innovation). While our study set-up does not allow us to derive hypotheses that link our findings to this distinctiveness of the nature of the product's innovativeness, the behavioural factors can generally be expected to be more pronounced for a more discontinuous innovation such as the solar lighting devices in our context.
3. Empirical set-up
3.1. The transitional energy technologies and their returns to innovations
Transitional cooking and electricity-access technologies are exemplified by the products we offered to the participants in our studies (see Table 1). They were selected in close collaboration with local policy partners and include three types of small solar systems offered in Rwanda, and an EEBC offered in Senegal. First is a portable LED lamp with an in-built battery and small solar PV panel (‘Solar Kit 1’ in the following). Second is a portable LED lamp that additionally provides phone or radio charging via two USB ports (Solar Kit 2), with an in-built battery recharged by connecting it to a separate solar PV panel. Finally, Solar Kit 3 is a solar home system with four LED lamps and a charging station with six USB ports powered by a larger PV panel and a larger, separate battery. The EEBC is a portable single-pot clay-metal firewood stove.
Specifications of transitional energy technologies offered in this study

Notes: Wp stands for Watt peak, the peak power the solar kits can provide. Local currencies are converted to US$ with official exchange rates at the time of the surveys of 100 FRW = 0.138 USD and 100 CFAF = 0.170 USD.
Sources: https://www.lightingglobal.org, Dassy Enterprise Rwanda, GIZ; Pictures: Brian Safari/ IB&C, Centre d'Études et de Recherche sur les Energies Renouvelables (CERER)/ Dakar.
Our previous work provides rigorous evidence on the returns of both technologies. Solar kits like Solar Kit 1 lead to reductions in energy expenditures of 40 per cent, which corresponds to an annual return on investment of 19 per cent (Grimm et al., Reference Grimm, Munyehirwe, Peters and Sievert2017). Grimm et al. (Reference Grimm, Lenz, Peters and Sievert2020) found savings potentials for each solar device shown in Table 1. In addition, the study showed that children in households with a solar kit shifted part of their study hours into the evening and boys studied more. Finally, better quality light is likely to reduce indoor pollution and increase the value of leisure time and productivity of household activities such as cooking and light manufacturing such as the repair of clothes (Grimm et al., Reference Grimm, Munyehirwe, Peters and Sievert2017).
For the EEBC offered in Senegal, the so-called Jambar, a randomized field study showed reductions in firewood consumption by around 30 per cent per week and decreases in cooking duration by over 20% (Bensch and Peters, Reference Bensch and Peters2015). In addition, the portable stove facilitates outside cooking and the cook needs to spend less time in direct proximity to the cooking spot. This considerably reduces smoke exposure and is likely responsible for the decrease in self-reported respiratory disease symptoms and eye problems among women responsible for cooking (Bensch and Peters, Reference Bensch and Peters2015). While these benefits are mostly non-monetary in the rural context where households tend to collect firewood for free, an EEBC disseminated in urban Burkina Faso, for example, turned out to pay off already after 3 months for more than two-thirds of the population (Bensch et al., Reference Bensch, Grimm and Peters2015).
3.2. Sample design and experimental procedure
The data used in this paper have been collected in the context of two WTP experiments among two random samples of 583 households in total from 34 rural localities in Rwanda and Senegal (see Table 2). We argue that the study sites are representative of the ultimate target regions for transitional cooking and electricity-access technologies in the two countries as well as other sub-Saharan African countries. Only a few households had these technologies at their disposal at baseline, for example, thanks to relatives from urban areas. All village leaders endorsed our visits and less than 3 per cent of sampled households were unwilling to participate in the study.
Key data on the study populations and data collections

Note:
a The Senegal sample originally also included households from the treatment group of a randomized controlled trial conducted 6 years before the WTP experiment, to which the Jambar stove was allocated at zero price. Those treatment households are excluded from the present study, since previous EEBC ownership through the randomization likely interacts with many of the factors we assess in this study. We thereby restrict our sample to households who lived without access to the new technology at the time of the WTP experiment.
Household demand is elicited using a purchase offer procedure according to the BDM method. The BDM method incentivizes truthful bidding by ensuring that a participant's bid determines whether they can purchase the product, but not the price itself (Lusk et al., Reference Lusk, Alexander and Rousu2007). The method has already been widely used in laboratory settings, but also in field experiments and developing countries to elicit consumer preferences (Wertenbroch and Skiera, Reference Wertenbroch and Skiera2002; Homburg et al., Reference Homburg, Koschate and Hoyer2005; Berry et al., Reference Berry, Fischer and Guiteras2020; Grimm and Hartwig, Reference Grimm and Hartwig2022). Specifically, the buyer states the maximum amount she is willing to pay, and a sales agent subsequently draws a price from a pre-announced distribution. If the bid equals or exceeds the drawn price, the buyer purchases the product at the drawn price; if not, no transaction takes place. Overstating WTP would lead to purchasing at a price above true valuation, while understating it risks missing out on a worthwhile offer. This structure encourages participants to reveal their true valuation. Another useful feature of BDM is that it allows for separation of bids from market price and thereby yields higher-resolution data on households’ WTP as compared to take-it-or-leave-it approaches, which provide only WTP bounds.
As such, the BDM approach simulates market conditions in a non-exploitative way, helping to inform more equitable and effective subsidy and marketing strategies, while balancing realism with respect to the participant's agency. These ethical considerations are particularly important given the income-constrained setting. As we detail in the following, the design and implementation of our study included multiple safeguards to ensure comprehension and transparency, minimize pressure and allow participants to opt out at any time.
Each household was informed in advance about a visit by a solar or stove seller that included a survey on energy use. The person responsible for taking financial decisions in the household was asked to be present. At the beginning of the interview, all households were asked for their consent to participate in the bidding process and the subsequent survey. While they were not informed about the study's broader research purpose, the dual role of the enumerators – as both sales agents and interviewers – was clearly communicated. Enumerators were trained to present the products in an engaging and balanced way, highlighting advantages and disadvantages, to demonstrate how the products are used and to administer the BDM procedure in a neutral and comprehensible manner. In Rwanda, they offered the three solar kits in sequence, starting with Solar Kit 1 and ending with Solar Kit 3. After advertising the first product, the field team introduced the BDM purchase offer procedure to each participant followed by a hypothetical practice round without real purchase for a different product (a mobile phone in Rwanda and a solar lantern in Senegal). This helped familiarize participants with the mechanics of the bidding process before any real decision was made.
In general, the procedure was well understood. Rwandan participants were additionally informed about a randomly assigned payment period (1 week, 6 weeks or 5 months), which enhanced affordability even for higher bids and larger systems. All participants were then asked to state their WTP for the first product, knowing that the price would be randomly drawn in public only after bidding. Before bidding for the second and third product, participants in Rwanda had to decide which product they would buy in case two or three of the submitted bids exceeded the drawn prices. This ensured independency of the different bids, i.e., participants did not need to bother about having to spend their available budget over multiple products. To ease the cognitive burden of valuing unfamiliar products, participants in Rwanda were moreover informed about the minimum and maximum prices in the draw (Gregory et al., Reference Gregory, Lichtenstein and Slovic1993).Footnote 2
The price draws were conducted the same day in a public community meeting, ensuring transparency and accountability. Participants whose bids exceeded the drawn price received the product immediately and signed a binding but non-enforced sales contract. Payment was flexible: beyond a voluntary advance payment, transfers could be made via mobile banking (Rwanda) or with the village chief (Senegal). In Rwanda, local authorities also assisted with logistical follow-up on instalment payments. Participants could return the product at any time without financial penalty – a safeguard not disclosed to participants when they submitted their bids. In practice, several households in Rwanda who submitted successful bids declined to sign a purchase contract (15 per cent), and a further 29 per cent defaulted before completing full payment. At 4 per cent each, both rates were substantially lower in Senegal. This design thus sought to engage participants through a commitment device, while maintaining flexibility to accommodate financial constraints and ensure ethical integrity. The sample composition according to the households’ WTP participation, bidding and payment behaviour can be taken from Table A1 in the online Appendix.
After bidding had concluded and prior to the price draws, the enumerators administered a structured questionnaire on socio-economic status and on behavioural factors used to construct the various indicators used in our analysis. They are summarized in Table 3 and described in more detail in online Appendix B.
Alternative determinants of technology adoption and their operationalization

Notes: SD refers to the standard deviation. Expected lifetime has been elicited for Senegal only. For the Senegal data, 37 and 20 ‘don't know’ answers are excluded for self-assessed inclination to adopt new technologies and expected lifetime, respectively.
3.3. Behavioural indicators and their operationalization
For each of the four hypotheses derived in Section 2, we specify a set of behavioural variables as potential determinants of technology adoption and summarize their operationalization in Table 3. All behavioural variables are based on structured survey questions administered after the BDM bidding procedure. These questions include self-assessments, perceptions and reports of prior adoption behaviour, as well as responses to hypothetical scenarios involving financial trade-offs without real monetary incentives. While the absence of incentivization reduces the accuracy and validity of these particular measures, they follow established formulations from household surveys and applied technology adoption studies, and we believe they still carry useful information.
The strength and clarity of construct validity – that is, how well the indicators reflect the underlying behavioural concepts – vary across the different measures. For instance, we do not distinctly map measures onto the separate constructs of risk aversion and consumer resistance, which is why Table 3 presents them in conjunction. Similarly, the measure for expected product lifetime – while capturing behavioural factors – also reflects more rational or experience-based assessments.
3.4. Estimation framework
The empirical analysis seeks to identify behavioural factors associated with purchase decisions based on the bids households made for the transitional energy technologies offered in the two studies in Rwanda and Senegal. A substantive econometric issue arises from the fact that some households were – understandably – not willing to bid for every product, particularly the most expensive Solar Kit 3. While virtually all households submitted bids in Senegal, and only a few households did not participate for the smaller kits in Rwanda, a considerable share of 45 per cent of sampled households in Rwanda did not bid for Solar Kit 3 (see Table A1 in the online Appendix). These households most often explained their non-participation by stating that the product was beyond their financial means. This suggests that the zero responses are meaningful indicators of affordability constraints. Reflecting this, we estimate a Tobit-type model for the Solar Kit bids in Rwanda, while applying standard ordinary least squares (OLS) regressions for Senegal. Bushway et al. (Reference Bushway, Johnson and Slocum2007) propose this class of model estimators for cases where the decisions on whether to participate and on the bid amount are made in an integrated manner. This holds true for the Rwandan purchase offers, since households were informed about the minimum price in the draws. Thus, the WTP of non-bidders can be interpreted as lying below the respective minimum price. To account for this censoring and for the fact that some bidding households submitted bids below the minimum price, we apply an interval data model, which is a generalization of the Tobit model where censoring and interval ranges can be defined for each observation individually (Cameron and Huppert, Reference Cameron and Huppert1989). Beyond non-participation in the bidding, we also observe some households in Rwanda declining to buy the kit and others defaulting on payment.
We regress the individual bids  $Y\,$ of households $i$ from community separately on each of the eight behavioural, individual-specific factors ${Z_i}$ described in Section 3.3. Our main estimations are
 \begin{equation}\,{\text{ln}}({Y_{ij}}) = {\alpha _0} + {\alpha _1}{Z_{ij}} + {\upsilon _j} + {\in _{ij}},\end{equation}
 \begin{equation}{\text{ln}}({Y_{ij}}) = {\alpha _0} + {\alpha _1}{Z_{ij}} + X{'_{ij}}{\alpha _2} + {\upsilon _j} + {\in _{ij}}\end{equation}
 once without (1a) and once with (1b) a vector of further explanatory variables  $X^{\prime}_i$. The main coefficient of interest is ${\alpha _1}$, the coefficient for the behavioural variables ${Z_i}$. In all estimations, bids are log-transformed such that the estimated coefficients can be interpreted as elasticities or semi-elasticities. Furthermore, all estimations include village dummies ${\upsilon _j}$ and an unobserved household-specific residual, ${\in _{ij}}$. As base regressions, we additionally estimate Equation (1b) without ${Z_i}$ and thus include only the non-behavioural explanatory variables. $X{'_i}$ covers several socio-demographic household characteristics and proxies for household wealth and income that are potentially important in the adoption of the relevant new technologies. They include household size (in natural log (ln)), the household head's education as well as gender and whether s/he is a subsistence farmer. Building materials of the house and vehicle ownership are included to control for household's wealth. We control for income through household expenditures that exclude expenditures on energy. We also include the age difference between the enumerator and respondent, since studies have shown the household head's age to be an important predictor of technology adoption and since the specific interview situation may influence response behaviour. Estimations using data from Rwanda additionally involve controls for the randomly assigned payment period. Descriptive statistics on these control variables can be taken from Table A2 in the online Appendix, which underpin the fact that living standards differ across the two countries despite similarities in the context. For example, household sizes and expenditure levels are by far larger in Senegal, whereas formal education is clearly higher in Rwanda.
In addition to reporting robust standard errors, we calculate sharpened q-values using the Benjamini–Krieger–Yekutieli procedure (Benjamini et al., Reference Benjamini, Krieger and Yekutieli2006) to address concerns of multiple hypothesis testing. This method controls the false discovery rate while allowing for arbitrary dependence among test statistics. We follow Anderson (Reference Anderson2008) and apply the correction within each hypothesis block (risk aversion and consumer resistance (H1 and H2); time preferences (H3); experience and beliefs (H4)), pooling results across products, and conduct it separately for models with and without controls, i.e., our Equations (1a) and (1b).
4. Results
4.1. Base regressions
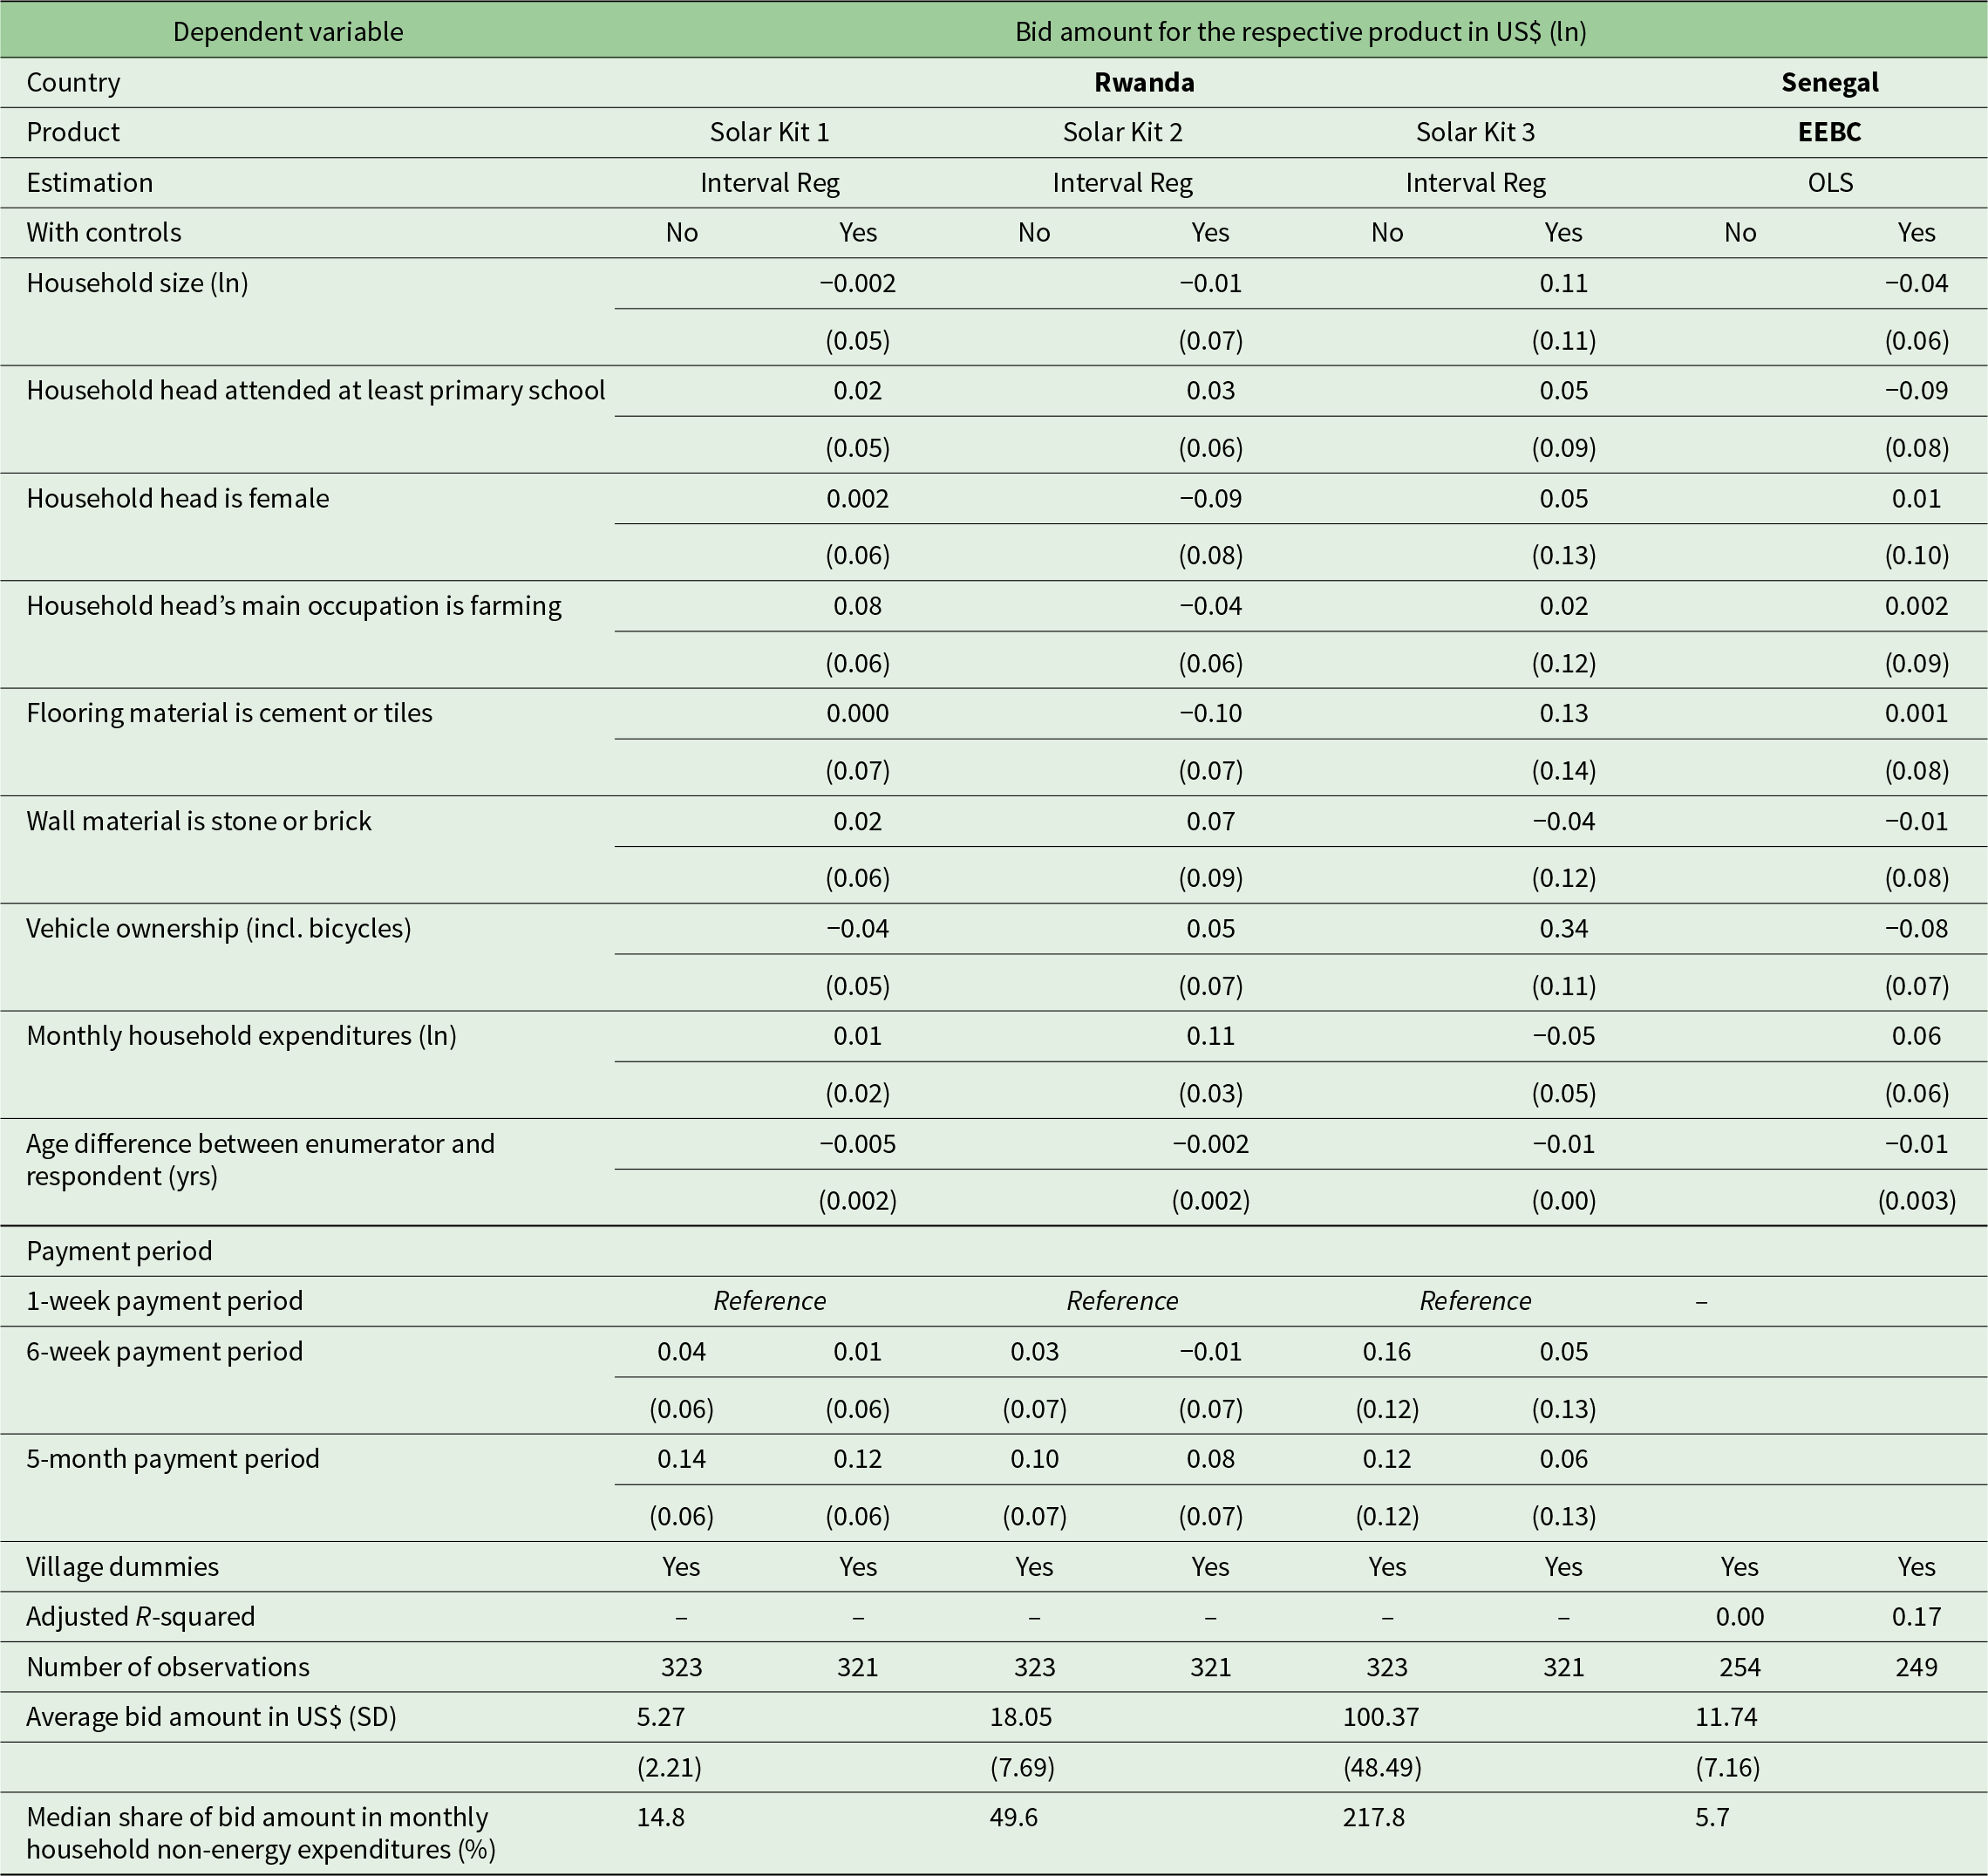
Table 4 presents results for base regressions that only include the non-behavioural explanatory variables. This gives an idea of how bidding is generally correlated with the characteristics that are subsequently used as control variables. Table 4 shows that our control variables do not explain much of the variance in the elicited WTP. Correlations are largest in size for Solar Kit 3. Still, even these correlations are rather weak, for example, for household size. Formal education is a positive predictor for higher bids only in Rwanda, which may be due to the informal religious education common among older household heads in Senegal. Despite cooking being a household chore for women in the two countries, female-headed households are not more inclined to submit higher bids for cooking stoves.
Base regressions without technology adoption determinants

Notes: SD refers to the standard deviation. Robust standard errors in parentheses.
Wealth indicators and expenditure levels as an income proxy, unsurprisingly, show some but not too strong of a correlation with the two larger, more expensive solar kits, whereas no pattern can be observed in Senegal for cooking stoves. A larger age difference between sales agent and potential buyer mostly affects bidding negatively. Lastly, the longer payment periods granted to respondents seem to have the most robust effect for the small Solar Kit 1, which may hint at the disproportionally strong liquidity constraints among those most interested in these small systems. This experimental variation was intentionally introduced in Rwanda, where more expensive solar kits were offered, to examine how payment flexibility interacts with behavioural traits in shaping adoption decisions. The analysis throughout the paper accounts for this variation, and we interpret behavioural predictors of WTP conditional on these financial terms.
To provide further context, Table 4 also reports the median share of the bid amount in monthly household non-energy expenditures, illustrating the varying affordability burdens across products.
4.2. Main results
We now turn to Table 5 with results for the different potential behavioural technology adoption determinants. Again, the table presents specifications without and with the control variables from Table 4. Each set of results for the individual variables refers to separate estimations. The five first measures presented in the table refer to the behavioural dimension Risk aversion and consumer resistance. The self-assessment of households regarding their inclination to adopt new technologies and the investment risk tolerance both strongly correlate with the measured WTP for the discontinuous innovation, the solar kits. This differs from the EEBC in Senegal, for which these behavioural aspects play a minor role in the uptake decision. The significant coefficients imply, for example, that a one-level increase in the four-level Likert scale on new technology adoption goes along with a 10–29 per cent higher bid for the individual solar kits. Remember that respondents did not yet know whether they had successfully bid for the solar kit or cooking stove when answering the structured questionnaire. Hence, the reporting of a high inclination to adopt new technologies cannot just be a reflection of a successful bid.
Estimation results for the different technology adoption determinants

Notes:
a A Wald test is performed to test the joint significance of the three attributes heard before, owned or used before and currently owning. Robust standard errors in parentheses. Benjamini–Krieger–Yekutieli (BKY) sharpened q-values in square brackets.
The even more pronounced correlations for investment risk tolerance do not necessarily imply that households willing to invest in these products are more prone to take risks per se: we find rather little evidence that the inclination to adopt the new technology increases with a higher acceptance of an income gamble, i.e., for households with a preference for a potentially higher but more uncertain payout over a fixed payout with identical expected value. Overall, we conclude that the data rather support our first hypothesis H1: The WTP decreases with risk aversion, i.e., increases with risk tolerance. This effect is, furthermore, more pronounced with the discontinuous innovation than with the continuous innovation.
The early adoption measure is the only measure for which we find a significant positive correlation for all four assessed products. The coefficients in Table 5 suggest that early adoption of other new technologies goes along with an up to 24 per cent higher WTP. Looking closer into this measure exposes the dearth of new technologies available to the rural households: they are mostly confined to new fertilizers, agricultural techniques and mobile money, apart from cooking stoves or solar technologies. Similarly, little variation could be observed for the index of low innovation resistance (see also Table 3). People are mostly open to new technologies, but hesitant in that the large majority prefers to wait for technology advancements. Still, we find that a less pronounced innovation resistance is positively associated with WTP in the cooking stove sample. Overall, we find support for our hypothesis H2 – lower innovation resistance tends to be associated with higher WTP.
The factor preference for the present delivers small and imprecise estimates, which may be due to its ambiguous nature in our context: as noted above, a higher preference for the present is generally a barrier to adoption since longer-term benefits are discounted more strongly. Yet, in our set-up, people immediately received the product, whereas payment only took place later. This created some incentive for people with a higher preference for the present to purchase the products. We see this when introducing interaction terms between time preference and payment periods in our estimations for Rwanda (not shown in the table): the pure time preference effect becomes negative in all estimations, whereas the interaction terms with longer payment periods show positive (though not statistically significant) coefficients. Hence, there is only weak and imprecise evidence related to our hypothesis H3 on the relationship between WTP and a preference for the present.
Testing the effect of any past experience with the new technology is insightful as people may have heard both positive and negative comments about the products. Significant or borderline significant effects (p-values between 0.05 and 0.13) are primarily observed for the two larger Solar Kits (2 and 3); however, once multiple hypothesis testing is accounted for, these effects appear less robust – at least in the specifications that include controls. The coefficient for currently owning the respective device is also presented for the sake of completeness. However, it is not comparable since it rather reflects the WTP for an additional product of the new device type. To conclude, the results support the hypothesis H4, where we put forward that WTP generally increases with knowledge about and experience with a new (quality) product and that this relationship is stronger for the more complex discontinuous innovation.
Finally, the expected lifetime, which has only been elicited for Senegal, has a significant effect on the individuals’ WTP. Yet, the size of the effect seems fairly modest: the coefficients can be interpreted in such a way that the WTP of someone who expects the cooking stove's lifetime to exceed its general lifetime by 50 per cent has a WTP that is about 5 per cent higher than the WTP of someone who expects the cooking stove to fall apart when merely half of the general lifetime has elapsed. Hence, this suggests that consumers align their WTP with the expected usage period of the investment.
Overall, we see stronger associations for the small solar systems, potentially because they share more attributes of a discontinuous innovation. We cannot exclude that the absence of significant associations is partly due to insufficient statistical power, but estimates suggest that the picture would not deviate substantively if more data were available. Our results substantiate the relevance of behavioural factors to understand the demand for innovative consumer durables. Behavioural factors have a moderate effect on people's absolute WTP. Similar to fundamental socio-demographic factors such as the educational level or the main occupation of the household head, they cannot explain large parts of the variation in WTP. Yet they contribute significantly to the overall decision process and hence constitute an important piece of information for potential suppliers on these markets.
5. Conclusion
Recent research has highlighted that energy-access programs, even when targeting underserved rural areas, often fail to reach the poorest households within those areas. Program design features such as upfront costs, payment modalities and delivery mechanisms can systematically exclude the poorest segments, even when geographically well targeted (Ankel-Peters et al., Reference Ankel-Peters, Bensch, Köngeter, Rauschenbach and Sievert2025). These findings underline the importance of improving the affordability of energy access, while also highlighting the need for a more nuanced understanding of adoption constraints in low-income settings, including behavioural and contextual factors.
Elaborating effective policy designs and marketing strategies for the distribution of new technologies in BoP markets requires understanding the interplay between behaviour, market settings, traditional institutions and technology payoffs simultaneously. When the advantages and disadvantages of a technology are not easily observed or understood, BoP consumers are particularly sensitive to factual information and credible knowledge about the technologies that are offered to them. BoP consumers tend to be risk averse and rather tend to wait until a new technology has made its inroads into their communities.
Our results suggest that policy designs and marketing strategies might benefit from considering behavioural heterogeneity rather than assuming a representative household. For example, less risk-averse households demonstrated higher WTP and appeared more likely to adopt early. While our data do not support screening households based on behavioural traits, such insights may inform aggregate-level strategies such as time-limited offers, product trials or return options – especially for early roll-out phases. These behavioural tools may help engage early adopters while maintaining outreach to more hesitant or liquidity-constrained groups. More specifically, our results show that the self-assessed inclination to adopt new technologies is particularly important for the small solar devices but in turn do not explain much in the uptake of EEBCs. EEBCs are clearly not as complex as solar lamps, which may explain the difference in the role of behavioural patterns observed across both products.
That said, we recommend applying behavioural tools conservatively and only in conjunction with strategies that improve affordability and access. In many underserved rural areas, high upfront costs, such as for household wiring or improved cookstoves, remain major barriers to adoption, especially for the poorest. Importantly, behavioural strategies – particularly when implemented by donor-supported programs – may carry the risk of embedding external norms or assumptions into program design. To avoid this, such interventions should be aligned with national strategies and local understanding of energy needs. Behavioural insights can complement but should not replace structural efforts to broaden access and reduce cost barriers.
In interpreting our results, it is important to acknowledge two main limitations. First, three of the behavioural indicators used to test our hypotheses on risk aversion and time preferences were neither tied to real financial outcomes nor experimentally varied, implying that they are not necessarily incentive compatible. This may constrain the interpretability of associations between behavioural traits and WTP. Second, beyond non-participation in bidding, we also observe that some households in Rwanda declined to sign a purchase contract after a successful bid or later defaulted on payment after initially committing. While we interpret defaults primarily as a result of weak enforcement incentives – unlikely to bias bid levels upwards – we cannot fully rule out that some participants may have overbid relative to their true valuation and later reversed their decision, either by declining or defaulting. Such reversals may reflect strategic behaviour in some cases but could also result from genuine uncertainty or changing circumstances. This potential source of bias should be kept in mind when interpreting bid magnitudes, particularly in the Rwandan case.
In addition, while we include data from two countries to explore behavioural adoption constraints across contrasting energy technologies, the study is not intended as a formal cross-country comparison, as it involves different technologies and implementation contexts. Future work could improve upon these limitations by employing incentivized behavioural measures, harmonized product designs across settings and closer tracking of post-bid commitment decisions.
Supplementary material
The supplementary material for this article can be found at https://doi.org/10.1017/S1355770X26100540.
Data availability statement
The data that support the findings of this study are available at https://doi.org/10.7807/BENSCHGRIMM-WTP-ENERGY-EDE:V1.
Acknowledgements
Data collection underlying this research was financially supported by the Center for Development Research in Bonn (ZEF) and the Federal Ministry for Economic Cooperation and Development (BMZ). We thank Jörg Ankel-Peters, Elisabetta Di Vito, Nadine Kneppel, Luciane Lenz and Maximiliane Sievert for their valuable support. We also thank two anonymous reviewers and the co-editor, Carlos Chávez, for very useful comments, and the IB&C and CRDES teams for managing fieldwork, and all survey participants in Rwanda and Senegal.
Competing interests
The authors declare none.


 Open access