

Introduction
As is well known, sea ice in the Sea of Okhotsk is created along the coast of Siberia by cold air masses blowing across the sea. The sea ice then flows along the eastern side of the Sakhalin peninsula as a result of the coastal currents that carry it toward Hokkaido, Japan, where sea ice reaches its most southerly extent (Fig. 1). of particular interest, this sea ice along the northern coast of Hokkaido is the lowest-latitude occurrence of sea ice in the world, and is thus a potential first indicator of the effects of climate change.

Fig. 1. US National Oceanic and Atmospheric Administration (NOAA) satellite image of sea ice in the Sea of Okhotsk (27 February 2003) obtained by the Kitami Institute of Technology.
Sea ice along the Shiretoko peninsula was an important consideration in the decision to register this area as a UNESCO World Natural Heritage Site in July 2005. Sea-ice conditions in this area produce ecological consequences that provide unique assemblages of fish and land animals. The future of sea ice in the Sea of Okhotsk is thus of interest as a means of assessing the impact of climate change on local fish and animal ecology.
To investigate both present and future sea-ice conditions in the area, and particularly around the northern reaches of Hokkaido, we studied the seasonal duration of sea ice using sea-ice report maps provided by the Japanese Coast Guard. These maps were also used to describe basic features of sea-ice drift and to correlate these features with processes that lead to possible reduction of sea-ice presence in the area. The basic sea-ice drift pattern along the coast of Hokkaido is driven by the southeastward Soya current (Reference AotaAota, 1975; Reference MatsuyamaMatsuyama, 1999), which causes sea ice to concentrate on the Shiretoko peninsula, acting as a ‘dam’ to sea-ice flow.
The seasonal time period over which sea ice is present along the coast of Hokkaido has been decreasing recently in response to local warming (Reference NakamuraNakamura, 1996; Reference HondaHonda, 2007). We thus examine the dependency of the length of time sea ice is present in the region on air temperatures along the northern coast of Hokkaido (facing the Sea of Okhotsk).
Distribution of Sea-Ice Duration
Figure 2 shows an example of the daily sea-ice report provided by the Coast Guard of Japan. We used these maps to create a sequence of yearly sea-ice durations. The sea-ice duration, D f, of full sea ice (with concentrations, C, of 1 on a scale of 0–1) was calculated by accumulating daily sea-ice concentrations (using Equation (1)) in the 3 month winter period at every gridpoint with an interval of 0.5˚ latitude and longitude (corresponding to 55.5 and 40.0 km) in the area 43–47˚ N, 141–146˚ E (Reference Kosugi, Takahashi and HoriKosugi and others, 2009).

Fig. 2. Daily sea-ice report (23 January 2008) provided by the Coast Guard of Japan. Dots are measurement points of sea-ice concentration.
where D f is in days and C is daily sea-ice concentration.
The calculated D f was mapped as a distribution of sea-ice duration (Fig. 3), representing the analysis for January– March over the years 1995–2009. Sea-ice duration was longest in 2000 and 2003, and shortest in 2004, 2006, 2007 and 2009.

Fig. 3. Distribution of sea-ice duration at the coast of Hokkaido (43–47˚ N, 141–146˚ E) from 1995 to 2009. Legend shows duration periods in number of days.
Dam Effect of the Shiretoko Peninsula
As shown in Figure 4, sea ice drifts southward along the eastern side of the Sakhalin peninsula as a result of the coastal current. The ice in this current reaches Hokkaido, where it then drifts southeastward as a result of the Soya current. The Shiretoko peninsula intercepts the sea ice that drifts along with the Soya current, and causes a ‘dam effect’ to produce locally long sea-ice durations and concentrations (Reference Takahashi, Kosugi and HoriTakahashi and others, 2010).

Fig. 4. Drift of sea ice at the Shiretoko peninsula in 2008. Numbers shows sea-ice durations (days).
Sea-ice durations at four sites along the coast of Hokkaido (Esashi, Monbetsu, Abashiri and Utoro) and averages of sea-ice durations in semicircular areas of both 40 and 80 km radii around these sites (Fig. 5) are shown in Figure 6. The site with the longest sea-ice duration is Utoro (Fig. 7), and the longest sea-ice durations in the semicircular areas also centre on Utoro (Fig. 6). This suggests that the dam effect of the Shiretoko peninsula is a key factor controlling sea-ice duration along the entire coast of Hokkaido.
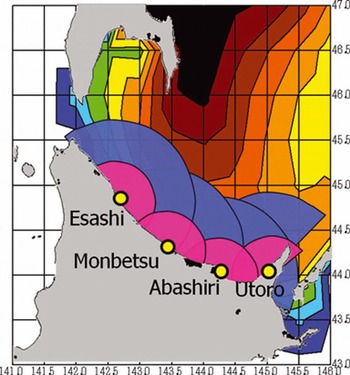
Fig. 5. Semicircular areas of 40 and 80 km radii centred on Esashi, Monbetsu, Abashiri and Utoro.

Fig. 6. Sea-ice duration at Esashi, Monbetsu, Abashiri and Utoro and in the respective semicircular areas of 40 and 80 km radii.

Fig. 7. Sea ice at Utoro in the Shiretoko peninsula.
Estimation of the Future Disappearance of Sea Ice From Hokkaido
Figure 8 shows the winter sea-ice duration at Utoro for the years 1995–2009. The duration is longest in 1999, 2001 and 2003, and shortest in 2006 and 2009.

Fig. 8. Winter sea-ice duration at Utoro. The bars show the sea-ice existence for each year: red is melting disappearance type, blue is wind-blown disappearance type, and purple is mixed type. Dates are month/day.
This sea-ice duration variation correlates with air temperature, as shown in Figure 9 which displays this correlation (January–March average) at the four coastal stations. The result of the correlation allows an extrapolation to determine the air-temperature increase relative to the present at which sea ice in the area may disappear entirely. This provides a simple way to predict the climate conditions necessary to prevent sea ice from reaching Hokkaido.

Fig. 9. Relationship between sea-ice duration, D f, and average air temperature in winter (January–March) 1995–2009 at Esashi, Monbetsu, Abashiri and Utoro. r is a correlation coefficient of each dataset.
In Table 1, the 30 year average January–March air temperature, T a, and the temperature predicted to cause the disappearance of sea ice, T 0, for each place are shown. ΔT (= T a – T 0) is the temperature increase that, if forced by climate change, would prevent sea ice from coming to each of the four sites along the coast of Hokkaido. ΔT is ~2˚C for Esashi and Monbetsu, ~3˚C for Abashiri and ~4˚C for Utoro.
Table 1. The 30 year average air temperature from January to March, T a, and the temperature predicted to cause sea-ice disappearance, T 0, for each coastal station. ΔT is the difference T a – T 0
Correlation With Arctic Sea Ice
As is well known, the summer sea-ice area in the Arctic is decreasing, and in 2007 was the lowest ever observed (Fig. 10; data provided by the US National Snow and Ice Data Center (NSIDC)). Examining the correlation of sea-ice duration at Hokkaido with the Arctic sea-ice area reveals a correlation coefficient, R (Fig. 11). The R value is largest, 0.674, for the Arctic sea-ice area in March (Fig. 12). It is small for December and November.

Fig. 10. Seasonal change in Arctic sea-ice area for each year 1995– 2009. Data provided by the NSIDC.
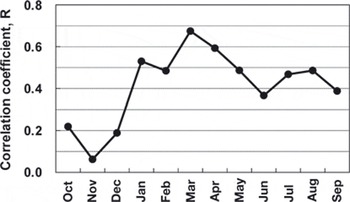
Fig. 11. Correlation coefficient, R, between the sea-ice duration in the 80 km radius semicircular area around Utoro and the monthly mean of the Arctic sea-ice area.

Fig. 12. Correlation between the sea-ice duration in the 80 km radius semicircular area around Utoro and the monthly mean of the Arctic sea-ice area in March.
We believe that the reason for the high correlation is that the sea-ice duration at Shiretoko correlates well with sea ice in the southern part of the Sea of Okhotsk, which reflects the Arctic climate. This suggests that sea-ice conditions along the Shiretoko peninsula can act as an ‘early warning’ sensor for changing Arctic sea-ice conditions, particularly in March.
Concluding Remarks
When sea ice comes to Hokkaido, it follows a southeasterly trajectory associated with the Soya current and is thus forced to pile up along the Shiretoko peninsula. This ‘dam effect’ means that the area along the Shiretoko peninsula is particularly sensitive to changes in climate conditions throughout the Sea of Okhotsk and possibly even the Arctic. Our comparison of sea-ice duration with meteorological records from sites along the northern part of Hokkaido suggests that winter temperature increases of 2–4˚C could mean that sea ice would not come to the coast of Hokkaido at any time during the year. The sea-ice duration at Utoro was found to correlate very well with the Arctic sea-ice extent in March, which suggests that sea ice at the Shiretoko peninsula could be a good proxy for, or sensor of, overall Arctic sea-ice conditions useful in evaluating both future and past climate changes.
Acknowledgements
This study was supported by a Grant-in-Aid for Scientific Research (No. 19201013, principal investigator Shuhei Takahashi) of the Ministry of Education, Culture, Sports, Science and Technology of Japan. We are very grateful to D.R. MacAyeal for his help in revising the manuscript.


