


Policy significance statement
Forecasting international migration is a research and policy challenge due to the presence of hardly predictable drivers, problematic data as well as unforeseeable events. In this article, we examine short- and long-term forecasts of migration flows for 26 European countries, making use of similarities between countries and of data at different frequencies. The models are broadly successful in the short-run, with the long-run ones showing high levels of uncertainty, as expected. Unsurprisingly, the countries that have had stable flows exhibit smaller levels of forecast uncertainty. The method has potential to enhance support for migration policies by utilising the available information more fully.
1. Introduction
There is much uncertainty about the size, timing, type, duration, and impact of future migration flows and their interplay within the economy and the society. Being able to anticipate some of the migration changes and provide adequate response is a paramount contemporary challenge, which is already recognised in many policy areas, notably at the European levelFootnote 1. At the same time, the drivers of migration are highly variable and are easily subject to change, sometimes at a very short notice and with hardly any warning signs (Bijak and Czaika, Reference Bijak and Czaika2020). Moreover, the data for migration and its different drivers may come at various frequencies, from annual to quarterly or monthly. In that context, the aim of this proof-of-concept paper is to explore a new method of forecasting migration flows both for shorter and longer-term horizons, that makes the best possible use of various available data sources with different time granularity.
One key advantage of modern macroeconomic modelling in the context of migration forecasting is its dynamic nature. Here, existing possibilities include gravity (e.g. Beine et al., Reference Beine, Bertoli and Moraga2016) or dynamic stochastic general equilibrium models. Of course, there are reasons that people migrate which cannot be modelled with migrant host country data. Such examples include the war in Ukraine or the so-called “asylum crisis” of 2015–2016. The inability for macroeconomic data to capture this additional uncertainty makes forecasting migration challenging. Importantly, they include unpredictable political events or migration policy changes (tightening or relaxation of legislation, see Czaika et al., Reference Czaika, Erdal and Talleraas2021), and people’s reactions to them at the micro level. That notwithstanding, macroeconomic approaches can offer coherent description of at least some of the relevant drivers, help set plausible migration scenarios and analyse their uncertainty and sensitivity.
The approach proposed in this paper relies on panel vector autoregressive (VAR) models using mixed-frequency data. The method can be appealing as a forecasting tool in the short term, and a way for setting macroeconomically coherent “what-if” migration and driver scenarios for the longer horizons. Here, some canonical economic drivers of migration include improved employment opportunities, salary levels, and other job-related factors, and the same holds for push factors, including economic downturns, low wages, or high unemployment (Massey et al., Reference Massey, Arango, Hugo, Kouaouci, Pellegrino and Taylor1993). Such factors can be modelled with macroeconomic data, which may come at different frequency, so that the models do not need to lose information through having to aggregate all data to the least frequent common denominator.
Of course, in addition to economic drivers, there are also other macro-level circumstances in which migration can change unexpectedly, and which cannot be adequately explained or predicted by changes in economic structures and processes alone. Even though anticipating such changes to migration processes is out of scope of this study, we demonstrate how the proposed mixed-frequency VAR modelling can shed light on the impact of rapid migration changes on other areas of the economy. Besides, the proposed methodology is flexible enough to allow for including other drivers of migration in the models as well, as long as the relevant data series are available.
In this article, Section 2 presents the econometric analysis of short-term forecasts based on the panel VAR models for mixed-frequency data. Section 3 includes reflections and some empirical evaluation for longer-range scenario setting, extended to the analysis of the possible economic impacts of uncertain migration and economic events. Section 4 provides further discussion and concludes.
2. Short-term forecasts: mixed-frequency panel VAR
2.1. General remarks
As mentioned before, forecasting migration is a challenge due to a sheer number of drivers and factors for different types of migration, as well as the irreducible (aleatory) uncertainty of the future (Bijak and Czaika, Reference Bijak and Czaika2020). In this section, we take a look at migration forecasting through the prism of macroeconomic drivers, using Bayesian panel VAR models, extending the previous work of Gorbey et al. (Reference Gorbey, James and Poot1999) and Bijak (Reference Bijak2010). We apply these models to data at different frequencies, quarterly and annual, and evaluate the forecasts by predicting migration indicators for eight quarters, 2018Q1–2019Q4, and comparing them ex post with the values observed in the data for that period. By so doing, we are also trying to assess to what extent including theoretical macroeconomic relationships and regularities encoded in the models can shed some light on the epistemic migration uncertainty, related to imperfect knowledge.
In this analysis, we use a Bayesian panel vector autoregressive (VAR) model to present forecasts for 26 European countries from the European Union (EU), the European Free Trade Agreement (EFTA), as well as the United KingdomFootnote 2. The focus on macroeconomic variables among the many theoretical considerations about migration drivers is of course to some extent arbitrary (see, e.g. Czaika and Reinprecht, Reference Czaika and Reinprecht2020; Massey et al., Reference Massey, Arango, Hugo, Kouaouci, Pellegrino and Taylor1993). Our motivation here is twofold. First, these drivers form a very important part of the complex driver environments (Czaika and Reinprecht Reference Czaika and Reinprecht2020), especially given the prominent role of labour migration among all population flows. Secondly, even though the examples presented here focus on the economy, the tools used in the analysis can be transferable to other drivers and their environments, as long as appropriate data are available.
In our examples, the macroeconomic data, covering the period 2002Q1–2019Q4, include GDP, wages and salaries, unemployment rates, and employment indicators. Our dataset features both annual (migration) and quarterly data, so that the models need to be analysed using mixed-frequency tools proposed by Canova and Ferroni (Reference Canova and Ferroni2020) and Dieppe et al. (Reference Dieppe, van Roye and Legrand2016). From the national accounts variables, we use GDP, sourced from the OECD data, and wages and salaries, collected from Eurostat together with the labour market data. The wages and salaries are deflated using the GDP deflator. For national accounts, the variables are expressed in real terms, per working-age population, and are log-transformed. The wage premium is calculated as the rate of wages and salaries (in Euros) per employed person relative to the EU-15. The migration estimates are sourced from the IMEM project (Raymer et al., Reference Raymer, Wiśniowski, Forster, Smith and Bijak2013) and the QuantMig Migration Estimates Explorer (https://bit.ly/quantmig-estimates). As discussed later in the paper, many of these series, notably including migration, are likely non-stationary, which means that their characteristics change over time.
To assess model performance, we first conduct an in-sample forecasting exercise over the period 2018Q1–2019Q4. The evaluation time frame is limited to these 2 years to avoid potential problems with the effects of the COVID-19 pandemic on the migration measures used. The indicators being forecast are relative measures of migration intensity, expressed per 1000 residents of a given country. Immigration and net migration measures are labelled as “rates,” to reflect that they do not correspond to the correct populations at risk. In addition, we conduct an out-of-sample forecasting exercise, for the period 2018Q1–2025Q4 and long-run horizons up to 2050Q4. Table 1 lists the different variables used in the forecasting models, their brief description, source and any transformation that was made to the data before their inclusion.
Data variables and descriptions

Note. WA = working-age population; CARSA = national currency, current prices, annual levels, seasonally adjusted; DNBSA = deflator, national base year, seasonally adjusted.
2.2. Formulation and evaluation of panel VAR models
In the forecasting exercise, we predict immigration, emigration, as well as net migration series separately. In this section we define the model and present illustrative results for the model variant that performed well enough across all groups of countries under study. To formulate and estimate the forecasting models, we use toolboxes by Canova and Ferroni (Reference Canova and Ferroni2020) for mixed-frequency data transformations, and Dieppe et al. (Reference Dieppe, van Roye and Legrand2016) for Bayesian panel VAR forecasting, the latter via the BEAR toolbox: Bayesian Estimation, Analysis and Regression. Ideally, it would be preferable to perform both parts in one step, as in our approach the part of uncertainty that is related to data transformations is not directly propagated into the forecasts. However, no widely used toolbox is currently available to simultaneously estimate MF-PVAR models and use them for forecastingFootnote 3.
As a result, having initially decoupled the two stages of the process, we then propagate the uncertainty about the mixed-frequency estimation into panel VAR models by using 10,000 random Monte Carlo replicates of the mixed-frequency estimates and summarising the panel VAR results across themFootnote 4. In our case, only one variable (migration) required transforming from lower to higher frequencies, so the resulting additional errors are not consequential. At the same time, the computational expense of this approach proved considerable, even on supercomputer, with the estimations for 10,000 Monte Carlo replicates across all 26 countries and three migration indicators taking several days.
As a proof of concept, we first employ the approach of Canova and Ferroni (Reference Canova and Ferroni2020) relying on mixed-frequency VAR (MF-VAR), based on data from the national accounts, government accounts, unemployment, and migration statistics. In the toolbox, the Gibbs sampler is used in the reduced-form VAR, to estimate the quarterly observations of the variables (Canova and Ferroni, Reference Canova and Ferroni2020, 54). For each of the 10,000 Monte Carlo replicates, the BEAR toolbox of Dieppe et al. (Reference Dieppe, van Roye and Legrand2016) is subsequently used for panel VAR modelling. The analysis contains $ N $
countries,
$ N $
countries, $ n $
variables,
$ n $
variables, $ p $
lags, and covers
$ p $
lags, and covers $ T $
quarters. The element of the panel VAR model related to country
$ T $
quarters. The element of the panel VAR model related to country $ i $
(
$ i $
( $ i\in 1,2\dots N $
) is specified as:
$ i\in 1,2\dots N $
) is specified as:
 $$ {y}_{i,t}=\sum \limits_{j=1}^N\sum \limits_{k=1}^p{\Psi}_{i,j}^{(k)}{y}_{j,t-k}+{\unicode{x025B}}_{i,t} $$
where, $ {y}_{i,t} $
is a
$ {y}_{i,t} $
is a $ n $
× 1 vector of
$ n $
× 1 vector of $ n $
endogenous variables for country
$ n $
endogenous variables for country $ i $
at time
$ i $
at time $ t $
. The matrix of coefficients is given by
$ t $
. The matrix of coefficients is given by $ {\Psi}_{i,j} $
, of size
$ {\Psi}_{i,j} $
, of size $ n $
×
$ n $
× $ n $
, and
$ n $
, and $ {\unicode{x025B}}_{i,t} $
is a vector of
$ {\unicode{x025B}}_{i,t} $
is a vector of $ n $
× 1 vector white noise error terms with
$ n $
× 1 vector white noise error terms with $ {\unicode{x025B}}_{i,t}\sim N\left(0,{\Sigma}_t\right) $
as specified by Dieppe et al. (Reference Dieppe, van Roye and Legrand2016). The model is estimated with four lags,
$ {\unicode{x025B}}_{i,t}\sim N\left(0,{\Sigma}_t\right) $
as specified by Dieppe et al. (Reference Dieppe, van Roye and Legrand2016). The model is estimated with four lags, $ p=4 $
, corresponding to 1 year. The contemporaneous mutual impacts of different variables for each country are introduced through the covariance matrix
$ p=4 $
, corresponding to 1 year. The contemporaneous mutual impacts of different variables for each country are introduced through the covariance matrix $ {\Sigma}_t $
, allowing for reverse (reinforcing or dampening) feedback effects to occur simultaneously in the same period. To take advantage of the panel structure, the borrowing of strength between different countries occurs not only through
$ {\Sigma}_t $
, allowing for reverse (reinforcing or dampening) feedback effects to occur simultaneously in the same period. To take advantage of the panel structure, the borrowing of strength between different countries occurs not only through $ {\Sigma}_t $
, but also via the matrices of vector autoregressive parameters
$ {\Sigma}_t $
, but also via the matrices of vector autoregressive parameters $ {\Psi}_{i,j} $
.
$ {\Psi}_{i,j} $
.
The methodology for the mixed-frequency VAR (MF-VAR) is based on estimation along the lines of Schorfheide and Song (Reference Schorfheide and Song2015) implemented in the toolbox by Canova and Ferroni (Reference Canova and Ferroni2020). In this paper, we use annual and quarterly observations. The toolkit requires the annual observation to be given in the last quarter of the year, with the first to third quarters left as “unobserved.” All the values for GDP are used at a quarterly frequency, with migration being the only annual series in this paper. The figures are already adjusted for seasonality: as such, the quarterly migration rates are obtained from annual ones by simply dividing by four.
In methodological terms, the MF-VAR is represented as a state-space model to manage the unobserved values. The definition of the state-space model used for mixed-frequency forecasting, adapted from Schorfheide and Song (Reference Schorfheide and Song2015, 368–369), is as follows. Defining an auxiliary variable $ {z}_{i,t}={\left[{y}_{i,t}^{\prime },\dots, {y}_{i,t-p+1}^{\prime}\right]}^{\prime } $
allows for rewriting Equation (1) in the state-space form, by transforming the original VAR(p) model to its VAR(1) companion form, as:
$ {z}_{i,t}={\left[{y}_{i,t}^{\prime },\dots, {y}_{i,t-p+1}^{\prime}\right]}^{\prime } $
allows for rewriting Equation (1) in the state-space form, by transforming the original VAR(p) model to its VAR(1) companion form, as:
 $$ {z}_{i,t}=\sum \limits_{j=1}^NF\left({\Psi}_{i,j}\right){z}_{j,t-1}+{\nu}_{i,t} $$
For each country pair $ \left(i,j\right) $
,
$ \left(i,j\right) $
, $ F{\left({\Psi}_{i,j}\right)}^{\prime } $
is an
$ F{\left({\Psi}_{i,j}\right)}^{\prime } $
is an $ np\times np $
block matrix with
$ np\times np $
block matrix with $ {\Psi}_{i,j}=\left[{\Psi}_{i,j}^{(1)},\dots, {\Psi}_{i,j}^{(p)}\right] $
in the first
$ {\Psi}_{i,j}=\left[{\Psi}_{i,j}^{(1)},\dots, {\Psi}_{i,j}^{(p)}\right] $
in the first $ n $
rows, and sub-diagonal block identity matrices
$ n $
rows, and sub-diagonal block identity matrices $ {I}_n $
in the remaining
$ {I}_n $
in the remaining $ n\left(p-1\right) $
rows. The error term is i.i.d. multivariate normal,
$ n\left(p-1\right) $
rows. The error term is i.i.d. multivariate normal, $ {\nu}_{i,t}\sim N\left(0,\Omega \left({\Sigma}_i\right)\right) $
, where the block matrix
$ {\nu}_{i,t}\sim N\left(0,\Omega \left({\Sigma}_i\right)\right) $
, where the block matrix $ \Omega ({\Sigma}_i) $
contains
$ \Omega ({\Sigma}_i) $
contains $ {\Sigma}_i $
in the top-left corner and zeros elsewhere.
$ {\Sigma}_i $
in the top-left corner and zeros elsewhere.
Let $ {y}_{i,t} $
be partitioned into variables observed at the quarterly (higher) frequency,
$ {y}_{i,t} $
be partitioned into variables observed at the quarterly (higher) frequency, $ {y}_{q,i,t} $
, and those observed at the lower (annual) frequency, such that
$ {y}_{q,i,t} $
, and those observed at the lower (annual) frequency, such that $ {y}_{i,t}={\left[{y}_{q,i,t}^{\prime },{y}_{a,i,t}^{\prime}\right]}^{\prime } $
. The model for the actual observations
$ {y}_{i,t}={\left[{y}_{q,i,t}^{\prime },{y}_{a,i,t}^{\prime}\right]}^{\prime } $
. The model for the actual observations $ {x}_{i,t} $
can then combine the processes observed quarterly and annually by converting all data to the common (higher-frequency) “denominator”:
$ {x}_{i,t} $
can then combine the processes observed quarterly and annually by converting all data to the common (higher-frequency) “denominator”:
 $$ {x}_{i,t}={\left[{y}_{q,i,t}^{\prime },{\tilde{y}}_{a,i,t}^{\prime}\cdot {M}_{i,t}\right]}^{\prime }, $$
where $ {\tilde{y}}_{a,i,t}=\frac{1}{4}\left({y}_{a,i,t}+{y}_{a,i,t-1}+{y}_{a,i,t-2}+{y}_{a,i,t-3}\right) $
, and
$ {\tilde{y}}_{a,i,t}=\frac{1}{4}\left({y}_{a,i,t}+{y}_{a,i,t-1}+{y}_{a,i,t-2}+{y}_{a,i,t-3}\right) $
, and $ {M}_{i,t} $
is an identity matrix when
$ {M}_{i,t} $
is an identity matrix when $ t $
is the last quarter of the year, and zero otherwise. In the representation above, Equation (2) is the state equation, and Equation (3) is the observation equation. For further details on the methodology and Bayesian estimation, see Schorfheide and Song (Reference Schorfheide and Song2015)Footnote
5.
$ t $
is the last quarter of the year, and zero otherwise. In the representation above, Equation (2) is the state equation, and Equation (3) is the observation equation. For further details on the methodology and Bayesian estimation, see Schorfheide and Song (Reference Schorfheide and Song2015)Footnote
5.
For panel VAR forecasting, as we are using Bayesian methods, we also need to make a number of prior assumptions. The approach relies on a pooled estimator, with data for all countries pooled together to estimate a single, homogenous VAR model, with four lags and no constant in each model, with estimation based on 5000 iteration runs of the Gibbs sampler (following a burn-in of 500 iterations). The parameters and hyperparameters follow standard values from macroeconomic literature encoded in the BEAR package with the conjugate multivariate normal-inverse Wishart model structure: the normal priors for the autoregressive parameters are centred around 0.8, indicating a belief a priori in relatively large autocorrelations, whereas the marginal priors for the residual and factor variances are assumed to follow (tightening) inverse Gamma distributions with the shape parameter 1000 and scale parameter 1, to prevent the forecasts from exploding too fast (Dieppe et al., Reference Dieppe, van Roye and Legrand2021).
As many migration (and indeed other macroeconomic) processes are likely non-stationary, an additional advantage of Bayesian methods is that they do not impose any requirements of stationarity (for a discussion, see, e.g. Koop et al., Reference Koop, Poirier and Tobias2012, Chapters 17 and 18). Of course, alternative model specifications, such as based on differenced or de-trended series, or using the Vector Error Correction (VEC) mechanisms, are possible and could be used instead. The predictive characteristics, such as median trajectories or credible (predictive) intervals are then obtained by aggregating across the 10,000 Monte Carlo simulations, to include the uncertainty of multiple-frequency disaggregation.
In our panel VAR setup, we model four groups of countries: high-income and highly positive-net migration Western European countries (Group 1); high-income and medium positive-net migration European countries (Group 2); medium income and low-positive net migration (Group 3), and countries with low income and negative net migration (Group 4). The inclusion of a group of countries with negative net migration in a macroeconomic context is novel, as such migration has not been investigated before in detail across a number of countries.
We group the countries in the analysis to overcome problems arising from the short time period covered by the data. Using a panel VAR with six, seven, five and eight countries in Groups 1–4 respectively, increases the number of observations (the sample size) used to estimate the parameters, while allowing to take the advantage from the similarities in macroeconomic and migration patterns between the countries in each group. The list of countries and a data snapshot are provided in Table 2.
Case study: selected summary statistics for selected 26 European countries

Note. Average (Avg) uses values for 2002–2019, with the values for 2019 either annual or averaged over Q1–Q4. Please note that for non-stationary data, such as migration rates, their averages should be interpreted with caution, as they cannot be interpreted as the estimators of the means of the underlying processes. The values for real GDP per capita and Wages are in 1000s of Euros. Unemployment rate is for 15–64 year olds.
There are additional considerations we take when deciding on the placement of countries within the groups. One notable example, not shown in Table 2, is the number of years that net migration flows were positive. For all countries in Group 1, all years were positive. For Group 2, only Germany and Slovenia experienced one negative year each. Group 3 is more mixed, with a range of 9 (Ireland) to 14 (Slovakia) years with positive net migration. For Group 4, Greece experienced 10 positive years, but with a largely negative gradient, while Hungary experienced two and Estonia 3 years with positive net migration values, otherwise all country-year estimates were negative.
For the economic and labour market variables, Table 2 shows the averages and 2019 (base) values. The reason is to give a sample average, while also indicating the status of the economy at the beginning of the forecasting period, prior to the COVID-19 pandemic. For instance, the economies of Greece, Ireland, Italy, Portugal and Spain, suffered heavily during the global financial crisis of 2008–2011, as evident through large distortions in data, particularly for unemployment rates, and impacting net migration. The “new” EU member states have shown significant economic development since joining the EU, some at a greater pace than others. The economic growth in the former Eastern bloc countries has started to close the wage premium gap. We have also used both GDP per capita, as well as wages and salaries, as they provide different information. On the labour market side, we use employment rates in Table 2 rather than levels of employment, to aid comparison between the countriesFootnote 6.
To calculate the forecasts, we employ a vector of endogenous variables $ {y}_t $
describing the macroeconomy and labour market. Predictions for immigration “rates”, emigration rates, and net migration “rates” are calculated separately, as in Equation (4):
$ {y}_t $
describing the macroeconomy and labour market. Predictions for immigration “rates”, emigration rates, and net migration “rates” are calculated separately, as in Equation (4):
 $$ {y}_t={\left[{\mathrm{MIG}}_{\mathrm{t}},{\mathrm{GDP}}_{\mathrm{t}},{\mathrm{WageSal}}_{\mathrm{t}},{\mathrm{Emp}}_{\mathrm{t}},{\mathrm{WagePre}}_{\mathrm{t}}\;{\mathrm{Unemp}}_{\mathrm{t}}\right]}^{\prime } $$
 $$ {\mathrm{MIG}}_{\mathrm{t}}={\mathrm{Immig}}_{\mathrm{t}}\hskip2pt or\hskip2pt {\mathrm{Emig}}_{\mathrm{t}}\hskip2pt or\hskip2pt {\mathrm{NM}}_{\mathrm{t}} $$
The non-migration variables include some of the economic drivers of migration identifiable at the aggregate level in data (see, e.g. Massey et al., Reference Massey, Arango, Hugo, Kouaouci, Pellegrino and Taylor1993), with higher levels of wages and employment representing some of the conventional “pull factors,” and lower levels—“push factors.” The GDP represents the overall state of the economy, with an economy above the trend being an attractive destination (pull factor). There are also other variables in the dataset in Table 1, which could individually describe different migration drivers, but for consistency we use the same models for emigration and immigrationFootnote 7.
2.3. Short-term migration forecasts: summary of the results
In this section we present a selection of forecasts from models shown in Equations (4) and (5). We focus on the forecasts of the immigration and net migration “rates,” as well as emigration rates. Plotting the forecasts for immigration and emigration separately helps identify, in which case the process dynamics was the most uncertain and volatile.
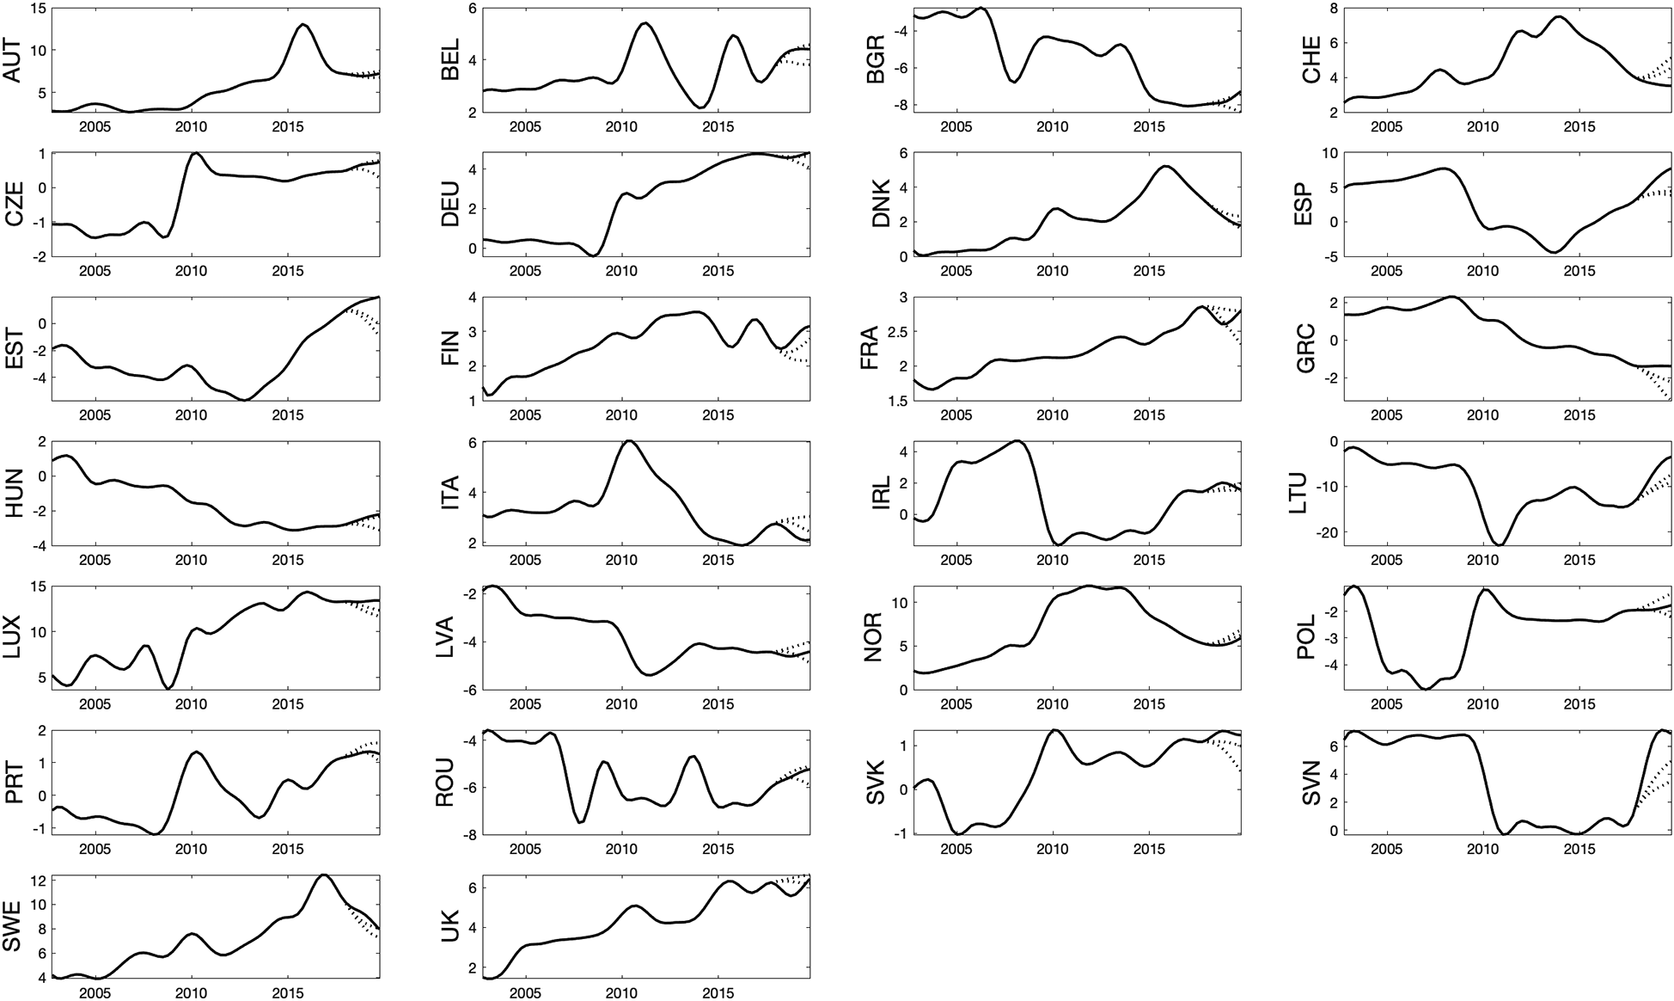
In terms of specific results, Figure 1 presents the forecasts of immigration, Figure 2 emigration, and Figure 3—net migration “rates” produced by models (4) and (5). All the in-sample forecasts presented in this section are unconditional. On the whole, the presented forecasting models have performed reasonably well. The predictive or confidence intervals are formed from the 67% percentile intervals from the 10,000 Monte Carlo replicates. The models are generally able to predict values which were close to the 67% predictive intervals for most countries. The out-of-sample forecasts contain the “best-possible” current information set. For long-term horizons, the forecasts are again unconditional: after three decades, the impact of the available current data would become almost irrelevant. This suggests an important role of the unpredictable (aleatory) uncertainty in shaping the overall forecast errors, especially for countries undergoing dynamic shifts of their migration patterns.
In-sample forecasting exercise for immigration “rates”, 2018–2019. Note: The solid black line represents the data used for estimation. The dotted lines depict the mean forecast and the 67% predictive intervals.

In-sample forecasting exercise for emigration rates, 2018–2019. Note: The solid black line represents the data used for estimation. The dotted lines depict the mean forecast and the 67% predictive intervals.

In-sample forecasting exercise for net migration “rates”, 2018–2019. Note: These forecasts are produced directly by model (5). The solid black line represents the data used for estimation. The dotted lines depict the mean forecast and the 67% predictive intervals.
To show how the forecast errors compare, we present a selection of the error measures for each forecast in Table 3 and the calibration of the predictive intervals in Table 4. As the values are expressed per capita, there is not a need to additionally weigh any of the estimates. For each group, an arithmetic average is taken for each of the scores across the eight quarters analysed and all the countries in that group.
Analysis of forecast errors, 2018–19: selected summary measures

Note. RMSE = root mean square error; MAE = mean absolute error; MAPE = mean absolute percentage error; Theil’s U = Theil’s U statistic
Forecast calibration: observation shares within 67% predictive intervals

Note. Coverage = the average proportion of quarterly forecasts where the observation was within the bounds of 67% predictive intervals; Abs. diff. = absolute difference from the nominal coverage probability, 0.67.
The errors in Table 3 show that, from that point of view alone, smaller percentage errors (MAPE) are obtained for the forecasts of immigration and emigration than for net migration, which supports the notion of forecasting each flow separately rather than net migration (Bijak, Reference Bijak2010; Rogers, Reference Rogers1990), and using flow-specific data for that purpose. There are some countries that distort their group overall with Luxembourg having the largest errors in Group 1, that can be partially explained by the high flows they receive. Group 2’s errors are distorted mainly by Slovenia which is not unexpected due to its change in migratory profile. In a similar way, Portugal’s distortion for Group 3 and for Group 4 Estonia and Lithuania has different reasons for their larger error values. Estonia is on upwards trajectory, while Lithuania has the largest net emigration flows.
There are some countries for which the observed average values can be misleading, though, and be largely outside of the 67% predictive intervals with Luxembourg, Slovenia, Spain, Portugal, Estonia and Lithuania having the fewest observations within the bounds. The calibration results presented in Table 4 show that the errors are relatively small. For immigration and emigration, the empirical coverage of the 67% predictive intervals (the fraction of the observed data points that fell within the intervals) was too small, most notably for Group 3, and for immigration, Group 4.
Overall, in terms of the ex-post analysis of errors, short-term forecasts utilising macroeconomic drivers have yielded results with acceptable errors and mostly too narrow 67% predictive intervals between 2018Q1 and 2019Q4, with immigration and emigration forecasts, especially for the traditionally receiving countries, generally outperforming net migration forecasts. This is expected due to the models including additional variables for the home economies, rather than the respective origin or destination countries of migrants. A more detailed investigation of the model performance for individual countries could additionally involve country-specific detail on microeconomic, political, policy or other reasons that could not be modelled by using macro-level variables, which goes beyond the scope of this study.
2.4. Out-of-sample analysis of migration forecasts
This study relies on a set of quarterly data available up to 2019Q4. In this section, we present out-of-sample forecasts, with migration predicted for 2018–2024, so with a 5-year horizon. Conditional forecasts are possible at this horizon, however they are not presented hereFootnote 8. We use the same vectors of endogenous variables as in Section 2.2. Figure 4 presents the predictions for immigration “rates”, Figure 5 for emigration rates and Figure 6 for net migration “rates”. These forecasts are unconditional and are not corrected for the impact of the COVID pandemic.
Out-of-sample forecasts of immigration “rates”, 2018–2025. Note: The solid black line represents the data used for estimation. The dotted lines depict the mean forecast and the 67% predictive intervals.

Out-of-sample forecasts of emigration rates, 2018–2025. Note: The solid black line represents the data used for estimation. The dotted lines depict the mean forecast and the 67% predictive intervals.

Out-of-sample forecasts of net migration “Rates”, 2018–2025. Note: The solid black line represents the data used for estimation. The dotted lines depict the mean forecast and the 67% predictive intervals.

As before, the forecasts presented in Figures 4, 5 and 6 have tighter predictive intervals for some countries than others. Here again, this has to do predominantly with the presence of shocks in the past data series. Luxembourg is an understandable anomaly: the volatility of migration rates is driven by the small size of the country being at the same time at the “core” of the EU migration system. Some other instances can be down to significant economic and migration developments in these countries over a relatively short time period, whether it be joining the European common labour market as in the CEE countries, or prolonged effects from the financial crises in Southern European countriesFootnote 9.
Another major question is continuing emigration from the CEE countries from Group 4. These countries have experienced large emigration since joining the European common labour market, however, in some cases the emigration rates (for example from Estonia and Poland) have been diminishing, so already now they are becoming net receivers, so moving to Group 3. These economies have also closed the gap towards Southern Europe, which makes them more attractive destinations when compared to some other countries of the region. Other members of Group 4 still have highly negative net migration, which makes them distinct from the rest of Europe—only potential new members of the EU, such as Ukraine, Moldova, or Western Balkan countries, would have similar characteristics.
Even more importantly than providing uncertainty statements (predictive intervals), short-term forecasts presented in this section can help us make a preliminary assessment, what might happen after some exogenous shocks, such as a further expansion of the EU, for example, to include Ukraine. One of the exogenous variables that could be used for that purpose is the size of the common labour market, where significant changes only arise when new countries are added—or removed, as in the case of Brexit.
3. Towards long-term migration scenarios
3.1. Extending VAR forecast horizons: results and limitations
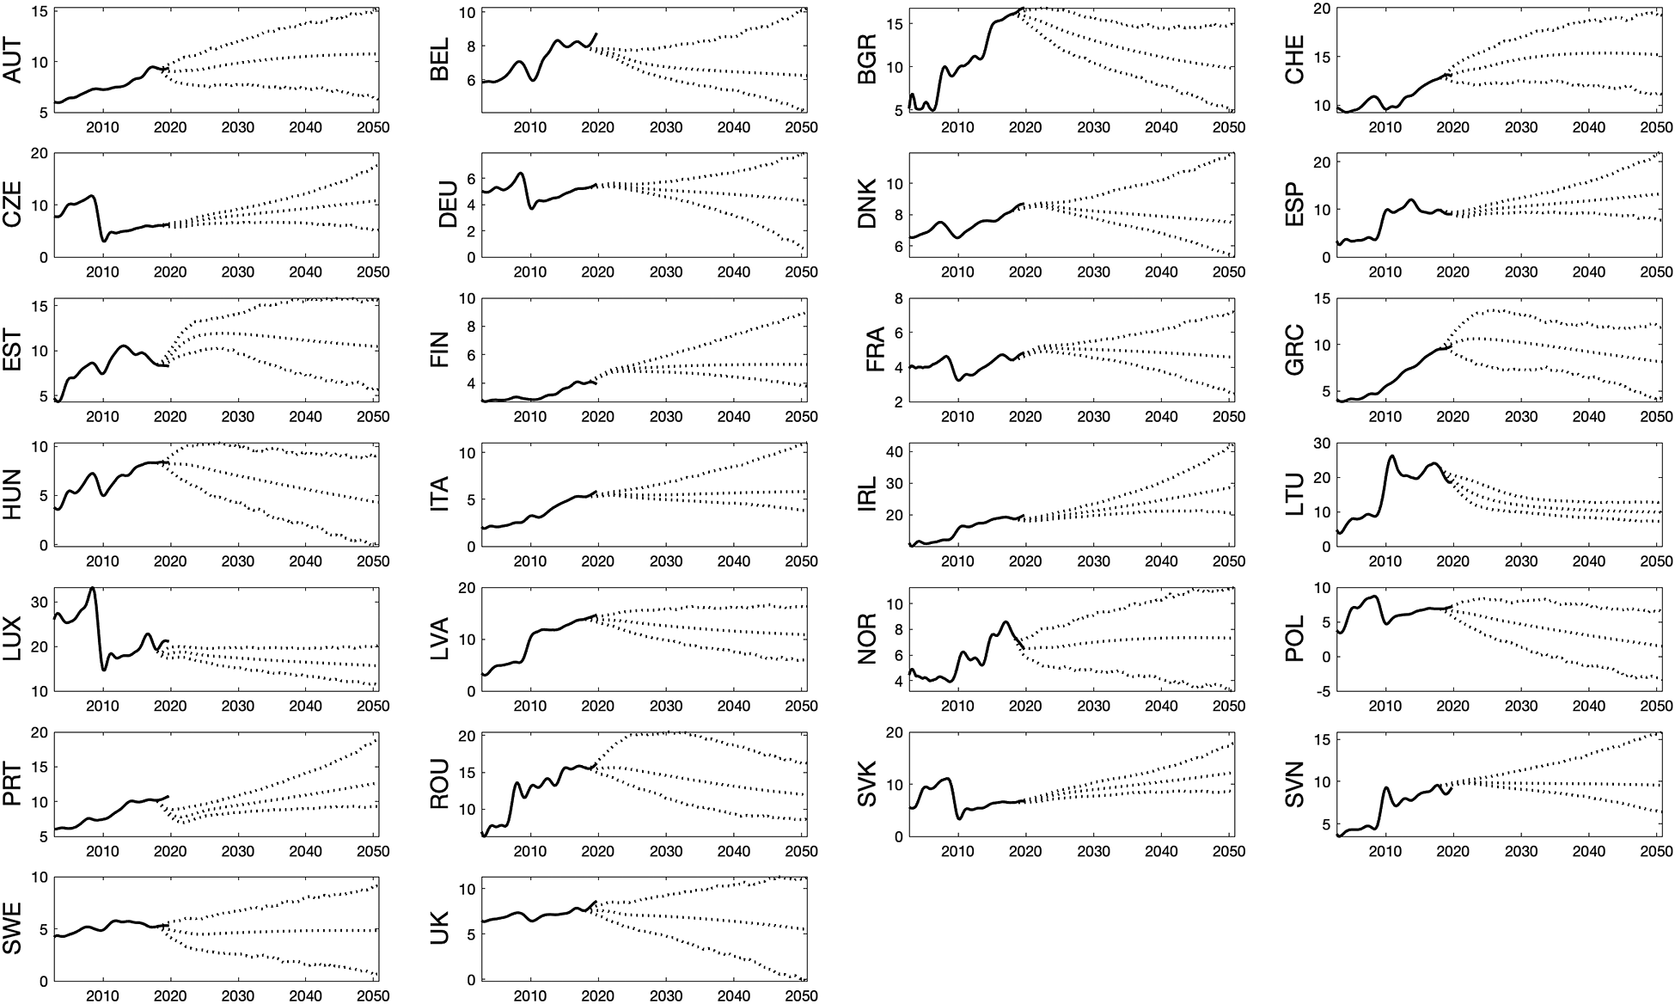
By using the Bayesian panel VAR models introduced in Section 2, we also produced long-range forecasts for immigration, emigration and net migration rates up to 2050Q4, so with the horizon of 30 years—around one generation ahead. The extensions of forecasts for the 26 countries included in the analysis in Section 2 are presented in Figures 7, 8, and 9 for immigration, emigration and net migration, respectively, alongside the 67% predictive intervals.
Long-range forecasts of immigration “rates”, 2020–2050.

Long-range forecasts of emigration rates, 2020–2050.
Long-range forecasts of net migration “rates”, 2020–2050.

As expected, the predictability of migration over such long horizons appears to be generally poor (Bijak, Reference Bijak2010; Bijak et al., Reference Bijak, Disney, Findlay, Forster, Smith and Wiśniowski2019), not least in terms of too narrow predictive intervals. This is especially visible for emigration, and even more so for net migration. This seems to be a problem continuing from the short-term forecasts presented in Section 2, only exacerbated by a longer prediction horizon. The problems are visibly higher for countries that are net senders of migrants, such some Central and Eastern European states. More generally, without controlling for population or, equivalently, the total labour market for the entire forecast period, the predicted emigration (and thus net migration) processes exhibit great variability. Especially the transition countries in Group 3 have typically experienced high volatility in migration flows over the sample period.
In general, how the population picture will look in 10, 20, or 30 years’ time is hard to predict. It is possible to create conditional forecasts, as in macroeconomics, though these tend to be only short-term, based on external predictions of drivers where available. One example is GDP, with forecasts available from the OECD in a horizon of two or so years, which need to be replaced by model-generated forecasts thereafter, compounding the predictive uncertainty. In the longer term, the role of additional factors is becoming increasingly more likely—one example of such a factor is job automation, as discussed in the study by Barker and Bijak (Reference Barker and Bijak2021). Attempting to predict migration with variables that may be even less predictable in the long run is futile, but at least the VAR models can be argued to offer a toolkit for creating long-range scenarios that retain macroeconomic coherence.
In the examples presented above, some countries have significantly large error bands towards the end of the forecast horizon. These are mainly countries which have had volatile periods of migration in the sample period, not fully captured by the macroeconomic or labour market data. Interestingly, the forecasts of net migration exhibit relatively most stable long-term tendencies in terms of their uncertainty bounds, similar to those obtained by Azose and Raftery (Reference Azose and Raftery2015) based on univariate hierarchical models.
In general, the VAR models presented in this paper seem to have been able to identify different patterns of predictive uncertainty for various groups of countries. In particular, there are visible differences between countries, where the presence of high-magnitude unpredictable events in otherwise relatively stable trends is increasing the predictive errors comparatively slowly (Groups 1–3), as opposed to countries with visible changes in trends implying clearly non-stationary processes, as well as wide and rapidly increasing predictive intervals (mainly Group 4). This analysis allowed identifying, even if in qualitative sense, in which countries the predictive uncertainty is the greatest, as they may be (or soon become) at the verge of a migration transition from being net senders to receivers.
Somewhat predictably, the predictive performance of models equipped with macroeconomic drivers is mixed, and in many cases, such as for Central and Eastern European countries, undergoing a transition from net senders to net receivers, outright unsatisfactory. Whenever good data are available, and the underlying processes are relatively stable, as in the pioneering study of Gorbey et al. (Reference Gorbey, James and Poot1999) of migration between Australia and New Zealand, Bayesian VAR models offer an appealing way of providing coherent scenario trajectories describing the future uncertainty, including theoretical insights into structural mechanisms shaping population flows. In a general case, however, difficulties with predicting migration beyond a five- to 10-year horizon are well known (e.g. Bijak and Wiśniowski, Reference Bijak and Wiśniowski2010), which leaves the question of how to predict migration in the longer term to a large extent open. Still, the applied Bayesian perspective at least allows for handling time series irrespective of whether they are stationary (Koop et al., Reference Koop, Poirier and Tobias2012)—an advantage for migration, where non-stationarity can often be expected (Bijak, Reference Bijak2010).
The short- and long-run forecasts presented here have extended the previous attempts of using Bayesian VAR methods to forecast migration (Gorbey et al., Reference Gorbey, James and Poot1999; Bijak, Reference Bijak2010). The novel contribution has been the use a much broader set of macroeconomic and labour market data, including data that come at different frequencies. These models have proved more successful for some countries than others—unsurprisingly, especially for those who were relatively unaffected by the shocks of economic and migration nature. Still, the large residual uncertainty indicates that the macro-level picture of future migration is far from complete, and that the only realistic solutions can be approximate.
3.2. The impacts of uncertain migration and economic events
By using the panel VAR methodology described in Section 2, we can also analyse broader macroeconomic impacts of uncertain migration events. The approach uses the same model as above, only examined through the lens of impulse response functions (IRFs), which show the responses of individual model variables conditional on a one-off change to migration (impulse). The IRFs presented in this section are shown together with their 67% confidence (credible) intervals, demonstrating the uncertainty of the responses of individual variables to migration events in a particular scenario. These events are of the magnitude of one standard deviation estimated for the observed series, but of course for a policy analysis, this parameter can be arbitrarily changed, depending on the user needs. As is standard in the macroeconomic literature, we look at one-time events in the first period under study. As before, default priors are used for estimating the Bayesian panel VAR models. For additional results and further models, see Barker (Reference Barker2021).
In this part of the paper, we assess the effects of a net migration shock on macroeconomic variables, and vice versa. The explanatory variables represent various migration drivers, which on their own can be subject to shocks of varying degree of predictability and susceptibility to being influenced for example by political and policy changes. The model we use for this analysis is based on the following vector of endogenous variables $ {y}_t $
, with net migration “rate” for the net receiving country Groups 1–3, and its negative for the net sending Group 4, so that in all cases the modelled values remain positive.
$ {y}_t $
, with net migration “rate” for the net receiving country Groups 1–3, and its negative for the net sending Group 4, so that in all cases the modelled values remain positive.
 $$ {y}_t={[\pm {\mathrm{NM}}_{\mathrm{t}},{\mathrm{GDP}}_{\mathrm{t}},{\mathrm{WageSal}}_{\mathrm{t}},{\mathrm{Emp}}_{\mathrm{t}},{\mathrm{WagePre}}_{\mathrm{t}}\hskip2pt {\mathrm{Unemp}}_{\mathrm{t}}]}^{\mathrm{\prime}} $$
The IRFs presented in Figure 10 show the impact a one-standard deviation increase to the net migration rate for the respective country groups. The results show that in Groups 1–3, increases to net migration are expansionary for the economy: GDP, wages, and salaries increase in real per capita terms, with the employment rate increasing and unemployment decreasing. Conversely, in Group 4, decline in (negative) net migration is contractionary, with the opposite effects for macroeconomic variables. This provides an interesting, policy relevant point for Group 4, suggesting that these are not the unemployed workers who emigrate, but rather the employed workers. The axes have been normalised to reflect the relative size of the response between groups.
Impulse responses for net migration events. Impulse responses to a one standard deviation increase in the positive net migration “rate” (Groups 1–3) and decrease in the negative net migration “rate” (Group 4). The vertical axis identifies the responses in percentage deviations from trend. For the logged variables, the responses are provided in percentages, while for the unemployment rate, the response is in percentage points. The horizontal axis identifies the quarter after the shock, up to 5 years (20 quarters). Column headings identify the responding variables, and the row headings correspond to the country groups. The responses for Groups 1–3 are to a positive net migration shock, while the responses to a negative net migration shock to the variables for Group 4 have been visually inverted to aid comparison.

In Figure 11, we show the responses of the non-migration variables in the vector $ {y}_t $
to net migration “shocks.” Again, the responses are given by country group, and variables showing positive responses can be interpreted as “pull factors” (positive drivers) of migration, while negative responses indicating “push factors” (negative drivers). The responses show that increases to GDP, wages and salaries, employment increase immigration, with a rise in unemployment increasing emigration. As argued above, the results of this analysis can additionally aid anticipatory analysis of migration and its macroeconomic impacts, through providing a template for creating coherent “what-if” scenarios, with the methodology easily extendable to other sets of drivers, beyond macroeconomics. Increases to the wage premium have insignificant effects as the main focus is on the wages and salaries.
$ {y}_t $
to net migration “shocks.” Again, the responses are given by country group, and variables showing positive responses can be interpreted as “pull factors” (positive drivers) of migration, while negative responses indicating “push factors” (negative drivers). The responses show that increases to GDP, wages and salaries, employment increase immigration, with a rise in unemployment increasing emigration. As argued above, the results of this analysis can additionally aid anticipatory analysis of migration and its macroeconomic impacts, through providing a template for creating coherent “what-if” scenarios, with the methodology easily extendable to other sets of drivers, beyond macroeconomics. Increases to the wage premium have insignificant effects as the main focus is on the wages and salaries.
Impulse response of net migration to economic shocks. Note: Impulse responses of net migration to the one-standard-deviation shock increases of macroeconomic variables. The vertical axis identifies the responses in percentage deviations from trend. For the logged variables, the responses are provided in percentages, while for the unemployment rate, the response is in percentage points. The horizontal axis identifies the quarter after the shock, up to 5 years (20 quarters). Column headings identify the variables subject to shocks, and row headings—country groups. Note that for Group 4 of countries, the response to the negative of net migration is presented.

4. Discussion and conclusion
The research presented in this paper has put forth a new approach to forecasting migration through macroeconomic models using mixed-frequency data. As a proof of concept, the results have indicated reasonable, yet variable performance in the short term, depending on the indicator used—with emigration bearing on average the lowest relative errors, and net migration the highest—as well as on the countries, with uncertainty larger in the countries undergoing migration transition than in the more established economies. In the light of previous work (e.g. Bijak et al., Reference Bijak, Disney, Findlay, Forster, Smith and Wiśniowski2019), these findings are not surprising, as they confirm intuitions as to the key role of the stability of the predicted migration processes.
In general, the forecasts presented in this paper, both for the long- and short-term horizons, offer new prospects to forward-looking migration studies. Unlike for other components of population change, births and deaths, there are important macroeconomic drivers which represent the push and pull factors of migration. This allows us to obtain at least some indications of the future direction of change of migration flows, albeit often with very wide prediction intervals, by applying macroeconomic tools and techniques. There are, of course, outstanding issues related to systemic shocks (policy changes, lowering or raising of migration and trade barriers, or political crises), which are foreseeable to a very limited extent, and only at very short horizons.
VAR models and the associated the uncertainty analysis they offer can be also further extended by an explicit modelling of uncertain shocks and responses to them. In this way, empirically grounded predictive models, such as panel VARs, can shed light on different aspects of migration uncertainty. They can at least approximate the intrinsic randomness of the future through probabilistic description and contribute to reducing this uncertainty by looking at relationships between migration processes, their drivers and impacts. Some analytical tools, such as IRFs, can also help stress-test different aspects of migration scenarios or policy decisions. In all cases, using mixed-frequency models and data additionally helps make fuller use of all empirical information available on various migration drivers.
Future methodological work can additionally explore hybrid solutions, which could start from driver-based forecasts and scenarios in the short- to mid-term horizons, derived from time series models, and then use dynamic weighting to morph the associated probability distributions into purely expert-based scenarios for the long run. In addition, the relative advantages and limitations of using net migration rather than individual flows in the long run (as in Azose and Raftery Reference Azose and Raftery2015 or Section 3 above) warrant further exploration. In any case, opening up the modelling toolkits to approaches allowing the use of time series data at various frequencies is likely to help advance these methods further.
In the otherwise very uncertain world of migration and its forecasts and scenarios, one thing seems relatively certain: the assessment of migration uncertainty over longer time horizons remains a heroic exercise, and at the current state of knowledge, the best solutions are only approximate. Still, the analysis presented in this paper allows for making pragmatic choices: shorter-term forecasts and analysis of migration impacts, especially for countries with more stable migration processes and history, allow for using more complex models describing the economic and other aspects in finer detail, while longer-term scenarios, where the past information is less relevant, call for expert input at a very high level of abstraction. In either case, the crucial epistemological limits of any statements about future migration flows, and the associated caveats for the forecasters and forecast users alike (e.g. Bijak and Czaika, Reference Bijak and Czaika2020), remain fully in force.
Acknowledgements
We are very grateful to Mathias Czaika, Valentina Di Iasio, Peter WF Smith, Jason Hilton, Joanne Ellison, and two anonymous referees, for their comments that helped improve earlier drafts. We acknowledge the use of the IRIDIS High Performance Computing Facility and associated support at the University of Southampton, in the completion of this work, with special thanks to Alister Boags. All the remaining errors and inaccuracies are ours. An early version of this paper is in available as Barker and Bijak (Reference Barker and Bijak2021).
Author contribution
E.B. performed the following: methodology, software, validation, formal analysis, investigation, data curation, writing (original draft, review, and editing), and visualisation. J.B. performed the following: conceptualisation, validation, writing (review and editing), supervision, funding acquisition, and project administration.
Data availability statement
The data that support the findings of this study are openly available in Zenodo at https://doi.org/10.5281/zenodo.7709443.
Funding statement
This work has received funding from the European Union’s Horizon 2020 research and innovation programme, grant No. 870299 QuantMig: Quantifying Migration Scenarios for Better Policy, and a Horizon Europe project No. 101094741 FutuRes: Towards a Resilient Future of Europe, with this piece of work funded by the UK Research and Innovation through Horizon Europe Guarantee, grant no. 10066259. This document reflects the authors’ views, and the Research Executive Agency of the European Commission is not responsible for any use that may be made of the information it contains.
Competing interest
No interest declared.
Appendix
A.1. Details on data
Exclusions: The study excludes Netherlands due to data quality issues leading to inability to classify the country well, as well as to the presence of non-macroeconomic rules and policies that make migration difficult to explain with macro-level data. The Netherlands is one of the most advanced EU+ economies, yet, prior to 2009, according to the harmonised IMEM estimates; the Netherlands might have experienced a period of negative net migration, which is inconsistent with the official published data. Croatia, Cyprus, Iceland, and Malta are excluded due to lack of availability of some macroeconomic data.
Independent variables: For the variable that describes the increase in the size of the common labour market, the country is only included in its first full period of inclusion. For example, the 2004 EU enlargement took place on 1 May 2004, which is part way through the second quarter of the year. In this case, in our model, the increase in the size of the labour market is assumed from the third quarter of 2004 onwards, as due to job search and matching frictions in the labour market, full effects of the enlargement were unlikely to be seen in the second quarter.


 Open access
Comments
No Comments have been published for this article.