
INTRODUCTION
The introduction of electoral gender quotas has had the widest reaching electoral reform in the world during the past two decades (Krook Reference Krook2009). Since the 1995 Beijing Declaration and Platform for Action, gender quotas have become a global phenomenon to enhance the numerical representation of women in legislatures. More than 100 countries have adopted gender quotas for national parliaments. Legislated and voluntary candidate quotas, which allocate a certain percentage of candidates on the party list for women, are more common worldwide, but reserved-seat quotas, which guarantee a certain percentage or number of parliamentary seats for women, are particularly popular in Sub-Saharan Africa. Of the 33 Sub-Saharan African countries that have some kind of quotas for women, 13 (i.e. Burundi, Côte d'Ivoire, Djibouti, Eritrea, Kenya, Niger, Rwanda, Somalia, South Sudan, Sudan, Tanzania, Uganda and Zimbabwe) have reserved seats (International IDEA, Stockholm University & Inter-Parliamentary Union 2016).Footnote 1
We compare the reserved-seat models of two early quota adopters that have served as an inspiration to later adopters in the region to examine how the mechanism used to elect reserved-seat members of parliament (MPs) influences the transfer of quota MPs from quota seats to non-quota seats in subsequent elections. Since Tanzania and Uganda pioneered reserved-seat quotas in 1985 and 1989, respectively, there has been a rapid spread of reserved-seat quotas for women in parliament in Sub-Saharan Africa.
Tanzania and Uganda, however, have used completely different methods to recruit reserved-seat MPs. In Tanzania, political parties make lists of reserved-seat candidates, using internal mechanisms. Reserved seats are then proportionally distributed among the political parties that meet a 5% threshold of popular votes in the parliamentary election. In other words, reserved-seat MPs are indirectly elected. By contrast, in Uganda, one woman representative is elected by universal suffrage in each district – which may consist of multiple counties (constituencies) – in directly contested ‘female candidate only’ elections.Footnote 2
In the two countries, the number of reserved seats has gradually increased over time, contributing to increases in the total number of parliamentary seats (see Tables I and II). Currently, Tanzania reserves 113 of 393 parliamentary seats and Uganda reserves 112 of 427 parliamentary seats for women. However, reserved seats were never meant to be permanent. They were established as a temporary strategy until women could compete on their own with men for open seats. Which temporary strategy, then, better enables quota MPs to switch to non-quota seats?
Women in the Tanzanian legislature, 1995–2020

Sources: Yoon (Reference Yoon2013: 144); Tanzania National Electoral Commission (2016).
* This total also includes MPs from the Zanzibar House of Representatives and MPs appointed by the president.
Women in the Ugandan parliament, 1996–2021

Sources: Muriaas & Wang (Reference Muriaas and Wang2012: 312–14); Electoral Commission of Uganda (2016).
* The total number of seats excludes ex-officio members.
Adoption in Uganda
The Ugandan parliament consists of three types of representatives: MPs elected directly to represent constituencies, MPs serving in reserved seats, and ex-officio members appointed by the president (including the vice president and ministers who are not elected to parliament and do not have voting rights). Uganda introduced its quota policy in 1989 in a top-down fashion (Muriaas & Wang Reference Muriaas and Wang2012). Museveni and his NRM needed to create regime legitimacy and stability upon seizing power in 1986, after years of turmoil under the rule of Idi Amin (1971–1979), Milton Obote (1980–1985) and a short-lived military regime (1985–1986). The NRM government abandoned multiparty politics, which were seen as having intensified conflict and contributed to the parochial politics of the past (Museveni & Kanyogonya Reference Museveni and Kanyogonya1997: 200–1). Instead, it adopted the principle of inclusiveness. To this end, in 1989, it established group representation, commonly referred to as ‘affirmative action’, on the basis of gender, profession and age (Rubongoya Reference Rubongoya2007: 74). This development was also based on the idea of involving people in democratic governance on a daily basis. The important role that women played during the guerrilla war was key in demonstrating that women could play an active part in the political transformation process and help change the status of women (Byanyima Reference Byanyima and Bystydzienski1992: 142; Rubongoya Reference Rubongoya2007: 79).
The quota policy also originated as a result of pressure exerted by the women's movement in Uganda, which in turn was encouraged and inspired by the international community (e.g. the 1975 UN Conference on Women and the 1979 Convention on the Elimination of All Forms of Discrimination against Women, which Uganda ratified in 1985) (Muriaas & Wang Reference Muriaas and Wang2012). Ensuring women's political participation has been among the top priorities of the women's movement. In fact, women's organisations pushed for reserved seats at the national level as early as 1964 (Tripp Reference Tripp2000: 23, 40, 78–82). In the mid-1980s, developments at the international level provided an important backdrop against which women could finally successfully assert their desire for an increase in political representation. Table II shows how the number of women quota representatives has increased over time, corresponding to the increase in the number of districts. Although quotas have been used as a fast-track mechanism to increase the number of women representatives in parliament, as is the case with Tanzania, they are viewed as temporary, and subject to review every five years (Republic of Uganda 1995: article 78).
This paper focuses on a largely unexplored effect of gender quotas, namely, how different selection mechanisms for reserved-seat MPs affect the extent to which quota beneficiaries win unreserved seats, using Tanzania and Uganda as cases. While many studies have examined the effects of gender quotas, few have examined the effects of different quota designs on facilitating or hindering the move from quota to non-quota seats. Furthermore, most studies of reserved seats are single case studies (e.g. Goetz Reference Goetz2002; Bauer Reference Bauer and Tremblay2008; Yoon Reference Yoon2008, Reference Yoon2013; O'Brien Reference O'Brien, Franceschet, Krook and Piscopo2012; Wang Reference Wang2013, Reference Wang.2014; Josefsson Reference Josefsson2014; Clayton et al. Reference Clayton, Josefsson and Wang2017), and cross-country comparisons of the effects have hardly received any attention in the quota literature. Figures 1 and 2 display the number of female constituency MPs in each country by election year, including ‘fresh switches’ from quota seats to general seats. The total number of fresh switches in Tanzania (27 from 1995 to 2015) versus Uganda (10 from 1996 to 2016) suggests that the Tanzanian model may be better in facilitating switches. The linear increase in the number of female constituency MPs (from 8 to 25) in Tanzania (Figure 1) is due mainly to the movement of some reserved-seat MPs to constituency seats in subsequent elections. Some female MPs have also been re-elected in constituencies after the switch. Thus, ‘old and new switches’ together account for more than 50% of female constituency MPs in Tanzania.
Female constituency MPs in Tanzania by election year.

Female constituency MPs in Uganda by election year.

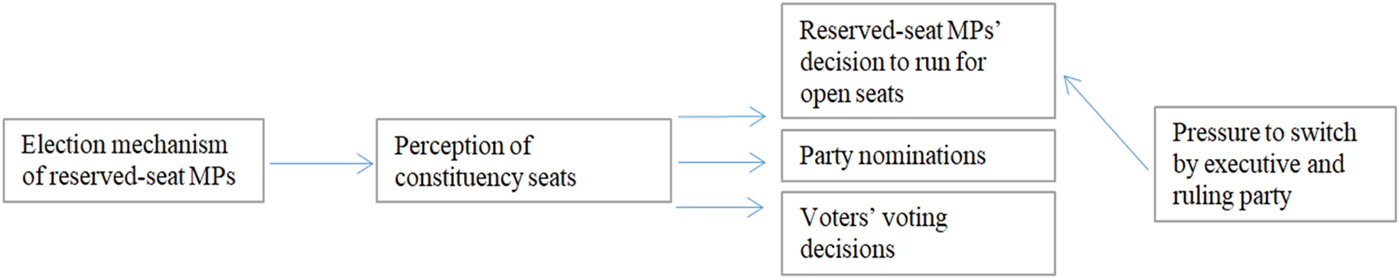
However, the same level of movement has not occurred in Uganda (Figure 2) – where the number of female constituency MPs has vacillated a bit more, reaching a peak of 18 female MPs in the most recent election. The reserved-seat design each country uses is the decisive factor contributing to this difference, in combination with executive and ruling party pressure (or lack thereof) on female MPs to switch to open seats. Specifically, Uganda's reserved-seat mechanism ghettoises quota MPs more than Tanzania's system, by creating a gendered perception that constituency seats are for men and quota seats are for women. This gendered perception affects not only the decision of female MPs to run for election to an open seat, but also affects party nominations and voters’ decisions. In addition, unlike in Tanzania, Uganda's executive branch and ruling party do little to encourage quota MPs to switch to open seats. Figure 3 summarises our argument above and serves as a framework of our analysis.
Election model of reserved-seat MPs and switches to non-quota seats.
Methodology
To explain the different outcomes in Tanzania and Uganda, we compare them in a most-similar systems design. In addition to being two early adopters of reserved seats, Tanzania and Uganda share a number of commonalities. First, in both countries, excessive powers are vested in the presidency in a one-party dominant system. The same party has an overwhelming majority of parliamentary seats. Second, as Tables I and II show, the two countries have similarly sized parliaments and have reserved similar numbers of seats for women. Third, both countries use a first-past-the-post (FPTP) single-member plurality system to elect constituency MPs.Footnote 3 Fourth, Tanzanian and Ugandan women face similar cultural and economic hurdles, including electoral violence, when attempting to enter parliament as constituency MPs. Finally, the quota-seat experience of women in the two countries is quite similar.
Reserved-seat MPs who want to become constituency MPs must go through multiple steps: (i) decide to run for a constituency seat, (ii) obtain a party nomination and (iii) win at the polls. (The exception is independent candidates in Uganda, who do not need to receive a party nomination to run for parliamentary election.) We compare the effects of the two reserved-seat models on the transfer of quota MPs to non-quota seats, considering those steps in the analysis.
This study relies on plentiful data drawn from more than 200 individual interviews in Tanzania and Uganda during the course of multiple research trips, as well as other data jointly collected in Uganda. Specifically, the Tanzanian case draws on about 100 interviews with male and female MPs (in both constituency and reserved seats) from both the ruling and opposition parties, as well as with representatives of civil society organisations, in 2007, 2008 and 2013. The Ugandan case draws on 91 interviews with government representatives, civil servants, civil society activists, representatives of development partners, and academics, carried out in Kampala from March to June 2010. In addition, in June 2015, we jointly conducted 40 semi-structured interviews in Kampala with male and female MPs (including constituency MPs from the ruling and opposition parties, independent MPs and reserved-seat MPs), representatives of civil society organisations, academics and members of the Uganda Women's Parliamentary Association (UWOPA) in Kampala. Most interviews were recorded (with permission of the interviewees).
ELECTORAL SYSTEM AND QUOTA DESIGN
Studies on quota design typically examine whether a particular design increases the numerical representation of women in parliament and mostly focus on candidate quotas (Tripp & Kang Reference Tripp and Kang2008; Jones Reference Jones2009; Schwindt-Bayer Reference Schwindt-Bayer2009). To increase female legislative representation, the match between electoral system and type of quota is key, since quotas work in conjunction with electoral systems. According to Larserud & Taphorn (Reference Larserud and Taphorn2007: 12), while either candidate quotas with ‘percentage regulations with placement mandate’ or reserved-seat quotas with ‘a tier for women candidates only’ are most effective in increasing female descriptive representation in combination with proportional representation systems, reserved seats are the best fit in combination with the FPTP systems Tanzania and Uganda employ. As such, reserved-seats are the most common quota type in plurality/majority systems (Bauer Reference Bauer and Tremblay2008: 33). In FPTP electoral systems, each party nominates only one candidate per constituency; thus, regulations requiring a certain percentage of female candidates and placement mandates are potentially meaningless. However, as the Tanzanian and Ugandan cases demonstrate, countries can use reserved-seat systems instead of percentage mandates, and can design such reserved-seat systems in a variety of ways.
POSITIVE AND NEGATIVE EFFECTS OF QUOTAS ON SWITCHING TO OPEN SEATS
Quotas can either positively or negatively affect the move of women to open seats. On the positive side, more women gain political experience and thus confidence (Dahlerup Reference Dahlerup and Dahlerup2006: 301; Krook Reference Krook2008: 360; Yoon Reference Yoon2008, Reference Yoon2013: 147; Shin Reference Shin2014: 88). By performing well in office and demonstrating that they are competent politicians, they enhance their electability, making them more attractive to political parties (Bjarnegård & Zetterberg Reference Bjarnegård and Zetterberg2011: 191). For example, Beaman et al. (Reference Beaman, Pande, Cirone, Franceschet, Krook and Piscopo2012: 222), focusing on West Bengal, finds that villagers are likely to change their attitudes toward women in leadership positions after having been exposed to female role models who deliver in office.
Shin (Reference Shin2014) identifies a spill-over effect of proportional representation electoral gender quotas in South Korea to single-member districts where there are no quotas. Women elected via quotas tend to stand for and win non-quota seats, due to the ‘no re-election norm’ that applies to quota positions and the women's own enhanced political experience. Likewise, Bhavnani (Reference Bhavnani2009) finds that after the withdrawal of quotas in the Mumbai municipal elections, women were five times more likely to win non-quota seats in subsequent elections. In that case, the reserved-seat system worked mainly because it introduced women into politics who were capable of winning elections even in non-quota settings (thus proving to political parties that women are electable). Therefore, from a long-term perspective, experience with quotas can enhance the sustainability of women's numerical representation.
Conversely, other works demonstrate that quotas may adversely affect or have no effect on the sustainability of women's representation (e.g. Davidson-Schmich Reference Davidson-Schmich2010). One of the most common critiques against gender quotas is that they violate the principle of merit and bring unqualified and undeserving women into office at the expense of meritorious (male) representatives. This could, in turn, be detrimental to the quota recipients’ ability to successfully run for non-quota seats.
Reserved-seat quotas, which are based on women-only electoral competitions, are also criticised for ghettoising women's political representation (Kishwar Reference Kishwar1996: 2872). Goetz (Reference Goetz2002, Reference Goetz, Goetz and Hassim2003) argues that the Ugandan quota system has created two parallel and isolated electoral spheres for female and male candidates. As Tripp (Reference Tripp2000) finds, an attitude is prevalent that women should stick to ‘their seats’. In this way, the reserved seat system discourages women from contesting for non-quota seats (Tripp et al. Reference Tripp, Konaté, Lowe-Morna and Dahlerup2006: 131). Empirical studies in other contexts (e.g. Sadie Reference Sadie2005: 24; Darhour & Dahlerup Reference Darhour and Dahlerup2013: 133) argue that the existence of two separate avenues into parliament makes political parties less willing to nominate women to constituency seats.
Furthermore, irrespective of recruitment mechanisms for reserved seats, quota MPs lack an electoral base, which is crucial to winning a constituency seat (Matland Reference Matland and Dahlerup2006: 287; Krook Reference Krook2008: 350). There is also a danger that the quota provision will act as a glass ceiling, preventing women from being elected to non-reserved seats beyond the quota requirement (Darhour & Dahlerup Reference Darhour and Dahlerup2013).
In some cases, reserved seats have also been strategically used for purposes other than obtaining gender equality. In Uganda, for instance, the incumbent party, the National Resistance Movement (NRM), has employed the quota system to maintain its dominance. The process of district creation and decentralisation is a way of spreading patronage to wider sections of society and has been used to co-opt the opposition and strengthen the government prior to elections (Muriaas & Wang Reference Muriaas and Wang2012: 327–8). This may reinforce the regime's dependence on quotas and keep quota representatives from competing in open constituencies.
THE RESERVED-SEAT SYSTEM IN TANZANIA AND UGANDA
This section discusses why the reserved-seat system was established, how the system has evolved over time, and how reserved-seat MPs are elected in each country.
Adoption and evolution of the reserved-seat system
Adoption in Tanzania
The Tanzanian legislature has four types of MPs: constituency MPs, reserved-seat MPs, MPs elected by the Zanzibar House of Representatives, MPs nominated by the president, and the attorney general as an ex-officio member (Parliament of Tanzania 2015b). As of June 2016, the current parliament (2015–2020) consists of 264 constituency MPs, 113 reserved-seat MPs, five MPs from the Zanzibar House of Representatives, six MPs nominated by the president, and the attorney general. The number of MPs is likely to increase once the president nominates up to 10 MPs.
Tanzania established a reserved-seat system for women (popularly referred to as the ‘special-seat’ system for women) in 1985 under single-party rule to redress the gender gap in parliament. However, it was only meant to be a ‘short-term gap-filling’ measure until women could compete on their own (Mosha & Johnson Reference Mosha and Johnson2004: 107). Although the country previously had special seats to represent various large organisations (e.g. the Umoja wa Wanawake wa Tanzania [Union of Tanzanian Women, or UWT], youth, parents, workers and universities), it was not until 1985 that the country established the special-seat system for women, by reserving 15 parliamentary seats (Yoon Reference Yoon2008: 66). Following the adoption of special seats for women, women could occupy constituency seats or special seats representing either large organisations or women.
Socialist principles delineated in the Arusha Declaration of 1967 contributed to the adoption of special seats for women, as did women's contributions to Tanzania's nationalist movement. The Arusha Declaration became the guiding principle of the ruling party (Tanganyika African National Union, or TANU) and its successor (Chama Cha Mapinduzi, or CCM). It provided that ‘every citizen is an integral part of the nation and has the right to take an equal part in Government at local, regional and national level’ (Nyerere Reference Nyerere and Madyibi1967). The severe gender gap in Tanzania's post-independence politics was not only inconsistent with the Declaration but also morally unjustifiable, considering the active role women had played during the independence struggle (Yoon Reference Yoon2008: 65).
Tanzania's adoption of multiparty rule in 1992 and its subsequent multiparty election in 1995 removed special seats for large organisations and increased the number of special seats for women from 15 to 37. Table I shows how the number of special seats has increased over time, with the gradual increase in the parliamentary size. The lobbying efforts of UWT, female parliamentarians and women's non-governmental organisations (NGOs), as well as the country's commitments to international gender equality conventions (e.g. the Beijing Platform for Action, the Maputo Protocol of 2003 and the Southern African Development Community Protocol on Gender and Development of 2008) have contributed to the gradual increase in the number of special seats (Mosha & Johnson Reference Mosha and Johnson2004: 35).
Election mechanisms for reserved-seat MPs
In Tanzania, constituency MPs are elected through the FPTP single-member plurality system, but special-seat MPs are elected by their parties. Specifically, before each parliamentary election, political parties rank their special-seat candidates and submit these candidate lists to the National Electoral Commission. The Commission then proportionally distributes special seats to the parties that received ‘at least 5 percent of all valid votes for parliamentary election’ (Tanzania National Electoral Commission 2006: 75). In 1995 and 2000, the Commission allocated special seats based on the number of constituency seats each party won, but since 2005, the Commission has allocated these seats based on the number of popular votes each party received in the parliamentary election. During single-party rule, constituency MPs elected special-seat MPs among nominees that CCM's national executive committee put forward (Yoon Reference Yoon2008: 63). Unlike in Uganda, Tanzania has no independent candidates. Parties have used different internal mechanisms to nominate special-seat candidates. CCM, the Chama cha Demokrasia na Maendeleo (CHADEMA), and the Civic United Front (CUF) all have competitive nomination processes, due mainly to the large number of aspirants in each party.
The special-seat system significantly benefitted CCM in earlier elections, when the opposition was much weaker, by adding a disproportionate number of special seats to the ruling party. However, as opposition parties have grown stronger in recent elections, the system has also helped the opposition increase its share of parliamentary seats. In 1995, the opposition held 9 of 37 special seats and accounted for only 55 of 275 total parliamentary seats (20%). However, in the current parliament, the opposition holds 47 of 113 special seats and accounts for 115 of 393 parliamentary seats (29·26%).Footnote 4 Nonetheless, CCM's superior infrastructure and resources have placed its candidates, including special-seat MPs running for constituency seats, in an advantageous position. Some special-seats MPs are also ministers and deputy ministers in the administration, since the president draws his cabinet members from among the MPs.
In Uganda, the group representatives currently include one directly elected female representative from each district (a total of 112 female representatives), as well as indirectly elected representatives of the youth (5), disabled persons (5), workers (5) and the Uganda People's Defence Forces (10) (Republic of Uganda 1995: article 78). Female MPs representing districts instead of groups (called quota MPs or ‘district MPs’) are elected in a separate election through a simple plurality system. During NRM's one-party rule (1986–2006), political parties were prohibited from participating in elections, and candidates were elected based on individual merit under NRM's umbrella. At that time, district MPs were indirectly chosen by electoral colleges composed of (predominantly male) local council members.Footnote 5 This system was widely criticised, due to the manipulation, corruption, intimidation and promotion of loyal regime supporters indebted to NRM (Tripp Reference Tripp2000: 231–2; Reference Tripp, Bauer and Britton2006: 121–3; Goetz Reference Goetz, Goetz and Hassim2003: 118). In the words of one old-timer in Ugandan politics who also participated in the process leading up to the introduction of affirmative action, ‘The electoral colleges were controlled by the military and the political arm of the government, and therefore most of the women that came through this platform were those who strongly supported the current government’ (Atim-Ogwal 2010 Int.).Footnote 6 Since the reintroduction of multiparty rule in 2006, quota MPs have been elected by universal suffrage at the district level. This reform was motivated by the need to create a more transparent voting process, thereby enhancing the independence and legitimacy of district MPs.
The nomination processes for district seats within the main political parties vary, but formally follow the primary election procedures for open-seat candidates. The ruling party primaries for district seats are competitive. At times, NRM aspirants for district seats face stiffer competition during the party nomination process than in the inter-party competition. Opposition primaries for district seats are not as competitive. Women are often reluctant to stand on an opposition ticket because opposition parties have fewer resources and opposition candidates face a more hostile campaign environment (Wafula Oguttu 2015 Int.).
Considering that the great majority of quota representatives are NRM members, the quota system has helped boost NRM's electoral strength and share of parliamentary seats (Muriaas & Wang Reference Muriaas and Wang2012). NRM is the only party able to field candidates in almost all districts. In the 2016 elections, for instance, NRM fielded 110 candidates for 112 districts. In addition, NRM has greater organisational capacity than opposition parties, which are generally weakly institutionalised (Kiiza et al. Reference Kiiza, Svåsand, Tabaro, Kiiza, Makara and Rakner2008; Ahikire & Madanda Reference Ahikire and Madanda2009; Juma Reference Juma2010). Thus, all types of candidates (not just women) benefit by becoming an NRM flag bearer, since they have access to the support and backing of the NRM machinery.
Unlike in Tanzania, Uganda has independent candidates for parliamentary seats. Many unsuccessful candidates in NRM party primaries have opted to contest for constituency or district seats as independents. Independent seats, therefore, partly work as an alternative avenue to parliament for those who lose the party primaries. The number of independents running for district seats has increased substantially in the past decade, due to infighting and fractionalisation within the ruling party. As many as 200 independent candidates ran for district seats in the 2016 election, making up nearly half of the 405 women contesting district seats (Electoral Commission of Uganda 2016).Footnote 7 Reserved-seat MPs in Uganda, like those in Tanzania, can serve as ministers and deputy ministers. In Uganda quite a few district MPs are appointed to hold such positions.Footnote 8
COMMON OBSTACLES TO TRANSITIONING FROM A RESERVED TO AN OPEN SEAT
As discussed above, the quota systems in Tanzania and Uganda have evolved over time with a gradual increase in the number of reserved seats for women. However, despite the increase in female candidates and reserved seats, the number of switches to open seats has been small in both countries. What explains this imbalance? Although the reserved-seat experience has given female MPs an opportunity to show their talent and skills and has helped them build confidence and name recognition, women still face considerable obstacles when contesting for an open seat.
First, the competition for open seats is fiercer than for reserved seats. Thus, female candidates are at greater risk of losing the election than when contesting for reserved seats. In particular, female candidates of the major parties often lose in party primaries for open seats. In parties’ strongholds, intra-party competition in the primaries is stiffer than inter-party competition in general elections, since winning the primary almost guarantees winning a constituency seat. In Tanzania, women in small parties easily win in the primaries, where there is no competition for nomination, but women in the major parties (i.e. CCM, CHADEMA and CUF) usually lose in the primaries. For example, in 2015, only 65 of the 238 female candidates were nominated by the major parties (Yoon Reference Yoon2016: 202). Parties can nominate aspirants other than those who placed first in the primaries, and the ruling party, CCM, has occasionally nominated women ranked second or even third in the primaries to increase the number of female constituency MPs. However, the number of such overturns has been extremely small, due to concerns about losing the constituency seat if a woman is nominated and backlash from supporters of the (male) winner.
In Uganda, for the same reasons, female aspirants tend to lose party primaries, and major parties are generally reluctant to field female candidates for open seats. In the 2016 elections, women accounted for less than 10% of open-seat candidates in all parties except one minor party. For example, women constituted 8·9% of NRM's candidates, an increase from 5·6% in the 2006 elections, and 2·5% of candidates of the largest opposition party, the Forum for Democratic Change (FDC), a decrease from 3·6% in 2006 (Ahikire & Madanda Reference Ahikire and Madanda2009: 466, 469; UWONET 2016: 32). However, some female aspirants who are not chosen as party flag-bearers opt to stand for election as independents.
Second, the male-dominated culture, which shapes the view that women cannot be leaders (Tamale Reference Tamale1999; Tripp Reference Tripp2000, Reference Tripp, Bauer and Britton2006: 116–17; Matembe Reference Matembe2002), challenges quota MPs’ endeavours to become constituency MPs. For example, married women frequently have a difficult time finding a constituency to run in, since they usually move from their home area when they marry (Tripp Reference Tripp, Bauer and Britton2006: 116), and are seen to not fully belong in any constituency. They need to defy deeply engrained attitudes about their ability (as women) to suitably represent a constituency, as well as concerns that an MP needs to have been born in the area she or he represents. This is what Ibrahim (Reference Ibrahim2004: 9) refers to as ‘the indigeneity ploy’. Female candidates also experience a media bias; the portrayal of female politicians in the media is typically riddled with stereotypes (Tripp Reference Tripp, Bauer and Britton2006: 117). In Uganda, the steady increase in new districts has also resulted in a number of reserved-seat districts that coincide with an open-seat constituency. This increases the hurdle for quota MPs to switch seats because both the district and the constituency would then be represented by women.
Third, rampant election violence and intimidation – often with a gendered dimension – further exacerbates the hurdles for women seeking an open seat. A former female open-seat MP in Uganda highlighted the sexual violence and insecurity during election campaigns saying, ‘Some of your political opponents can cut you and rape you just to embarrass you. So there are so many security risks involved with a woman campaigning and being exposed in this political environment.’ She went on to add, ‘It is like we are intruders and at times we have to be told off’ (Atim-Ogwal 2010 Int.). In the case of Tanzania, female candidates do not encounter physical violence, but still experience verbal abuse and intimidation from their male competitors (Ekonea 2013 Int.).
Fourth, candidates have to fund their own campaigns, and women are financially disadvantaged, compared with their male counterparts, in terms of access to patronage and independent resources (Asiimwe Reference Asiimwe, Tripp and Kwesiga2002: 122; Ahikire Reference Ahikire2004: 2; Tamale Reference Tamale and Ballington2004: 42; Tripp Reference Tripp, Bauer and Britton2006: 117; Tripp et al. Reference Tripp, Konaté, Lowe-Morna and Dahlerup2006: 127; Ssali & Atoo Reference Ssali, Atoo, Kiiza, Makara and Rakner2008: 167–8). Campaign expenses in these countries include hand-outs to voters, contributions to formal and informal community projects, payments to campaign teams, transportation and entertainment. These are beyond the reach of many women (female MPs, various years, Ints). Opposition candidates, who do not have the ruling party machinery and party coffers to fall back on, are further disadvantaged (opposition female MPs, various years, Ints).
Fifth, as the quota literature discusses, some obstacles that quota women face in the two countries have resulted from the very system that brought them to parliament. Specifically, the reserved-seat system can create the impression that women have their own seats (Tripp Reference Tripp2000). Miria Matembe, a former district MP and minister in Uganda, points to the discriminatory attitude that female quota MPs face when they attempt to stand for constituency seats, ‘They think that all the [constituency] seats belong to men. Only the affirmative action seats are for women’ (Matembe 2010 Int.). Significantly, our interviews do not indicate that the introduction of universal suffrage for district seats in Uganda in 2005 has led to any improvement with respect to the prevailing gendered perception of district seats as women's seats and open seats as men's seats.
The system has also generated a view that there is a two-tiered system of legislators (Goetz Reference Goetz, Goetz and Hassim2003: 118; Ahikire Reference Ahikire2004; Yoon Reference Yoon2008: 74), and quota MPs are at risk of becoming second-rate representatives (MPs, various years, Int.). ‘Special seats have created a stigma against women; people tend to look down upon special-seat MPs’, stated Anna Abdullah, a female veteran politician in Tanzania (2013 Int.). As such, many quota MPs in both countries expressed the feeling that their colleagues and people outside of parliament do not give them the same level of respect as constituency MPs (Kiwanga 2013 Int.).Footnote 9 According to Clayton et al. (Reference Clayton, Josefsson and Wang2014), women elected to reserved seats in the Ugandan legislature are significantly less recognised in plenary debates over time, as compared with their male and female colleagues in open seats.
Furthermore, quota MPs lack an electoral base. While each constituency MP serves a constituency, each reserved-seat MP serves a region, which consists of four to nine constituencies (in Tanzania), or a district, which consists of one to five constituencies (in Uganda). Though quota MPs cater to all of the constituencies in their regions or districts, they do not necessarily ‘belong’ to a particular constituency. A core duty of MPs in single-member districts using plurality rules is typically to provide constituency service in the form of community development and personal assistance to constituents. The wider area many quota MPs serve, therefore, puts them at a disadvantage, since they have to attend to the needs of constituents in an entire region or district. Despite their wider coverage area, reserved-seat MPs receive the same salaries and allowances as constituency MPs and the same constituency development fund (the CDF was formally scrapped in 2011) (Kasfir & Twebaze Reference Kasfir, Twebaze, Baskin and Mezey2014: 96).
TRANSFER FROM A QUOTA SEAT TO AN OPEN SEAT: WHY IS TANZANIA'S MODEL BETTER THAN UGANDA'S?
Quota seats constitute the main path to parliament for women in both Tanzania and Uganda. Yet, according to our interviewees, neither country views the reserved-seat system as a permanent measure to bring more women into parliament. Considering that quota MPs duplicate many of the duties of constituency MPs, many people see them as redundant. The ongoing debates concerning the raison d’être of special seats in Tanzania and the periodic reviews of quotas specified in the Ugandan constitution clearly demonstrate the temporary nature of these quota systems. One of the objectives of gender quotas is to give women political experience, and there is an expectation that experienced quota MPs will move on to open seats if they wish to continue their parliamentary career (Mosha & Johnson Reference Mosha and Johnson2004: 108).Footnote 10 Stakeholders (both MPs and women activists) we interviewed in both countries expressed the belief that women's political space will expand if more quota MPs move to constituency seats and leave their quota seats to newcomers to politics. However, contrary to this expectation, many quota MPs continue to re-enter the legislature in reserved seats, since there are no term limits for quota recipients. According to Philip Wafula Oguttu, the leader of the opposition in Uganda, the long tenure of quota seats by many women has created an impression that women are inferior, making quotas counterproductive to women's political empowerment (2015 Int.).
While most quota MPs do not pursue an open seat, due to the hindrances discussed above, some do. Why do some choose to vie for open seats? Ironically, the obstacles that the quota system creates motivate some quota MPs to switch. First, they object to the perception that they are second-class MPs. Even among women, female constituency MPs are viewed as superior to quota MPs, since they contested against men and won (Nyakikongoro 2015 Int.). One of the few Ugandan quota MPs who successfully switched to an open seat pointed to her treatment as a second-class MP by constituents as the primary motivation for making a move: ‘Everywhere I would go, constituents would ask me “where is our MP?”’ (Amongi 2015 Int.).Footnote 11 Some practices also reinforce the impression that quota MPs are not equal to constituency MPs. For example, in both Tanzania and Uganda, reserved-seat MPs are expected to inform constituency MPs in their regions or districts whenever they visit their constituencies (former Tanzanian reserved-seat MPs, various years, Ints; Flavia 2015 Int.). If both the quota MP and the constituency MP are present at official or social functions, the constituency MP is prioritised in terms of speaking.
Second, the wider coverage area of quota MPs – coupled with their lack of resources – makes them feel overwhelmed and overstretched. Particularly in Uganda, interviewees suggested that the introduction of universal suffrage for district seats has elevated the expectation of quota MPs (Aritua 2015 Int.) to the extent that their work is always compared with that of constituency MPs (Flavia 2015 Int.). Quota MPs interviewed shared their belief that they could do a much better job if they served just one constituency, like open-seat MPs.
Although it is difficult for quota MPs to switch to open seats in both Tanzania and Uganda, quota MPs in Tanzania appear to be doing better than their counterparts in Uganda. They have recorded a larger number of switches in each election except for 2000 (see Figures 1 and 2 above). In Tanzania, transfers from quota seats to open seats have significantly contributed to an increase in the number of female constituency MPs, though there have also been a few reverse transfers. Furthermore, some women have been re-elected in their constituencies multiple times since their switches. Thus, most female constituency MPs in the Tanzanian parliament have reserved-seat experience. However, in Uganda, hardly any district representatives successfully cross over from reserved seats to open seats (although there was an increase in 2016). Moreover, a few women have switched from an open seat to a reserved seat.
The difference between the two countries is due mainly to the different reserved-seat mechanisms that the two countries employ as well as (to a lesser extent) efforts by the executive and ruling party to encourage the switch to open seats. The Ugandan design compartmentalises women in quota seats more than the Tanzanian design. As discussed earlier, in Uganda reserved-seat MPs are directly elected in separate universal elections, while in Tanzania reserved seats are proportionally distributed among political parties, which elect reserved-seat MPs. While the same voters directly elect both constituency and quota MPs in Uganda, voters do not directly elect quota MPs in Tanzania. Furthermore, unlike voters in Uganda, voters in Tanzania do not cast their votes for specific quota (female) candidates in the general elections. Uganda's reserved-seat design makes the switch from a quota seat to an open seat more difficult because it creates two largely separate electoral spheres for female and male candidates. The reserved-seat system in Uganda effectively sets the standard for how many female representatives are elected to parliament. As a male Ugandan MP succinctly stated, ‘The territory is divided with a clear demarcation between the two electoral spheres’, as if one universal election is to elect male representatives and the other is to elect female representatives (Mudini 2015 Int.).
Specifically, the Ugandan model has shaped the popular belief that district (quota) seats are for women and constituency seats are for men (Iyamuremye 2015 Int.; Okumu 2015 Int.). If women stand for constituency seats, they are met with suspicion, and voters ask, ‘Why do women want to take men's seats when women have their own seats?’ (Aritua 2015 Int.). When district MPs contest for constituency seats, voters tend to say, ‘[They] are not supposed to cross the line’ (Najjemba 2015 Int.) or ‘[W]hy don't you stay where you are?’ (Okumu 2015 Int.). According to our interviewees, constituents commonly view district MPs aspiring for constituency seats as intruders into someone else's territory (Amongin 2015 Int.; Kadaga 2015 Int.; Turyahikayo 2015 Int.). They believe women should stick to ‘their seats’ (Kiiza 2015 Int.; Mulongo 2015 Int.). A district seat MP explained how a woman standing for an open seat faced hostile comments from constituents who insisted, ‘If a hen crows, just get a knife and slaughter the hen. [The] hen cannot crow’ – implying that only men should contest for open seats and speak up in public (Aol 2015 Int.).
The gendered perception of constituency seats as men's seats affects not only the decision of quota MPs to run for constituency seats, but also party nominations and the electorate's voting decisions. Specifically, it further discourages district MPs, including most high-profile women in parliament (such as Uganda's Speaker Rebecca Kadaga), from standing for constituency seats. All things considered, it does not make sense for district MPs to risk their parliamentary seats by attempting to switch over to constituency seats, which are much more difficult to win (CEWIGO officer 2015 Int.; Nyakikongoro 2015 Int.). As one Ugandan quota MP suggested, district women prefer to stay where they are (Sentamu 2015 Int.). Another Ugandan quota MP stated, ‘[U]nless voters’ mindset changes, the attempt to switch from a district seat to a constituency seat is risky’ (Nyakikongoro 2015 Int.). Furthermore, the change from indirect to direct election of district MPs, which enhanced the legitimacy of district seats, may have further contributed to the inclination of Ugandan district MPs to remain in ‘their’ seats. The stigma against district MPs in Uganda appears to be less prominent than that against reserved-seat MPs in Tanzania.
The seemingly gender-segregated electoral spheres in Uganda also create institutionalised opposition by party gatekeepers and other political elites against women interested in contesting for open seats. For example, when Rosemary Najjemba, a second-term NRM female constituency MP, was up for her second term, her constituency became a district (single-constituency district). The president and party leadership pressured her to run for the district seat, so that a man could be placed in the constituency seat (Najjemba 2015 Int.). She had never held a district seat and was not persuaded. She won her second term in the constituency seat.
With respect to voting, there was a prevailing perception among interviewees that voters tend to vote for male candidates for constituency seats, who are regarded as ‘rightful’ occupants of constituency seats (Oguttu 2015 Int.; Mudini 2015 Int.). Women who contest open seats were thought to displace men from their positions (Tete 2015 Int.). The result is that ‘when a woman and a man present themselves for the direct [open] seat, usually the man is the preferred candidate by all’ (Aol 2015 Int.). A constituency MP (and a former district MP) described how the mindset of people still keeps them from accepting the leadership of women and the implications it has for voting behaviour: ‘Even to us who are going for a constituency seat, they keep telling us “your seat is at the district”, and some lose because of that’ (Masiko 2015 Int.).Footnote 12
In short, as Miria Matembe (2015 Int.) stated, ‘the Ugandan affirmative-action system has [eventually] compartmentalized women’. The underlying rationale is that the election of a female constituency MP should not come at the cost of a male MP. In fact, according to Ugandan MPs, a woman with no district-seat experience may have a better chance at winning a constituency seat, due to voters’ negative attitudes towards crossovers (Mulongo 2015 Int.; Najjemba 2015 Int.; Okumu 2015 Int.). At the same time, a woman's success at the polls depends on whether she has a proven track record in her constituency (e.g. from involvement in local level politics), as this generates trust among constituents. As an open-seat representative asserted, ‘If you have the people believe that you can lead them, the people will trust you’ (Bakeine 2015 Int.). However, if quota MPs decide to run for constituency seats, they have a better chance of winning in newly created constituencies, where there is no incumbency disadvantage, which has been found to negatively affect women's access to elective office (Schwindt-Bayer Reference Schwindt-Bayer2005). Of five switches in Uganda in 2016, two (Beatrice Anywar Atim of FDC and Annet Nyakecho of NRM) were made in new constituencies.
In Tanzania, the compartmentalisation of women in special seats is less noticeable, even though special seats, like district seats in Uganda, have been a distinct path to parliament for women. Although men are viewed as the ideal and typical representatives for constituency seats in both countries (due primarily to cultural attitudes toward men as leaders), constituency seats are not defined as ‘men's seats’ in Tanzania as they are in Uganda. The less rigid perception of constituency seats may be due to the mechanism Tanzania uses to elect quota MPs. As discussed above, Tanzania has no separate universal election of special-seat MPs. Votes cast to elect constituency MPs indirectly elect special-seat MPs through proportional representation, thus making the election of special-seat MPs less explicit to voters. The Tanzanian model, therefore, does not generate a perception that one election is to elect men and the other is to elect women. As a result, crossovers in Tanzania appear to cause few objections. According to former special-seat MPs who have switched to constituency seats, voters are willing to vote for special-seat MPs with proven records of service in their communities during their tenure in special seats (former special-seat MPs, various dates, Ints). Particularly, in neglected constituencies, voters encourage well-performing special-seat MPs to contest for constituency seats to replace their (male) incumbents (Nkya 2013 Int.). Special-seat MPs, therefore, see neglected constituencies as an opportunity to switch to constituency seats (Nkya 2013 Int.). This sort of encouragement appears harder to come by in Uganda, due to the dominant popular perception of constituency seats as men's seats.
To a lesser degree, encouragement for switches by the executive and ruling party may also contribute to the difference in the number of moves from reserved seats to open seats. In Tanzania, there has been an expectation that experienced quota MPs will compete for constituency seats in future elections, leaving their quota seats for other women (Mhagama 2013 Int.).Footnote 13 The ruling party and women's NGOs, including the Tanzania Cross-Party Platform (Ulingo), have pushed experienced reserved-seat MPs to contest for open seats in recent elections. Therefore, occupying special seats for multiple terms is not regarded positively in Tanzania (Mhagama 2013 Int.). CCM's much debated term-limit policy for special-seat MPs (up to two terms) is a case in point. Both male and female MPs who were interviewed shared their beliefs that special seats are needed as long as gender bias hinders women's entry into politics, but experienced special-seat MPs should move on (male and female MPs, various dates, Ints). The deputy speaker in 2013, Job Ndugai, shared his belief that the special-seat experience, if used well, could be instrumental to winning a constituency seat (Ndugai 2013 Int.).
However, this pressure has been less pronounced, if not absent, in Uganda, where the quota system is highly politicised and the incumbent regime clearly benefits from preserving the status quo (Green Reference Green2010; Muriaas & Wang Reference Muriaas and Wang2012). Women's organisations that have worked to incentivise women holding district seats to contest for open seats and women who aspire to contest for district seats appear to be the only sources of pressure to switch (Aol 2015 Int.). When there is no explicit push from above to encourage quota MPs to run for open seats, there are few incentives for quota MPs to make the leap or for predominantly male party gatekeepers to change their practices. In short, while switching from a quota seat to an open seat is interpreted as an expected and positive progression in Tanzania, in Uganda such crossovers are viewed less favourably, generating an impression that reserved-seat MPs are the standard for female aspirants.
CONCLUSION
This study examines the effects of recruitment mechanisms for reserved-seat MPs on fostering or hindering switches from quota seats to open seats in subsequent elections, using the different reserved-seat systems of Tanzania and Uganda as cases. Although many countries have used reserved seats as a tool to increase female legislative representation and to give women political experience, there has been an explicit or implicit consensus that reserved seats are temporary. We find that the Tanzanian model, which indirectly elects quota MPs through political parties, is more effective in facilitating switches from quota seats to open seats than the Ugandan model, which directly elects quota MPs. The effect of each model is also influenced by the extent to which the executive and ruling party encourage the move from a quota to a non-quota seat.
As the small numbers of transfers in Figures 1 and 2 collectively suggest, quota women in both countries encounter enormous challenges in their pursuit of open seats, despite their political experience. However, the ghettoisation of women in the quota category is stronger in Uganda, due to the perception the quota design has created that constituency seats are ‘men's seats’. Though culturally biased toward men as leaders, voters in Tanzania do not identify constituency seats as the exact counterpart of women's seats, and the divide between constituency and quota seats is less rigid. These findings suggest that any quota design that creates a gendered perception of open seats as men's seats can be counterproductive to sustainable representation.


