

Obesity is a major cause of morbidity and mortality in Western societies. Fundamentally, obesity results from an energy imbalance that occurs when energy consumption exceeds energy expenditure. In order to achieve a state of energy balance, energy intake should meet and not exceed energy expenditure. In human individuals, energy intake is not fully adapted to energy expenditure when assessed per d, but does meet energy expenditure when assessed over 1 week(Reference Westerterp and Elbers1, Reference Westerterp and Goran2). In Western populations, typically, three meals per d are consumed, with the largest meal in the evening. Fabry and co-workers were the first to demonstrate an inverse relationship between habitual meal frequency and body weight in human subjects(Reference Fabry, Hejl, Fodor, Braun and Zvolankova3–Reference Fabry, Hejda, Cerny, Osancova and Pechar5). Later meal frequency studies have shown that nibblers, having a meal frequency of four or more meals/d, are able to compensate more accurately over 24 h for manipulation of the energy content of the foods consumed than meal feeders having a meal frequency of less than three meals/d(Reference Westerterp-Plantenga, Wijckmans-Duysens and Ten Hoor6, Reference Speechly and Buffenstein7). Increasing meal frequency has also been shown to sustain satiety(Reference Speechly and Buffenstein7). Snack consumption, however, has been suggested to be a risk factor for obesity(Reference Zizza, Siega-Riz and Popkin8). In a recent study, Stote and colleagues observed a significant reduction in body weight and body fat of subjects who consumed one meal per d for 8 weeks(Reference Stote, Baer and Spears9). Chapelot and colleagues observed an increase in body fat and RQ when subjects who were used to consuming four meals per d switched to eating three meals per d for 28 d(Reference Chapelot, Marmonier, Aubert, Allegre, Gausseres, Fantino and Louis-Sylvestre10). These relatively long-term studies showed different effects of reducing meal frequency on body fat. A gorging pattern of food intake has been shown to enhance lipogenesis and increase body weight, which may be due to large fluctuations in storage and mobilisation of nutrients. In a state of energy balance, increasing meal frequency, and thereby decreasing inter-meal interval, may prevent large metabolic fluctuations. To gain insight into a one meal difference in the lower range of meal frequency, we studied the acute effect of dividing energy intake over three or two meals per d on energy expenditure, substrate oxidation and 24 h satiety in healthy, normal-weight women in a state of energy balance. We chose to omit lunch in the two meals condition because this resulted in a marked difference in inter-meal interval. In the two meals condition, the inter-meal interval after breakfast is 8·5 h. In the three meals condition, the inter-meal interval is 4 h.
Subjects and methods
Subjects
Fourteen females (BMI 23·2 (sd 2·7) kg/m2; age 24·4 (sd 7·1) years; Three Factor Eating Questionnaire (TFEQ) F1 4 (sd 3); body fat 27·4 (sd 6·9) %) were studied on three occasions. Sixteen women were initially selected based on age, height, weight, BMI and restrained eating score (F1 score) on the TFEQ(Reference Stunkard and Messick11), and two women dropped out because of personal reasons. The TFEQ factor 2 and 3 scores of all subjects were low and normal. Our primary interest was the effects on metabolism and substrate oxidation. We calculated the number of subjects needed based on the differences in RQ observed in a previous study investigating the effect of capsaicin on thermogenesis (see Table 1).
Calculation of number of subjects*

Source: Lejeune and co-workers(Reference Lejeune, Kovacs and Westerterp-Plantenga25).
* For details of subjects and procedures, see Subjects and methods.
Eating behaviour was assessed using a validated Dutch translation of the TFEQ. Cognitive restrained and unrestrained eating behaviour (Factor 1), emotional eating and disinhibition (Factor 2) and the subjective feeling of hunger (Factor 3) were scored. All subjects were healthy, not taking medication, non-smoking and not dieting. The habitual meal frequency of the subjects was three or more. All subjects consumed at least breakfast, lunch and dinner. All subjects gave written informed consent and the study was approved by the Maastricht University Ethics Committee.
Study protocol
The present study had a randomised crossover design and two experimental conditions. Subjects underwent two 36 h sessions in energy balance in a respiration chamber for measurements of energy expenditure and substrate oxidation. The subjects were given two or three meals per d in random order. The subjects did not follow a specific activity protocol. The two 36 h sessions were conducted 4 weeks apart to ensure that each subject was in the same phase of her menstrual cycle. Prior to each 36 h session (3 d before), subjects were provided with a diet in energy balance and with the same macronutrient composition (% energy from carbohydrate 50, protein 35, fat 15) at home. The subjects were instructed to eat the food provided, in three meals, for the 3 d before the experiment. The subjects entered the respiration chamber at 18.00 hours and subsequently received the dinner on the third day prior to the 36 h session. Subjects were instructed to go to bed around 23.00 hours. Dinner was served at 16.30 hours to make the protocol more convenient for the subjects. To keep the subjects in energy balance over 24 h, the 24 h energy intake was compensated at dinner.
Appetite profile
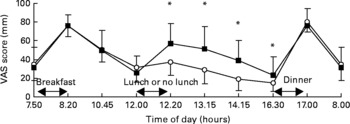
Appetite profile was measured using anchored 100-mm visual analogue scales (VAS). During each respiration chamber session these questionnaires were completed before and after every meal on feelings of hunger, fullness, appetite, satiety, thirst, prospective food consumption and desire to eat. The scale was anchored from ‘not at all’ on the left to ‘extremely’ on the right. During each respiration chamber session, these questionnaires were completed before (07.50 hours) and after (08.20 hours) breakfast, at 10.45, before (12.00 hours) and after (12.20 hours) lunch, at 13.15 hours, at 14.15 hours, before (16.30 hours) and after (17.00 hours) dinner and on the next morning (08.00 hours). We extrapolated the data from the last measurement after dinner to the first measurement the next morning.
Energy intake
During each experimental session subjects were fed in energy balance. The energy content of the diet that the subjects consumed at home was based on BMR calculated with the equation of Harris–Benedict(Reference Harris and Benedict12) and multiplied by an activity index of 1·7(Reference Westerterp13). In the respiration chamber, energy requirements were calculated based on sleeping metabolic rate (SMR) measured during the first night and multiplied by an activity index of 1·5(Reference Westerterp13). Energy intake in the two meals condition was divided over the meals as 30 % for breakfast (08.00 hours) and 70 % for dinner (16.30 hours). In the three meals condition, energy intake was divided over the meals as 30 % for breakfast (08.00 hours), 20 % for lunch (12.00 hours) and 50 % for dinner (16.30 hours). The macronutrient composition of each 24 h diet was 15 % energy from protein, 35 % energy from fat and 50 % energy from carbohydrates.
Body composition
Body composition was determined by underwater weighing in the fasted state. Body mass in air and under water was determined on a digital balance, accurate to 0·01 kg (Sauter type E1200). Lung volume was measured simultaneously with the He dilution technique using a spirometer (Volugraph 2000; Mijnhardt, The Netherlands). Body density was used to calculate body fat according to the two-compartment model with the equation of Siri(Reference Siri14).
Indirect calorimetry
VO2 and CO2 production were measured in the respiration chamber(Reference Schoffelen, Westerterp, Saris and Ten Hoor15). The respiration chamber is a 14 m3 room, furnished with a bed, chair, computer, television, radio cassette player, telephone, intercom, sink and toilet. The room was ventilated with fresh air at a rate of 70–80 litres/min. The ventilation rate was measured with a dry gas meter (type 4; Schlumberger, Dordrecht, The Netherlands). The concentrations of O2 and CO2 were measured with the use of two paramagnetic oxygen analysers (Magnos 6G; Hartmann and Braun and type OA184A; Servomex, Crowborough, UK) and an IR CO2 analyser (Uras 3G; Hartmann and Braun, Frankfurt, Germany). During each 15 min period, six samples of outgoing air for each chamber, one sample of fresh air, zero gas and calibration gas were measured. The gas samples to be measured were selected by a computer that also stored and processed the data(Reference Schoffelen, Westerterp, Saris and Ten Hoor15).
Energy expenditure and substrate oxidation
Energy expenditure in 24 h consists of SMR, diet-induced thermogenesis (DIT) and activity-induced energy expenditure. From 08.00 hours on day 4 to 08.00 hours on day 5, 24 h energy expenditure, its components and 24 h RQ were measured. Activity was monitored with a radar system based on the Doppler principle. SMR was defined as the lowest mean energy expenditure measured over 3 consecutive hours between midnight and 07.00 hours. DIT was calculated by plotting energy expenditure against radar output; both were averaged over 30 min periods. The intercept of the regression line at the lowest radar output represents the energy expenditure in the inactive state (RMR), which consists of SMR and DIT(Reference Westerterp, Wilson and Rolland16). DIT was determined by subtracting SMR from RMR. Activity-induced energy expenditure was determined by subtracting SMR and DIT from 24 h energy expenditure. Physical activity level was calculated by dividing 24 h energy expenditure by RMR. Carbohydrate, fat and protein oxidation were calculated from the measurements of VO2, CO2 production and urinary N excretion by using the formula of Brouwer(Reference Brouwer17). The non-protein RQ (NPRQ) was calculated using the formula:
The hours used for the calculation of the day NPRQ were 08.00 hours (first morning) – 20.00 hours and the hours used for the calculation of the night NPRQ were 20.00 hours – 08.00 hours (second morning). Urine samples (24 h) were collected from the second void on day 4 until the first void on day 5. Samples were collected in containers with 10 ml H2SO4 to prevent N loss through evaporation. Volume and N concentration were measured, the latter with a N analyser (CHN-O-Rapid; Heraeus, Hanau, Germany).
Fat oxidation
Labelled fatty acids were obtained from Cambridge Isotope (Andover, MA, USA). Deuterium-labelled palmitic acid: d31-palmitic acid (DLM-215) was 98 atom%. Deuterium labelled palmitic acid (20 mg/kg body weight) was added to chocolate milk, which was heated up to 65°C and consumed by the subjects at breakfast. Urine was collected for 24 h after breakfast. Recovery of the stable isotopes was calculated at 24 h post-dose according to the method described by Votruba(Reference Votruba, Zeddun and Schoeller18). Cumulative recovery of deuterium from labelled palmitic acid (%) over 24 h in the urine was used as a measure of dietary fat oxidation.
Statistical analysis
Data are presented as means and standard deviations unless otherwise indicated. Areas under the curve were calculated by using the trapezoid method. A Student's t test (two-tailed distribution) was carried out to determine possible differences between the conditions. Significance was defined as P < 0·05. All of the statistical analyses were executed with Statview SE Graphics™ software (version 4.5; Abacus Concepts Inc, Berkeley, CA, USA).
Results
Energy expenditure and substrate oxidation
The results on 24 h energy expenditure are shown in Table 2. Total energy expenditure, DIT, activity-induced energy expenditure and SMR were not different between the two conditions. The 24 h RQ and NPRQ were significantly lower in the three meals condition. When 24 h NPRQ was split into day (08.00 hours – 20.00 hours) and night (20.00 hours – 08.00 hours), night NPRQ was significantly lower in the three meals condition. This indicates that 24 h fat oxidation was significantly higher in the three meals condition and that 24 h carbohydrate oxidation was significantly lower in the three meals condition (Table 2). Concerning the macronutrient balances (expressed as g eaten – g oxidized), however, no significant differences in fat, carbohydrate and protein balance were observed (Table 2).
(Values are mean and standard deviations)

NPRQ, non-protein quotient; EI, energy intake; DIT, diet induced thermogenesis; EB, energy balance; AEE, activity-induced energy expenditure; SMR, sleeping metabolic rate; PAL, physical activity level.
* Student's t test, two-tailed distribution.
† For details of subjects and procedures, see Subjects and methods.
Cumulative recovery of deuterium-labelled palmitic acid (%) over 24 h was significantly lower in the three meals condition compared with the two meals condition (P < 0·02; Fig. 1), indicating that more fat from the breakfast was oxidised in the two meals condition than in the three meals condition.
Cumulative recovery (cum rec) of deuterium from deuterium labelled palmitic acid in the two meals condition (![]() ) and the three meals condition (■). * Mean value was significantly different (P < 0·05). For details of subjects and procedures, see Subjects and methods.
) and the three meals condition (■). * Mean value was significantly different (P < 0·05). For details of subjects and procedures, see Subjects and methods.

Satiety
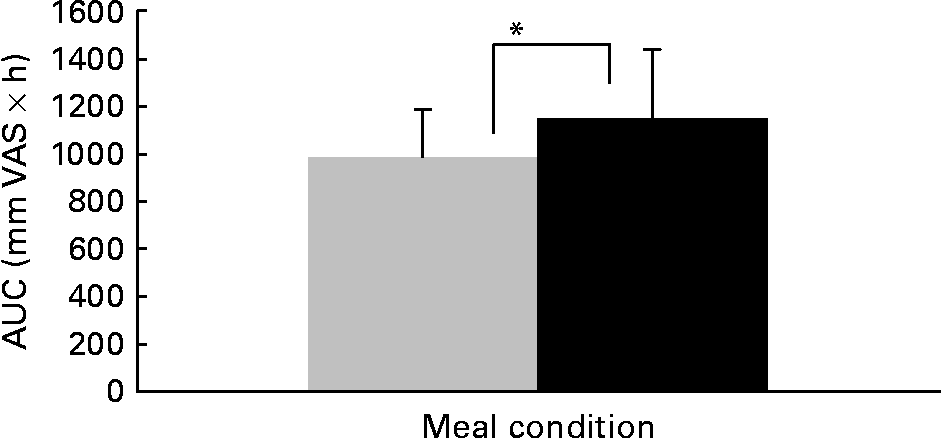
We present the VAS data on satiety; these data are representative for the scores on related questions, such as fullness, and inversely related to scores in hunger, desire to eat and prospective consumption. Satiety scores over the day are shown in Fig. 2. Between 07.50 hours and 12.00 hours, no differences in satiety scores between the three meals and two meals condition were observed. At 12.20, 13.15, 14.15 and 16.30 hours, satiety scores were significantly higher in the three meals condition than in the two meals condition (P < 0·05). After dinner and on the next morning no differences in satiety scores between the three meals and two meals condition were observed. Areas under the curves of satiety scores over 24 h were 1148 (sd 293) mm VAS × h in the three meals condition and 988 (sd 197) mm VAS × h in the two meals condition (P < 0·05, Fig. 3).
Satiety visual analogue scale (VAS) scores over 24 h in the two meals condition (–○–) and the three meals condition (–■–). * Mean values were significantly different (P < 0·05). For details of subjects and procedures, see Subjects and methods.
Area under the curve (AUC) of satiety visual analogue scale (VAS) scores over 24 h in the two meals condition (![]() ) and the three meals condition (■). * Mean value was significantly different (P < 0·05). For details of subjects and procedures, see Subjects and methods.
) and the three meals condition (■). * Mean value was significantly different (P < 0·05). For details of subjects and procedures, see Subjects and methods.
Discussion
The present study shows metabolic effects of postponing a meal in the postprandial state. Eating three meals compared with two meals, and therefore decreasing inter-meal intervals, decreased RQ and increased 24 h fat oxidation, but had no effects on 24 h energy expenditure, DIT, activity-induced energy expenditure and SMR. The same amount of energy divided over three meals compared with over two meals increased satiety feelings over 24 h. This was due to the smaller inter-meal interval, which resulted in significant differences in feelings of satiety during daytime. Cumulative recovery of deuterium-labelled palmitic acid (%) over 24 h, however, indicated that more dietary fat was oxidised when the inter-meal interval was larger. Dividing the same amount of energy over fewer meals, and therefore bigger meals, could theoretically lead to higher energy costs for the absorption, transport, conversion and storage of nutrients. Several meal frequency studies have observed no effect of meal frequency on 24 h energy expenditure(Reference Bellisle, McDevitt and Prentice19). Most studies, however, used a habituation period before testing the effect of the meal frequency on 24 h energy expenditure. A study with no habituation period by Verboeket-van de Venne & Westerterp observed no acute effects of eating two or seven meals per d on 24 h energy expenditure(Reference Verboeket-van de Venne and Westerterp20). In addition, previous studies have not observed effects of meal frequency on DIT(Reference Bellisle, McDevitt and Prentice19). In the present study, we measured the effect of meal frequency on DIT over 24 h, which is much longer than most previous studies that have measured DIT up to 6 h(Reference Bellisle, McDevitt and Prentice19). Nevertheless, we observed no differences in DIT when equal energy intake was divided over three or two meals.
NPRQ was higher in the two meals condition compared with the NPRQ in the three meals condition. Chapelot et al. found a similar effect(Reference Chapelot, Marmonier, Aubert, Allegre, Gausseres, Fantino and Louis-Sylvestre10). A 4-week habituation period in which subjects decreased their habitual meal frequency of four meals per d to three per d increased late night RQ. In the present study, most likely the increase in NPRQ, particularly during the night, in the two meals condition is a consequence of the relatively large meal that was consumed in the early evening. The large amount of carbohydrates and protein will preferentially be oxidised, because the body's capacity to store these macronutrients is limited. Fat is easily stored, since the body's capacity to store fat is practically unlimited. Carbohydrates are stored as glycogen in muscle and liver tissue. In the present study, bigger glycogen reserves may have been built up after dinner in the two meals condition. The bigger and therefore longer availability of oxidisable carbohydrates may have postponed the oxidation of fat, which resulted in the higher RQ over night in the two meals condition. We estimated that the physical activity level in the respiration chamber would be 1·5. We used this physical activity level to calculate energy intake. Their actual physical activity level was 1·38 in the two meals condition and 1·42 in the three meals condition. Therefore, during both conditions, the subjects were slightly in positive energy and fat balance. Despite this surplus of energy and fat, more fat was oxidised when energy intake was divided over three meals compared with over two meals. Based on the present results, it seems that spreading energy intake over the day in several meals may influence 24 h substrate oxidation beneficially. Westerterp-Plantenga et al. observed an inverse relationship between habitual meal frequency and the ability to compensate for a high fat preload(Reference Westerterp-Plantenga, Kovacs and Melanson21). Young lean men with a habitually low meal frequency had a higher energy intake after a high fat v. a high carbohydrate preload than young lean men with a habitually high meal frequency. Observations from the latter study and the present study indicate that a low meal frequency could be detrimental because it may reduce fat oxidation, due to the postponed fat oxidation after a high carbohydrate load, and promote fat storage due to the lower ability to compensate for fat intake. Lower cumulative recovery of deuterium labelled palmitic acid indicates that less fat from the breakfast was oxidised in the three meals condition than in the two meals condition. This means that a greater proportion of the fat from the breakfast is stored before oxidation in the three meals condition. In the two meals condition, the inter-meal interval is much larger and therefore the body uses more fat from the breakfast directly instead of storing and remobilising it.
The 24 h satiety as well as satiety during the afternoon was positively affected when a meal was eaten at lunchtime. Increasing meal frequency has previously been shown to sustain satiety(Reference Speechly and Buffenstein7). In the present study we observed an increase in 24 h satiety when the same amount of energy was eaten in three meals instead of two meals. This was obviously due to increased satiety after lunch in the three meals condition compared with decreased satiety after no lunch in the two meals condition. In order to sustain satiety, energy intake should take place during the day to synchronise in an optimal way with energy expenditure. Dinner containing 50 % or 70 % energy requirement appears not to cause differences in post-meal satiety. Mechanisms explaining the short-term effect of increased meal frequency on satiety may be related to substrate utilisation or satiety-related hormones. Increasing the number of meals per d has been shown to flatten fluctuations in plasma glucose and insulin concentrations(Reference Jenkins22). The pre-meal drop in plasma glucose concentrations, associated with feelings of hunger and meal initiation, may thus be prevented by a more frequent meal pattern. In a recent study, Jackson et al. studied the effect on gastric emptying of two isoenergetic meals 3 h apart or six isoenergetic meals fed hourly. Increased feeding frequency delayed the gastric emptying of a subsequent meal, but significant effects on post-meal appetite could not be demonstrated(Reference Jackson, Leahy, Jebb, Prentice, Coward and Bluck23). It can also be expected that meal frequency has an effect on gut-derived hormones such as glucagon-like peptide-1, ghrelin and peptide YY. More frequent exposure to nutrients may lead to a ‘building up’ of these hormones and subsequently have larger effects on hunger and satiety. Results of some of our recent studies suggest that effects of nutrients on plasma GLP-1 concentrations are more pronounced after multiple exposure compared with after one exposure(Reference Lejeune, Westerterp, Adam, Luscombe-Marsh and Westerterp-Plantenga24) (AJ Smeets, S Soenen, ND Luscombe-Marsh and MS Westerterp-Plantenga, unpublished results).
Most meal frequency studies have studied effects on metabolism and appetite over a longer period of time and have compared high meal frequency (four to nine meals/d) with low meal frequency (one to three meals/d). In the present study, subjects were in an equal state of energy balance and started the test days with the same breakfast. This gave us the opportunity to compare effects of the size of the inter-meal interval on energy expenditure, substrate oxidation on satiety, without differences in energy balance as a confounding factor.
In healthy, normal-weight women, decreasing the inter-meal interval sustains satiety, particularly over the day, and sustains fat oxidation, particularly over night. Increasing meal frequency, and thereby decreasing inter-meal frequency, in a state of energy balance may be a useful tool to prevent large fluctuations in feelings of satiety and substrate utilisation. We studied a group of healthy, normal-weight women, who had a small range in BMI. Overweight and obese subjects should be studied in the same protocol to make the findings applicable to a broader population. The observed higher total fat oxidation in the three meals condition and the higher dietary fat oxidation in the two meals condition suggest that the inter-meal interval may play a role in the utilisation of substrates from different sources (stored or meal derived). Future studies should give insight into the role of inter-meal intervals in dietary fat oxidation and stored fat oxidation in relation to overweight.
Acknowledgements
We gratefully acknowledge Krista Morren, Maartje Spetter, Loek Wouters and Paul Schoffelen for their assistance. The research was sponsored by Top Institute Food and Nutrition, Wageningen, The Netherlands. None of the authors had any financial or personal interest in any company or organisation sponsoring the research.


