


Morbidity and mortality derived from non-communicable diseases have been steadily increasing worldwide in the last years. Among them, the prevalence of non-alcoholic fatty liver disease (NAFLD) associated with obesity and diabetes has reached epidemic proportions (estimated around 25 % globally) not only in the adult population but, what is more worrying, also among children and adolescents in every region of the world(Reference Younossi, Koenig and Abdelatif1).
Recently, a multi-society Delphi consensus statement recommended renaming NAFLD to metabolic dysfunction-associated steatotic liver disease (MASLD)(Reference Rinella, Lazarus and Ratziu2), as it is the expression of an underlying multisystemic metabolic dysfunction that could involve cardiometabolic-related events and eventually lead to death. The global prevalence of fatty liver in type 2 diabetes patients scales up to 55 %, associated with higher serum activity of liver enzymes, steatohepatitis, cirrhosis, liver failure and/or hepatocellular carcinoma(Reference Younossi, Tacke and Arrese3). Similar data on the prevalence (50·7 %) have been described in the obese or overweight population(Reference Liu, Ayada and Zhang4).
Lifestyle and dietary habits may contribute to the establishment and progression of MASLD. Worldwide, dietary patterns have rapidly and extensively changed in the last 2 decades, with an increased consumption of meals with high contents of saturated fats and carbohydrates and/or of sucrose or fructose sweetened beverages(Reference Chhimwal, Patial and Padwad5). In particular, the intake of sugar-sweetened beverages (soft drinks, packed fruit juices, sport drinks, energy drinks, sweetened milk, etc.) has been increasing in parallel with the prevalence of obesity and type 2 diabetes(Reference Malik, Popkin and Bray6). According to an ELANS study, Argentina is situated in the upper ranks of sucrose consumption among Latin American countries(Reference Fisberg, Kovalskys and Gómez7). In addition, consumption of sugar-sweetened beverages has been shown to induce less satiety than sugar containing solid foods, leading to a higher increase in energy intake and weight gain(Reference Malik, Popkin and Bray6,Reference Malik and Hu8) . Recent evidence suggests that increased consumption of sugar-loaded soft drinks might have boosted the risk of NAFLD(Reference Chhimwal, Patial and Padwad5,Reference Malik and Hu8,Reference Chen, Wang and Li9) .
Induction of endoplasmic reticulum (ER) stress and a redox imbalance in addition to the deleterious effects of inflammatory cytokines(Reference Henkel10–Reference Spahis, Delvin and Borys12) have been assigned a role in the progression of a steatotic liver to steatohepatitis. In this regard, an hypothesis model of ‘multiple parallel-hits’ leading to inflammation and cell death (e.g. apoptosis), hallmarks of steatohepatitis, has been put forward(Reference Bessone, Razori and Roma13–Reference Tilg and Moschen15).
Currently, lifestyle interventions focusing on the reduction of caloric intake are widely used for the treatment of MASLD(Reference Santos-Laso, Gutiérrez-Larrañaga and Alonso-Peña16). However, it is still unclear how caloric restriction, which consists of a reduction in caloric consumption without malnutrition, is beneficial in terms of the molecular mechanisms involved in liver injury. Therefore, in the present study, we analysed the effect of the application of a 2-week caloric restriction on the steatohepatitis associated alterations such as oxidative stress, unfolded protein response, inflammation and apoptosis induced by an SRD. We also evaluated the metabolic impact of these dietary modifications.
Materials and methods
Chemicals and reagents
The standard chow used in this work is from Asociación de Cooperativas Argentinas (Buenos Aires, Argentina). Human insulin (Insuman®) was from Sanofi. Colorimetric commercial kits for the measurement of glucose from the insulin tolerance test (ITT) and TAG from liver tissue were acquired at Wiener lab. Serum biochemical parameters were measured using Siemens ADVIA 1650 autoanalyser (Siemens). 2-Thiobarbituric acid was from Merck. For tissue staining, hematoxylin and eosin, Masson trichrome and Oil Red o colourants were from Biopack. Optimal cutting temperature (OCT) compound Tissue-Tek was from Luis Marsán. Fluorescence mounting media with 4′,6-diamidino-2-phenylindole (DAPI) was from Vectashield. For the isolation of RNA, Quickzol® was acquired at Kalium Technologies. Moloney Murine Leukemia Virus (MMLV) reverse transcriptase was from Promega and DNAse I (RNAse free) was from Life Technologies. Quantitative PCR (qPCR) reagent Sso Advanced Universal mix with Sybr Green was from Bio-Rad Laboratories. Polyvinylidene difluoride membrane (Immobilon®) was from Merck Millipore. All the other reagents were of the highest quality available.
Animals and diets
Adult male Wistar rats (200–250 g) were obtained from the animal facility of the Facultad de Farmacia y Bioquímica, Universidad de Buenos Aires. Animals were housed in groups of three per cage and maintained under controlled conditions of humidity and temperature (21 ± 2°C, 40–70 % of relative humidity) under a 12/12 h light-dark cycle for an adaptation period of 1 week. Rats were allocated randomly into those fed a standard chow diet and either tap water (Control group) or 30 % sucrose in tap water (30 % w/v, sucrose-rich diet (SRD) group) ad libitum for 10 weeks. Then, SRD-treated rats were randomly distributed in two experimental subgroups. One of them continued receiving a standard chow diet with 30 % sucrose in tap water (SRD), while the other was switched back to tap water and regular chow (SRD group and caloric restriction group, SRD-CR), and treatments continued for two additional weeks, completing a total experimental period of 12 weeks for all groups. Caloric intake (calculated from the amount of solid food and the volume of liquid consumed) were monitored and recorded every 48 h, and animal weights were controlled weekly. The nutritional composition of the experimental commercial diets is described in Table 1. Calories from the diet were calculated as follows: every 100 g of solid chow contains 96 kcal from proteins, 54 kcal of fat and 160 kcal of carbohydrates. For the SRD fed group, an additional 12 kcal from the 30 % w/v sucrose in the water is added.
Nutritional composition of experimental diets
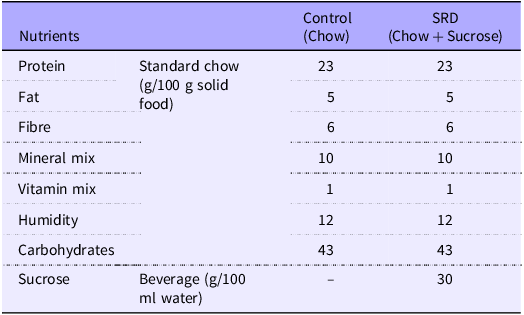
SRD, sucrose-rich diet.
At the end of the experiment, animals were assigned to two protocols: fifteen rats (five per experimental group) received an intraperitoneal insulin injection 10 min before sacrifice to assess hepatic hormonal signalling (for a detailed explanation for AKT activity determination, see 2·4), while twenty rats (six controls, seven SRD and seven SRD-CR) were used for the other experimental analyses.
In our experimental setting, animals develop systemic insulin resistance (IR) around the 7th week of SRD administration. Animals that did not develop IR (by an insulin tolerance test, ITT, see 2·2) at this timepoint were excluded from the experiment.
All protocols were performed according to the European Union guidelines for handling and care of laboratory animals (Directive 2010/63/UE), in accordance with ARRIVE guidelines, and all the procedures were approved by the Animal Care and Use Committee from Facultad de Ciencias Médicas, Universidad de Buenos Aires.
Insulin tolerance test
During the 7th and 12th week of treatment, animals were fasted for 4 h before the administration of 1 IU/kg (i.p.) of human insulin, and blood was drawn from the tail vein every 5 min for up to 25 min. The slope of the curve of glucose concentration as a function of time (KITT) and the AUC were then calculated. Serum glucose levels were determined by a GOD/POD colorimetric method with a commercial kit.
Tissue and serum samples
At the end of the experimental period, animals were fasted for 4 h and sacrificed. Trunk blood and liver tissues were collected. Serum was obtained and immediately frozen at −70°C until processed. Livers were also conserved at −70°C for further analysis.
Insulin signalling in the liver
To evaluate the insulin signalling pathway in the liver, fifteen animals (five per experimental group) received insulin (1 IU/kg, i.p.) 10 min before sacrifice. The activity of AKT, assessed by its capacity to phosphorylate specific substrate proteins, by western blotting, was used as an indirect indicator of insulin action.
Systemic biochemical measurements
Serum parameters, such as glucose, TAG, non-esterified fatty acids, total cholesterol, urea, creatinine, albumin, total proteins levels and the activity of liver enzymes (aspartate transaminase and alanine transaminase), were measured using a Siemens ADVIA 1650 autoanalyser according to the manufacturer instructions.
Hepatic TAG content
Total tissue lipid content was determined as described by Oliveira et al. (Reference Oliveira, Santos and Barbosa-da-Silva17) with minor modifications. Briefly, 50 mg of tissue were homogenised in 1 ml of isopropanol and then centrifuged at 2000 g for 10 min at 4°C. 30 µl of the supernatant was evaporated, and the solid residue was then resuspended in 10 µl of PBS 1X. TAG levels were assessed with a commercial kit using a colorimetric method according to the manufacturer instructions.
Lipid peroxide levels
Lipid peroxide levels in the liver were determined by measuring thiobarbituric acid reactive species as previously described(Reference Mercau, Calanni and Aranda18). Liver tissue was homogenised in 500 μl 15 mmol/l KH2PO4/K2PO4 and 60 mmol/l KCl pH 7·4. Homogenates were centrifuged at 1000 g for 10 min at 4°C, and the reaction was performed in 50 μl aliquots from the supernatant.
Histological analysis and immunofluorescence
To analyse histopathological modifications of the tissues, liver fragments were fixated in 10 % buffer-formalin overnight. Tissue samples were dehydrated, cleared in xylene and embedded in paraffin. Serial longitudinal sections 5 µm thick were obtained using a microtome (Leica, Leica Microsystems). For the histological analysis, liver sections stained with either hematoxylin and eosin or Masson trichrome were blindly assessed by a pathologist who graded the samples according to the nonalcoholic fatty liver disease activity score (online Supplementary Table S1)(Reference Kleiner, Brunt and Van Natta19).
To visualise lipid accumulation an Oil Red O staining of the tissues was performed. Briefly, calcium-formalin fixated liver fragments were embedded in Tissue-Tek OCT Compound and sliced in 8 µm sections using a cryostat (Leica, Leica Microsystems). Oil Red O staining was performed according to manufacturer instructions. In both cases, images were digitally captured with a light microscope (Eclipse E400, Nikon) using a 6-V halogen lamp (20 W; equipped with a stabilised light source) and a camera (Coolpix S10, Nikon). For quantitative analysis of Oil Red O staining, six random field/slide were taken from six liver samples from each group at a 200× magnification. The total area of red pixels on the Oil Red O-stained tissue section was determined by using the Image J software (version 1.53 USA, National Institutes of Health, Bethesda, Maryland, USA). Data are expressed as mean ± sem of percentage of positive area respect to control samples.
Immunofluorescence was performed on cryostat sections. Briefly, tissue permeabilization was induced by incubating the sections with 0·1 % Triton X-100 in 1x PBS. After three washes with 1x PBS sections were incubated for 1 h in a blocking solution (2 % fetal bovine serum) and then overnight at 4°C in a humid chamber with anti 3-nitrotyrosine antibody in blocking solution. For secondary detection, sections were incubated for 2 h at room temperature in a dark chamber with fluorescent-dye conjugated secondary antibodies (Cy3-goat anti mouse). After several washes with 1x PBS, slides were mounted with fluorescence mounting media with DAPI and images were acquired in a confocal fluorescence microscope (FV1000 Olympus) through an incorporated digital camera (3CCD, Sony). Comparative digital images from different samples were obtained using identical exposure time, brightness and contrast settings. NIH ImageJ Software was used to quantify the fluorescence intensity in twenty-five random fields per treatment.
RNA isolation and quantitative real time-PCR assay
Total RNA was obtained from 50 mg of liver tissue using Quickzol® reagent according to the manufacturer’s instructions. Reverse transcription was performed using MMLV reverse transcriptase as previously described(Reference Repetto, Wiszniewski and Bonelli20). Amplifications by qPCR were carried out in a Rotor-Gene 6000 Corbett Life Science Real Time Thermal Cycler (Corbett Research) and quantified with the Rotor Gene 6000 Series Software (version 1.7 Build 40, Hilden). Primer oligonucleotide sequences used in this study are listed as supplementary information (online Supplementary Table S2). Gene expression levels were normalised to Actb (β-Actin) as an internal control, using the efficiency calibrated method to relative quantification(Reference Pfaffl21).
Immunoblot analysis
Tissues were homogenised in RIPA buffer and 80 µg of proteins were heated for 5 min at 95°C in sodium dodecyl sulfate–polyacrylamide gel electrophoresis (SDS-PAGE) loading buffer and then subjected to SDS-PAGE on 10 % or 12 % gels. After electrophoresis, proteins were transferred to polyvinylidene difluoride membranes for 30 min at 15 V in a Trans-blot sd system (Bio-Rad Laboratories Inc.) in 25 mM Tris–HCl, 192 mM glycine and 20 % methanol. Polyvinylidene difluoride membranes were blocked in 20 mmol/l Tris–HCl (pH 7·4), 137 mmol/l NaCl, 0·1 % Tween 20 and 5 % non-fat milk for 60 min at room temperature and then incubated overnight with the indicated dilution of the primary antibody at 4°C. After several washes, membranes were incubated with the adequate secondary antibody. Specific bands were visualised by chemiluminescence, and images were obtained using the GeneGenome XRQ. A list of the antibodies used is provided as a supplementary table (online Supplementary Table S3). The intensity of the chemiluminescent bands was quantified using FluorChem software (Protein Simple).
Statistical analysis
All data were tested for normal or, when necessary, log-normal distribution using the Shapiro–Wilk test. When normally distributed, data are presented as mean ± standard error of the mean (sem). Otherwise, the median and range are given. Differences between groups were analysed by one-way ANOVA or Kruskal–Wallis’s test, as appropriate. For the ITT, statistical difference was calculated using a two-way ANOVA. When the ANOVA yielded significant differences (P < 0·05), post hoc comparisons (Tukey’s or Dunn’s test) were made to determine the statistical difference between groups. All calculations were performed using Prism 8 for Windows (GraphPad Software).
Results
A lower caloric intake during the last 2 weeks of treatment in sucrose-rich diet-caloric restriction animals is not associated with peripheral changes in insulin resistance
Administration of 30 % sucrose in the drinking water (SRD) to adult male rats is associated with an increase in body weight (from the 3rd week on) and a lower intake of solid food (Table 2, Fig. 1(a) and (b)). This represents a 42 % increase in total caloric intake (at the expense of the sucrose solution) in SRD-treated rats.
Dietary intake (Mean values with their standard errors)
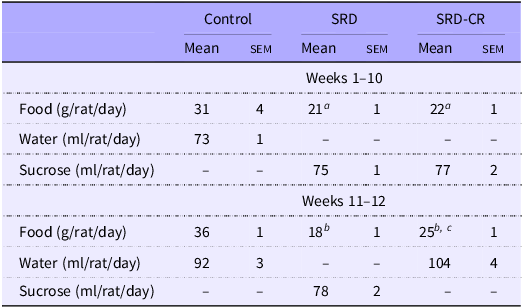
Data are expressed as mean ± sem aP < 0·05; bP < 0·001 v. control and cP < 0·01 v. SRD as analysed by ANOVA followed by Tukey’s post-test.
CR, SRD, sucrose-rich diet with caloric restriction.
Caloric restriction for 2 weeks has no effect on systemic metabolic syndrome parameters in Wistar rats. (a). Weekly weight gain for the control, sucrose rich diet (SRD) and SRD-calorie restriction (SRD-CR) groups. (b) Total caloric intake (from solid food plus 30 % sucrose in water) measured during the first 10 weeks of the dietary intervention is shown as stacked values. (c) Caloric intake during the final 2 weeks of the experimental period is shown as stacked values for sucrose and food caloric intake. (d) Body weights at the conclusion of the treatments. (e) Serum glucose levels were determined in fasted animals (4 h) and after injecting insulin (1 IU/kg i.p.) during the 12th week. The KITT is shown as an insert and the area under the curve at the side. Data are shown as mean ± sem, n 6 – 7 per group. For panel A (until the 10th week) and B, statistical difference was obtained by student’s t test. ***P < 0·001 and $$ P < 0·01 v. Control. For panel A (weeks 11–12), panel C (total caloric intake and food intake), panel D and E (area under the curve), statistical significance was obtained by one way’s ANOVA followed by Tukey’s post-test. Statistical difference for the ITT curves was obtained using two-way ANOVA followed by Tukey’s post-test. $$ P < 0·01 v. control standard chow calories; *P < 0·05, **P < 0·01 and ***P < 0·001 v. Control group; ## P < 0·01 v. SRD group.
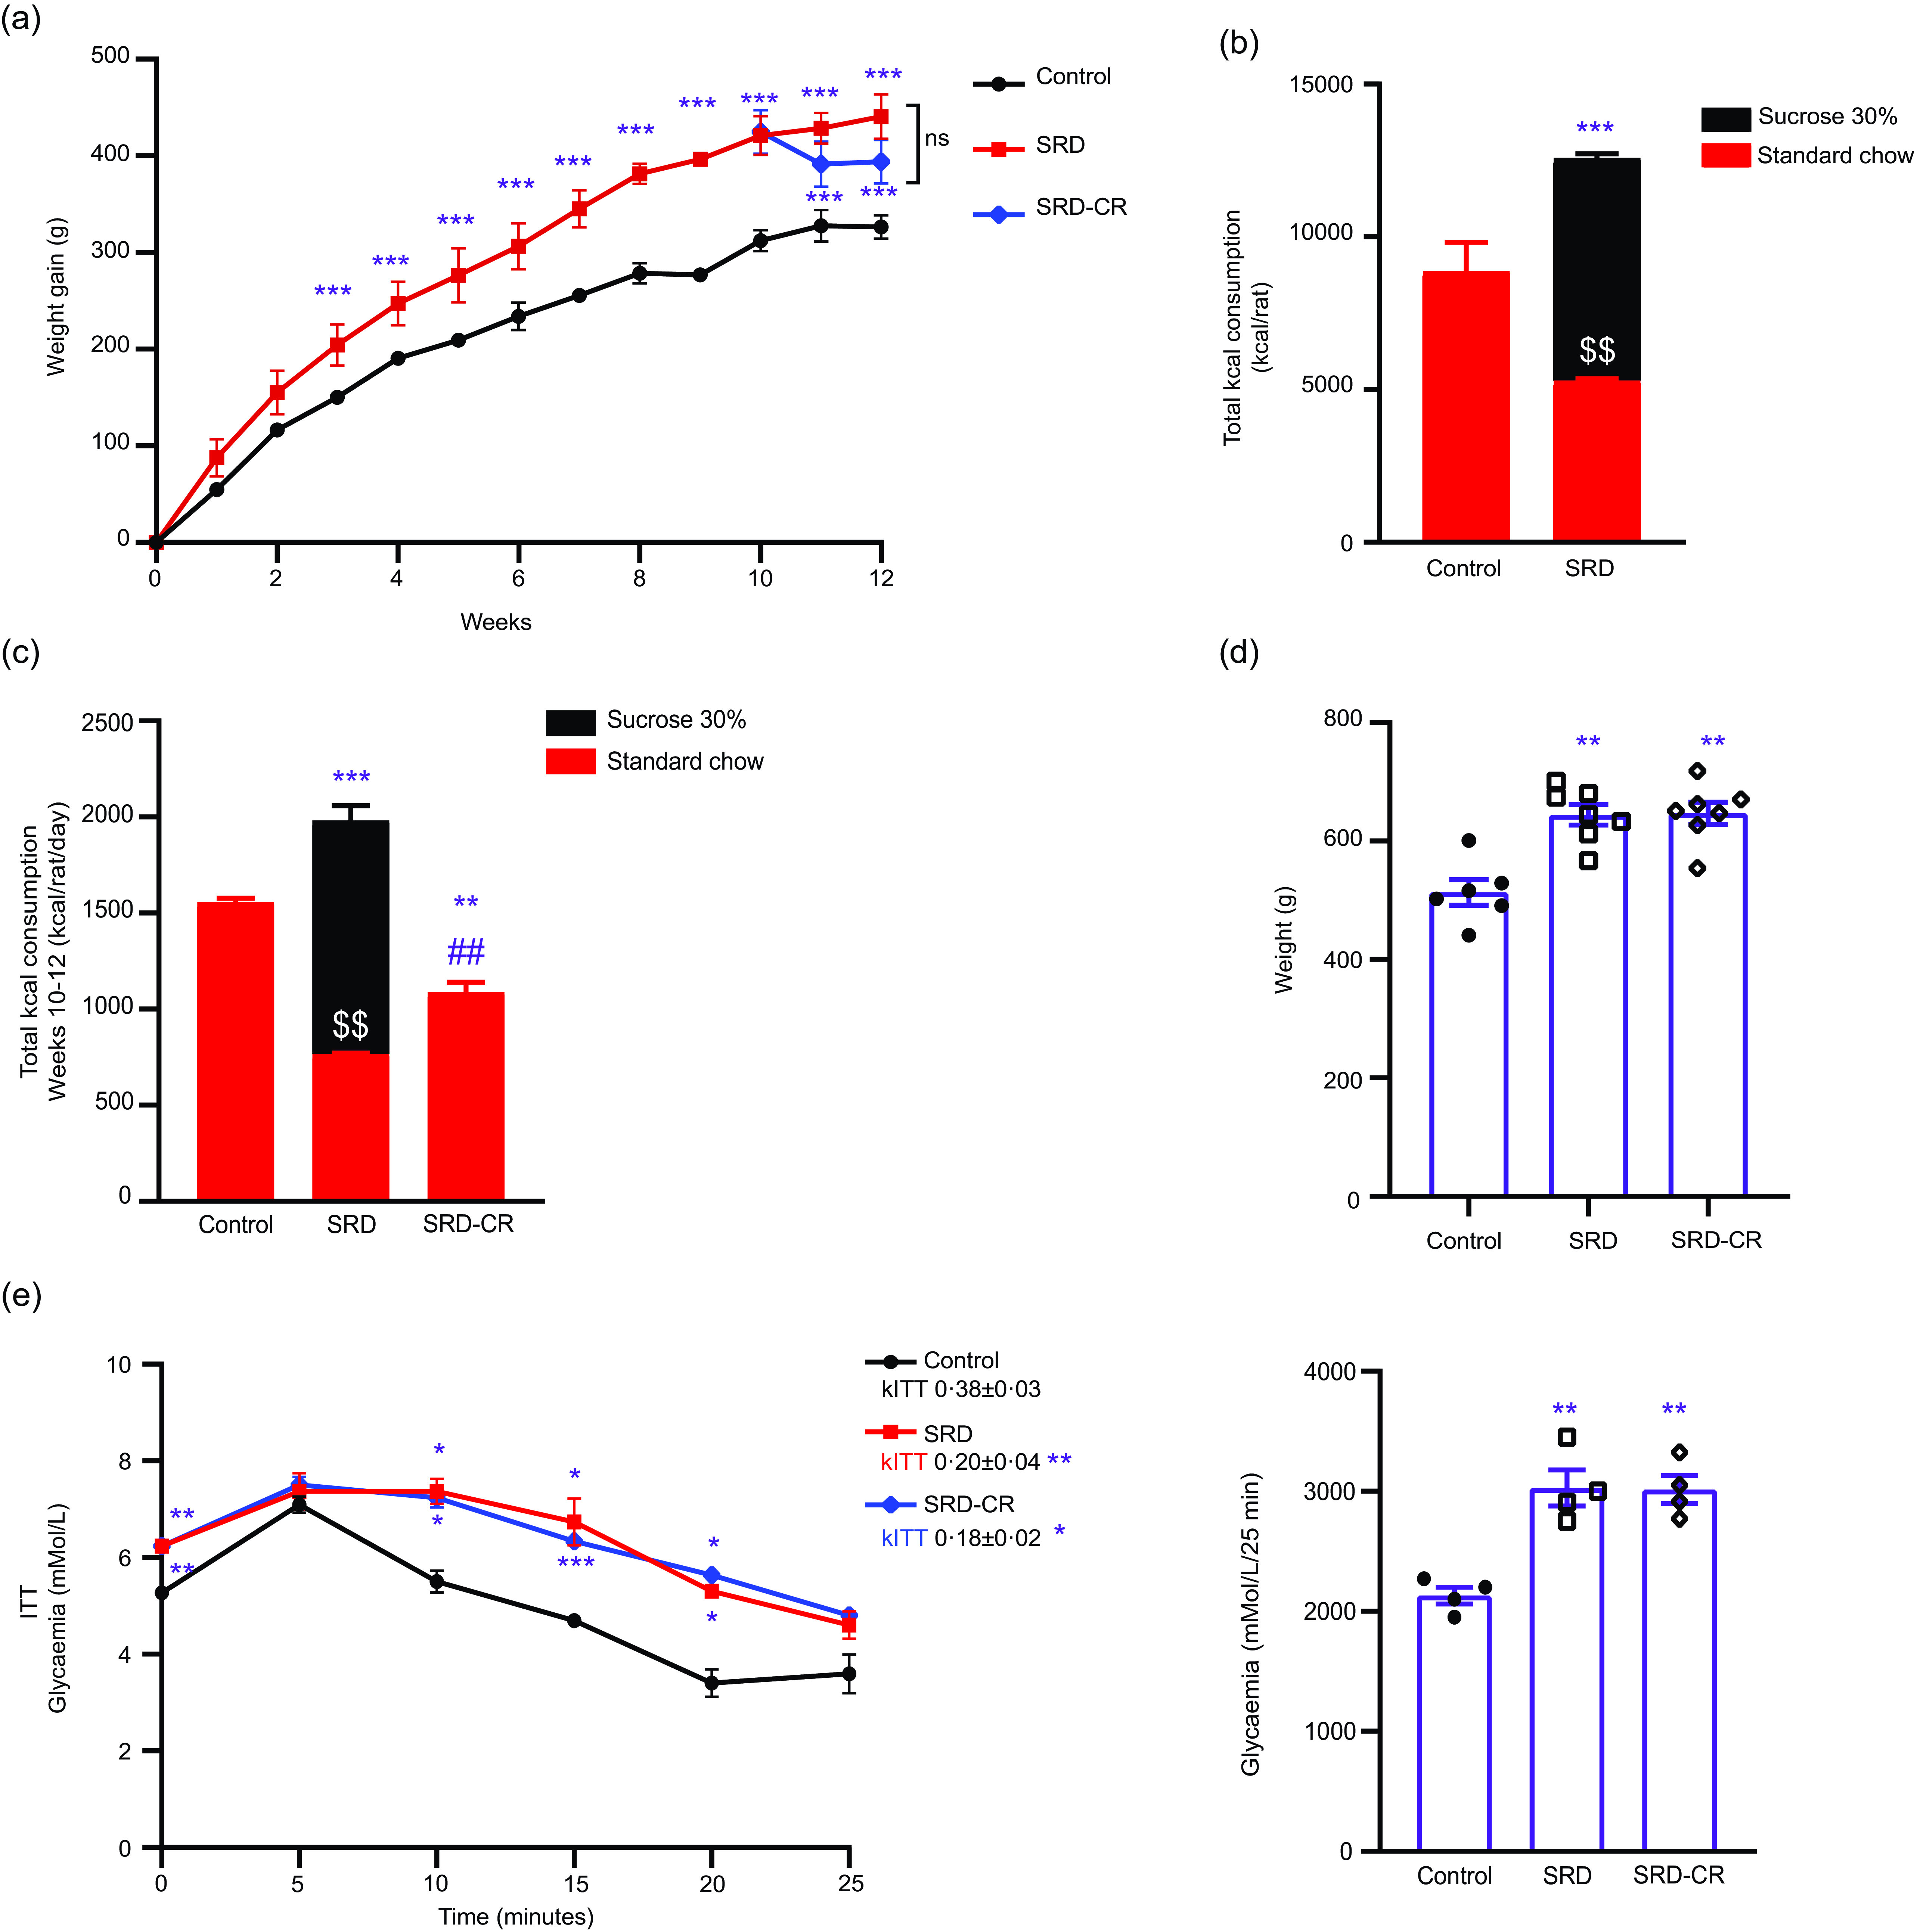
The SRD-CR subgroup showed a lower total caloric intake for the last 2 weeks of treatment, despite an increased consumption of solid food, but no significant differences in final weight (nor in weight gain) compared with the SRD-group (Table 2, Fig. 1(a), (c) and (d)). Results from the ITT performed during the last week of treatment indicate that animals from both SRD subgroups (including those animals under caloric restriction), presented lower KITT values and higher AUC values, compared with control animals, as shown in Fig. 1(e).
At the end of the experimental period, fasting serum glucose and NEFA levels were higher in animals from both SRD subgroups (Table 3). Although elevated serum levels of TAG were detected in both SRD subgroups, a significant decrease in this parameter was observed in SRD-CR v. SRD animals. No differences in serum biomarkers of liver function and injury (alanine transaminase, aspartate transaminase, albumin and total protein levels) were observed. Notably, while uremia decreased significantly in SRD-treated animals and a normalisation of this parameter was observed in the caloric restriction group while creatinine levels remained unchanged (Table 3).
Serum biochemical parameters of rats fed a control (C), sucrose-rich diet (SRD) or sucrose-rich diet and caloric restriction (SRD-CR) (Mean values with their standard errors)
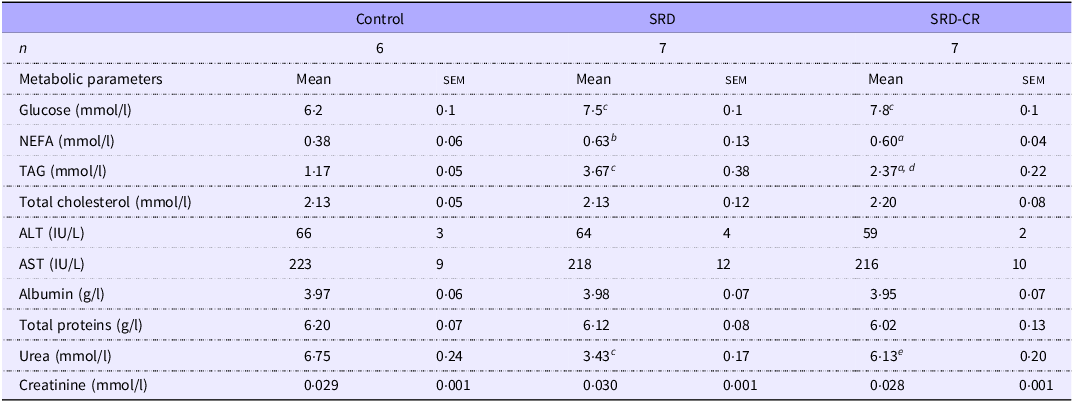
NEFA , non-esterified fatty acids; ALT, alanine aminotransferase; AST , aspartate aminotransferase. Data are expressed as mean ± sem a P < 0·05; b P < 0·01; c P < 0·001 v. control and d P < 0·01; e P < 0·001 v. SRD as analysed by ANOVA followed by Tukey’s post-test.
No changes in liver morphology or on the nonalcoholic fatty liver disease activity score were detected after switching back to a regular diet for the last 2 weeks of treatment
A normal colour and appearance were observed upon macroscopic examination of livers from control animals, while a more yellowish-brown and nutmeg aspect, suggesting fat infiltration, were evidenced in those from the SRD and SRD-CR groups (Fig. 2(a)). Accordingly, hematoxylin and eosin staining showed ballooned hepatocytes and lipid ghost vacuoles (Fig. 2(b)–(c)). Histological evaluation yielded a nonalcoholic fatty liver disease activity score of 5 for these animals reflecting the degree of ballooning and steatosis, with no changes in lobular infiltration (Fig. 2(d)–(f) and online Supplementary Fig. S1A). Consistent with the steatosis grade assigned according to the Oil Red O staining, we also found an increase in the TAG content of the livers (Fig. 2(g) and online Supplementary S1B). No evidence of fibrosis could be detected after Masson’s trichrome staining (online Supplementary Fig. S1C and S1D), and no changes in the mRNA levels of Acta2 (α-SMA, a marker of hepatic stellate cell activation, online Supplementary Fig. S1E) or Col1a1 (alpha-1 type I collagen online Supplementary Fig. S1F) were detected in the SRD and SRD-CR groups.
Caloric restriction does not impact SRD induced histological liver injury. (a) Representative photographs of the organs were obtained from each experimental group. Liver tissue sections 5 or 8 µm thick, were stained with either (b) Hematoxylin & Eosin or Oil Red O and observed at 200× magnification (c). A scale bar of 50 µm is provided, and a 2× magnified view of a selected area is highlighted inside a black box below. (d)–(f). The NAFLD Activity Score (NAS) with its different components was calculated based on Kleiner et al (Reference Kleiner, Brunt and Van Natta19). (g). Hepatic TAG content was measured. Data are shown as mean ± sem, n 6 – 7 per group. For panels D-F statistical significance was determined by Kruskal–Wallis test followed by Dunn’s multiple comparison test **P < 0·01 v. Control group. For panel G, statistical significance was determined by one way’s ANOVA followed by Tukey’s post-test, ***P < 0·001 v. Control group. NAFLD, non-alcoholic fatty liver disease; NAS, nonalcoholic fatty liver disease activity score; SRD, sucrose-rich diet.

Caloric restriction attenuates oxidative stress and inflammation in the liver of sucrose-rich diet-treated animals
A higher expression level of mitochondrial superoxide dismutase-2, cytosolic catalase, both antioxidant enzymes and carboxymethyl lysine (CML, a glycoxidation product) were detected in both SRD and SRD-CR groups as compared with the control group (Fig. 3(a)), Nonetheless, CR treatment blocked the increase in the levels of lipid peroxidation products, assessed as thiobarbituric reactive substances, and in 3-nitrotyrosine-modified proteins in the liver (Fig. 3(b) and (c).
Applying a caloric restriction protocol attenuates oxidative stress and inflammation markers. (a) Quantification of protein levels of catalase, superoxide dismutase-2 (SOD2) and CML-modified proteins were detected. Representative western blots are shown. (b) Lipid peroxidation was evaluated by measuring thiobarbituric acid reactive substances (TBARS). (c) Immunofluorescence staining and quantification were performed for proteins modified by 3-nitrotyrosine observed at 400× magnification. Data are displayed on a logarithmic scale and the median and rank are plotted. (d) and (e). S100a9 and M1 markers (Il1b and Nos2) mRNA were measured by qPCR. (f) p-NFkB (phospo-p65) protein levels were measured, and a representative western blot is shown. (g) mRNA levels of M2 markers (Il10 and Mrc1) were assessed by qPCR. For panel C, statistical differences were determined by Kruskal–Wallis followed by Dunn’s multiple comparisons test, **P < 0·01 v. Control and ## P < 0·01 v. SRD group. For remaining panels, data are shown as mean ± sem, n 6 – 7 per group. Statistical significance was obtained by one way’s ANOVA followed by Tukey’s post-test. *P < 0·05, **P < 0·01 and ***P < 0·001 v. Control group; ## P < 0·01 and ### P < 0·001 v. SRD group. SRD, sucrose-rich diet.
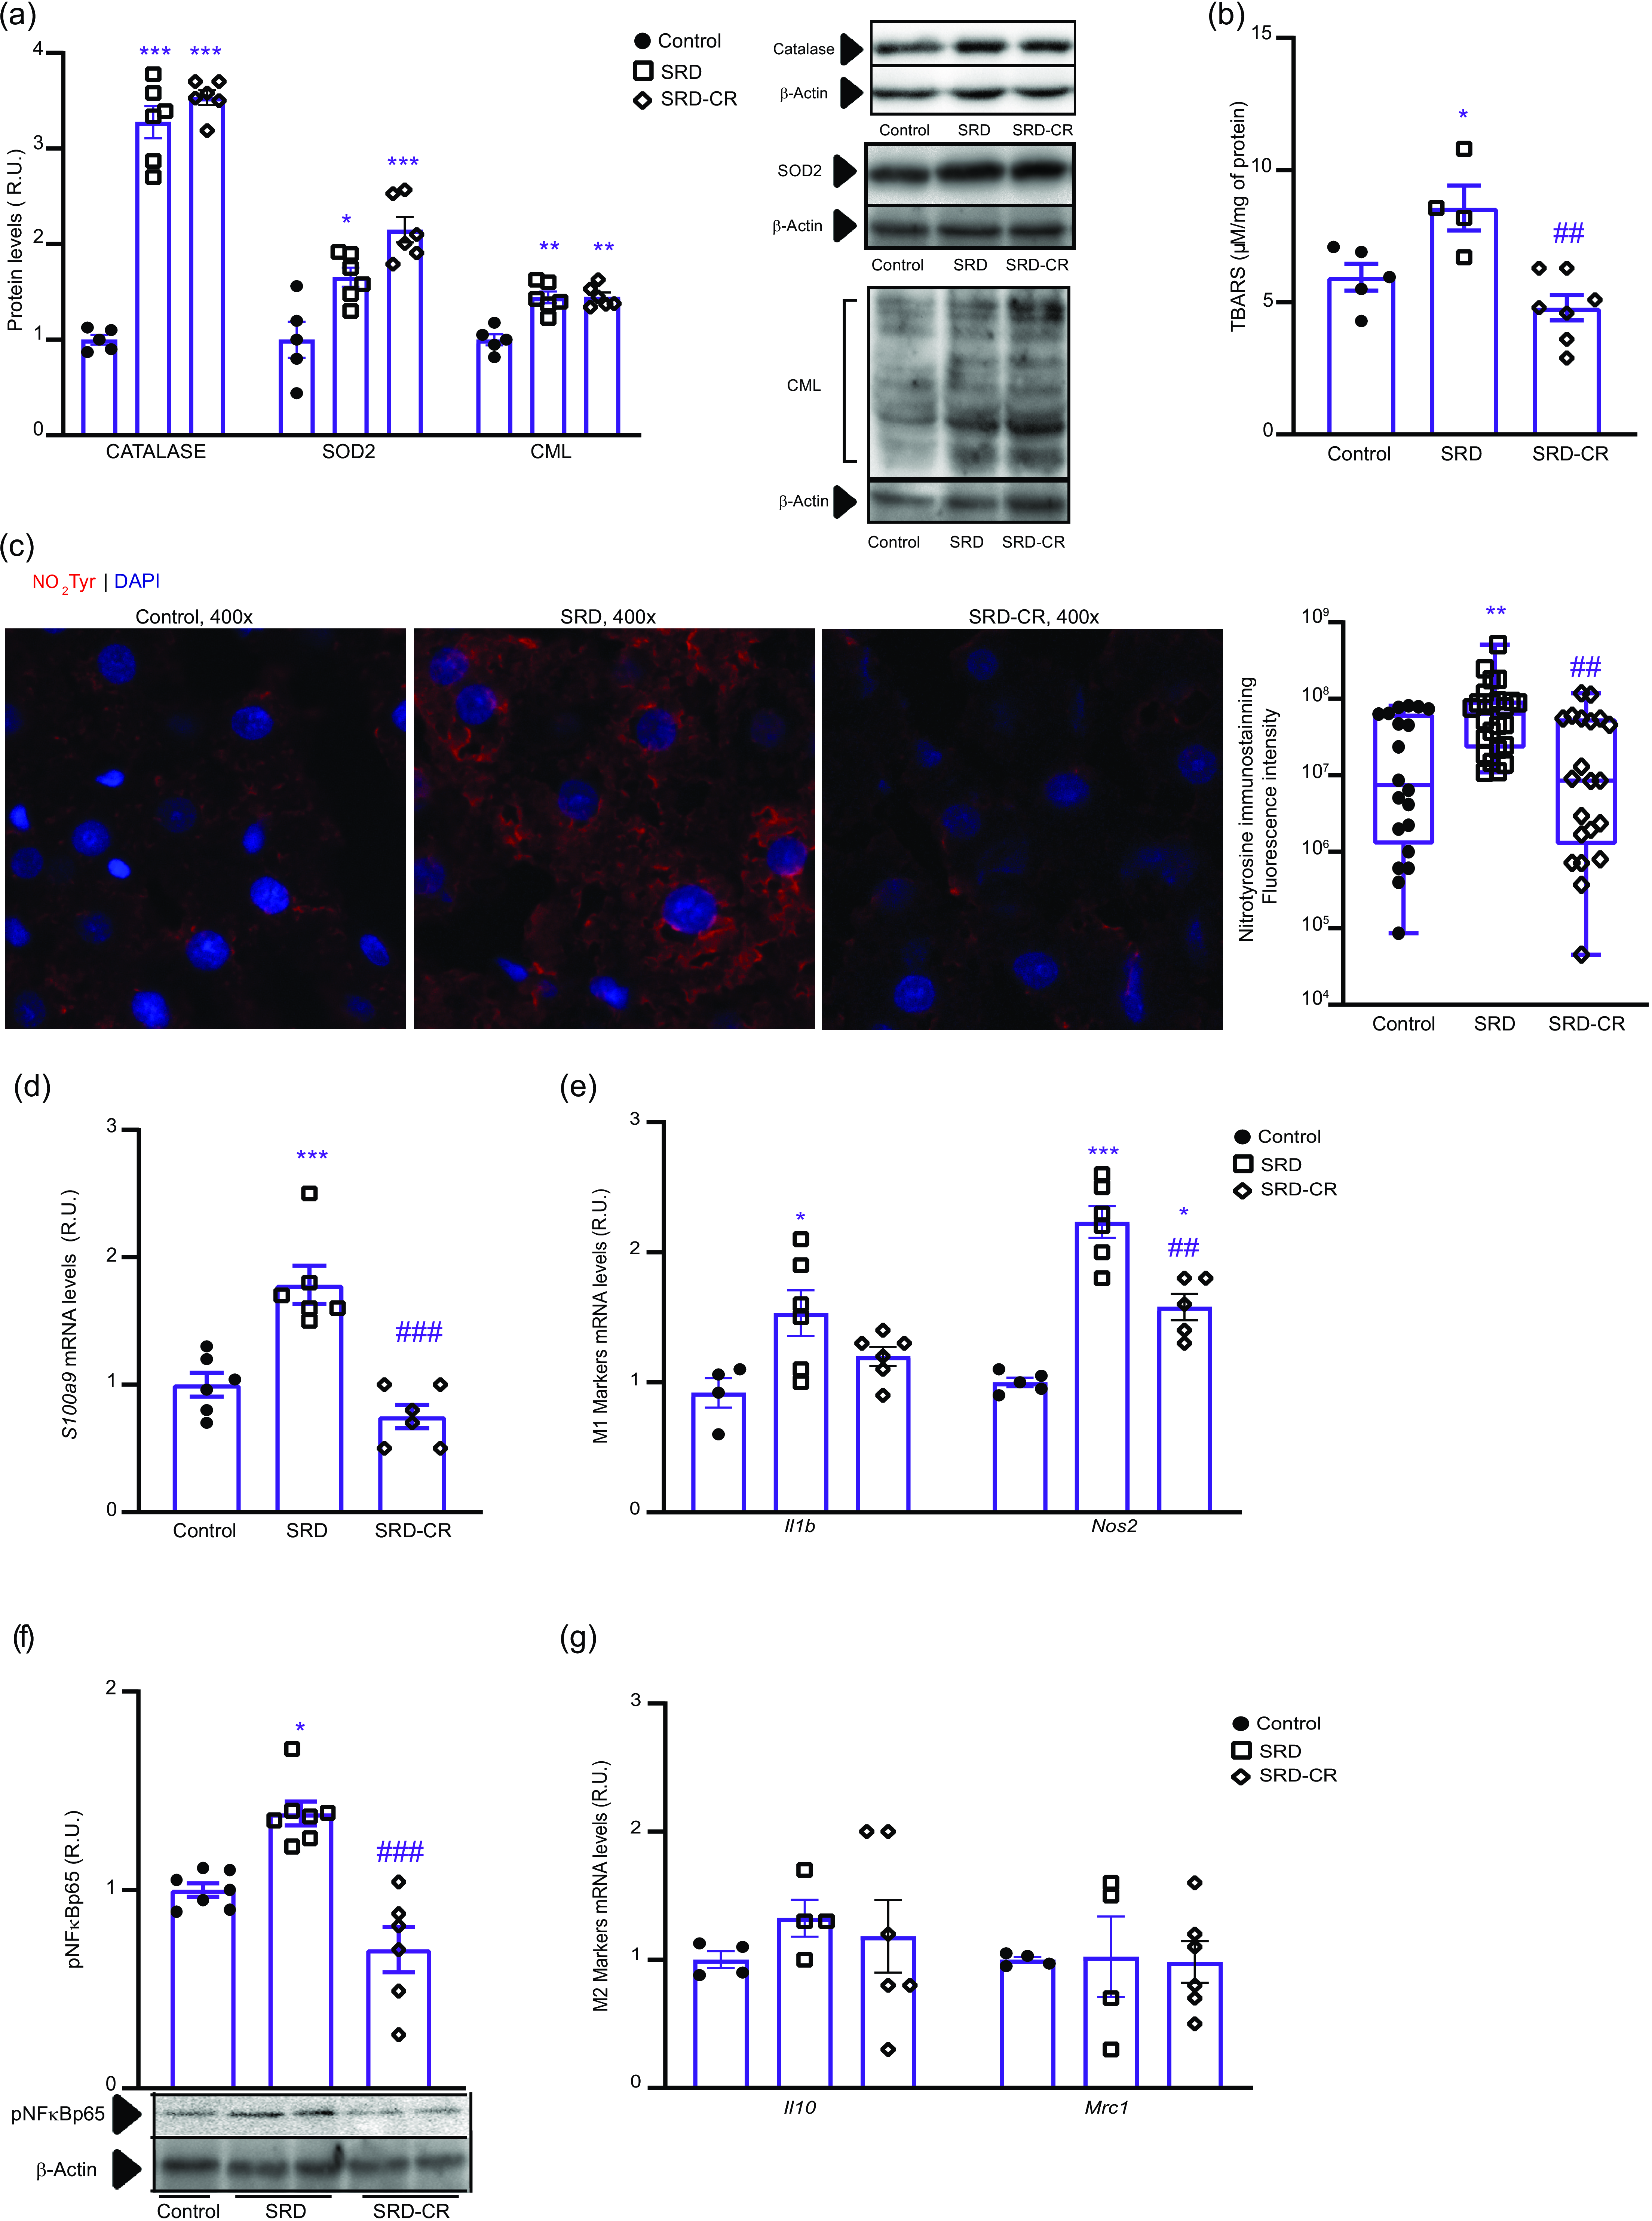
SRD or SRD-CR treatments did not result in immune cell infiltration into the liver, as assessed by histological analysis (online Supplementary Fig. S1A). In addition, neither the expression levels of IBA1 (a monocyte cell marker) nor those of Cle4cf (a Kupffer cells marker, data not shown) show any difference between treatments (online Supplementary Fig. S1G).
In our experiments, SRD administration induces the expression of proinflammatory molecules such as Il1b and NOS2 (M1 markers) or phosphorylated NFkB p65 (p-NFkB), while no changes were observed in the levels of Il10 or Mrc1 (M2 markers). Animals from the SRD-CR group showed no significant differences in the expression levels of Il1b compared with control, while a significant decrease in NOS2 mRNA and p-NFkB proteins levels (as compared to the SRD group) was observed (Fig. 3(e)–(g)).
Caloric restriction attenuates endoplasmic reticulum stress and apoptosis in the liver
Our results show the induction of ER stress and the activation of the unfolded protein response (UPR) depicted by an increase in the protein levels of the chaperone GRP78 (HSPA5) in both SRD and SRD-CR groups (Fig. 4(a)). However, the expression levels of UPR target genes, such as p58IPK (Dnajc3) and CHOP (Ddit3), were significantly reduced in the SRD-CR group compared with SRD animals (Fig. 4(b)).
Endoplasmic reticulum stress and apoptosis markers in the liver tissue attenuated by a caloric restriction protocol. (a) GRP78 protein levels were assessed using western blot analysis. (b) mRNA expression of unfolded protein response (UPR)-related proteins P58ip k and Chop were measured by qPCR. Apoptosis was evaluated by measuring the protein levels of cleaved Caspase-3 p17 (c) and the Bax/Bcl2 mRNA apoptotic index (d). Data are shown as mean ± sem, n 6 – 7 per group. Statistical significance was obtained by one way’s ANOVA followed by Tukey’s post-test. *P < 0·05 and ***P < 0·001 v. Control group; # P < 0·05, ## P < 0·01 and ### P < 0·001 v. SRD group.
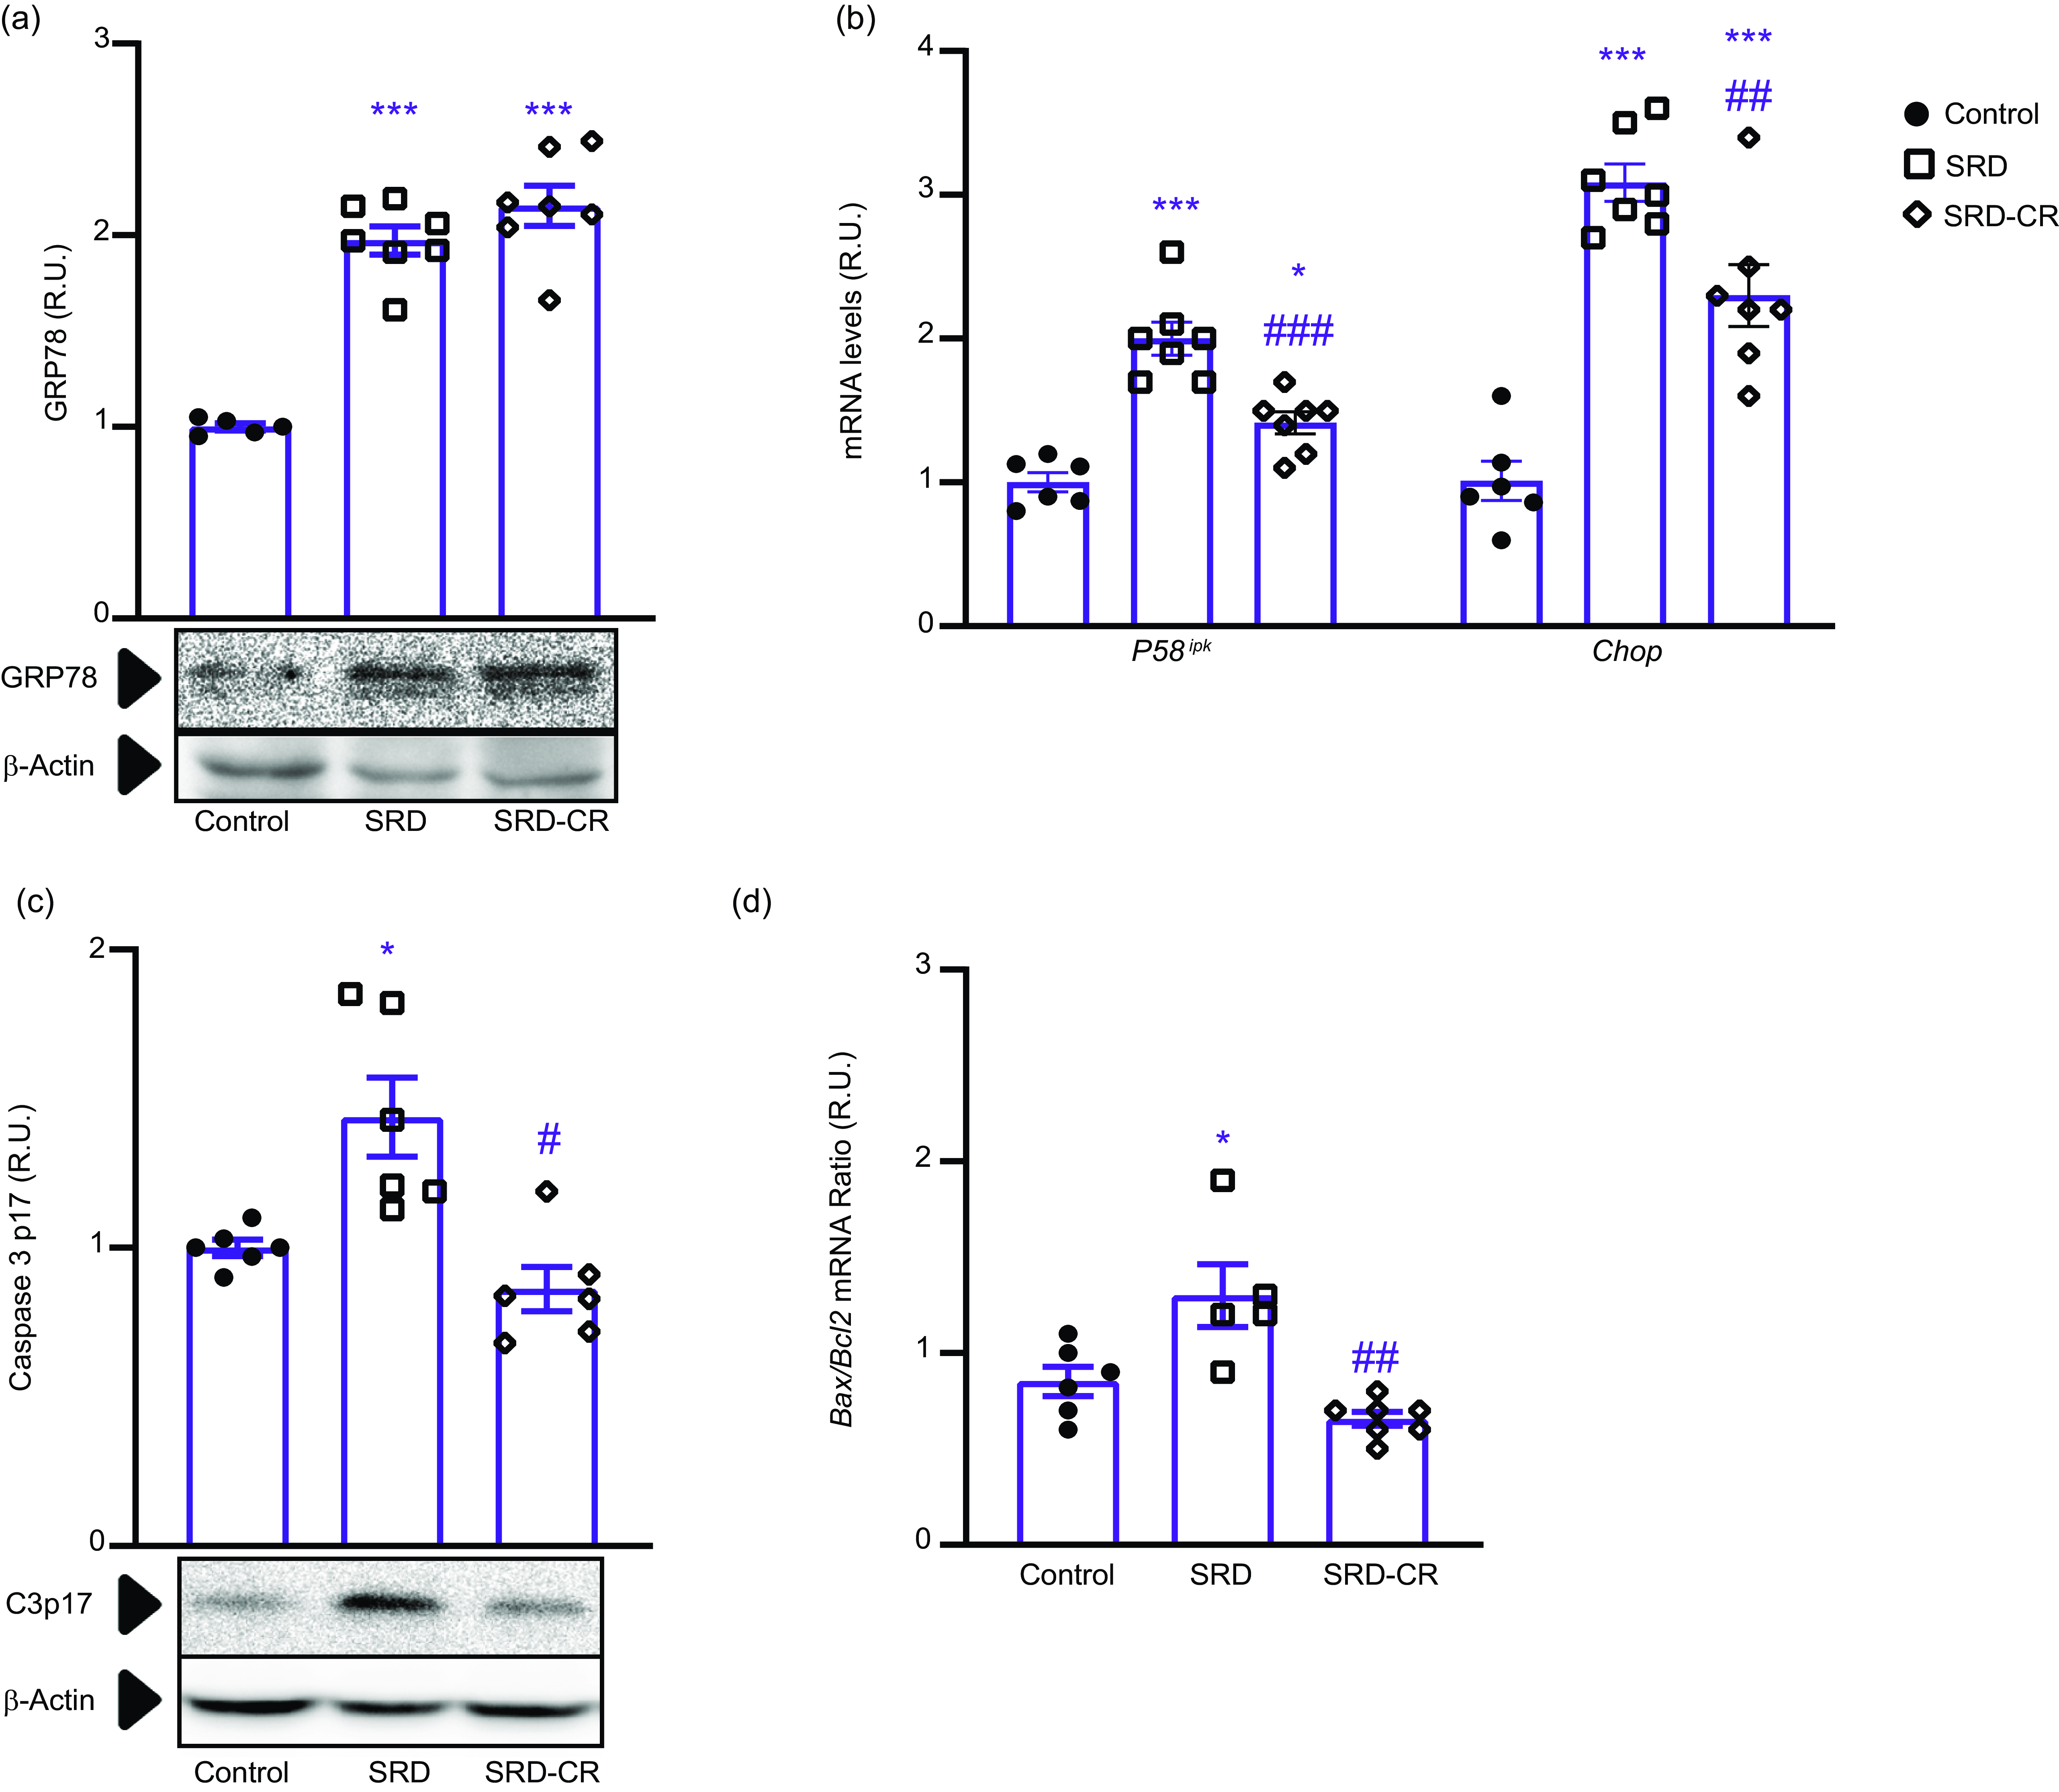
Induction of cell death by apoptosis was demonstrated by the increase in the expression levels of cleaved caspase 3 and an elevated Bax/Bcl2 mRNA ratio (apoptotic index) in the SRD group that were reduced in SRD-CR group (Fig. 4(c) and (d)).
Caloric restriction modulates hepatic insulin signalling, lipogenesis and fatty acid oxidation when applied to sucrose-rich diet fed rats
Caloric restriction after SRD treatment had significant effects on hormonal signalling and carbohydrate metabolism in the liver, as indicated by an increase in the phosphorylation levels of AKT target proteins, and a decrease in the expression levels of PEPCK (the rate-limiting enzyme in gluconeogenesis), as compared with the SRD group (Fig. 5(a) and (b)). Although higher mRNA levels of the CD36 fatty acid (FA) receptor were detected in SRD- and SRD-CR-treated animals (v. Control), the increase in the expression of the lipogenic transcription factor ChREBP (Mlxipl) and the enzymes acetyl-CoA carboxylase-1 ( Acc1) and fatty acid synthase (FAS) in SRD group was reverted by 2 weeks of caloric restriction (as measured by qPCR, Fig. 5(c) and by Western blot, Fig. 5(d)).
Switching to a standard diet ameliorates hepatic insulin resistance and enhances fatty acid oxidation. (a) AKT activity was measured by western blot, evaluating the protein’s ability to phosphorylate target proteins in liver homogenates collected 10 min after intraperitoneal administration of 1 IU/kg of insulin to rats. (b) Phosphoenolpyruvate carboxykinase (PEPCK) protein levels by western blot. (c) mRNA levels of key components of the lipogenic pathway Cd36, Chrebp and Acc1 were quantified by qPCR. (d) Protein levels of the lipogenic enzyme fatty acid synthase (FAS) were determined by western blotting. (e) mRNA levels of fatty acid oxidation-related genes, including Ppar alpha, Cpt1 alpha and Acox1 alpha, were measured by qPCR. Data are shown as mean ± sem, n 5–7 per group. Statistical significance was obtained by one way’s ANOVA followed by Tukey’s post-test. *P < 0·05 and ***P < 0·001 v. Control group; # P < 0·05, ## P < 0·01 and ### P < 0·001 v. SRD group.
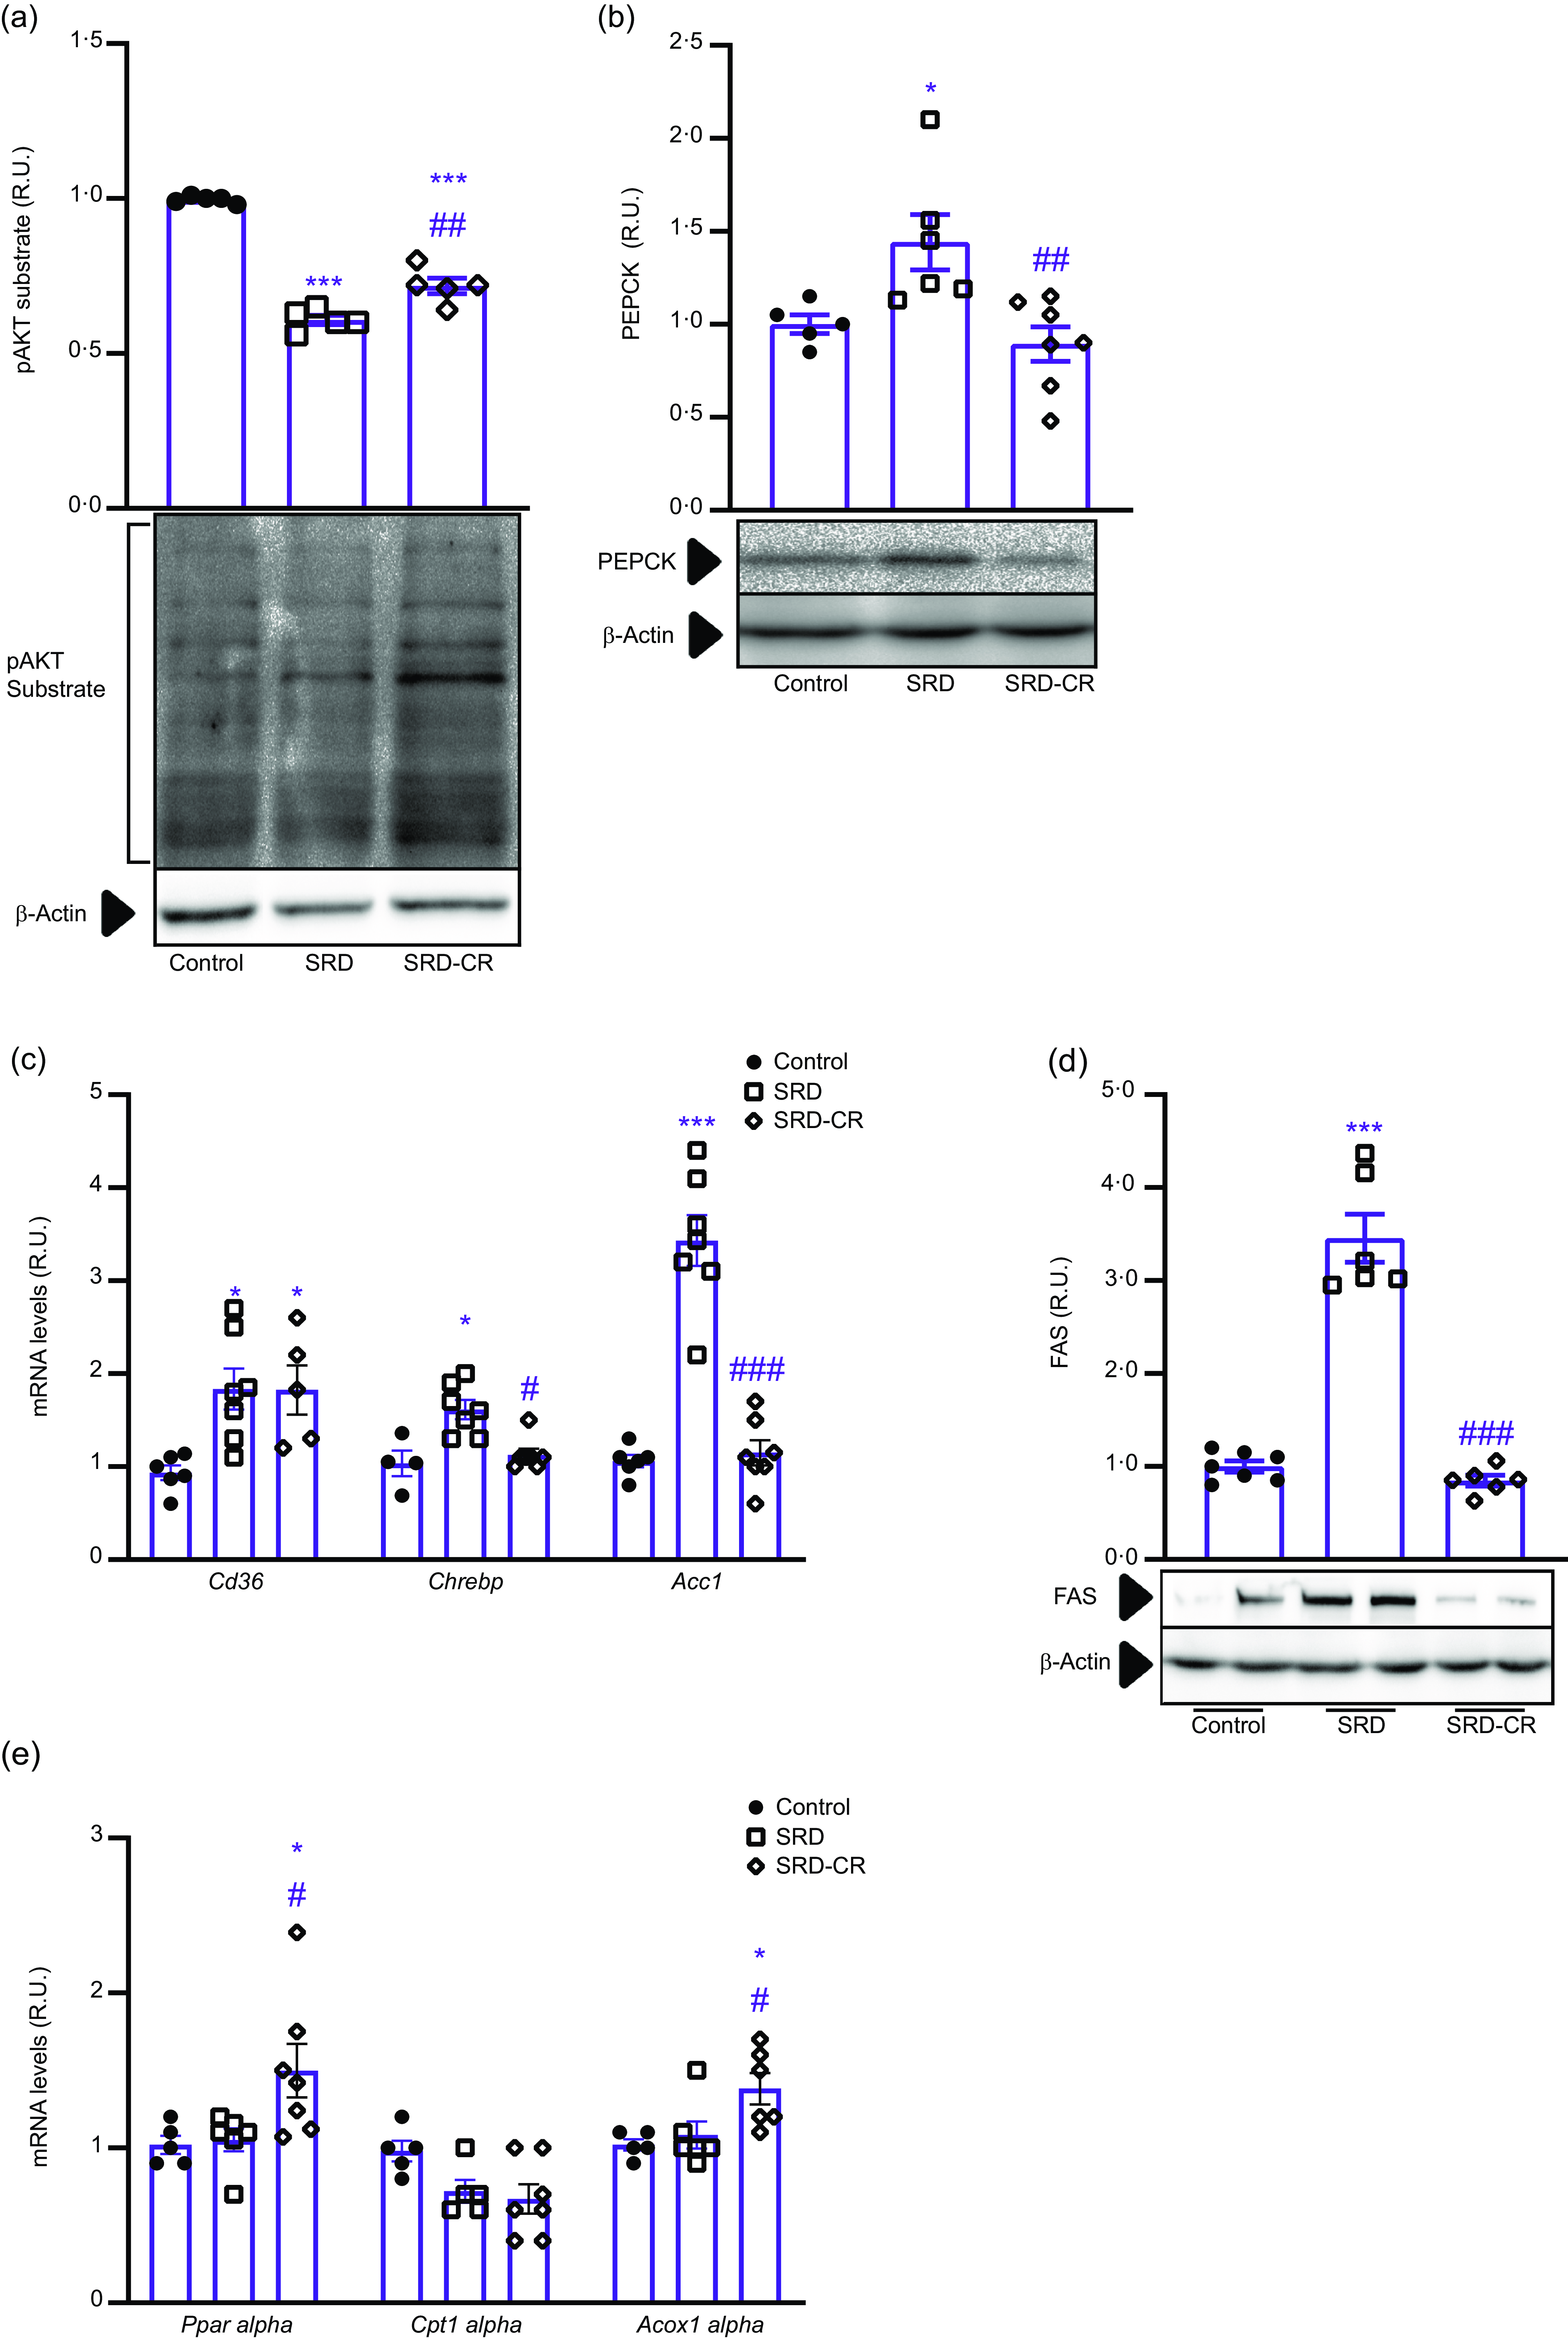
On the other hand, mRNA levels of proteins related to fatty acid β-oxidation, as transcription factor PPARα(Ppara) and ACOX1α (Acaca, peroxisomal β-oxidation) were increased only in the livers from SRD-CR animals (Fig. 5(e)).
Discussion
Consumption of high-carbohydrate diets constitutes a risk factor for type 2 diabetes, cardiovascular disease and gout(Reference Malik and Hu8). In addition, type 2 diabetes, IR and metabolic syndrome have been strongly associated with metabolic dysfunction-associated liver disease (MASLD)(Reference Marušić, Paić and Knobloch22,Reference Li, Yang and Ye23) . Accordingly, the sustained increase in the consumption of sugar-sweetened beverages has been related to the elevated global incidence of MASLD(Reference Chhimwal, Patial and Padwad24–Reference Wijarnpreecha, Thongprayoon and Edmonds26).
Diet-induced models of MASLD include rodents receiving lipid containing hypercaloric diets (high-fat or a combination of high fat and high sucrose), but also high-carbohydrate containing diets(Reference Bertola27–Reference Cole, Feaver and Wamhoff29). These animal models are useful to analyse distinct aspects of the disease, although none of them reflects the full spectrum of liver pathologies and the metabolic context that characterises the human disease(Reference Bertola27).
Different dietary interventions have shown beneficial effects on liver morphology and function in humans(Reference Basaranoglu, Basaranoglu and Bugianesi30). Among them, an analysis of data obtained from IR-obese adults on a weight loss program by Ryan et al. concluded that low-carbohydrate diets are more beneficial than low-fat diets in lowering alanine transaminase levels(Reference Ryan, Abbasi and Lamendola31). In the present study, we analyse molecular processes underlying the onset of steatohepatitis generated in rats fed 30 % sucrose in the drinking water (SRD) for 12 weeks. We also identify some mechanisms involved in the early stages of the phenotypic reversal induced by applying a caloric restriction regime (CR) for the last 2 weeks of treatment.
In our experimental protocol, adult rats receiving an SRD ingest approximately 42 % more calories than the control group throughout the treatment, mainly due to the high energy content of the sucrose solution. Switching back to a standard diet for 2 weeks caused a 45 % reduction on this parameter (SRD-CR group v. SRD, Fig. 1(b) and (c)) even though animals have free access to chow. Although a caloric restriction regime has been shown to reduce the body weight in db/db mice(Reference Chen, Beretta and Olzomer32), in our short CR protocol, there was no significant difference between both groups (SRD and SRD-CR) at the end of the experimental period (Fig. 1).
Feeding adult rats an SRD combines receiving an energy surplus with the ingestion of a palatable diet that, through effects on neural circuits(Reference Lorch, Hayes and Xia33) leads to a lower consumption of solid food (42 % less) than their control counterparts (Table 2). This could affect the nitrogen balance resulting in lower serum urea levels. In agreement with Oliva et al that described a positive correlation between plasma urea levels and the diet protein/energy ratio in rats(Reference Oliva, Alemany and Remesar34). As expected, the increased consumption of solid foods registered in SRD-CR animals was associated with the normalization of serum urea levels as compared with both control and SRD groups (Table 3).
As we and others previously demonstrated, administration of a 30 %-sucrose beverage results in the development of systemic IR (as detected by the ITT), with fasting hyperglycaemia and hypertriglyceridaemia(Reference Martinez Calejman, Di Gruccio and Mercau35,Reference Zago, Lucero and Macri36) . These parameters were still elevated in the SRD-CR group (Fig. 1), while a significant reduction in triglyceridaemia was observed in these animals (Table 3). This reduction could be explained by the impact of the dietary modification on hepatic metabolism, as discussed below.
Moderate fasting hyperglycaemia, observed even after the caloric restriction, could be the result of either the maintenance of systemic IR alone or in combination with a persistent damage to pancreatic beta-cells affecting insulin production. In that sense, systemic IR is still detected in the SRD-CR group (Fig. 1) accompanied by increased serum NEFA levels (arguing in favour of a lipolytic profile of the adipose tissue, Table 3).
Feeding animals sucrose or fructose-rich diets or high fructose corn syrup, has been shown to induce liver steatosis and inflammation(Reference Jensen, Abdelmalek and Sullivan37). In agreement, our results indicate that a 12-week treatment with an SRD induces steatosis with cytoskeletal damage, evidenced as hepatocellular ballooning (Fig. 2). In our experimental protocol, the SRD treatment was not associated with the development of liver fibrosis, assessed both histologically and by measurement of Acta2 (α-SMA) and Col1a1 expression levels (online Supplementary Fig. 1). Longer SRD treatments could eventually result in the appearance of inflammation foci (e.g. lobular infiltration) or fibrosis in the liver parenchyma(Reference Fukunishi, Nishio and Fukuda38,Reference Pompili, Vetuschi and Gaudio39) . However, in studies carried out with high fructose diets, or in a NASH monogenic rodent model, there was no evidence on the development of fibrosis, unless diets were additionally modified (high-fructose plus high-fat or a high-cholesterol diet; or ob/ob animals fed a methionine and choline-deficient diet)(Reference Hansen, Feigh and Veidal28).
A cause–effect relationship between excessive carbohydrate consumption, the generation of oxidative stress and the establishment of IR has been previously described(Reference Ferro, Baratta and Pastori40,Reference Muriel, López-Sánchez and Ramos-Tovar41) . An oxidative imbalance could damage cellular components as macromolecules and organelles, resulting in tissue injury and an impairment of its function(Reference Chen, Tian and She42). A sustained exposure to deleterious effects associated with this diet could then result in the progression of the disease from simple steatosis to steatohepatitis(Reference Ferro, Baratta and Pastori40). In agreement, markers of oxidative stress (oxidised lipids, DNA oxidation products and/or protein oxidation products) were detected in patients with steatosis/steatohepatitis, and their levels significantly correlate with the intensity of disease(Reference Spahis, Delvin and Borys12,Reference Chen, Tian and She42) .
Liver samples from SRD-treated animals also showed an increase in lipid peroxidation, 3-nitrotyrosine modified proteins (consequence of the generation of peroxynitrite), and CML-modified proteins, arising from exposure to reactive oxygen species (ROS) in the context of hyperglycaemia (Fig. 3). These results point to the generation of oxidative stress in the liver, even though hepatic cells are well equipped with a variety of antioxidant species and enzymes such as catalase and SOD. The observed induction of some of these systems in SRD-treated rats was insufficient to prevent the oxidative damage detected in the tissue. In agreement, several reports show that induction of antioxidant systems is considered an adaptive response mechanism to detoxify harmful metabolites related to oxidative stress(Reference Chen, Tian and She42). As circulating levels of glucose and fatty acids are still elevated in the SRD-CR group (Table 3), increased levels of antioxidant enzymes and CML-modified protein levels in the liver are to be expected higher. However, a tendency to a lower generation of ROS and reactive nitrogen species (RNS) in the liver is already evident in this group as a decrease in lipoperoxides, 3-nitrotyrosine modified proteins, associated to lower NOS2 expression levels are detected, as shown in Fig. 3.
Although no changes were detected in the overall content of inflammatory cells in the liver of SRD-treated rats, an imbalance of the macrophage M1 (proinflammatory) and M2 (anti-inflammatory) ratio where the inflammatory M1 phenotype (increased levels of IL1β and NOS2) prevails after 12 weeks of the dietary modification (Fig. 3). This agrees with the result presented by Alisi et al. where NAFLD development was associated with an increase in the M1/M2 ratio, while polarization to the M2 phenotype could inhibit the progression of the disease(Reference Alisi, Carpino and Oliveira43).
Rats fed an SRD-diet for 12 weeks develop liver inflammation as an increase in the mRNA levels of S100A9 (Fig. 3), a protein of the S100 family (S100A8 or S100A9), proposed marker to monitor inflammation and NAFLD progression was detected(Reference Liu, Wang and Ming44,Reference Serhal, Hilal and Boutros45) . Although the caloric restriction regime applied to SRD fed animals did not correct the histological damage to the liver (assessed by the nonalcoholic fatty liver disease activity score, Fig. 2) a reduction in the levels of S100A9 (v. the SRD) suggests a slowdown in the progression of the disease. An improvement in the inflammatory profile (p-NFkB levels and NOS2 expression) was already evident in the SRD-CR group (Fig. 3).
Hepatocyte lipotoxicity is a hallmark of steatohepatitis, and lipid-induced liver injury involves generation of ER stress and the activation of the UPR(Reference Balakumar, Raji and Prabhu46), evidenced by attenuation of the translation rate and an augmented chaperone expression, to restore homeostasis in the presence of unfolded proteins(Reference Fernandes-da-Silva, Miranda and Santana-Oliveira47). A reciprocal relationship between the induction of inflammation and oxidative stress with UPR in the liver has also been proposed(Reference Duvigneau, Luís and Gorman48). Regardless of the cause, our results indicate that feeding rats an SRD induces an increase in the protein levels of the chaperone GRP78 (a fundamental chaperone protein for the quality control of ER proteins), and the expression levels of other two components of the UPR (P58IPK and CHOP, Fig. 4) while also increasing parameters of inflammation and oxidative stress in the liver of rats (Fig. 3). Prolonged activation of the UPR could induce cell death (e.g. by apoptosis)(Reference Hetz, Zhang and Kaufman49) and an increase in hepatocyte apoptosis is typically observed in biopsy samples from NAFLD patients and in animal models of steatohepatitis(Reference Zeeshan, Lee and Kim50). Accordingly, our results indicate an increase in cell death by apoptosis in the liver of SRD-treated rats (Fig. 4). Caloric restriction results in a decrease in the expression of UPR targets (p58IPK and CHOP levels) and in markers of apoptosis (cleaved caspase 3 and apoptotic index). As hypothesised before, these effects could be due to a decrease generation of ROS and RNS and to a lower grade inflammatory state.
Considering that neither NEFA or glucose serum levels, nor hepatic CML-modified proteins were modified in the SRD-CR group (v. SRD, Table 3 and Fig. 3) we ruled out their involvement in the induction of UPR/apoptosis in our model. As certain inflammatory mediators, such as the pro-inflammatory cytokines IL-1β, IL-6 and TNF-α, that have been shown to induce ER stress in the liver (for a review see(Reference Duvigneau, Luís and Gorman51)) we hypothesize that inflammatory cues could be also involved in our model. In this sense, Chan et al. proposed that proinflammatory cytokine-induced ER stress and apoptosis contribute to pancreatic beta cell destruction in MIN6 cells,(Reference Chan, Cooney and Biden52) and Kandel-Kfir et al. demonstrated that interleukin-1 α deficiency attenuates endoplasmic reticulum stress-induced liver damage and CHOP expression in mice(Reference Kandel-Kfir, Almog and Shaish53).
Cellular components released by dead cells, known as damage-associated molecular patterns (DAMP), could induce a strong inflammatory response through the activation of macrophages and the engulfment of apoptotic bodies(Reference Luci, Bourinet and Leclère54). Inflammation thus promotes a vicious cycle by increasing hepatocyte cell death. In NAFLD, lipid metabolites could also contribute to macrophage activation(Reference Kazankov, Jørgensen and Thomsen55,Reference Yang, Luo and Wang56) . Signals from the environment can induce a pro-inflammatory phenotype in Kupffer cells and thus promote the recruitment of blood-derived monocytes. Both cell types could then acquire a more pro-inflammatory phenotype and further promote NAFLD progression(Reference Alisi, Carpino and Oliveira43).
A link between fructose intake and the generation of hepatic IR has been described in patients, even when total energy intake is matched by equal calories from glucose (isocaloric diets)(Reference Softic, Stanhope and Boucher57). Several mechanisms have been hypothesised to be involved in the generation of IR by fructose, including classic mechanisms (adiposity based) and those independent of energy intake or weight gain. Among the latter: direct effects on insulin signalling or on hepatic glucose production, and indirect effects resulting from hepatic and muscle lipid accumulation(Reference Johnson, Perez-Pozo and Sautin58). For example, excess fructose intake can lead to an increase in de novo lipogenesis in the liver by bypassing the major rate-limiting step of glycolysis at the phosphofructokinase step(Reference Basaranoglu, Basaranoglu and Bugianesi30). Although it has been suggested that the development of hepatic IR precedes the establishment of whole-body IR(Reference Softic, Stanhope and Boucher57) present results do not allow us to establish a timeline although in our CR regime systemic IR is still present while hepatic IR is attenuated. It has been demonstrated that an increased NFkB activity could induce IR, whereas mice with reduced NFkB activity were unable to develop it. In the liver, the NFκB-dependent production of inflammatory cytokines may promote JNK-1 activation and the establishment of IR via ser-307 phosphorylation of the insulin receptor substrate 1 (IRS-1, for a review see(Reference Rutledge and Adeli59)). In agreement, we hereby show that activation of the NFkB pathway (p-NFkB levels, Fig. 3) is associated with lower AKT activity, indicating a decrease in the insulin transduction pathway in SRD-animals (Fig. 5). As expected, in animals receiving the CR regimen, attenuation of the NFkB pathway was associated with an increase in AKT activity (v. SRD).
In the liver, AKT suppresses the expression of the Forkhead box O1-mediated gluconeogenic gene (FOXO1) decreasing gluconeogenesis, among other effects(Reference Szablewski60). Thus, in a context of liver IR an increase in gluconeogenesis (e.g. increased expression of PEPCK) is expected. Consequently, an attenuation of gluconeogenesis is predictable if AKT activation is enhanced, such as in the livers of SRD-CR animals (v. SRD, Fig. 5).
Some studies demonstrated that fructose induces the expression of the hepatic carbohydrate response element-binding protein (ChREBP, encoded by the Mlxipl gene)(Reference Geidl-Flueck and Gerber61). Activation of ChREBP has also been associated with gluconeogenic and lipogenic effects of fructose, as demonstrated by the induction of glucose-6-phosphatase activity(Reference Jensen, Abdelmalek and Sullivan37) and genes involved in fatty acid synthesis (such as acetyl-CoA carboxylase and fatty acid synthase)(Reference Wang, Viscarra and Kim62) and that its activity is regulated at transcriptional, translational, and post-translational levels(Reference Softic, Stanhope and Boucher57,Reference Ortega-Prieto and Postic63) . Additionally, NFkB (p65) has also been shown to regulate hepatic lipogenesis by the transactivation of ChREBP in response to a high sucrose diet in mice(Reference Daniel, Dogra and Rawat64). In agreement, we hereby show the activation of the NFkB pathway (Fig. 3), and an increase in Mlxipl mRNA levels, as well as of enzymes involved in de novo lipogenesis (Fig. 5). Switching to a regular diet for a short period reduced NFkB activity associated with the reversion of the gluconeogenic profile and normalises the expression levels of lipogenesis related proteins (ChREBP, FAS and ACC1, Fig. 5).
PPARα is a transcription factor that controls fatty acid (FA) oxidation in hepatocytes by regulating rate-limiting steps in mitochondrial (carnitine palmitoyl transferase 1, CPT1) and peroxisomal (acyl-CoA oxidase 1, Acox1) FA β-oxidation(Reference Wang, Nakajima and Gonzalez65). PPARα levels and activity are regulated at many different levels (e.g. gene and protein expression and protein post-translational modifications) and by many different factors (e.g. nutritional/hormonal cues, aging, cytokines, growth factors)(Reference Bougarne, Weyers and Desmet66). For example, it is known that energy deficit interventions such as diet, energy restriction or exercise increases lipid oxidation through the AMPK/PPARα pathway(Reference Fang, Pan and Qu67–Reference Karagöz and Gülçin Sağdıçoğlu Celep69). Accordingly, in our CR model, increased levels of PPARα were observed, as shown in Fig. 5.
An imbalance between the uptake of circulating fatty acids and their metabolism (de novo fatty acid synthesis or oxidation), TAG synthesis and export in lipoproteins could contribute to hepatic steatosis(Reference Ipsen, Lykkesfeldt and Tveden-Nyborg70). Liu et al. reported that the expression levels of the fatty acid transport protein CD36 were increased in hepatocytes incubated with palmitic acid, and there is extensive evidence showing that CD36 plays a significant role in hepatic steatosis(Reference Liu, Yang and Zuo71). In fact, CD36 has been proposed as a potential drug target for NAFLD(Reference Rada, González-Rodríguez and García-Monzón72). Our results also indicate a higher expression of CD36 associated with the hepatic steatosis induced by SRD. In agreement, neither serum NEFA levels nor the expression levels of the fatty acid transport protein CD36 were affected by the diet change (Table 3 and Fig. 5) in association with the sustained steatosis observed in the SRD-CR group (Fig. 2).
Nonetheless as previously indicated, switching back to a standard diet after receiving an SRD induced the expression of fatty acid oxidation-related genes while decreasing de novo lipogenesis. As the degree of steatosis was not affected, we hypothesise that a higher flux through β-oxidation pathways could result in a lower export of TAG from the liver, hence decreasing circulating levels of serum TAG, as we detected in SRD-CR-treated animals (Table 3). This agrees with the reduction of plasma TAG-rich lipoprotein (such as VLDL), detected upon PPARα activation, that has been related to fatty acid uptake, conversion into acyl-CoA derivatives and further catabolism via the β-oxidation pathways(Reference Pawlak, Lefebvre and Staels73).
In summary, in the present study, we describe a model of steatohepatitis generated by the administration of a SRD to rats for 12 weeks. This dietary modification was associated with the generation of oxidative stress, inflammation, induction of UPR and cell death by apoptosis in the liver. A shift towards a lipogenic and gluconeogenic profile, along with the establishment of hepatic IR, was also observed. Applying a caloric restriction protocol during the last 2 weeks of treatment reduced serum TAG levels without modifying systemic IR, hyperglycaemia or body weight.
In the liver, this short period of regular diet blocked the shift towards a pro-inflammatory profile, the activation of UPR and the induction of apoptosis, without changing the nonalcoholic fatty liver disease activity score. In addition, this dietary modification also improved hepatic insulin sensitivity along with a decrease in gluconeogenesis and lipogenesis and an increase in fatty acid catabolism, probably impacting on hepatic lipoprotein production and serum TAG levels.
Conclusions
Our findings led us to propose that integrating a caloric restriction protocol into the therapeutic regimen administered to patients with MASLD may be useful as a first and complementary strategy for future pharmacological treatments, potentially offering synergistic benefits in mitigating its progression.
Supplementary material
For supplementary material/s referred to in this article, please visit https://doi.org/10.1017/S0007114524002794
Acknowledgements
We would like to acknowledge Silvia I. Sanchez Puch, PhD, for her valuable insights and support. Federico Jara PhD, Patricia M. Fernández, M. Alejandra Verón, M. Cristina Lincon, Alberto Capriolo, Daniela C. Néspola, Alcira Mazziotti and Vanesa Fernández lent excellent technical assistance.
This research was supported by grants from the Agencia Nacional de Promoción Científica y Tecnológica (PICT 2118); Universidad de Buenos Aires (20020190200379BA and 20020170100216BA); Sociedad Argentina de Diabetes (SAD, Investigación Básica 2023) and Consejo Nacional de Investigaciones Científicas y Técnicas (PIP 726CO), Argentina.
Conceptualisation (M. W. and E. M. R.). Data curation (M. W.). Formal analysis (M. W., C. B. C. and E. M. R.). Funding acquisition (C. B. C. and E. M. R.). Investigation (M. W., L. C. and D. M.). Supervision (C. B. C. and E. M. R.). Writing – original draft (M. W., C. M. C., C. B. C. and E. M. R.).
There are no conflicts of interest.


