


Impact Statement
Machine learning models such as Latent Dirichlet Allocation (LDA) learn from data to uncover key themes and trends. These topic-modeling algorithms provide key insights into the discourse surrounding environmental sustainability on social media. Our contribution has implications for researchers, social media influencers, businesses, organizations, and politicians that wish to understand the online discussion of environmental challenges and sustainable practices. This study emphasizes the power of data science and machine learning to understand social media content as it relates to environmental sustainability.
1. Introduction
According to the 2021 Annual Climate Report by climate.gov, the Earth’s land and ocean temperatures have steadily risen since 1880 (Lindsey and Dahlman, Reference Lindsey and Dahlman2023). This alarming increase in temperature, along with other problems such as energy waste and environmental pollution, demonstrates the need for change in human behavior to secure a better future for generations to come. To positively influence behavior on a large scale, it is essential to raise awareness about these issues so that people can take the necessary steps to counteract the ongoing crisis. In the past decade, social media platforms such as Twitter, Facebook, and Instagram have gained tremendous popularity, thus becoming an effective way to reach a large audience. By facilitating the spread of messages quickly and effectively, these platforms provide powerful tools for promoting influence, such as the importance of environmental sustainability. In this research paper, we investigate the major topics of conversation surrounding the #sustainability hashtag on Twitter with a focus on how social media can be used to support sustainability efforts. It should be noted that as of April 2023, Twitter has been renamed to “X”; however, as it was still Twitter during the time frame of the study, it will be referred to as Twitter in this paper.
2. Background
According to the United Nations Brundtland Commission, sustainability is defined as “meeting the needs of the present without compromising the ability of future generations to meet their own needs” (United Nations, 1987). In the context of this research, sustainability refers to any effort or promotion of content toward a better future for our planet.
The increasing usage of technology has propelled social media to become a powerful tool for conveying information and influencing the public. Social media platforms like Instagram, Facebook, and Twitter have allowed the public to share their opinions on topics like sustainability and climate change, which, in turn, influences public perception of climate change (Mavrodieva et al., Reference Mavrodieva, Rachman, Harahap and Shaw2019). Given the numerous issues with the current state of our environment—from climate change and pollution to loss of biodiversity and deforestation—we urgently need to adopt sustainable practices to ensure the well-being of future generations. Sustainable practices include reducing waste and pollution, adopting renewable energy sources, and conserving resources. (Intergovernmental Panel on Climate Change, 2022).
2.1. Literature review
The importance of social media in promoting sustainability and its effect on users is a well-documented phenomenon. Zhao et al. analyzed the use of social media by sustainable fashion brands to communicate with consumers and promote their sustainability goals. Through a content analysis of the Instagram pages of the brands Verlaine, Patagonia, and Stella McCartney, the researchers found that posts with expressive and directive advertising were more likely to receive comments and likes from users (Zhao et al., Reference Zhao, Lee, Li and Sun2022). This research provides context for user response to social media marketing and how different approaches to social media marketing can impact consumer engagement. While our study focuses on user engagement on the topic of sustainability rather than analyzing different approaches to social media marketing, the study conducted by Zhao et al. established the effectiveness of social media for promoting sustainability, thus showing a relevant application for our research. Similarly, Wibowo et al. also showed the effectiveness of social media in promoting sustainability by exploring the impact of social media marketing activity and customer experience on customer behavior outcomes such as purchase intention, loyalty intention, and participation intention in the context of social networking sites. Through a sample of 413 surveys, the study showed that social media marketing activity and customer experience significantly impacted relationship quality and purchase intention (Wibowo et al., Reference Wibowo, Chen, Wiangin, Ma and Ruangkanjanases2020). These results indicate that social media platforms are an effective way of promoting sustainability. Additionally, a study conducted by Ana Adi provides insight into Twitter’s role in creating a community of interest around sustainability discussion under the sustainability hashtag. Through a collection of 15,000 tweets over three time periods, a network visualization was conducted to establish whether there is a sustainability community on Twitter, and emerging discourse was identified by looking at the top hashtags and a detailed look into the dataset of tweets collected (Adi, Reference Adi2017). This study concluded that the sustainability community on Twitter is largely driven by several accounts that largely shape the conversation through repeated postings and that content frequently revolves around people, planet, and products (Adi, Reference Adi2017). This study does not incorporate machine learning and looks at hashtags to determine topics of discourse related to sustainability; however, it provides valuable insight into factors within the sustainability community on Twitter, and what may shape the discussion under the hashtag.
Public opinion on sustainability is another critical factor to contextualize when researching patterns in sustainable content on Twitter. Sanders et al. analyzed the content of tweets posted to Twitter between July and December 2020 to examine the public conversation regarding the application of artificial intelligence (AI) in agriculture. According to the survey, there was a lot of support for employing AI in agriculture on Twitter (Sanders et al., Reference Sanders, Mayfield-Smith and Lamm2021). Although the study looks at public opinion on agriculture and not trending categories under the hashtag #sustainability, this study establishes that users on Twitter have a generally positive attitude toward sustainability content.
Significant research has also been conducted regarding the most discussed sustainability topics on Twitter. Pilař et al. identified the main topics of communication related to hashtag #sustainability on Twitter to understand how these topics were perceived by users worldwide. From 414,926 Twitter interactions by 223,476 users between April 17, 2018, and July 12, 2019, the study identified six key hashtags in the field of sustainability: Innovation, Environment, Climate Change, Corporate Social Responsibility, Technology, and Energy (Pilař et al., Reference Pilař, Kvasničková Stanislavská, Pitrová, Krejčí, Tichá and Chalupová2019). These results apply primarily to individuals and organizations looking to promote sustainability online by allowing them to be informed on topics that generally trend on Twitter. While the study explored a topic similar to our research, our study differs in that it looks at various sustainability hashtags and only uses the hashtag itself for content analysis. Similarly, Reyes-Menendez et al. (Reference Reyes-Menendez, Saura and Alvarez-Alonso2018) aimed to identify key factors related to sustainable development goals that are of concern to Twitter users. The authors used sentiment analysis and textual analysis to classify the tweets under the hashtag #WorldEnvironmentDay and identify public opinion on environmental and sustainability issues on that day. While this research only focuses on one specific day and does not categorize the major topics on Twitter relating to sustainability, it is helpful in contextualizing our research, as the study found that the World Environment Day hashtag was most often used to talk about climate change, global warming, extreme weather, water pollution, deforestation, climate risks, acid rain, and large-scale industrialization. Understanding what topics are discussed on one particular day can provide some insight into what we might find over a larger period of time.
Another #WorldEnvironmentDay study conducted by Zarrabeitia-Bilbao et al. explores the #WorldEnvironmentDay hashtag on Twitter and applies big data techniques and social network analysis to analyze over 400,000 tweets under the #WorldEnvironmentDay hashtag on June 5, 2021. This study analyzed the sentiment of tweets to be largely positive and conducted a semantic analysis to find words that are commonly mentioned among these tweets.
Additionally, different community leaders and topics of conversation on this day were identified using a machine learning analysis (Zarrabeitia-Bilbao et al., Reference Zarrabeitia-Bilbao, Rio-Belver, Alvarez-Meaza and de Alegría-Mancisidor2022). While this study only looked at #WorldEnvironmentDay rather than #sustainability, it revealed insights into the effectiveness of machine learning analysis to classify tweets related to sustainability. Furthermore, the study revealed that the World Environment Day hashtag was most often used to talk about official slogans from the UN, actions for the environment, social responsibility, Indian government, Pakistan, criticism of environmental degradation, restoration, and criticism of political responsibility for environmental degradation (Zarrabeitia-Bilbao et al., Reference Zarrabeitia-Bilbao, Rio-Belver, Alvarez-Meaza and de Alegría-Mancisidor2022).
2.2. Research gap
Preexisting research analyzes public discourse surrounding sustainability similarly to what we wish to explore. However, little to no research employs a combination of classical statistical analysis with the Latent Dirichlet Allocation methodology to analyze tweets under #sustainability on Twitter and view the intersection of these two methodologies. The aforementioned study conducted by Pilař et al. looks at #sustainability as does our research; however, the study does not use LDA analysis and only explores hashtags instead of overall topic analysis. The aforementioned study conducted by Reyes-Menendez et al. (Reference Reyes-Menendez, Saura and Alvarez-Alonso2018) analyzes major topics of discussion. However, the study explores only #WorldEnvironmentDay, and does not apply the same machine learning techniques and methodology as our study does. The aforementioned study conducted by Zarrabeitia-Bilbao et al. uses a similar methodology as our research does; however, the study explores only #WorldEnvironmentDay and does not use a keyword-frequency analysis and explore the intersection between classical statistical analysis and the machine learning model.
2.3. Objectives
This study aims to answer the research question: “What are the major topics of conversation under the #sustainability hashtag on Twitter?” by classifying the major topics of conversation to provide insight into user engagement patterns under the #sustainability hashtag on Twitter. These results provide valuable insights for those who wish to understand Twitter discourse surrounding sustainability and those who wish to use the results as a tool to promote sustainable content themselves and thus increase awareness for an important societal issue.
3. Methodology
3.1. Research instruments
This study used Google Colab, a cloud-based Integrated Development Environment (IDE) in which all code was written and all data was analyzed. The only computer language used for all of the code was Python.
3.2. Data collection
To collect tweets from the Twitter platform, a web scraper Python library was used entitled “snscrape”. Snscrape is “a scraper for social networking services (SNS). It scrapes things like user profiles, hashtags, or searches and returns the discovered items, e.g. the relevant posts” (JustAnotherArchivist, 2023). Based on a Netflix web scraper that utilized snscrape (15EkbergC, 2022), the Python script collected 1000 random tweets per day. Only tweets written in English were collected.
The program to scrape Twitter posts collected the following information about each Twitter post: “UserID”, “Date”, “Username”, “TweetContent”, “Likes”, “Retweets”, “TimesQuoted”, “ReplyCount”, “FollowerCount”, “friendCount”, “mediaType”, “viewCount”, “Day”. UserID refers to the particular user’s identification number, which is given by default to all Twitter accounts; the date was collected following the format year-month-day; TweetContent referrers to the unfiltered content of the tweet; Likes was the number of likes the tweet received; Retweets was the number of retweets (shares) the tweet got; TimesQuoted was the number of replies that contained a quote from the post; ReplyCount is the number of replies; FollowerCount is the number of people the user was following; friendCount is the number of friends the user had; mediaType was simply an indication if the tweet had an image attached (most images were filtered out in preprocessing); viewCount is the number of views the tweet had, and Day was a relative day assigned to each tweet and can be disregarded.
3.3. Data preprocessing
To begin, all words in the tweetContent column of the dataset were converted to lowercase letters to ensure standardization among the data. Next, all tweets from users with less than 100 followers and 10 friends were removed in an attempt to remove any bots to get an accurate representation of what actual people are discussing. Next, all null values are cleared from the dataset to avoid problems with machine learning models or data analysis. URLs, Mentions, Emojis, and Reserved Words (RT, FAV) are removed, and Smileys are converted to text. Next, a word count column is created for the remaining tweet content using the unfiltered tweet content. Next, all stop words from the NLTK library are removed from the tweets, as they do not provide any insight into the topic of the tweets (Sebleier, 2010). Additional words removed include “sustainability”, “#sustainability”, “&”, “nan”, “rt”, “rt”, “fav”, “let”, “amp”, “re”, and “sustainable” as they all include words that are either non-descriptive, automatically generated by Twitter, or unhelpful for determining the topic (e.g., “sustainable” does not contribute to identifying posts under #sustainability). Next, all word endings are removed to revert the word to its lemma in a process called Lemmatization to improve the machine learning model. Otherwise, words such as “run” and “runs” would be identified as separate. Additionally, words are all separated from each other in a process called Tokenization, with words less than 3 characters being filtered out as they are not useful for analysis. Finally, special symbols and punctuation are removed as they are non-descriptive. All data are exported into a new file containing a “keywords” column with the preprocessed tweet content results stored for analysis.
3.4. Dataset analysis methodology
In order to gain an understanding of the data, basic descriptive statistics were calculated for the following attributes: Likes, Retweets, Times Quoted, Reply Count, View Count, Word Count, Follower Count, and Friend Count. These statistics include count (number of data points for each attribute), mean, standard deviation, minimum, maximum, 25%, 50%, and 75%. Next, histograms were plotted for the same metrics in order to understand the frequency of data points and the distribution of the data. Next, data points were plotted over time to identify any unusual changes on particular days in the dataset. Finally, notable correlations between variables were plotted on a scatter plot to help identify trends in the data.
3.5. Frequency analysis methodology
In the frequency analysis, the previously mentioned “keywords” column in the dataset was plotted to find the top 30 most frequent keywords. This allows for quantitative analysis of common words discussed. With the top 30 keywords, common words were grouped together into overall topics of discussion manually and used later in comparison to the output of the topic modeling machine learning model.
3.6. Topic modeling analysis methodology
In order to identify the major topics of conversation within the dataset, a machine learning model called Latent Dirichlet Allocation (LDA) was used. LDA is an unsupervised machine learning model that classifies major topics within a collection of words inputted. Unsupervised learning “uses machine learning algorithms to analyze and cluster unlabeled datasets. These algorithms discover hidden patterns or data groupings without the need for human intervention.” (IBM, 2023). The LDA model was first “trained” on the preprocessed data in the “keywords” column in the dataset. Next, The LDA algorithm was assigned a specific number of “topics” to separate the dataset into. The topics exported by the algorithm are not a traditional one-word classification of a common topic but rather the most relevant keywords that are deemed probable of belonging together in a topic (Kulshrestha, Reference Kulshrestha2020).
 $$ relevance\left( term\hskip0.35em w\hskip0.35em |\hskip0.35em topic\hskip0.35em t\right)={\lambda}^{\ast }p\left(w\hskip0.35em |\hskip0.35em t\right)+(1-\lambda {)}^{\ast }p\left(w\hskip0.35em |\hskip0.35em t\right)/p(w) $$
Keyword relevancy as seen in Equation (1) is a measure of the most relevant words within a topic (Sievert and Shirley, Reference Sievert and Shirley2014). Keyword relevancy within the model was automatically calculated using the LDA algorithm which functions as follows: first go through the collection of words and randomly assign each word in the collection to one of the topics (the number of topics is predefined when running the algorithm). Next in each document find the “proportion of words in [a] document that are assigned to [a] topic” (Kulshrestha, Reference Kulshrestha2020) next find the proportion of a word in a topic compared to the word in the overall document finally the probability of the word belonging to a topic is updated. This process is repeated several times until the assignment of words to a topic no longer changes to maximize accuracy (Kulshrestha, Reference Kulshrestha2020).
For this study, the number of topics to categorize the data into was set to 7, as trials were run with the number of topics set to 5–13, and the results for 7 topics yielded good “coherence” and “perplexity” scores, as well as the best results for distinct topics. Perplexity score “captures how surprised a model is of new data it has not seen before, and is measured as the normalized log-likelihood of a held-out test set.” (Kapadia, Reference Kapadia2022). Although this metric is not perfect for representing how accurate the model is, it is a good indicator of the model. The coherence score is a measure of “the degree of semantic similarity between high scoring words in the topic” (Kapadia, Reference Kapadia2022). The coherence score assists in evaluating how easy the topics are to identify. A high coherence and a low perplexity were optimal for this topic model analysis; however, topic model results and intertopic distance was also an important consideration when choosing the number of topics. Intertopic distance is “a visualization of the topics in a two-dimensional space” (SydneyF, 2021). The intertopic distance represents how distinct topics are from each other. Topics that are further away are more distinct in content. More distance in between topics represents a better fit of the model for the dataset.
4. Dataset
4.1. Twitter metrics general statistics
Some The dataset collected after data pre-processing consisted of 37,728 rows (tweets) and 18 columns. The rows represent each individual Twitter post collected. The columns were each attribute, including “UserID”, “Date”, “Username”, “TweetContent”, “Likes”, “Retweets”, “TimesQuoted”, “ReplyCount”, “FollowerCount”, “friendCount”, “mediaType”, “viewCount”, “Day”, “wordCount”, and “keywords”. Analysis was first conducted on the following attributes: Likes, Retweets, Times Quoted, Reply Count, View Count, Word Count, Follower Count, and Friend Count.
First and foremost, all metrics have fully filled out data points, with 37,728 in each category, meaning the dataset is consistent with no missing values. In Table 1, the view count is the highest average metric, followed by the friend count, likes, and retweets. Average likes are notably higher than average retweets, suggesting that users are more likely to like tweets about sustainability than to share them with others. One possible inference is that people show interest in sustainability but do not often advocate for it on their platform. The majority of tweets (75%) had around 102 views, showing that the dataset consisted of a sufficient number of posts with the opportunity for user engagement.
Standard twitter metrics data (n = 37,728)

Note. The initial number of tweets was 60,000. Of them, 22,272 posts did not meet the criteria, therefore leaving 37,728 posts.
4.2. Frequency analysis with histograms
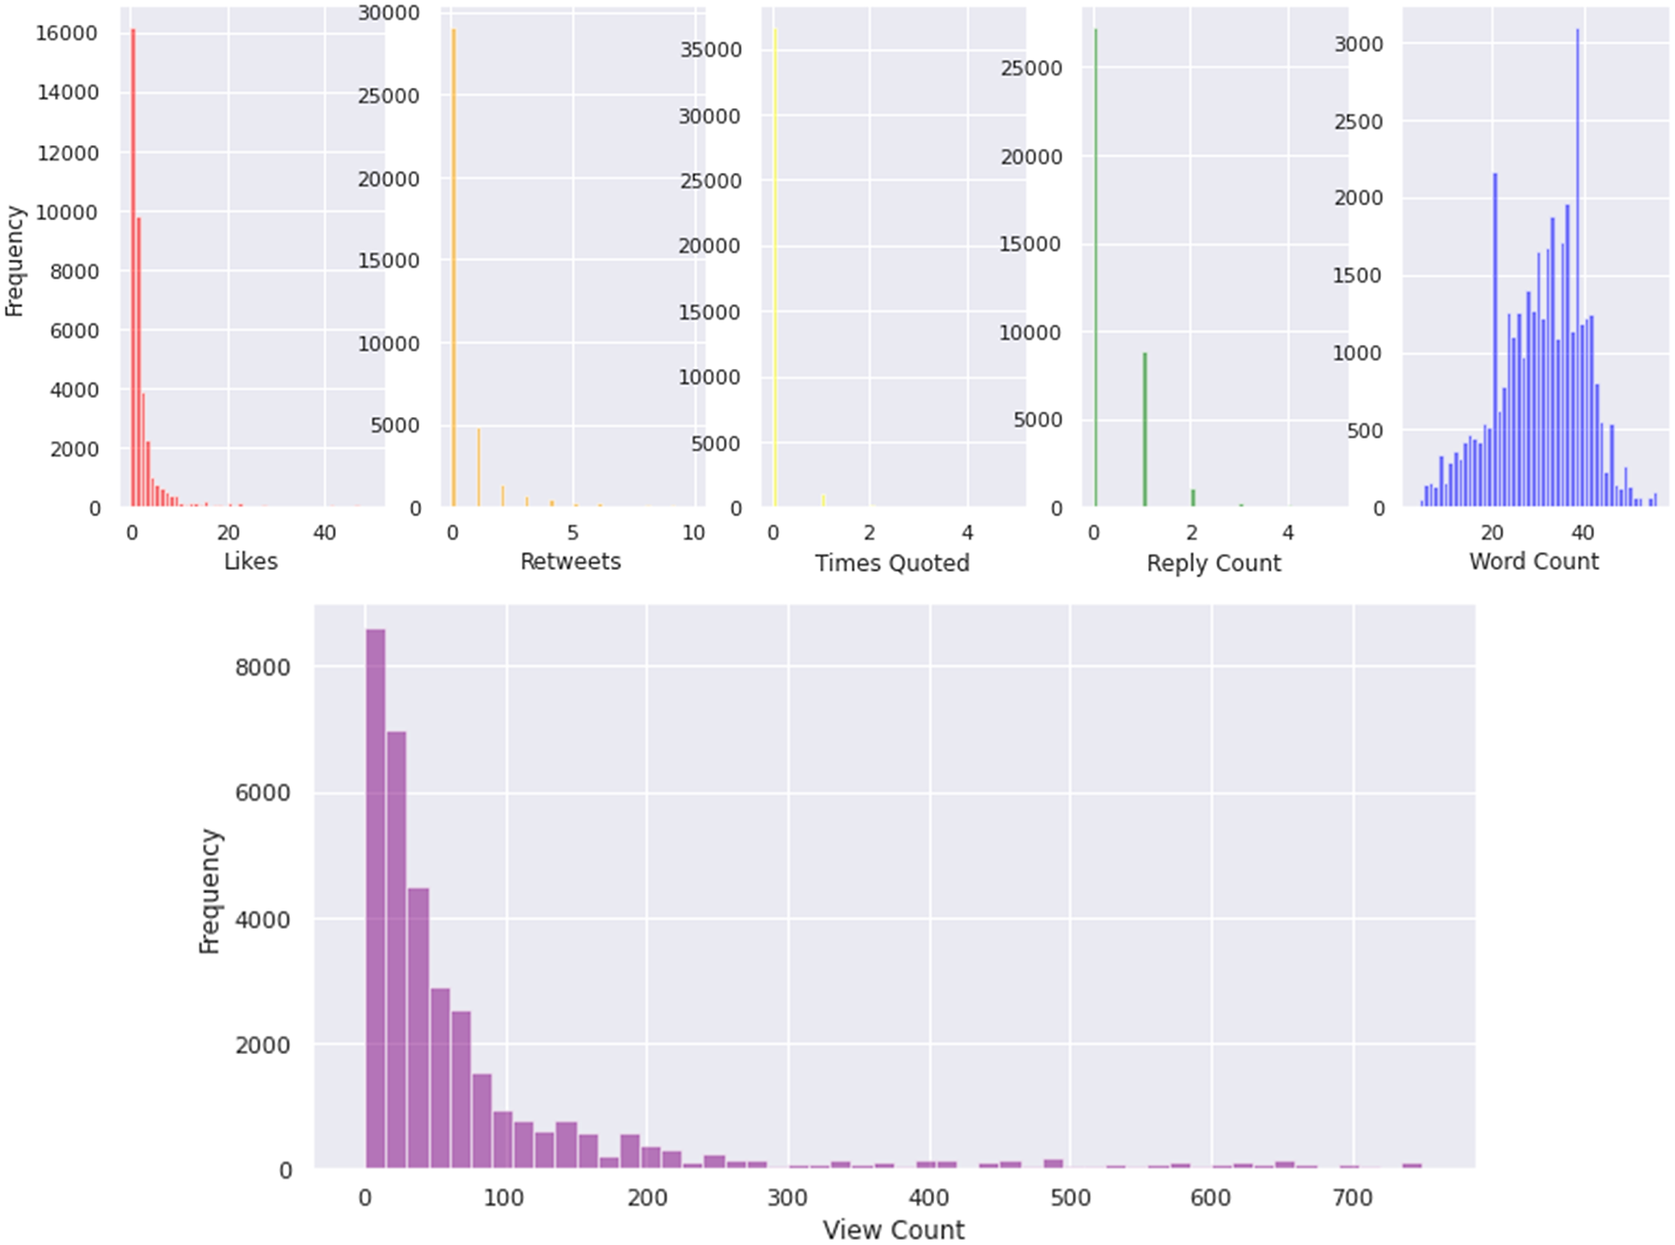
Figure 1 displays histograms for each of the previous attributes mentioned. As can be seen, most figures (excluding the word count histogram) have a top frequency value of 0. This is likely due to the nature of the dataset, as it is a random sample. As is apparent, the majority of posts lie between 0 to around 15 likes, 0 to around 5 retweets, and 0 to around 4 replies. The majority of posts do not have any times quoted with the majority having 0, and some having 1 (keep in mind the y-axis scale is in the thousands). It is apparent that the majority of posts had between 20 and 40 words, with a large spike of posts with around 38 words.
Histograms of likes, retweets, times quoted, reply count, word count, and view count.
Note: The y-axis (Frequency) for each graph represents the number of tweets within the dataset.
4.3. Time series scatter plots
Figure 2 is a series of scatterplots displaying the Twitter metrics over the period of time they were gathered. As can be seen, the majority of graphs have a relatively steady trend for the value over time. This means that most days consisted of a relatively consistent number of likes, retweets, times quotes, replies, and views per day. However, some days had massive spikes in these metrics. The spikes suggest that a viral tweet was posted on that day. The word count graph remains consistently distributed over time, showing no change on any particular day in the amount people were typing, as expected.
Scattergrams of likes, retweets, times quoted, reply count, view count, word count over time.
Note: The x-axis displays the date in the format month-day that the posts were collected. The year for all of the posts was 2023.

4.4. Correlation analysis
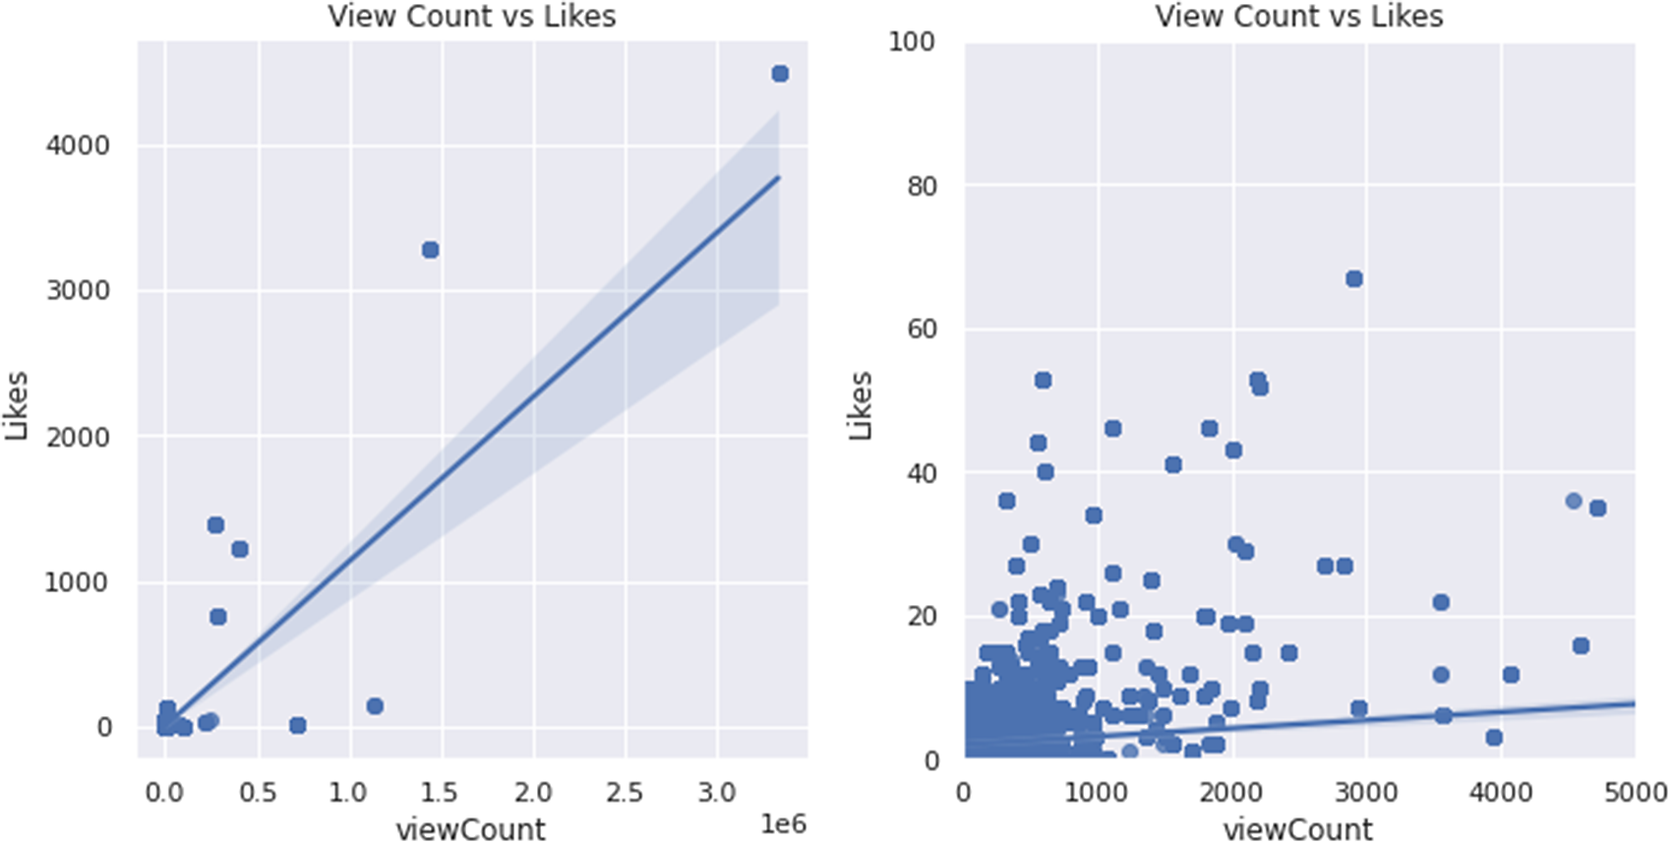
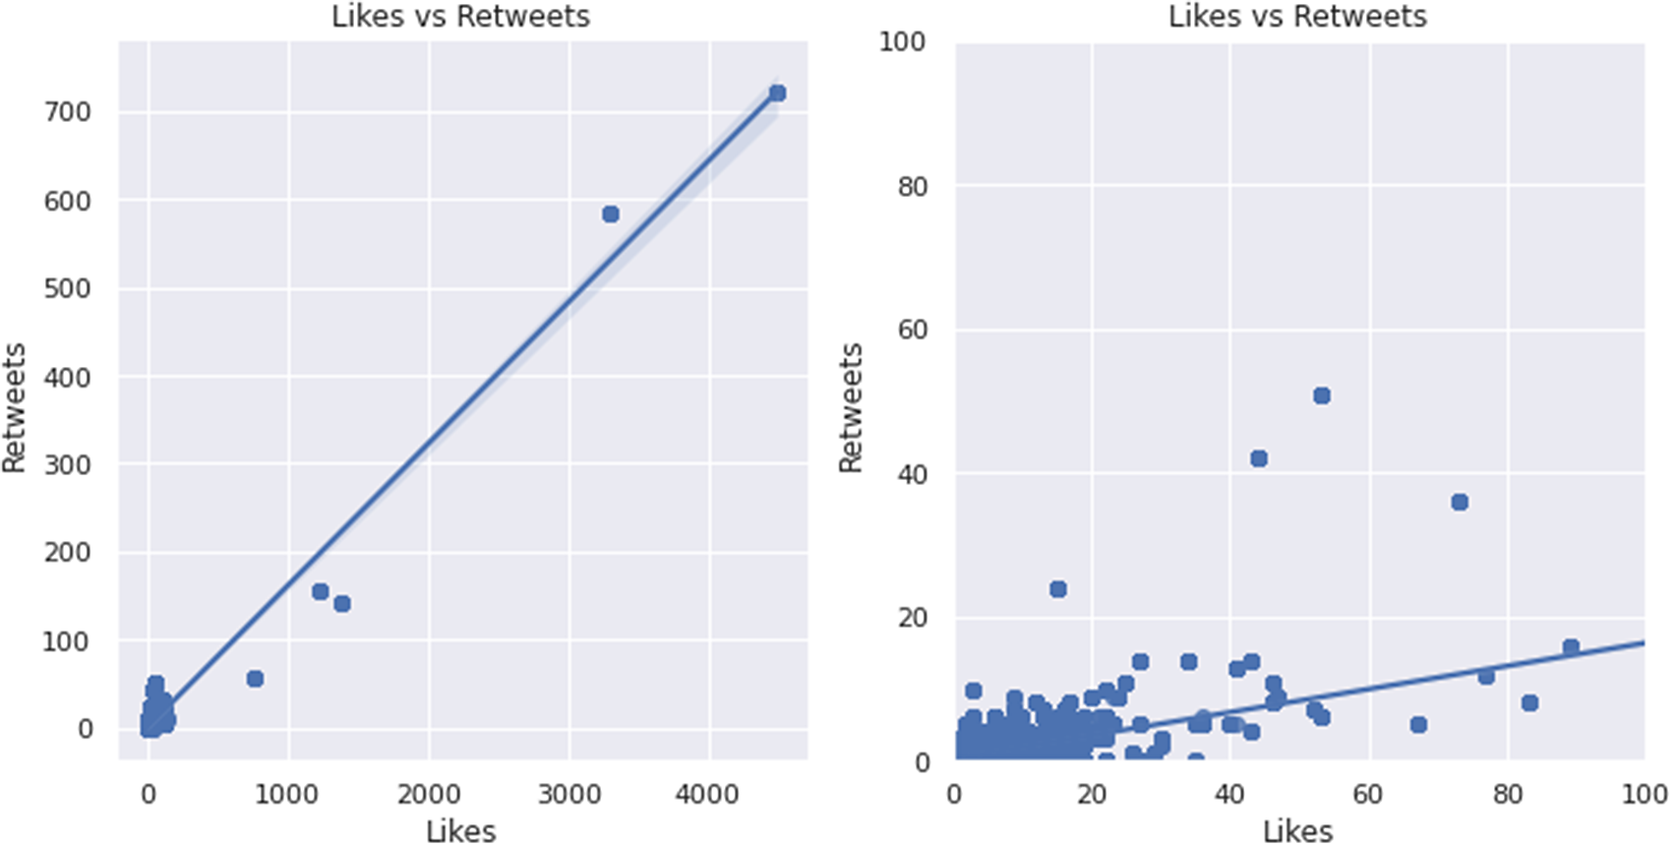
Figures 3–6 show scatterplots of metrics plotted against each other. In Figure 3, although not extremely strong, there is a positive correlation between view count and likes due to likes generally increasing as view count increases. Likewise, Figure 4 shows a positive correlation between likes and retweets, as retweets increase proportionally to likes. A noticeable trait revealed in Figure 5 was that generally, follower count does not have much of an effect on view count. However, at around 1.25E06 followers, the view count does seem to spike in a few cases. A red dotted line represents this spike. Similarly, as shown in Figure 6, word count does not have much of an effect on likes; however, at 32 words, there seems to be a spike in likes (denoted by a red dotted line), indicating a sweet spot for how long of post viewers seem to enjoy.
View count plotted against likes.
Note: The graph on the left is a zoomed-out version of the graph on the right.
Likes plotted against retweets.
Note: The graph on the left is a zoomed-out version of the graph on the right.
View count plotted against follower count.
Note: The red dotted line represents an estimate of the x value where a spike occurs as referenced in the paper.

View count plotted against the word count.
Note: As referenced in the paper, the red dotted line represents an estimate of the x value where a spike occurs.

5. Results
5.1. Keyword-frequency analysis
Now that an understanding has been reached concerning the representation of the dataset, a term-frequency analysis was conducted to find the 30 most frequently used words. As represented in Figure 7, a keyword-frequency analysis reveals that the 30 most frequent words are associated with technology, business and industry, environmental awareness, and discussion of the future. The high frequency of the word “blockchain” shows the prevalence of technology, specifically blockchain technology in conversations surrounding sustainability. Words such as “business”, “company”, “work”, and “project” signify business and industry being a prevalent topic. Words such as “energy”, “impact”, “environmental”, “community”, “world”, “waste”, “reduce”, “carbon”, “planet”, and “water” signify that discussion of environmental awareness and environmental problems are major topics of conversation, especially concerning carbon emission, water, and energy. The final topic of conversion prevalent from the top 30 words seems to be the discussion of future plans, signified by words such as “future”, “impact”, “work”, “make”, “need”, “create”, “time”, “reduce”, “practice”, and “change”.
Frequency of the top 30 keywords.

5.2. Topic model analysis
For this study, the number of topics to categorize the data into for the LDA model was set to 7 due to the output of coherence and perplexity scores, as well as intertopic distance for each trial when run with the number of topics ranging from 5 to 13. A lower perplexity score and a higher coherence score indicate the most optimal fit for the LDA model to the dataset. As seen in Table 2, 10 topics yields the best values for coherence and perplexity; however, 7 topics yielded a good balance between optimal coherence and perplexity scores as well as the best results for the intertopic distance (Figure 8). Figure 8, the intertopic distance plot for 7 topics, clearly has more distinct topics as the plot has no overlap and better spacing between topics. Figure 9, the intertopic distance plot for 10 topics, contains several overlaps indicating the topics are not distinct.
Coherence and perplexity for topics 5-13

Note. The optimal number of topics was chosen based on the coherence and perplexity scores as well as intertopic distance and topic results.
Latent Dirichlet Allocation (LDA) output visualization intertopic distance plots for 7 topics.
Note: The intertopic distance map represents the similarity between topics. More distinct topics are further away from each other. This plot represents the output for 7 topics, which was the number of topics used in this research.

Latent Dirichlet Allocation (LDA) output visualization intertopic distance plots for 10 topics.
Note: The intertopic distance map represents the similarity between topics. More distinct topics are further away from each other. This plot represents the output for 10 topics.

6. Discussion
From the output of the LDA model, it is apparent that the topics of discussion fall under the topics of the impact of technology on the environment and the future (Figure 10), climate action (Figure 11), community collaboration and education (Figure 12), natural resource conservation efforts (Figure 13), business and products (Figure 14), Environmental, Social, and Governance criteria (ESG) and infrastructure (Figure 15), and finally, investing and commerce (Figure 16).
Latent Dirichlet Allocation (LDA) output visualization for topic 1.
Note: The top-30 most relevant terms represent term relevance for the specific topic. Term relevancy is automatically calculated using Equation (1). Topic 1 corresponds to the impact of technology on the environment and the future.

Latent Dirichlet Allocation (LDA) output visualization for topic 2.
Note: The top-30 most relevant terms represent term relevance for the specific topic. Term relevancy is automatically calculated using Equation (1). Topic 2 corresponds to climate action.

Latent Dirichlet Allocation (LDA) output visualization for topic 3.
Note: The top-30 most relevant terms represent term relevance for the specific topic. Term relevancy is automatically calculated using Equation (1). Topic 3 corresponds to community collaboration and education.

Latent Dirichlet Allocation (LDA) output visualization for topic 4.
Note: The top-30 most relevant terms represent term relevance for the specific topic. Term relevancy is automatically calculated using Equation (1). The terms “helsh,” “campany,” and “bosh” in this topic are present due to an unfortunate limitation of being unable to filter out all bots that spam words such as these. Topic 4 corresponds to natural resource conservation efforts.

Latent Dirichlet Allocation (LDA) output visualization for topic 5.
Note: The top-30 most relevant terms represent term relevance for the specific topic. Term relevancy is automatically calculated using Equation (1). Topic 5 corresponds to business and products.

Latent Dirichlet Allocation (LDA) output visualization for topic 6.
Note: The top-30 most relevant terms represent term relevance for the specific topic. Term relevancy is automatically calculated using Equation (1). Topic 6 corresponds to Environmental, Social, and Governance criteria (ESG) and infrastructure.

Latent Dirichlet Allocation (LDA) output visualization for topic 7.
Note: The top-30 most relevant terms represent term relevance for the specific topic. Term relevancy is automatically calculated using Equation (1). Topic 7 corresponds to investing and commerce.

Topic 1, shown in Figure 10, corresponds to the impact of technology on the environment and the future (“blockchain”, “web3”, “impact”, “industry”, “investment”, “technology”, “innovative” “electric”, “transport”, and “partnership”).
Topic 2, shown in Figure 11, corresponds to climate action (“create”, “future”, “value”, “need”, “together”, “planet”, “towards”, “work”, “make”, “action”, “practice”, “climatechange”, “reducing”, “generation”, “carbon”, “food”, “change”, “protect”, “climateaction”, “build”, “farming”, and “eco-friendly”).
Topic 3, shown in Figure 12, corresponds to community collaboration and education (“community”, “secure”, “work”, “management”, “student”, “recycle”, “education”, “member”, “working”, “impact”, “reduced”, “responsible”, and “location”).
Topic 4, shown in Figure 13, corresponds to natural resource conservation efforts (“water”, “climate”, “emission”, “tree”, “mass”, “plant”, “plan”, “leader”, “change”, “green”, “improve”, “soil”, “part”, “excited”, and “crucial”).
Topic 5, shown in Figure 14, corresponds to business and products (“project”, “crypto”, “important”, “business”, “company”, “electriccar”, “electricvehicle”, “research”, “transport”, “strategy”, “development”, “job”, “new”, “clean”, and “category”).
Topic 6, shown in Figure 15, corresponds to Environmental, Social, and Governance criteria (ESG) and infrastructure (“esg”, “future”, “environment”, “company”, “greener”, “city”, “infrastructure”, “issue”, and “ecosystem”).
Finally, topic 7, shown in Figure 16, corresponds to investing and commerce (“store”, “mpi”, “mpi2022”, “gold”, “stablecoin”, “monetary”, “holder”, “backed”, “grv”, and “grvg”).
From the intertopic distance plot of 7 topics (Figure 8), it is apparent that topics 7 and 1 seem to be the most distinct from any other topics. Topics 6, 2, and 5 are close to each other yet not overlapping, showing that they have some similarities and may complement each other but do not overlap in content much. This close intertopic distance is represented in the overall topics clearly, as climate action and ESG/infrastructure are similar in content. Topic 3 and 4 are semi-close to each other but are not bordering or overlapping, indicating that they are relatively similar to each other, but to a lesser extent than topics 6 and 2. Generally, the fact that no topics overlap or touch indicates that the LDA model successfully identified distinct topics that do not overlap in content.
 $$ saliency\left( term\hskip0.35em w\right)= frequency(w)\ast \left[ sum\_t\hskip0.35em p\left(t\hskip0.35em |\hskip0.35em w\right)\ast \mathit{\log}\left(p\left(t\hskip0.35em |\hskip0.35em w\right)/p(t)\right)\right]\hskip0.35em for\ topics\hskip0.35em t $$
The overall saliency (2) (Figure 17), or in other words, the most important terms in the dataset, allows for a better understanding of the relationship between topics and terms (Chuang et al., Reference Chuang, Manning and Heer2012). The overall topic saliency, as shown in Figure 16, reveals that words such as “environment”, “blockchain”, “future”, “create”, and “water” are some examples of highly salient words that most contributed to the classification of a topic.
Latent Dirichlet Allocation (LDA) output visualization for overall term saliency.
Note: Saliency is a measure of the most important words in the dataset to classify topics. The method of calculation is listed in Equation (2).

6.1. Findings
The analysis of Twitter metrics frequency distribution, scatter plots over time, and correlation analysis all served to provide a solid foundation to understand the dataset and user engagement. The keyword-frequency analysis resulted in the overarching topics of technology, business and industry, environmental awareness, and discussion of the future. The LDA model resulted in the overarching topics of the impact of technology on the environment and the future, climate action, community collaboration and education, natural resource conservation efforts, business and products, Environmental, Social, and Governance criteria (ESG) and infrastructure, and finally, investing and currency. Both analyses overlap in the topics of environmental awareness, discussion of the future, business, and technology, thus showing that these topics can be concluded with certainty to be among the major topics of discussion under the #sustainability hashtag. The LDA model provided a more comprehensive view of the Twitter discourse, bringing in the topics of ESG and infrastructure, investing, collaboration, and education. The findings from both methods complement each other, where the frequency analysis provided a more general understanding of the discourse, and the LDA model provided a more detailed understanding.
6.2. Implications
The study has several implications for various stakeholders, including fellow researchers, social media influencers, businesses, organizations, and politicians. By identifying and understanding major topics around sustainability and Twitter discourse, social media influencers, businesses, organizations, and politicians can align their strategies and actions with the results of this study and better promote whatever content they are attempting to promote on Twitter. Furthermore, researchers can use this knowledge to guide further research or be informed on the topic of sustainability as it relates to social media. Other platforms, such as Instagram, Facebook, etc., may have similar userbases and thus may have similar discourse surrounding sustainability on their platforms, thus extending the application of this research to platforms outside of Twitter.
6.3. Limitations
This study possesses several limitations. One limitation lies in the data collection process. Snscrape, the Python tool used to collect the posts, is unable to filter by popular posts. Using popular posts instead of a random sample of posts would allow for a better understanding of user engagement and the major topics of discussion surrounding sustainability. Another limitation is that the dataset contains tweets that are spam, irrelevant, and created by bots. Although measures were taken to prevent posts created by bots, it is impossible to know for sure whether a tweet was created by a bot, therefore leading to spam in the dataset. One noticeable place in which the effect of this can be seen is with the terms “helsh”, “campany”, and “bosh” in this topic are present due to an unfortunate limitation of being unable to filter out all bots that spam words such as these. These words are nonsensical, irrelevant, and created by a bot that spams the messages repeatedly in mass amounts, thus influencing the dataset. Another limitation of this study is that the topics may not perfectly represent the discourse on Twitter, as the results of this study may be improved upon with a larger dataset, more preprocessing, and more preventative measures against bots. Additionally, this study may not fully represent the Twitter discourse surrounding sustainability as it only explores tweets within the #sustainability hashtag and only explores content on the Twitter platform, which is only one among many social media sites. Finally, this study has a limited time span, and only analyzes tweets that were posted in English, therefore not representing the discourse surrounding sustainability conversations in non-English contexts and discourse that lies outside of the time frame this study was conducted in.
7. Conclusion
The study was designed to classify and understand the major topics of discussion under the #sustainability hashtag as well as get an understanding of user engagement under this hashtag. Based on the keyword-frequency analysis and the topic model analysis, this research was able to conclude the most prominent topics of discussion under the hashtag #sustainability falls under: impact of technology on the environment and the future, climate action and conservation efforts, community collaboration and education in promoting sustainability, ESG criteria and business, and finally investing and commerce.
7.1. Areas for future research
Future work on this topic may improve upon several aspects. Future work could lead to a more extensive pre-processing process in which more effective measures are taken to filter out spam or bots. Furthermore, further research could obtain the top most popular posts rather than a random sample to better represent what most people are engaging with. Another improvement could be using a larger dataset, with representation from more hashtags, or gathering data from multiple sources besides Twitter. This study also only collected tweets in the English language, thus only representing topics among English-speaking users. Finally, future research could employ more analysis techniques (Bert Topic Modeling, LDA2Vec, SS-LDA, etc.) to classify the major topics of discussion, as this research has a wide variety of machine learning applications.
Acknowledgments
We are grateful for the Snsscrape library published on github by JustAnotherArchivist used to collect the Twitter posts in this study.
Author contribution
All aspects of this work were written independently and approved by Aydan Gerber.
Competing interest
The author declares none.
Data availability statement
Replication data is hosted on GitHub: https://github.com/AydanJG/A-Content-Analysis-Analyzing-Topics-of-Conversation-under-the-Sustainability-Hashtag-on-Twitter-.git.
Ethics statement
The research meets all ethical guidelines, including adherence to the legal requirements of the study country.
Funding statement
This research was not funded by any parties.


 Open access