


INTRODUCTION
Populism is an essential social science concept, and it is also an essentially contested concept (Mudde Reference Mudde, Kaltwasser, Taggart, Espejo and Ostiguy2017). Despite ongoing disagreement about its content, origins, and consequences (e.g., Aslanidis Reference Aslanidis2016; Rooduijn Reference Rooduijn2014), populism is en vogue, and the term is widely used among public intellectuals, politicians, and academic scholars. In the academic realm, a recent strand of social inquiry investigates populism at the individual level (Akkerman, Mudde, and Zaslove Reference Akkerman, Mudde and Zaslove2014; Hawkins, Riding, and Mudde Reference Hawkins, Riding and Mudde2012). Often referred to as the study of “populist attitudes,” this research starts from the assumption that populist ideas must resonate with the public to be influential (Hawkins and Rovira Kaltwasser Reference Hawkins, Kaltwasser, Hawkins, Carlin, Littvay and Kaltwasser2018; Spruyt, Keppens, and van Droogenbroeck Reference Spruyt, Keppens and van Droogenbroeck2016). Therefore, scholars examine how populist discourses, styles, and strategies among political elites correspond with the distribution of populist ideas among ordinary citizens (e.g., Castanho Silva et al. Reference Castanho Silva, Andreadis, Anduiza, Blanusa, Corti, Delfino, Rico, Ruth, Spruyt, Steenbergen, Littvay, Hawkins, Carlin, Littvay and Kaltwasser2018; Hameleers, Bos, and Vreese Reference Hameleers, Bos and de Vreese2017; Hawkins, Riding, and Mudde Reference Hawkins, Riding and Mudde2012; Hieda, Zenkyo, and Nishikawa Reference Hieda, Zenkyo and Nishikawa2019; Schulz et al. Reference Schulz, Müller, Schemer, Wirz, Martin and Wirth2018; Spruyt, Keppens, and van Droogenbroeck Reference Spruyt, Keppens and van Droogenbroeck2016). The promise of this line of research is that understanding populism at the individual level may help understanding populism at the societal level, thus promoting the comprehension of how the “Populist Zeitgeist” (Mudde Reference Mudde2004) affects health and outlook of pluralist democracies.
In this study, we take a step back and consider some unresolved problems regarding the concept structure of populism at the individual level. Responding to criticism that populist attitudes do not provide any theoretical import to the established public opinion literature, populism scholars have devotedly been discussing the conceptual core of populist attitudes, thereby achieving a notable convergence about the concept’s essential characteristics (Rooduijn Reference Rooduijn2019). Most scholars now concur that populist attitudes denote a multidimensional construct, composed of two or more concept components (Akkerman, Mudde, and Zaslove Reference Akkerman, Mudde and Zaslove2014; Castanho Silva et al. Reference Castanho Silva, Andreadis, Anduiza, Blanusa, Corti, Delfino, Rico, Ruth, Spruyt, Steenbergen, Littvay, Hawkins, Carlin, Littvay and Kaltwasser2018; Mudde and Rovira Kaltwasser Reference Mudde and Kaltwasser2013a; Oliver and Rahn Reference Oliver and Rahn2016; Schulz et al. Reference Schulz, Müller, Schemer, Wirz, Martin and Wirth2018; Stanley Reference Stanley2011). Although unanimity has not yet been reached about the exact content of these components, there is widespread agreement on the idea that populist attitudes lie at the intersection of the concept’s subdimensions (Castanho Silva et al. Reference Castanho Silva, Andreadis, Anduiza, Blanusa, Corti, Delfino, Rico, Ruth, Spruyt, Steenbergen, Littvay, Hawkins, Carlin, Littvay and Kaltwasser2018; Hameleers, Bos, and Vreese Reference Hameleers, Bos and de Vreese2017, 482; Hieda, Zenkyo, and Nishikawa Reference Hieda, Zenkyo and Nishikawa2019, 3; March Reference March2017, 283; Mudde and Rovira Kaltwasser Reference Mudde and Kaltwasser2013a, Reference Mudde, Kaltwasser, Freeden, Sargent and Stears2013b, 149; Spruyt, Keppens, and van Droogenbroeck Reference Spruyt, Keppens and van Droogenbroeck2016, 336, but see Hameleers, Bos, and Vreese Reference Hameleers, Bos and de Vreese2017, 482).Footnote 1 In other words, the supposed unique property of populist attitudes is the coexistence of its components. Hence, what distinguishes populist attitudes from similar attitudinal concepts is its status as an attitudinal syndrome, which only considers citizens as populists if, for instance, they accept anti-elitist views and a Manichean outlook and believe in unrestricted popular sovereignty. However, existing studies on populism at the mass level rarely transfer this crucial concept feature into empirical practice. Because of the apparent mismatch between the theoretically derived concept specification and the concept’s operational use, many populism studies do not measure what they are intended to measure, and therefore, the reported results do not necessarily speak about the concept under investigation.
Although we focus on the concept of populist attitudes, this study also highlights the general importance of aligning a measure’s mathematical structure with the target concept’s theoretical structure for valid inferences in social inquiry (cf. Goertz Reference Goertz2006, 125) and thus has implications for other non-compensatory multidimensional concepts beyond research on populism. Using inadequate operationalization strategies may yield dubious results. For instance, after thorough discussions on measurement-concept inconsistencies in studies on democratization (Collier and Mahon Reference Collier and Mahon1993; Goertz Reference Goertz2006; Munck and Verkuilen Reference Munck and Verkuilen2002), scholars began to derive non-compensatory measures of democracy, in which countries could not substitute low levels of electoral fairness with high levels of minority protection because both components constitute necessary elements of liberal democracies (Møller and Skaaning Reference Møller and Skaaning2012, 135). Similar arguments play a role in other research areas, where the presence of a concept depends on the simultaneous presence of all concept components such as deprivation (Alkire et al. Reference Alkire, Foster, Seth, Santos, Roche and Ballón2015), human development (Greco et al. Reference Greco, Ishizaka, Tasiou and Torrisi2019), or democratic support (Schedler and Sarsfield Reference Schedler and Sarsfield2007).
Using populist attitudes as an illustrative case, this study shows that different operationalization strategies of multidimensional concepts may ultimately yield diverging substantive inferences. For the study of populism on the individual level, deriving adequate operation strategies is particularly important as the conceptual value of populist attitudes hinges on the specification as a multidimensional concept with non-substitutable subdimensions. This article thus demonstrates how simple adjustments of empirical practices enable the blossoming literature on populist attitudes to avoid measures that misrepresent the object under investigation. Importantly, the presented analytical framework and the operational tools for aligning concept and measurement also apply to other manifestations of populism, such as party strategies or communication styles (e.g., March Reference March2017), and to other multidimensional concepts beyond populism research that are constituted by non-compensatory concept components.
To help overcome the inconsistency between theory and research practice, this article proceeds in several steps. Because any attempt to derive valid measures requires a solid understanding of the target concept, we first review debates about the essence of populist attitudes. We show that the idea proposed by populism scholars to ensure the concept’s field utility is largely neglected where the concept is put into empirical practice. Taking a broader perspective, we then argue that current empirical research relies on a paradigm for operationalizing latent constructs, which—despite its prevalence in public opinion research—is not suitable for multidimensional concepts with non-interchangeable concept components. Therefore, we draw on classical and modern approaches to concept formation to discuss strategies for the operationalization of non-compensatory concepts that enables us to take this distinct characteristic of populist attitudes seriously. Using data from 12 countries and five scales of populist attitudes, we show substantial disparities between individual populism scores derived from the existing methods compared with the new approach. Moreover, we demonstrate that these methods can lead to diverging conclusions about the relationship of populist attitudes with substantive variables of interest.
WHAT ARE “POPULIST ATTITUDES”?
Arguably, no other question surrounding populism has achieved as much attention as the question of what populism is. This inquiry can be divided into two sub-issues. First, there are the theoretical propositions that scholars associate with populism as a concept. Among other things, populism has been defined as mass movement or distinct form of mobilization (Barr Reference Barr2009; Jansen Reference Jansen2011; Kenny Reference Kenny2017), as a discourse (Laclau and Mouffe Reference Laclau and Mouffe1985), a thin-centered ideology (Mudde Reference Mudde2004), a frame (Aslanidis Reference Aslanidis2016), a style (Moffitt and Tormey Reference Moffitt and Tormey2014), a strategy or organization (Weyland Reference Weyland2001), a set of ideas (Hawkins Reference Hawkins2009), as a form of political representation (Caramani Reference Caramani2017), or a conception of democracy (Pappas Reference Pappas2016; Ubinati Reference Urbinati2019). Accordingly, there is no consensus about the essence of the concept. Second, scholars must also define the set of attributes that constitute populism. Depending on how populism is conceived of, the concept is characterized by numerous combinations from a set of at least a dozen different attributes, ranging from anti-elitism over polarization to the centralization of leadership and simplistic language (Rooduijn Reference Rooduijn2014, 578). Altogether, there is ongoing uncertainty about populism’s conceptual core.
However, notable conceptual convergence is apparent in scholarship on populism at the mass level. Most studies of populist attitudes (e.g., Akkerman, Mudde, and Zaslove Reference Akkerman, Mudde and Zaslove2014; Mohrenberg, Huber, and Freyburg Reference Mohrenberg, Huber and Freyburg2019; Schulz et al. Reference Schulz, Müller, Schemer, Wirz, Martin and Wirth2018; Spierings and Zaslove Reference Spierings and Zaslove2017) follow the ideational approach (Hawkins et al. Reference Hawkins, Carlin, Littvay and Kaltwasser2018) and start from the definition of populism as a so-called thin-centered ideology (Mudde Reference Mudde2004, 543; Reference Mudde2007, 23). Moreover, scholars mostly agree that populist attitudes consist of two or more essential components or subdimensions (Akkerman, Mudde, and Zaslove Reference Akkerman, Mudde and Zaslove2014; Castanho Silva et al. Reference Castanho Silva, Andreadis, Anduiza, Blanusa, Corti, Delfino, Rico, Ruth, Spruyt, Steenbergen, Littvay, Hawkins, Carlin, Littvay and Kaltwasser2018; Müller Reference Müller, Kaltwasser, Taggart, Espejo and Ostiguy2017; Schulz et al. Reference Schulz, Müller, Schemer, Wirz, Martin and Wirth2018; Stanley Reference Stanley2011). Anti-elitism is usually on the list of core dimensions (e.g., Castanho Silva et al. Reference Castanho Silva, Andreadis, Anduiza, Blanusa, Corti, Delfino, Rico, Ruth, Spruyt, Steenbergen, Littvay, Hawkins, Carlin, Littvay and Kaltwasser2018; Mudde and Rovira Kaltwasser Reference Mudde and Kaltwasser2013a; Schulz et al. Reference Schulz, Müller, Schemer, Wirz, Martin and Wirth2018; see Supplement 1). Disagreement persists about the exact definitions of the remaining components (Quinlan and Tinney Reference Quinlan and Tinney2019), for which scholars have suggested, for instance, support for popular sovereignty (Schulz et al. Reference Schulz, Müller, Schemer, Wirz, Martin and Wirth2018) or Manichean outlook on society (Castanho Silva et al. Reference Castanho Silva, Andreadis, Anduiza, Blanusa, Corti, Delfino, Rico, Ruth, Spruyt, Steenbergen, Littvay, Hawkins, Carlin, Littvay and Kaltwasser2018). In any case, despite disagreement about the number and denomination of concept components, the vast majority of scholars perceive populist attitudes as a multidimensional construct comprising anti-elitist attitudes and further orientations about the role of the people.
Yet this conception of populist attitudes faces questions about the concept’s theoretical import. Even more than other branches of populism research, the study of populism at the individual level is embedded in a field of inferences, where many similar concepts already exist (Geurkink et al. Reference Geurkink, Zaslove, Sluiter and Jacobs2019). In the public opinion literature, scholars for long have examined anti-elitist orientations under the rubrics of political cynicism (Agger, Goldstein, and Pearl Reference Agger, Goldstein and Pearl1961), efficacy (Niemi, Craig, and Mattei Reference Niemi, Craig and Mattei1991), trust (Miller Reference Miller1974), or support (Easton Reference Easton1975). Similarly, orientations toward popular sovereignty and homogeneity have been examined, for instance, in the national identity (e.g., Mader et al. Reference Mader, Scotto, Reifler, Gries, Isernia and Schoen2018) and ethnocentrism (e.g., Bonikowski and DiMaggio Reference Bonikowski and DiMaggio2016) literatures or by studies on citizens’ process preferences (Schedler and Sarsfield Reference Schedler and Sarsfield2007) and orientations toward representational roles (e.g., Katz Reference Katz1997). This list could be continued.
Importantly, the substantive overlap with existing public opinion constructs undermines the conceptual value of populist attitudes. Applying the criteria developed by Gerring (Reference Gerring1999) to evaluate concepts in the social sciences, concept differentiation and field utility suffer severely if populist attitudes are not more than the sum of established constructs. Concept differentiation refers to “the clarity of [concept] borders within a field of similar terms” (Gerring Reference Gerring1999, 376). Thus, concept differentiation is low when populist attitudes cannot be clearly distinguished from related constructs. Furthermore, conceptual overlap undermines field utility because populist attitudes may “steal referents from neighboring terms, leaving these terms as empty” (Gerring Reference Gerring1999, 383). Hence, if populist attitudes are to be added to the list of valuable public opinion constructs, the concept must bring to the table a theoretical proposition that is distinct and new.
In response to these challenges, populism scholars uphold that the distinct conceptual characteristic of populism at the mass level is the concept’s status as an attitudinal syndrome, which is defined in terms of necessary and sufficient conditions, more specifically by the simultaneous presence of the concept’s constituent components (Akkerman, Mudde, and Zaslove Reference Akkerman, Mudde and Zaslove2014, 1326; Castanho Silva et al. Reference Castanho Silva, Andreadis, Anduiza, Blanusa, Corti, Delfino, Rico, Ruth, Spruyt, Steenbergen, Littvay, Hawkins, Carlin, Littvay and Kaltwasser2018; Elchardus and Spruyt Reference Elchardus and Spruyt2016, 113, 120; Spierings and Zaslove Reference Spierings and Zaslove2017, 824; Spruyt, Keppens, and van Droogenbroeck Reference Spruyt, Keppens and van Droogenbroeck2016, 336; for a rare exception, see Hameleers, Bos, and Vreese Reference Hameleers, Bos and de Vreese2017, 482). In the words of Hawkins and Rovira Kaltwasser, the “peculiarity of the populist set of ideas lies precisely in the combination of these elements” (Hawkins and Rovira Kaltwasser Reference Hawkins, Kaltwasser, Hawkins, Carlin, Littvay and Kaltwasser2018, 6). By implication, when populist attitudes lie at the intersection of the concept components, individual populism scores cannot be high when anti-elitist orientations are low even when a person strongly supports the remaining components of populism. For instance, assuming a three-dimensional populism concept, understanding populist attitudes as an attitudinal syndrome suggests considering citizens as populists only if they exhibit anti-elitist orientations and a Manichean outlook and support popular sovereignty. Using a concept specification that treats the concept components as non-compensatory, that is, as jointly necessary for the presence of populism at the individual level, the concept of populist attitudes indeed would represent more than the sum of its parts.
However, even though many scholars implicitly or explicitly specify populist attitudes as an attitudinal syndrome with non-compensatory concept components at the theoretical level, few studies consider this property when applying the construct empirically (for exceptions, see Mohrenberg, Huber, and Freyburg Reference Mohrenberg, Huber and Freyburg2019; Vehrkamp and Wratil Reference Vehrkamp and Wratil2017). In many cases, the concept operationalization does not respect the necessary conditions. Instead, scholars obtain individual populism scores by computing weighted or unweighted averages across the concept dimensions. More specifically, scholars aggregate the concept attributes manually by computing mean values or using data-driven approaches such as factor analysis (e.g., Spierings and Zaslove Reference Spierings and Zaslove2017, 831; Spruyt, Keppens, and van Droogenbroeck Reference Spruyt, Keppens and van Droogenbroeck2016, 340). Regardless of the level of methodological sophistication, however, these aggregation methods have in common that higher values on one concept component can compensate for low values on other subdimensions. These operationalization strategies may, for instance, assign high populism scores to citizens who do not show slightest signs of anti-elitist sentiments. In contrast to the concept’s theoretical specification, these approaches might identify citizens as “populists” who strongly oppose giving power to the people or who strongly favor elitist rule. Hence, compensatory aggregation rules neglect the one theoretical proposition of the concept that is supposed to make it distinct from similar concepts, that is, its status as an attitudinal syndrome at the intersection of the concept components.
In the following, we argue that this compensatory operationalization approach is rooted in a measurement paradigm that is often applied to latent constructs but which is incompatible with constructs that presuppose necessary conditions as essential concept properties.
ON THE RELATIONSHIP BETWEEN CONCEPTS AND CONCEPT COMPONENTS
Concepts with two or more components such as populist attitudes can be understood as multilevel constructs with the concept’s essential core at the basic level, the concept subdimensions or concept components at the second, and the indicators at the third level (Goertz Reference Goertz2006, Reference Goertz2020). The psychometric literature on populist attitudes is usually concerned with the indicator level, investing considerable efforts into identifying adequate item batteries to capture the construct of interest (Akkerman, Mudde, and Zaslove Reference Akkerman, Mudde and Zaslove2014; Castanho Silva et al. Reference Castanho Silva, Andreadis, Anduiza, Blanusa, Corti, Delfino, Rico, Ruth, Spruyt, Steenbergen, Littvay, Hawkins, Carlin, Littvay and Kaltwasser2018; Hawkins, Riding, and Mudde Reference Hawkins, Riding and Mudde2012; Schulz et al. Reference Schulz, Müller, Schemer, Wirz, Martin and Wirth2018; Van Hauwaert, Schimpf, and Azevedo Reference Van Hauwaert, Schimpf and Azevedo2019). As long as the existence of second-level concept components does not complicate the operationalization of an attitudinal construct, the public opinion literature often views the unobservable concept of interest as the common cause of the observed measures at the indicator level. The general idea underlying this perspective, often associated with Bollen and Lennox (Reference Bollen and Lennox1991), is to view entities at one level as the effects of entities at the other level. Even though causality may go both ways,Footnote 2 the causal approach usually perceives observed measures as reflections of the unobservable concept.
The perspective of reflective causality has empirical implications. Because the observed indicators are seen as effects of a common cause (the latent concept), the indicators are expected to correlate with each other (Bollen and Lennox Reference Bollen and Lennox1991, 306; Edwards and Bagozzi Reference Edwards and Bagozzi2000, 158). Practically, this perspective suggests the use of factor analyses to assess the extent of inter-item correlation and to exclude indicators with unsatisfactorily low correlations. Methodologically, this approach regards differences between constructs at the same level as random measurement error. Random measurement error stems from unrelated constructs that exert influences in addition to the common latent construct and would cancel out by averaging across all constructs at one level. Consequently, the causal perspective views disparities between lower-order concepts as subordinate statistical entities without substantive meaning.
The causal perspective is common in the literature on populist attitudes where it is applied to the indicator level but—implicitly or explicitly—also to describe the relationship between the concept and the concept components (e.g., Castanho Silva et al. Reference Castanho Silva, Jungkunz, Helbling and Littvay2019; Hieda, Zenkyo, and Nishikawa Reference Hieda, Zenkyo and Nishikawa2019; Schulz et al. Reference Schulz, Müller, Schemer, Wirz, Martin and Wirth2018). What we call the Bollen approach to the operationalization of populism at the individual level considers populist attitudes as the common cause of the concept components, such as anti-elitist orientations and support for popular sovereignty (Figure 1, Panel A). Because the Bollen approach views the concept components as partly interchangeable, this perspective implies geometric or linear functions (summary scores, factor analyses) to aggregate concept components into composite indices (i.e., an individual score of populist attitudes). Empirically, the Bollen approach is the most common operationalization approach in the literature on populist attitudes (see Supplement 1 for an overview).
The Causal and the Ontological Perspectives on the Relationship Between Concept and Concept Attributes
Note: Similar illustrations were shown by Castanho Silva et al. (Reference Castanho Silva, Andreadis, Anduiza, Blanusa, Corti, Delfino, Rico, Ruth, Spruyt, Steenbergen, Littvay, Hawkins, Carlin, Littvay and Kaltwasser2018) and Wong, Law, and Huang (Reference Wong, Law and Huang2008).
Even though the causal paradigm serves well for most latent constructs, we argue that it is inept for non-compensatory multidimensional constructs, where each component constitutes a necessary condition for the presence of the concept. First, even though the causal perspective prescribes a correlation between the concept components, no theoretical argument implies such a correlation between the subdimensions in the case of populist attitudes. We do expect the components to overlap among some individuals as these are the individuals who hold populist attitudes (see Figure 1, Panel B). Yet we also expect that there are non-populist individuals who agree with none or only some of the components of populist attitudes. Hence, the concept of populist attitudes as an attitudinal syndrome describes attitudinal configurations among individuals, but it is agnostic about correlations between the concept attributes. Second, disregarding large differences between the attributes merely as a measurement artifact is incompatible with the unique property of populist attitudes as an attitudinal syndrome, for which low levels on one subdimension cannot be compensated for by higher levels on another one.
Altogether, these arguments suggest that the Bollen approach does not adequately characterize the relationship between the concept and its components in the case of multidimensional concepts with non-substitutable concept components such as populist attitudes. Instead of assuming that populist attitudes cause anti-elitist orientations and other orientations (Figure 1, Panel A), a more intuitive understanding of the concept suggests that populist attitudes are anti-elitist orientations in combination with other orientations (Figure 1, Panel B). Put differently, the relationship between the concept and the concept component is not a causal one but one of essence and identity.
AGGREGATION RULES FOR NON-COMPENSATORY CONCEPTS SUCH AS POPULIST ATTITUDES
The identity relationship between the concept and the concept components paves the way for alternative operationalization strategies for non-compensatory concepts, in which the aggregation rules are more closely aligned with the concept’s theoretical propositions. Having established that interchangeable subdimensions are incompatible with the unique concept property of jointly necessary concept components (qualifier of concept structure), different concept structures are conceivable (see Table 1). In the following, we contrast two prototypical concept structures that differ in the sharpness of the membership boundaries, that is, the quantifier of concept structure. The dichotomous quantifier presupposes clear boundaries and sets an all-or-nothing structure for the concept. The continuous quantifier, in contrast, presupposes gray space between the concept poles, indicating fine-grained differences between entities.Footnote 3 Hence, the quantifier defines whether the concept of populist attitudes separates populists from non-populists or whether we distinguish individuals by the degree to which they hold populist attitudes. If populist attitudes should be assessed with an either-or assertion or with a more-or-less assertion is not a question of right-or-wrong. Instead, the quantifier reflects the researcher’s conception of the construct.
Prototypical Concept Structures of Populist Attitudes
Note: In practice, quantifier and qualifier have more than two manifestations. The prototypical concept structures shown in Table 1 contrast no substitutability with medium substitutability (qualifier), yet other degrees of substitutability are also conceivable. Likewise, Table 1 contrasts two prototypical quantifiers, although ordinal quantifiers are also conceivable.
A dichotomous concept structure of populist attitudes, which takes the necessary conditions among the subdimensions into account, amounts to a Sartorian concept structure. Even though rarely employed in the populist attitude literature (but see Vehrkamp and Wratil Reference Vehrkamp and Wratil2017), we can draw on classical approaches to concept formation for its operationalization (Sartori Reference Sartori1970, Reference Sartori and Sartori1984). Specifically, the necessary conditions can be operationalized by setting thresholds among the attributes (see Supplement 2 for a comprehensive discussion of operationalization strategies). For example, one may specify that respondents need to agree or strongly agree on all anti-elitism- and popular-sovereignty-items to be counted as populists. If participants disagree with one or more items, they would be considered non-populists. The intuitive appeal of such thresholds is the transparency of the classification. This approach is particularly appealing if the cutoff points have informational value (e.g., above the mean or at the scale midpoint). Yet obvious cutoff points are often unavailable, which leads to an increased risk of inducing arbitrary choices or misuse of analytical discretion (Wuttke Reference Wuttke2019). More fundamentally, human evaluations of any given entity usually differ by degree. Therefore, based on the reasoning that continuous measures better resemble the mental representations of attitudinal constructs, cognitive sciences have generally departed dichotomous measures of attitudes (Murphy Reference Murphy2002). Against this backdrop, we conclude that the Sartorian concept structure is a reasonable approach, but practical and epistemological reasons speak against dichotomous measures as a standard choice for research on populist attitudes.
The Goertz concept structure merges elements of both approaches to concept formation already discussed. Building on work by Goertz (Reference Goertz2006, Reference Goertz2020), this concept structure employs Fuzzy Logic to combine the conceptual rigorousness of necessary attributes with the operational flexibility of continuous outcomes. Hence, like the Bollen approach, the Goertzian concept structure views individuals as differing by the degree to which they hold populist attitudes. Yet unlike the Bollen construct, the Goertzian approach does not classify individuals as high on populism if they disagree with one core component (e.g., anti-elitism). Instead, the Goertz construct structure requires the acceptance of all essential concept attributes for high populism scores. Rarely employed in practice (but see Mohrenberg, Huber, and Freyburg Reference Mohrenberg, Huber and Freyburg2019), several options are available for operationalizing Goertzian constructs (see Supplement 2). The easiest approach is to use the minimum value of the concept subdimensions.Footnote 4 The minimum represents the logical equivalent of the intersection in set theory. Using the minimum may appear statistically inefficient at first as this operationalization seems to disregard the information on all but the lowest attribute. However, as the mathematical representation of the minimum function shows (see further below), the computation of the minimum, in fact, does consider all attributes when identifying the attribute with the lowest value. More importantly, the minimum is the mathematical equivalent of the theoretical proposition that the lowest attribute determines the overall concept (cf. Goertz Reference Goertz2006, 138). Consequently, the Goertzian concept structure accounts for necessary conditions among the concept components while distinguishing varying degrees of accepting populist attitudes.
Altogether, we distinguish three approaches to operationalizing multidimensional concepts such as populist attitudes. These concept structures map the construct on different scales (quantifier), and the operationalization strategies reflect different perspectives on the substitutability of the concept components (qualifier). The conceptual analysis demonstrated that the Bollen operationalization fails to capture the unique theoretical proposition of populist attitudes. We presented two operationalization strategies that account for the non-compensatory relationship of the subdimensions, thereby taking populism seriously as an attitudinal syndrome. Among those operationalization strategies, the Goertz concept structure has the advantage of reflecting the nuances of human attitudes. Accordingly, epistemological and methodological reasons suggest a preference for the Goertz concept structure when operationalizing populist attitudes.
For empirical research, it is crucial whether this result of our analysis makes a difference for substantive conclusions. As these approaches employ different aggregation rules for combining the concept components into individual construct scores, it is plausible to expect that they yield different results. However, this cannot be taken for granted. We, therefore, turn to empirical analysis to explore whether the operationalization strategies matter for substantive findings.
DATA AND OPERATIONALIZATION
In our analysis of commonalities and disparities between the empirical representations of the Sartori, Bollen, and Goertz concept structures, we focus on three scales of populist attitudes: the populism scales by Akkerman, Mudde, and Zaslove (Reference Akkerman, Mudde and Zaslove2014), Castanho Silva et al. (Reference Castanho Silva, Andreadis, Anduiza, Blanusa, Corti, Delfino, Rico, Ruth, Spruyt, Steenbergen, Littvay, Hawkins, Carlin, Littvay and Kaltwasser2018), and Schulz et al. (Reference Schulz, Müller, Schemer, Wirz, Martin and Wirth2018). Due to limitations of space (see Supplement 5 on scale selection), results on additional scales of populist attitudes (CSES scale, scale by Oliver and Rahn Reference Oliver and Rahn2016) are reported in an interactive Shiny web application. Supplement 6 provides further practical information on using these scales to assess populist attitudes as an attitudinal syndrome.
All three scales analyzed in this study conceptualize populism at the individual level as multidimensional with three concept components and view anti-elitism as an essential element of populist attitudes. Yet, the scales differ slightly in the specification of the other two components (Schulz et al. Reference Schulz, Müller, Schemer, Wirz, Martin and Wirth2018: Sovereignty, Homogeneity; Castanho Silva et al. Reference Castanho Silva, Andreadis, Anduiza, Blanusa, Corti, Delfino, Rico, Ruth, Spruyt, Steenbergen, Littvay, Hawkins, Carlin, Littvay and Kaltwasser2018: People-centrism, Manichean Outlook; Akkerman et al. Reference Akkerman, Mudde and Zaslove2014: Sovereignty, Manichean Outlook; see Supplement 4 for question wordings). To give an impression of the measurement of populist attitudes, Table 2 shows the indicators of an adaption of the Schulz et al. populism scale (see Supplement 3 for differences between original scales and their adapted versions used in this study).
Items to Measure Populist Attitudes
Note: [R] indicates a reverse-coded item. Question wording from the German Longitudinal Election Study using a modification of the Schulz et al. populism scale, see Supplements 3 and 4 for details.
Importantly, although all considered scales conceptualize populist attitudes as multidimensional, they employ different strategies to account for the concept’s non-compensatory qualifier. By and large, the Schulz et al. and Castanho Silva et al. scales measure each subdimension separately with distinct items for each dimension. The Akkerman et al. scale, on the other hand, often uses double-barreled items that tap into more than one subcomponent, so that individuals only score highly when agreeing with all aspects that are mentioned in a survey item (e.g., “I would rather be represented by a citizen than by a specialized politician,” which taps into sovereignty orientations and anti-elitist orientations, see Table S6-1 for an overview of the scale items). The latter strategy has certain disadvantages such as the ambiguous meaning of low values or greater differential item functioning (see Supplement 14). However, it has the advantage of at least partly accounting for the concept’s non-compensatory dimensions before operationalization already at the stage of measurement. Note, however, that the individual Akkerman et al. items do not tap into all subcomponents (see Supplement 6). Therefore, grouping and aggregating the items into composite scores is still necessary and may thus lead to varying results depending on the operationalization strategy.
For the analysis in the main text, we make use of three data sources. First, we employ the Campaign Panel 2017 of the German Longitudinal Election Study (Roßteutscher et al. Reference Roßteutscher, Schmitt-Beck, Schoen, Weßels, Wolf, Preißinger, Kratz, Wuttke and Gärtner2018). Respondents for this multi-wave online survey were drawn from a heterogeneous online sample, using quotas that are representative of the German online population. The dataset offers a large sample of respondents (N = 13,563) and a rich set of substantively relevant variables, including an adaptation of the populism scale by Schulz et al. (Reference Schulz, Müller, Schemer, Wirz, Martin and Wirth2018). We use populism measures from survey wave 5, which was conducted between August 17 and August 28, 2017, one month before the German federal election (see Supplement 7 for descriptive tables of sample characteristics). To assess the Akkerman et al. and Silva et al. populism scales, we use another dataset from the German election study (Roßteutscher et al. Reference Roßteutscher, Schmitt-Beck, Schoen, Weßels, Wolf, Bieber, Stövsand, Dietz, Scherer, Wagner, Melcher and Giebler2019) that was collected using CAPI in the fall of 2017 among 2,112 respondents. In addition, we use data collected by Castanho Silva et al. (Reference Castanho Silva, Andreadis, Anduiza, Blanusa, Corti, Delfino, Rico, Ruth, Spruyt, Steenbergen, Littvay, Hawkins, Carlin, Littvay and Kaltwasser2018, Reference Castanho Silva, Jungkunz, Helbling and Littvay2019), which was kindly made available by the authors. The data were collected through MTurk and CrowdFlower between November 2016 and March 2017 in nine countries: Brazil, France, Greece, Ireland, Italy, Mexico, Spain, the United Kingdom, and the United States. The sample sizes vary between 505 (MTurk, USA) and 186 (CrowdFlower, Ireland) respondents. Note that the respondents interviewed in the GLES CAPI survey were randomly drawn from local population registration, whereas the GLES campaign panel and the Castanho Silva et al. datasets were both collected online using non-probability samples. In Supplement 8, we discuss potential sample biases and compare results from probability- and non-probability-based samples, which do not indicate systematic disparities by sampling strategy.
At the core of the Bollen approach is the (weighted) summation of the concept subdimensions into aggregate populism scores, where each subdimension also represents the (weighted) aggregation of multiple indicators.Footnote 5 Existing studies employ various computational strategies to aggregate the subdimensions into attitudinal populism scores, from simple means to exploratory or confirmatory factor analyses (see Supplement 1). In the main text, we opted to use the most transparent and straightforward aggregation technique: the average of the equally weighted concept subdimensions. More specifically, we first standardized all indicators to a mean of zero and a standard deviation of one. As discussed at greater length below, standardization was conducted for all operationalization approaches to ensure scale invariance of the concept subdimensions. The standardized indicators were then aggregated into subdimensions by computing the unweighted average score of the indicator. To attain Bollen populism scores, we computed the unweighted mean of the concept dimensions. Hence, according to this approach, populist attitudes form a continuous variable for which higher values on one subdimension may compensate for lower values on another subdimension and for which an increase on one subdimension always contributes to higher overall populism scores. More sophisticated aggregation methods yield similar substantive results (see Supplement 9).
 $$Bollen := \sum\limits_{i = 1}^ n {Weight_i \,\times\, Component_i } .$$
At the core of the Sartori and Goertz approach is the necessary condition that all subdimensions require high values to result in high populism scores. Various operationalization strategies are conceivable for various degrees of substitutability between concept subdimensions (see Supplement 2). However, the most straightforward operationalization strategy for a non-compensatory concept with a continuous scale (Goertz concept structure) is to use the minimum value of the concept subdimensions. Hence, higher values on one subdimension do not compensate for lower values on another subdimension. Moreover, individuals with low scores on one concept subdimension are not assigned high populism scores.
 $$Goertz := \min \left| {Component_1 , \ldots ,Component_n } \right|.$$
Operationalizing the Sartori concept structure involves setting thresholds for each subdimension. If individuals surpass these thresholds on all subdimensions, they are categorized as populists. Otherwise, individuals are considered non-populists. Although thresholds may differ across subdimensions, in the absence of meaningful theoretical reasons for differentiation, we set equal thresholds for all subdimensions. We opted for a threshold at the 75% percentile. Thus, populists are those individuals who embrace each subdimension of populist attitudes much more strongly than their fellow citizens. This threshold is, arguably, somewhat arbitrary and we report the results with other thresholds in Supplement 10.
 $$Sartori := \left\{ {\matrix{ 1 \hfill 	 \,\,{if\;Component_1 , \ldots ,Component_n> Threshold} \hfill \cr 0 \hfill 	 {else.} \hfill \cr } } \right.$$
To increase the transparency of methodology and results, we provide additional information in the Supplementary Files. Moreover, the aforementioned Shiny web application allows users to analyze the data underlying this study with an easy-to-use interface. Users may compute correlations between Bollen and Goertz populism scores with substantive variables of interest using additional survey samples that are not reported in the main text. In addition, users may examine the sensitivity of different Sartori thresholds when computing the shares of populist citizens in various populations (see http://populism.alexander-wuttke.de).
ANALYSIS
We examine the degree to which different strategies for the operationalization of populist attitudes lead to different empirical results in three steps. The first analysis examines the distribution of the different populism concept structures and the relationship between them. Having demonstrated substantial disparities between populism constructs, the next analytical step examines variations between countries and populism scales. In the third step, we examine whether different concept structures yield different conclusions about the relationship of populist attitudes with attitudinal variables of interest, institutional trust in particular.
We start by conducting descriptive analyses of the populism constructs to understand how the concept attributes give rise to composite scores of populist attitudes. For the dataset’s large sample size, we use the German campaign panel survey for the first analysis. Figure 2 shows univariate distributions and bivariate correlations of the three subdimensions of the Schulz et al. populism scale and how they relate to the Goertzian, Sartorian, and Bollen operationalizations of populist attitudes.
Distributions of and Correlations Between Concept Structures of Populist Attitudes and Concept Attributes (Germany, Schulz et al. Populism Scale)
Note: The scatterplots on the left show the joint distributions of the variables, which are labeled at the top of each column and on the right of each row. The variable at the column top is plotted on the scatterplot’s x-axis. Histograms show the distribution of the dichotomous Sartori measure. The plot’s diagonal row shows the univariate distribution of the variables labeled at the column’s top. The plot’s upper right panels show Pearson’s R correlation coefficients between continuous variables and boxplots for the Sartori measure. Data from the German panel survey. Plots were created using the ggally R-package.
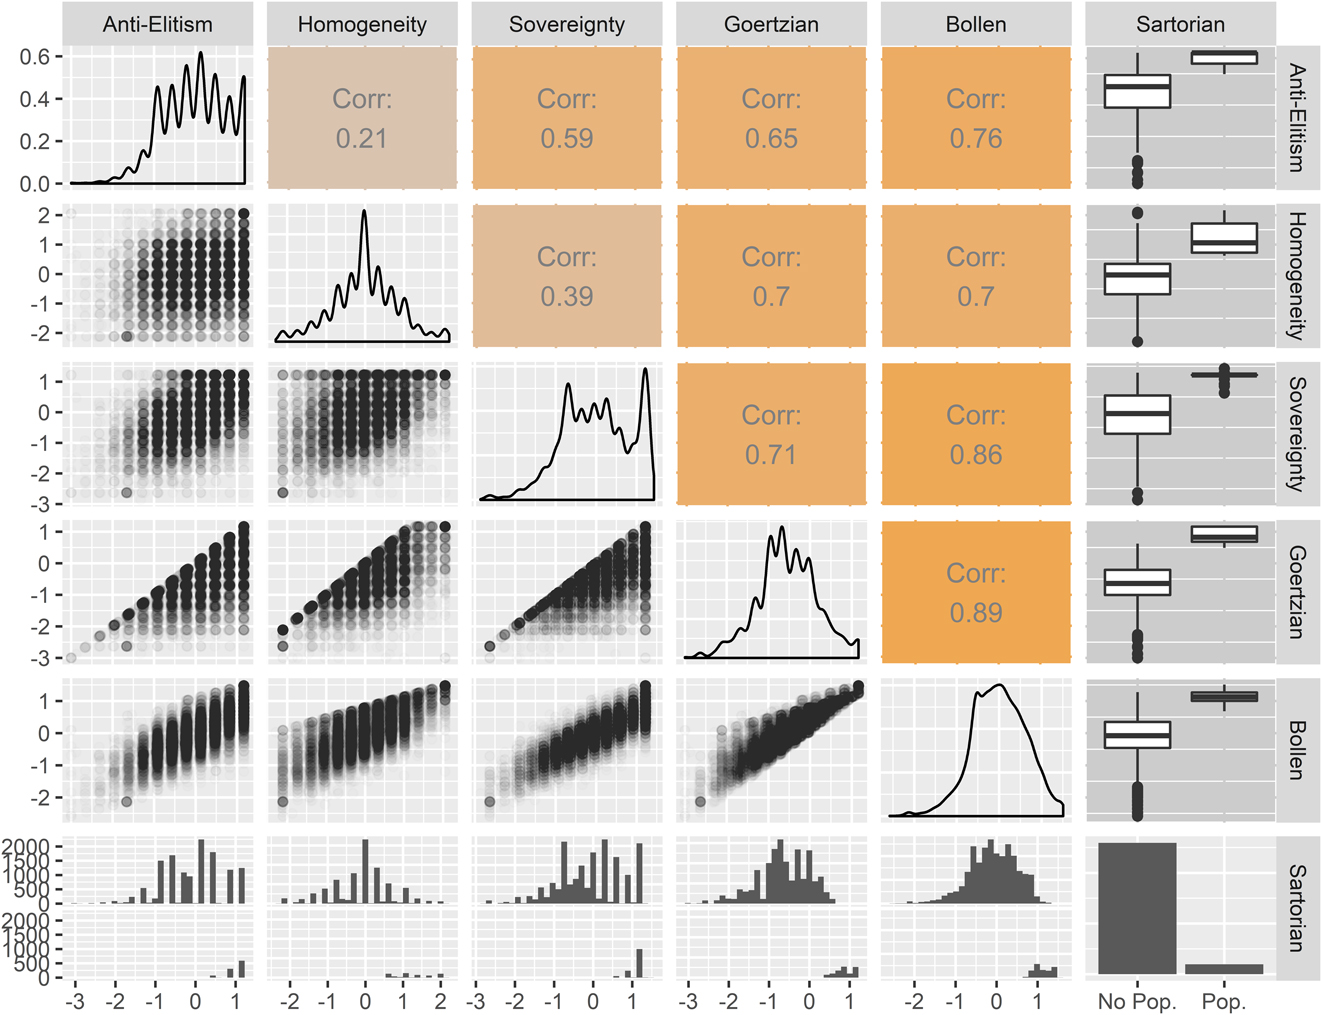
We first examine the empirical properties of populism’s concept subdimensions, inspecting the univariate distributions on the plot’s diagonal. Anti-elitist orientations and support for popular sovereignty are strongly right-skewed, whereas the acceptance of homogeneity is more or less normally distributed. The subdimensions are weakly to highly correlated with the strongest association between anti-elitism and popular sovereignty. Apparently, disdain for the political elites and support for the transfer of power into the hands of ordinary people often go hand in hand, at least among German respondents in the surveyed period. The case is different for the perception of popular homogeneity.Footnote 6 Many respondents in the sample hold strong anti-elitist views but do not perceive the populace as homogeneous. Consequently, the subdimensions of populist attitudes are statistically related, but they represent distinct political orientations.
The unbalanced correlations pattern between the subdimensions has implications for the aggregation of these subdimensions into populism scores. Because the Bollen populism scores follow from averaging across all concept attributes, it is not surprising that the Bollen concept structure is strongly correlated with the anti-elitism and the sovereignty subdimensions which themselves are very similar. At the same time, it has less in common with the homogeneity subdimension of populist attitudes. In contrast, the Goertz concept structure correlates to a similar degree with all subdimensions.Footnote 7 Hence, even with equal weighting factors, the level to which one subdimension is reflected in the Bollen populism score varies as it depends on the relative closeness of that subdimension to the other components of populism.
Turning to the consistency of concept and measurement, the Bollen operationalization does not fare well. The Bollen operationalization is vulnerable to concept-measurement inconsistencies if individuals are low on one subdimension but very high on the remaining subdimensions. Due to the empirical distribution of the homogeneity component, this hypothetical scenario appears rather plausible in the German dataset. Indeed, the joint scatterplot for the Bollen scores and the homogeneity subdimension in the bottom left of Figure 2 provides evidence for such inconsistencies. To some of the respondents, the Bollen operationalization assigns relatively high populism scores despite homogeneity scores close to zero. Concept-measurement inconsistencies in the Bollen populism scores are most prevalent for the homogeneity subdimension, but they can be observed for all concept attributes. If we take the argument seriously that individuals must accept all concept attributes to achieve high populism scores, then observing individuals with low values on one subdimension but fairly high populism scores is evidence that the Bollen approach fails to operationalize populism’s essential theoretical propositions.
This kind of concept-measurement inconsistency does not occur for the Sartorian and Goertzian concept structures. Examining the Sartori composite scores, the histograms in the plot’s lowest row show that Sartori populists hold anti-elitist views and support popular sovereignty and view the populace as a homogeneous unit. About five percent of the sample surpasses the threshold on all subdimensions and were categorized as populists. Consequently, populists exist at the mass level and proper operationalization enables measuring the share of populists within a society. If populist attitudes are conceived of as continuous, we can employ the Goertz concept structure. Inspecting the joint distribution of the Goertz populism scores and the concept components, one characteristic of the plot signals the desired properties of the Goertz concept structure: There is a clear-cut bisecting line in all these scatterplots, which is the graphical equivalent of the rule that populism scores must not be high if an individual is low on one subdimension. Hence, the Sartori and Goertz operationalization strategies ensure that high populism scores are assigned only to individuals who exhibit high values on all concept components.
Having established that not all concept structures respect the concept’s theoretical propositions of populism at the mass level, we assess the empirical commonalities and differences between these concept structures directly. The boxplots in the right-hand column report the distribution of the Goertzian and Bollen scores among populists and non-populists according to the Sartori operationalization. Among Sartori populists, the average Bollen populism score is lower than the average Goertz populism score. More importantly, among non-populist respondents, there are more individuals with high Bollen populism scores than individuals with high Goertz populism scores. In other words, the Bollen operationalization assigns high populism scores to several respondents whom the Sartori approach classifies as non-populists.
Finally, we compare the Bollen and Goertz concept structures. The German dataset shows a correlation of r = 0.89 between the measures, which is usually considered a strong association. We discuss the strength of this relationship at greater length below, but here it suffices to say that the correlation is notably different from 1. Hence, comparing the Bollen and Goertz populism scores leads to the first important conclusion: the operationalization strategy that most current populism studies employ does not always match the populism scores of the Goertz concept structure, which also entails a continuous scale but which strictly adheres to the concept’s theoretical propositions.
What is more, the discrepancies between the measures have systematic origins. As the scatterplot shows, the discrepancies mainly occur because the Bollen operationalization assigns high values to individuals with low Goertz scores. As we saw before, these cases refer to respondents for which the Bollen operationalization violates the concept’s theoretical proposition not to assign high values if one concept subdimension is low. Consequently, when the Bollen populism scores exceed the Goertz scores, then only the latter capture the distinctive position of populist attitudes at the intersection of its concept components. In contrast, in these cases, the Bollen scores tap into a mix of attitudinal concepts that are related to populism at the mass level but do not reflect the concept itself. Put differently, in case of a mismatch, the Bollen operationalization does not measure what it intends to measure, and the Goertz scores should be preferred.
So far, these results only speak to the distribution of populism scores as derived from one populism scale in one country. To examine the generalizability of these findings, the following analyses broaden the perspective by turning to the Castanho Silva scale in the United States, the largest sample in the Castanho Silva et al. replication dataset. Figure 3 shows that the anti-elitist subdimension of the Castanho Silva et al. scale is right-skewed, whereas the distribution of Manichean outlook orientation is left-skewed. Notably, these concept components of the Castanho Silva et al. scale are barely correlated. That is, knowing a person’s stance on political elites does not help predict her perception of good and evil in society. The fact that the subdimensions of populist attitudes are almost orthogonal in the US survey is noteworthy from a methodological perspective. The Bollen approach conceptualizes a person’s latent populist inclination as the common cause of the concept subdimensions, which implies that the subdimensions should be correlated. Therefore, a lack of correlations among them raises doubts about the psychometric quality of the measurement. In contrast, from the rivalling perspective whether an attitude is an essential component of populism at the individual level is not an empirical but an ontological question. Consequently, the approach that underlies the Sartori and Goertz operationalizations is fully compatible with low covariances. From this perspective, the implication of weakly correlated concept components merely is that few individuals hold populist attitudes because in most cases the building blocks of this concept are not jointly present.Footnote 8
Distributions of and Correlations Between Concept Structures of Populist Attitudes and Concept Attributes (United States, Castanho Silva et al. Populism Scale)
Note: The scatterplots on the left show the joint distributions of the variables which are labeled at the top of each column and on the right of each row. The variable at the column top is plotted on the scatterplot’s x-axis. Histograms are used to show the distribution of the dichotomous Sartori measure. The plot’s diagonal row shows the univariate distribution of the variables labeled at the column’s top. The plot’s upper right panels show Pearson’s R correlation coefficients between continuous variables and boxplots for the Sartori measure.
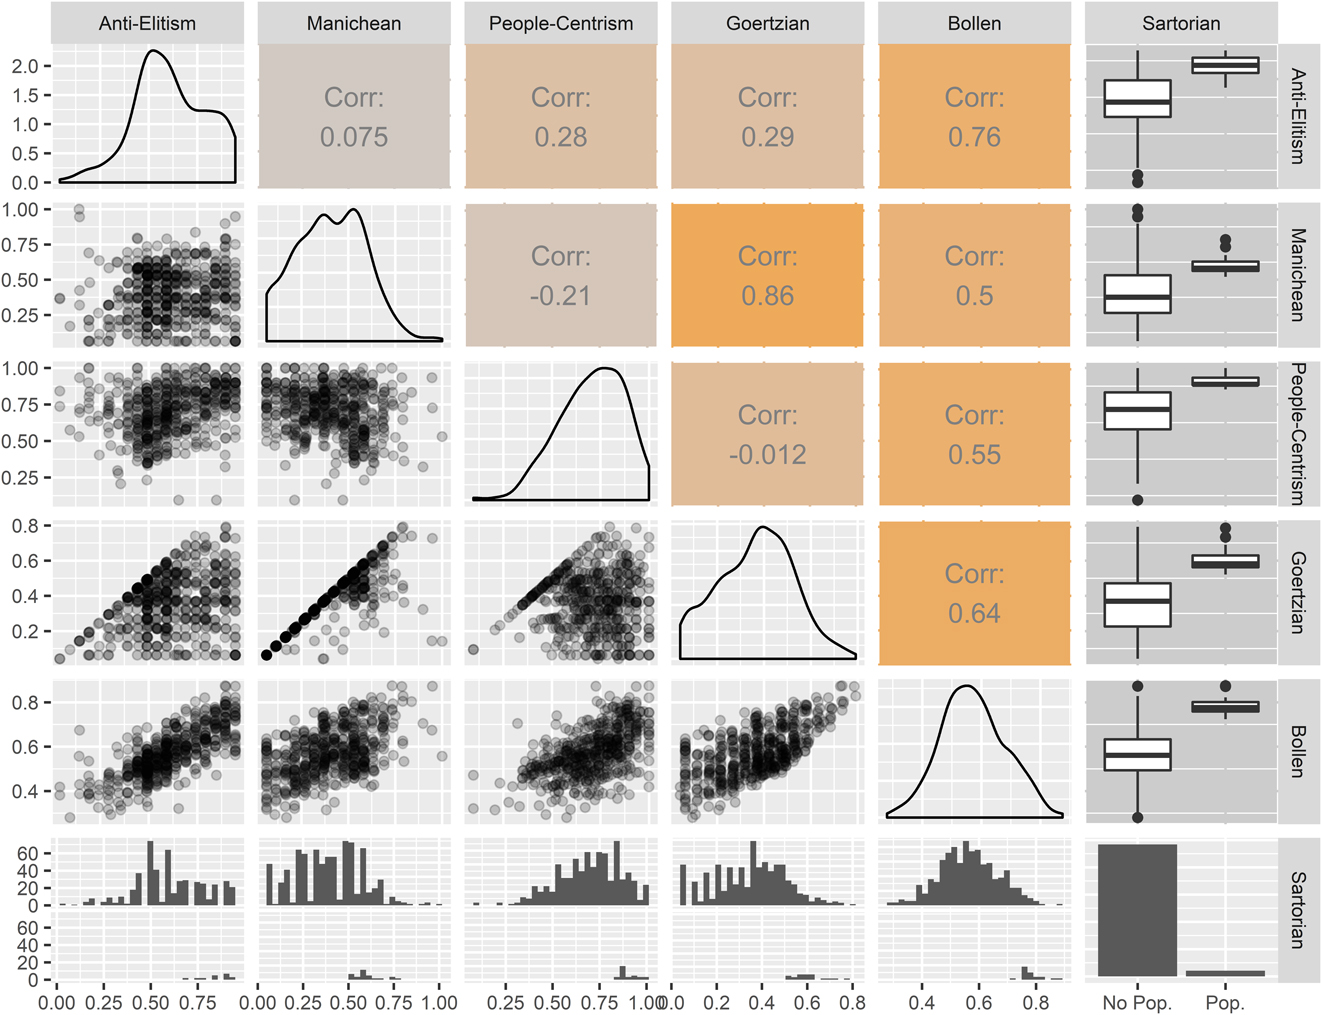
The magnitude of the covariance between the subdimensions affects the composite scores derived from compensatory or non-compensatory operationalization strategies.Footnote 9 Lower covariances imply a larger share of individuals who exhibit low values on one concept subdimension but high values on the remaining subdimensions. Because this configuration of attitudes leads to differences between the Goertz and Bollen populism scores, low component covariances tend to go along with higher disparities between composite populism scores (for simulations of this interdependency, see Supplement 11). Against this backdrop, it is little wonder that the correlation between the Bollen and Goertz scores amounts to r = 0.64 in the US dataset with the Castanho Silva et al. scale and is thus considerably lower than in the German dataset with the Schulz et al. scale (r = 0.89), considering that the covariance between components is much higher for the Schulz et al. scale. Hence, the weaker the correlation between the subdimensions, the larger the concept-measurement inconsistency of the Bollen operationalization.
This interdependency between the concept components and the composite scores has substantive ramifications for the extent of resulting disparities between operationalization strategies in research practice. Keeping in mind that not all populism scales specify populist attitudes in the same way, composite scores are most sensitive to operationalization strategies if scales conceptualize populist attitudes as constituted by conceptually remote attitudinal orientations. As scale properties also vary between samples, another implication is that composite scores of non-compensatory concepts are most sensitive to operationalization strategies in populations with lower covariances between the concept components.
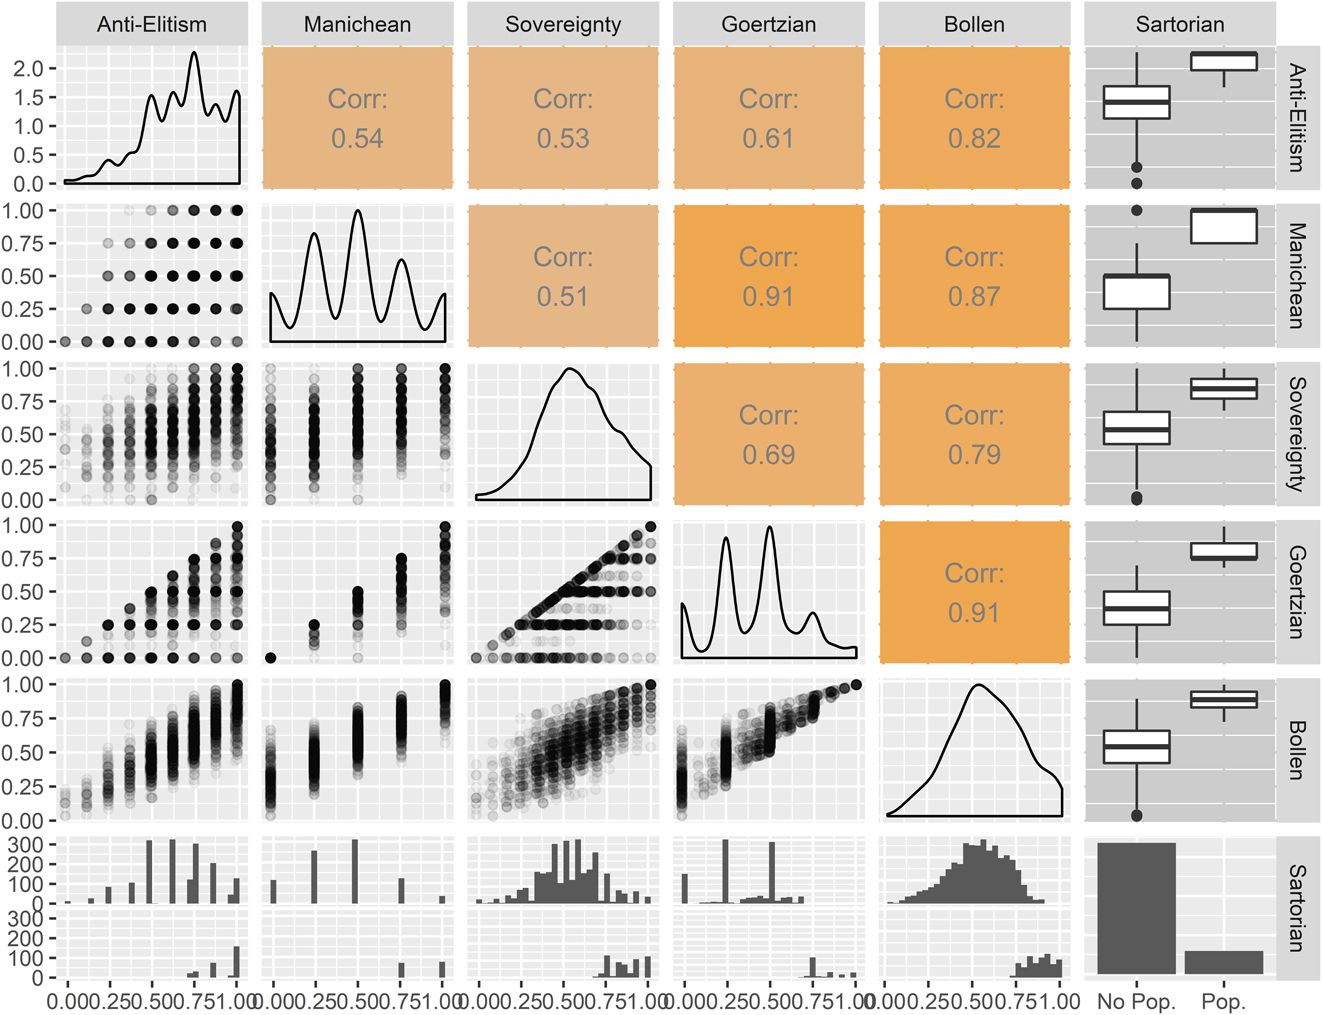
That the extent of measurement concept-inconsistencies varies across scales and countries is further emphasized by the internal structure of the Akkerman et al. populism scale, as observed in the German probability-based sample (Figure 4). Presumably partly due to the scale’s particular measurement strategy, the discrepancies between the Bollen and Goertz scores are the lowest of all the scales (r = 0.91). As the scale already considers, in part, the non-substitutability of the concept subdimensions at the measurement stage, it makes less of a difference whether we choose an operationalization strategy that is adequate for non-compensatory concepts. Note, however, that operationalizing the Akkerman et al. scale with either the Goertz or Bollen approach still does not yield identical results as their correlation coefficient is notably different from one.
Distributions of and Correlations Between Concept Structures of Populist Attitudes and Concept Attributes (Germany, Akkerman et al. Populism Scale)
Note: The scatterplots on the left show the joint distributions of the variables which are labeled at the top of each column and on the right of each row. The variable at the column top is plotted on the scatterplot’s x-axis. Histograms are used to show the distribution of the dichotomous Sartori measure. The plot’s diagonal row shows the univariate distribution of the variables labeled at the column’s top. The plot’s upper right panels show Pearson’s R correlation coefficients between continuous variables and boxplots for the Sartori measure. Data from the German cross-sectional election survey.
To broaden the view on the variation of discrepancies between operationalization strategies in different survey samples and populism scales, the next step of the analysis uses the Castanho Silva et al. replication dataset with survey data from nine countries. Figure 5 shows correlations (Pearson’s R) between the Goertz and Bollen concept structures for the Akkerman et al., Schulz et al., and Castanho Silva et al. populism scales. The figure provides two significant insights.
Correlations Between Goertz and Bollen Concept Structures of Populist Attitudes
First, the figure underscores the modest but notable variation in the similarity of the populism constructs depending on which scale is used and where the survey was conducted. The Goertz and Bollen scores of populist attitudes usually correlate at r = 0.8 when measured with the Schulz et al. scale. The Akkerman et al. scale exhibits slightly higher correlations in most cases. In comparison, the correlations of the composite scores of the Castanho Silva et al. scale lies on a lower level, between r = 0.39 in France and r = 0.63 in the United States. Figure 5 also shows some country differences. For instance, the populism constructs are more strongly correlated in the Italian sample than in other samples. Consequently, for future research on populist attitudes, it is important to note that the empirical implications of operationalization decisions differ between scales and samples.
Second, the results show that the discrepancies between the Goertzian and the Bollen populism scores are often substantial. None of the discovered correlations comes close to a perfect correlation of r = 1. In fact, all correlations in Figure 5 are smaller than r = 0.9, and many depicted correlation coefficients hover between r = 0.5 and r = 0.8. Correlations of this magnitude are usually conceived of as moderate to strong associations. However, when evaluating the correlation coefficients presented here, we have to keep in mind that these correlations do not pertain to different constructs. Rather, both of the correlated scores allegedly capture the same concept. Specifically, both populism scores were derived from the same data-generating process, and they only differ in the aggregation rule that was applied. Against this backdrop, even a correlation of, for example, r = 0.8 between the Goertz and Bollen scores is notable. A correlation of 0.8 means that knowing one variable only allows us to predict two thirds (64%) of the variance of the other populism score. Using a real-world analogy, the statistical association between populism constructs derived from the same indicators is about as strong as the correlation between arm-span and height (Reeves, Varakamin, and Henry Reference Reeves, Varakamin and Henry1996). In other words, the Bollen and the Goertz populism scores can be considered similar for many individuals, particularly when the Akkerman et al. scale is used, but they are far from identical when the Schulz et al. scale is used, and the scores differ even more noticeably for the Castanho Silva et al. scale.
So far, the analysis has established that the Bollen and Goertz constructs do not always derive identical populism scores, and when they diverge, the Bollen operationalization does not do justice to the essence of populism as an attitudinal syndrome with non-compensatory subdimensions. However, given the moderate to strong correlations, it is possible that both concept structures yield the same substantive results when analyzing the determinants and consequences of populist attitudes. If this was the case, the distinction between the concept structures would primarily be of theoretical value but less critical for applied empirical work, apart from the distribution of populist attitudes. Hence, we now turn to explore whether the choice between concept structures makes a difference in explaining other substantive variables.
Although it is impossible to address all relevant questions tackled in prior research, we selected some that, in our view, are of interest to empirical scholars in populism. To reduce analytical discretion and to enhance transparency, we opted for the simplest model possible: bivariate correlations. Due to limitations of space, we only show results on the Castanho Silva et al. scale in the main text using the authors’ cross-national dataset. Yet, the Shiny web application enables readers to investigate statistical associations between composite scores of populist attitudes and an extensive list of correlates using different datasets and scales. By and large and for most scales and samples, the analyses reveal weaker associations with Bollen populism scores compared with the Goertz construct of populist attitudes. Although these disparities often do not affect the substantive conclusions, in a few extreme instances, the correlations even point in different directions. The Castanho Silva et al. scale seems most sensitive to differences in operationalization strategies. Yet instances in which the substantive conclusion suggested by the Bollen construct does not square with findings with Goertz populism scores can be observed for all scales.
In the following analysis, we employ the Castanho Silva et al. replication dataset. The dataset only contains two potential correlates (conspiratorial thinking, institutional trust) but covers nine countries, thus demonstrating the robustness of findings in multiple samples. As reported in Supplement 12, correlations of Goertz and Bollen populism scores with conspiratorial thinking differ notably in size when they have the same sign, but often the correlations even point in opposite directions. In the following, we report findings for the second available variable, institutional trust. Institutional trust is measured by a summary score of trust in political parties, government, and parliament.Footnote 10
Institutional trust is a particularly interesting case because for this variable we might for theoretical reasons expect differences in the results for the Bollen and the Goertz concept structures. This expectation derives from the following reasoning. It is well established that stronger anti-elitist sentiments go hand in hand with lower levels of trust in political and societal institutions (Erber and Lau Reference Erber and Lau1990). After all, it is political elites that usually run these institutions. Beyond anti-elitism, however, it is more difficult to reason a substantive link between institutional trust and populist attitudes. It is not self-evident why other attributes of populist attributes (but see Urbinati Reference Urbinati2019), such as belief in a homogeneous citizenry, might go along with a person’s levels of institutional trust. Most importantly, it is not self-evident why the intersection of these attitudes should be associated with trust in institutions. As the Bollen construct reflects the average of all subdimensions, the respective populism scores react to changes on one subdimension regardless of the values on the other subdimensions. Bollen scores will thus reflect the correlation of institutional trust and anti-elitism in any case. The Goertz construct, by contrast, considers all concept components in combination and thus does not reflect changes of the subdimensions above the minimum. If anti-elitism happens to be not the subdimension with the minimum score, variation on it is irrelevant for Goertz populism scores. As the subdimension with the strongest relationship to institutional trust does not feed into the Goertz populism scores for all respondents, it is straightforward to expect that the Bollen scores exhibit stronger correlations with institutional trust than the Goertz scores do.
Figure 6 displays bivariate correlations between institutional trust and the Bollen and Goertz constructs of populist attitudes as well as with the concept’s subdimensions. As expected, there is a consistent negative association between anti-elitist orientations and trust in political institutions. Institutional trust is not associated with a Manichean outlook and not consistently associated with people-centrist attitudes. Hence, one subdimension of populist attitudes exhibits the expected link with the concept of interest, whereas the other subdimensions do not.
Bivariate Correlations with Institutional Trust (Castanho Silva et al. Populism Scale)
Note: In all samples, the difference between the correlation sizes of the Bollen and the Goertz concept structures is statistically significant (computed with the CoCor R-package).
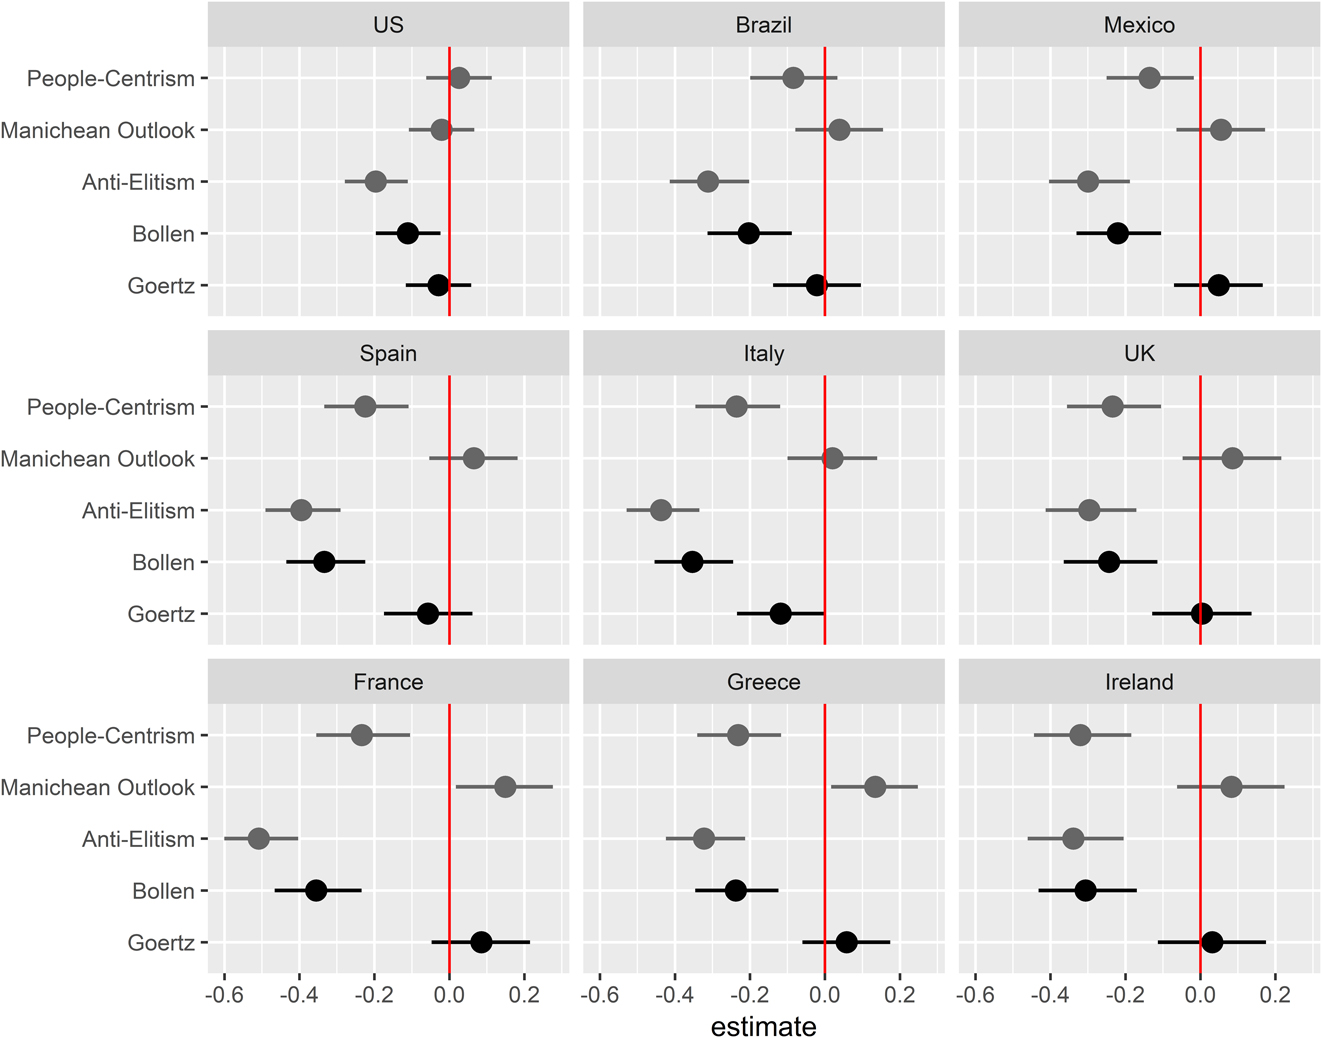
Figure 6 also shows a statistically significant correlation between populist attitudes and institutional trust for the Bollen populism scores. Considering the mathematical formula underlying the Bollen concept, it follows that the aggregated populism construct inherits partial correlations of the concept subdimensions. Using the Bollen operationalization blurs the distinction between the subdimensions of populist attitudes and the concept of populist attitudes itself as the conjunction of its concept components. Replicating previous findings in the public opinion literature on political cynicism (e.g., Erber and Lau Reference Erber and Lau1990), it is not surprising to observe an attitudinal linkage between a person’s alienation with political actors (anti-elitism) and the disdain for the organizations they represent (institutional trust). However, if the correlation of trust with the Bollen populism score is merely a remnant of the association with anti-elitism, then the reported correlation would represent the replication of old findings with a new name. The Bollen construct thus cannot distinguish whether a finding reflects the unique properties of populism or only that of one subdimension. Put differently, the Bollen concept structure leaves unclear whether a finding obtained with the construct is driven by the concept of interest, populist attitudes.
The Goertz concept structure captures the correlation between institutional trust and populist attitudes understood as an attitudinal syndrome rather than the shared variance of its subdimensions. Using this construct, different conclusions about populism’s relationship with institutional trust emerge. In eight out of nine countries, Figure 6 shows no meaningful correlation between institutional trust and the Goertz populism construct. Hence, the correlation observed when using the Bollen construct disappears if populism is adequately operationalized. In substantive terms, as many non-populists are equally critical of elites the analysis demonstrates that populist attitudes are not related to institutional trust.
The finding that different operationalization strategies of populist attitudes may yield inconsistent results when applied in correlative analyses is the keystone in a longer series of assessments we have conducted in this article. The preceding analyses demonstrated that composite scores of populist attitudes can differ to a smaller or larger degree, depending on the properties of scales and samples. These differences were shown to occur in cases when the Bollen concept structure fails to capture the concept’s core proposition but instead taps into related attitudinal constructs that are represented in populism’s subdimensions. While not necessarily the case, sometimes these concept-measurement inconsistencies of the Bollen approach can have consequences for substantive research because they can lead to wrong judgments about the nature and correlates of populism at the mass level. Consequently, scholars are well-advised to employ the Goertz or Sartori concept structures that are capable of reflecting populism as an attitudinal syndrome to capture the essence of populist attitudes in their empirical analyses.
CONCLUSION
The notion of a “populist Zeitgeist” (Mudde Reference Mudde2004) has given rise to a quickly growing research field on the prevalence, causes, and consequences of populist attitudes (e.g., Akkerman, Mudde, and Zaslove Reference Akkerman, Mudde and Zaslove2014; Tsatsanis, Andreadis, and Teperoglou Reference Tsatsanis, Andreadis and Teperoglou2018; Van Hauwaert, Schimpf, and Azevedo Reference Van Hauwaert, Schimpf, Azevedo, Hawkins, Carlin, Littvay and Kaltwasser2018). What makes populist attitudes valuable as a concept is the claim that populism at the mass level represents more than the sum of its parts. In its distinctive position at the intersection of the concept components, populist attitudes are not just another variant of concepts well-known to scholars of public opinion. This concept structure has to be taken into account when operationalizing populist attitudes in empirical research. Research thus far, however, often neglected the key characteristic of the concept, namely, that populist attitudes are an attitudinal syndrome with non-substitutable subdimensions. As a consequence, the mathematical structure of measures of populism and the concept’s theoretical structure fall apart (cf. Goertz Reference Goertz2006, 125). By implication, populism constructs often do not reflect what they are intended to measure. Prevailing practices thus put at risk the concept’s field utility and the differentiation from established concepts in public opinion research. In effect, critics may ask whether research on populist attitudes is just old wine in new bottles and may call for abandoning research on populist attitudes (cf. Geurkink et al. Reference Geurkink, Zaslove, Sluiter and Jacobs2019). We think this conclusion would be premature because populist attitudes are an original concept and empirical research on it may provide valuable insights, once the distinctive nature of the concept is taken seriously.
To overcome the current state of affairs and to protect research on populist attitudes against unjustified accusations, we proposed operationalization techniques that are capable of preserving the concept’s unique properties in empirical applications. We identified two suitable approaches. Both the Goertz and the Sartori approaches properly account for the necessary conditions of populist attitudes and are thus superior to the Bollen approach. They differ, however, in the assumptions about the nature of attitudes. While the Sartori approach builds on a dichotomous conception, the Goertz approach presupposes a continuous conception that is more adequate in attitudinal research and, therefore, the preferred strategy to operationalize populist attitudes. Considering that both approaches are not by necessity computationally more demanding than the widely used Bollen approach, this study suggests that for proper empirical analyses it is at least as important to align conceptual reasoning with computational practices as to demonstrate technical sophistication (e.g., Sartori Reference Sartori1970).
As applications of multidimensional concepts blossom in many subfields of political science, the discussion of concept structures in this article may help to carefully consider the theoretical properties of concepts with multiple concept components when creating or applying indicators in empirical research (see Supplement 2 for specific advice). This applies to populism research beyond the individual level, for example, populism of parties (March Reference March2017; Mudde and Rovira Kaltwasser Reference Mudde and Kaltwasser2013a) and other fields such as research on social capital (e.g., Putnam Reference Putnam2000). Other complex and currently debated concepts such as support for democracy (e.g., Schedler and Sarsfield Reference Schedler and Sarsfield2007), ideological orientations (Converse Reference Converse2006), political sophistication (e.g., Luskin Reference Luskin1987), public attitudes toward globalization (e.g., Mader, Steiner, and Schoen Reference Mader, Steiner and Schoen2019), and political extremism (e.g., Jungkunz Reference Jungkunz2019) are among the topics for which this suggestion may prove fruitful. In these and other fields of research, it seems worthwhile to consider whether central concepts involve non-compensatory subdimensions and whether prevailing operationalization strategies sufficiently account for these concept properties.
The evidence demonstrated that the Bollen approach’s vulnerability to concept-measurement inconsistencies can make a considerable difference for substantive conclusions about the prevalence, causes, correlates, and consequences of populist attitudes. This finding raises issues concerning the validity of results in prior research. The good news is that the evidence in this paper demonstrated that the aggregation rule does not always make a substantial difference. In some cases, the Bollen and Goertzian concept structures are highly correlated and may thus lead to similar substantive conclusions; in other cases, this does not apply (see Shiny web application: http://populism.alexander-wuttke.de). Whether measurement-inconsistencies occur and induce biases in correlative analyses varies between populations and populism scales. It is not the aim of this study to evaluate existing populism scales but to provide guidance for their proper operationalization. Nonetheless, the general pattern is noteworthy: non-compensatory operationalization strategies are most consequential for scales with low covariances between the subdimensions. In contrast, scales are less prone to concept-measurement inconsistencies when they have few subdimensions or already consider the non-compensatory properties at the stage of measurement even though the latter approach may result in a whole set of new challenges. In addition, measurement-inconsistencies of the Bollen concept structure are more likely to bias results of correlative analyses if one subdimension of populist attitudes drives the shared variance with a variable of interest. The relevance of concept-measurement misfit in prior research for substantive findings thus depends on empirical distributions. Our analysis may thus be read as a call for systematic testing of the validity of prior results. This, in turn, may make research on populist attitudes even more vibrant and foster its comparative outlook.
Taking populist attitudes seriously as a non-compensatory concept has implications for their role in politics. Given the nature of populist attitudes as lying at the intersection of different components, they resemble political ideologies that are at the core of political belief systems (Converse Reference Converse2006; Gerring Reference Gerring1997; Kinder and Kalmoe Reference Kinder and Kalmoe2017). As holding a coherent ideology is quite challenging, it is thus little wonder that we found populist attitudes to be not widely held by citizens. However, those citizens who hold populist attitudes in a strict sense subscribe to not only one but also several ideas that have a strained relationship with pluralist and representative forms government (Caramani Reference Caramani2017; Müller Reference Müller, Kaltwasser, Taggart, Espejo and Ostiguy2017; Urbinati Reference Urbinati2019). These appear to be people on which we cannot count when it comes to defending liberal democracy against its foes. What is more, strongly interconnected nodes of political belief systems such as ideologies are more resistant to persuasive influences, more easily accessible, and more consequential in affecting other attitudes and behaviors (Petty and Krosnick Reference Petty and Krosnick1995). It is thus implausible to expect citizens who subscribe to populism sensu stricto to be very responsive to attempts at making them more supportive of core ideas of representative democracy. In a sense, a more adequate measure of populist attitudes may thus paint a paler and brighter picture of the societal foundations of democracy: populist attitudes may be less widespread but more resistant to change than suggested by previous research.
As this paper sought to investigate the relationship among conceptual, methodological, and substantive issues, we would like to highlight the implications of a subtle methodological decision. Before aggregating them into populism scores, all items were z-standardized. This decision is consequential because standardization changes the substantive meaning of the measures from absolute to relative quantities. For instance, after standardization, the Sartori concept structure classifies those individuals as populists who accept all subdimensions of populism much more strongly, compared with the average respondent. Using relative measures raises two conceptual and empirical issues. Conceptually, some approaches to concept formation might hold that a concept’s boundary conditions must always be defined in absolute instead of relative terms (Sartori Reference Sartori1970). Empirically, relativist measures hinder the comparison of populism across time and space. Considering these arguments against standardization, it should be noted that standardization is not mandatory. For the Sartori concept, setting absolute thresholds is feasible based on the indicators’ substantive meaning and the researcher’s specification of populist attitudes. Likewise, researchers can use the minimum of unstandardized concept subdimensions to set the Goertzian construct. Unstandardized approaches, however, rest on the assumption of comparable measurement scales across dimensions. This assumption is not necessarily met, however, because researchers may have selected items with different item difficulties which affect the distributions. If differences in the distributions of subdimensions solely result from researcher choices during scale development and do not reflect substantive differences between the respondents toward the subcomponent’s essence, then the aggregation of unstandardized indicators is problematic. Such scoring issues are well known to qualitative researchers under the rubric of calibration (Goertz Reference Goertz2020) and have also gained attention in quantitative studies (Kolen and Brennan Reference Kolen and Brennan2014). In particular, recent advance in Item Response Theory (DeMars Reference DeMars2016; Liu and Chalmers Reference Liu and Chalmers2018) appears to show a promising way forward to operationalize non-compensatory multi-dimensional constructs without neglecting issues of scale incomparability. To conclude, standardization lowers the burden of assumptions about the data-generating process, but it has implications for the meaning of the derived measures. Researchers interested in comparing populist attitudes over time or in quantifying absolute levels might prefer absolute measures, but in turn, must pay close attention to the substantive meaning of the indicators and the scales that are used.
Altogether, populism has solidified its important role in contemporary politics. Given its substantive significance, the concept deserves careful analysis and adequate measurement in empirical applications to avoid biased estimates and invalid conclusions. Our analysis demonstrated that populist attitudes should be treated as an attitudinal syndrome that is more than the sum (or average) of its subdimensions. Otherwise, it would be difficult to justify populist attitudes as a specific concept in public opinion research. Obtaining valid composite scores for this concept requires operationalization strategies that differ from those widely used in previous research. By providing these conceptual and methodological suggestions, this article may prove helpful in paving the way for fruitful empirical research on an important political phenomenon of this era.
SUPPLEMENTARY MATERIAL
To view supplementary material for this article, please visit https://doi.org/10.1017/S0003055419000807.
To use the study’s Shiny Web Application, visit http://populism.alexander-wuttke.de/.
Replication materials can be found on Dataverse at: https://doi.org/10.7910/DVN/KPS1KY.


 Open access
Comments
No Comments have been published for this article.