

Major depressive disorder (MDD) is characterised by a persistently low mood and an inability to experience pleasure that is accompanied by disturbances in neurovegetative symptoms, in particular in sleep and appetite, impairments in cognitive functioning, and often feelings of guilt and suicidal ideation of varying intensity. 1 The diagnosis is made on the basis of clinical signs and symptoms from an assessment with the individual and additional information when available. However, at present, there are no biological measures which are diagnostic for depression or for any psychiatric disorder.
Findings from neuroimaging research though offer the potential to develop biomarkers which could aid in the diagnosis of depression.Reference Fu, Steiner and Costafreda 2 Structural neuroimaging studies of depression have revealed widespread cortico-limbic deficits in grey matter (GM)Reference Atkinson, Sankar, Adams and Fu 3 as well as in white matter (WM).Reference Cole, Chaddock, Farmer, Aitchison, Simmons and McGuffin 4 Moreover, regional atrophy in the hippocampus may already be present in the first episode of depressionReference Cole, Costafreda, McGuffin and Fu 5 and may worsen with recurrent episodes, in particular in patients with a more treatment-resistant form of depression.Reference MacQueen and Frodl 6 Similarly, alterations in WM integrityReference Cole, Costafreda, McGuffin and Fu 5 have been observed in the first episodeReference Zhu, Wang, Xiao, Zhong, Liao and Yao 7 and in adolescents at familial risk.Reference Huang, Fan, Williamson and Rao 8
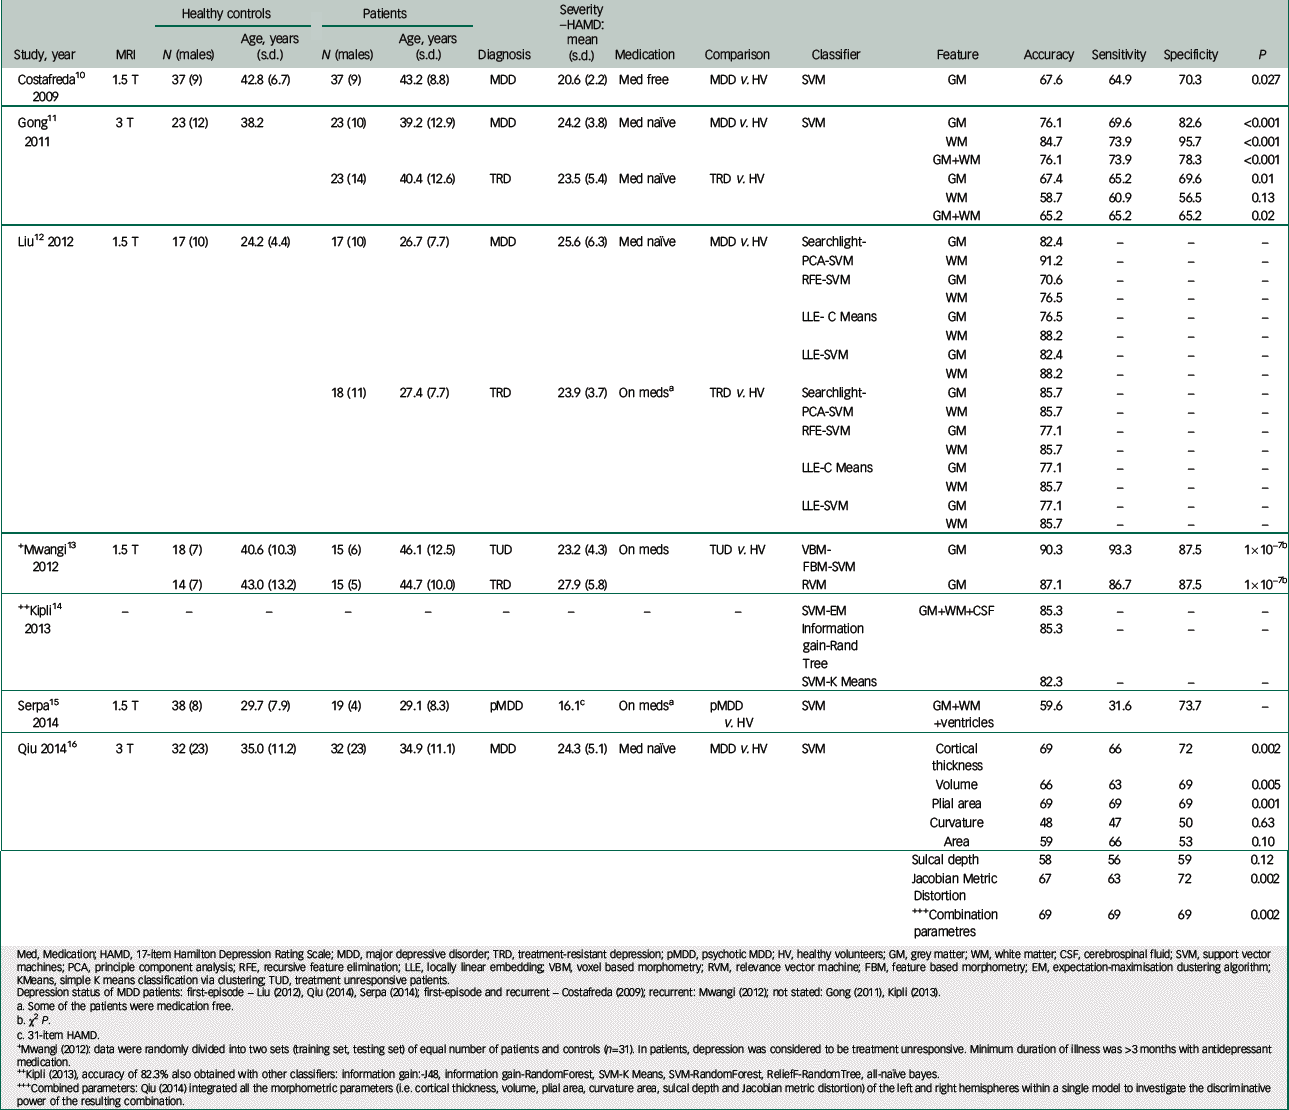
A number of studies have examined how well structural magnetic resonance imaging (MRI) data are able to diagnose depression. Structural MRI scans are non-invasive, may be readily acquired, and are generally well tolerated as they are relatively short scans and do not require participants to perform a specific task while in the scanner, providing an accessibility which is important for a potential biomarker. 9 Using structural MRI scans, the accuracy of diagnosis for depression has ranged from 48% to 91% (Table 1).Reference Costafreda, Chu, Ashburner and Fu 10 – Reference Qiu, Huang, Zhang, Wang, Kuang and Li 16 We would not expect to achieve a perfect accuracy with current diagnostic criteria that are based on clinical signs and symptoms which are not necessarily linked to aetiology.Reference Insel, Cuthbert, Garvey, Heinssen, Pine and Quinn 17 Rather we would expect that there would be an iterative process by which the factors contributing to the neuroimaging classification would be delineated and the classification findings would in turn lead to new hypotheses.Reference Fu and Costafreda 18
| Study, year | MRI | Healthy controls | Patients | Diagnosis | Severity –HAMD: mean (s.d.) | Medication | Comparison | Classifier | Feature | Accuracy | Sensitivity | Specificity | P | ||
|---|---|---|---|---|---|---|---|---|---|---|---|---|---|---|---|
| N (males) | Age, years (s.d.) | N (males) | Age, years (s.d.) | ||||||||||||
| CostafredaReference Liu, Guo, Yu, Gao, Gao and Xue 10 2009 | 1.5 T | 37 (9) | 42.8 (6.7) | 37 (9) | 43.2 (8.8) | MDD | 20.6 (2.2) | Med free | MDD v. HV | SVM | GM | 67.6 | 64.9 | 70.3 | 0.027 |
| GongReference Mwangi, Ebmeier, Matthews and Steele 11 | 3 T | 23 (12) | 38.2 | 23 (10) | 39.2 (12.9) | MDD | 24.2 (3.8) | Med naïve | MDD v. HV | SVM | GM | 76.1 | 69.6 | 82.6 | <0.001 |
| 2011 | WM | 84.7 | 73.9 | 95.7 | <0.001 | ||||||||||
| GM+WM | 76.1 | 73.9 | 78.3 | <0.001 | |||||||||||
| 23 (14) | 40.4 (12.6) | TRD | 23.5 (5.4) | Med naïve | TRD v. HV | GM | 67.4 | 65.2 | 69.6 | 0.01 | |||||
| WM | 58.7 | 60.9 | 56.5 | 0.13 | |||||||||||
| GM+WM | 65.2 | 65.2 | 65.2 | 0.02 | |||||||||||
| LiuReference Kipli, Kouzani and Hamid 12 2012 | 1.5 T | 17 (10) | 24.2 (4.4) | 17 (10) | 26.7 (7.7) | MDD | 25.6 (6.3) | Med naïve | MDD v. HV | Searchlight- | GM | 82.4 | – | – | – |
| PCA-SVM | WM | 91.2 | – | – | – | ||||||||||
| RFE-SVM | GM | 70.6 | – | – | – | ||||||||||
| WM | 76.5 | – | – | – | |||||||||||
| LLE- C Means | GM | 76.5 | – | – | – | ||||||||||
| WM | 88.2 | – | – | – | |||||||||||
| LLE-SVM | GM | 82.4 | – | – | – | ||||||||||
| WM | 88.2 | – | – | – | |||||||||||
| 18 (11) | 27.4 (7.7) | TRD | 23.9 (3.7) | On meds a | TRD v. HV | Searchlight- | GM | 85.7 | – | – | – | ||||
| PCA-SVM | WM | 85.7 | – | – | – | ||||||||||
| RFE-SVM | GM | 77.1 | – | – | – | ||||||||||
| WM | 85.7 | – | – | – | |||||||||||
| LLE-C Means | GM | 77.1 | – | – | – | ||||||||||
| WM | 85.7 | – | – | – | |||||||||||
| LLE-SVM | GM | 77.1 | – | – | – | ||||||||||
| WM | 85.7 | – | – | – | |||||||||||
| + MwangiReference Serpa, Ou and Schaufelberger 13 2012 | 1.5 T | 18 (7) | 40.6 (10.3) | 15 (6) | 46.1 (12.5) | TUD | 23.2 (4.3) | On meds | TUD v. HV | VBM-FBM-SVM | GM | 90.3 | 93.3 | 87.5 | 1×10– Reference Zhu, Wang, Xiao, Zhong, Liao and Yao 7 b |
| 14 (7) | 43.0 (13.2) | 15 (5) | 44.7 (10.0) | TRD | 27.9 (5.8) | RVM | GM | 87.1 | 86.7 | 87.5 | 1×10– Reference Zhu, Wang, Xiao, Zhong, Liao and Yao 7 b | ||||
| ++ KipliReference Qiu, Huang, Zhang, Wang, Kuang and Li 14 | – | – | – | – | – | – | – | – | – | SVM-EM | GM+WM+CSF | 85.3 | – | – | – |
| 2013 | Information gain-Rand Tree | 85.3 | – | – | – | ||||||||||
| SVM-K Means | 82.3 | – | – | – | |||||||||||
| SerpaReference Insel, Cuthbert, Garvey, Heinssen, Pine and Quinn 15 2014 | 1.5 T | 38 (8) | 29.7 (7.9) | 19 (4) | 29.1 (8.3) | pMDD | 16.1 c | On meds a | pMDD v. HV | SVM | GM+WM+ventricles | 59.6 | 31.6 | 73.7 | – |
| Qiu 2014Reference Fu and Costafreda 16 | 3 T | 32 (23) | 35.0 (11.2) | 32 (23) | 34.9 (11.1) | MDD | 24.3 (5.1) | Med naïve | MDD v. HV | SVM | Cortical thickness | 69 | 66 | 72 | 0.002 |
| Volume | 66 | 63 | 69 | 0.005 | |||||||||||
| Plial area | 69 | 69 | 69 | 0.001 | |||||||||||
| Curvature | 48 | 47 | 50 | 0.63 | |||||||||||
| Area | 59 | 66 | 53 | 0.10 | |||||||||||
| Sulcal depth | 58 | 56 | 59 | 0.12 | |||||||||||
| Jacobian Metric Distortion | 67 | 63 | 72 | 0.002 | |||||||||||
| +++ Combination parametres | 69 | 69 | 69 | 0.002 | |||||||||||
Med, Medication; HAMD, 17-item Hamilton Depression Rating Scale; MDD, major depressive disorder; TRD, treatment-resistant depression; pMDD, psychotic MDD; HV, healthy volunteers; GM, grey matter; WM, white matter; CSF, cerebrospinal fluid; SVM, support vector machines; PCA, principle component analysis; RFE, recursive feature elimination; LLE, locally linear embedding; VBM, voxel based morphometry; RVM, relevance vector machine; FBM, feature based morphometry; EM, expectation-maximisation dustering algorithm; KMeans, simple K means classification via clustering; TUD, treatment unresponsive patients.
Depression status of MDD patients: first-episode – Liu (2012), Qiu (2014), Serpa (2014); first-episode and recurrent – Costafreda (2009); recurrent: Mwangi (2012); not stated: Gong (2011), Kipli (2013).
a Some of the patients were medication free.
b χ2 P.
c 31-item HAMD.
+ Mwangi (2012): data were randomly divided into two sets (training set, testing set) of equal number of patients and controls (n=31). In patients, depression was considered to be treatment unresponsive. Minimum duration of illness was >3 months with antidepressant medication.
++ Kipli (2013), accuracy of 82.3% also obtained with other classifiers: information gain:-J48, information gain-RandomForest, SVM-K Means, SVM-RandomForest, ReliefF-RandomTree, all-naïve bayes.
+++ Combined parameters: Qiu (2014) integrated all the morphometric parameters (i.e. cortical thickness, volume, plial area, curvature area, sulcal depth and Jacobian metric distortion) of the left and right hemispheres within a single model to investigate the discriminative power of the resulting combination.
Factors which contribute to the accuracy of the generated classification include the subtype of depression examined, features of the brain imaging measure which were included, and the method of analysis. Some of the highest accuracies have been achieved in patients with a well-recognised and more treatment-resistant form of depressionReference Gong, Wu, Scarpazza, Lui, Jia and Marquand 11 , Reference Mwangi, Ebmeier, Matthews and Steele 13 who were taking a number of medications.Reference Mwangi, Ebmeier, Matthews and Steele 13 The identification of depression seems to show an improved accuracy with the inclusion of WM rather than that from GM alone,Reference Gong, Wu, Scarpazza, Lui, Jia and Marquand 11 , Reference Liu, Guo, Yu, Gao, Gao and Xue 12 and neuroimaging analysis methods which bring together measures from a number of regions are better able to detect widespread, subtle anatomical changes.Reference Fu, Steiner and Costafreda 2 , Reference Fu, Mourao-Miranda, Costafreda, Khanna, Marquand and Williams 19 However, studies to date had included individuals who were predominantly from the same ethnicity: CaucasianReference Costafreda, Chu, Ashburner and Fu 10 , Reference Mwangi, Ebmeier, Matthews and Steele 13 and Chinese.Reference Gong, Wu, Scarpazza, Lui, Jia and Marquand 11 , Reference Liu, Guo, Yu, Gao, Gao and Xue 12 , Reference Qiu, Huang, Zhang, Wang, Kuang and Li 16 Ethnicity is moderating factor for functional brain responses in healthy participants,Reference Akdeniz, Tost, Streit, Haddad, Wüst and Schäfer 20 while an effect on structural neural features may be more mixed with evidence of differences in cortical thickness in frontal and parietal regionsReference Chee, Zheng, Goh, Park and Sutton 21 but not in hippocampal asymmetry.Reference Lucarelli, Peshock, McColl, Hulsey, Ayers and Whittemore 22 Ethnicity could thus impact on potential functional MRI-based markers while structural MRI-based markers may be more robust.
In the present study, we sought to examine how well structural MRI scans would identify patients with the form of depression that is most commonly observed in the community in an ethnically diverse sample of Asian, African and Caucasian descent, who were suffering from either their first or a recurrent form of depression and were all medication-free. We applied a multivariate imaging pattern analysis method which integrates regional cerebral data, namely optimally discriminative voxel-based analysis,Reference Zhang and Davatzikos 23 , Reference Zhang and Davatzikos 24 and we examined the accuracy of diagnosis based on GM, WM and their combination using a support vector machine (SVM) method.Reference Gaonkar and Davatzikos 25 We expected that GM would demonstrate a high diagnostic accuracy for depression and that an even higher accuracy may be achieved with WM in the multi-ethnic sample.
Method
Study design and participants
This is an open-label study which was approved by the Cambridgeshire 4 Research Ethics Committee. Patients were recruited from the local community by newspaper advertisements, and all participants provided informed written consent. The study was conducted in conformity with the Declaration of Helsinki and its amendments.
Participants were patients with MDD (n=23) and healthy controls (n=20), right-handed and matched for age, gender and IQ (all P>0.3) (Table 2). A diagnosis of MDD, single or repeated episode MDD without psychotic features, was made as defined by Diagnostic Statistical Manual of Mental Disorders, Fourth Edition, Text Revision 26 and assessed with the Structured Clinical Interview for DSM-IV Axis I Disorders (SCID-IV)Reference First, Spitzer, Gibbon and Williams 27 without any comorbid disorders. All patients had a minimum score of 18 on the 17-item Hamilton Depression Rating Scale (HAMD)Reference Hamilton 28 at the time of study entry and were free of antidepressant medication for a minimum of 4 weeks before the start of the study (or 6 weeks for fluoxetine). Healthy controls had no history of psychiatric disorders, interviewed with SCID-IV,Reference First, Spitzer, Gibbon and Williams 27 and had an HAMD score of ≤7. MRI scans were acquired at baseline (week 0) and at weeks 1, 8 and 12. MDD patients received treatment with an antidepressant medication following the baseline assessment.Reference Fu, Costafreda, Sankar, Adams, Rasenick and Liu 29

| MDD patients | Healthy controls | P | |
|---|---|---|---|
| Participants, n | 23 | 20 | |
| Age, years: mean (s.d.) | 39.8 (11.2) | 38.8 (9.9) | 0.84 |
| Male, n (%) | 13 (56.5) | 12 (60.0) | 0.82 |
| Ethnicity, n (%) | |||
| Asian | 8 (34.8%) | 3 (15.0%) | |
| Black/African American | 2 (8.7%) | 5 (25.0%) | |
| Caucasian | 13 (56.5%) | 12 (60.0%) | |
| Baseline scores, a mean (s.d.) | |||
| HAMD | 22.0 (2.9) | 0.5 (1.1) | <0.001 |
| HAMA | 20.7 (5.4) | n/a | |
| Week 12 scores, a mean (s.d.) | |||
| HAMD | 6.9 (4.6) | 0.6 (1.3) | <0.001 |
| HAMA | 7.5 (4.4) | 0.6 (1.1) | <0.001 |
| Full IQ | 107.8 (10.7) | 109.2 (14.6) | 0.63 |
| Performance IQ | 103.2 (14.4) | 107.9 (15.2) | 0.3 |
| Verbal IQ | 110.0 (9.9) | 109.8 (12.4) | 0.95 |
HAMA, Hamilton Scale for Anxiety; HAMD, 17-item Hamilton Rating for Depression; MDD, major depressive disorder; n/a, not assessed.
a Ratings were acquired at baseline, during an acute depressive episode and following 12 weeks of treatment for patients, and at baseline and at the 12-week follow-up for healthy participants.
The present study focuses on the baseline data while MDD patients were in an acute depressive episode. Baseline MRI scans were obtained from 29 MDD patients and 22 healthy controls. Data from two healthy volunteers had to be excluded due to excessive movement during the structural MRI scan. The present study consists of those participants who had completed all the scans in the study: 23 MDD and 20 healthy controls, as the SVM analysis requires approximately equal numbers of participants.
Data acquisition
Structural MRI scans were acquired on a 3-T GE SIGNA HDx (Milwaukee, USA) at King's College London. A structural image was acquired at each session: Magnetisation Prepared Gradient Echo, resolution 1 mmReference Atkinson, Sankar, Adams and Fu 3 , acquisition parameters: echo time (TE): 2.85 ms, reaction time (TR): 6.98 ms, flip angle: 8°, slice thickness: 1.2 mm, interslice gap: 1.2 mm, field of view: 260 mm, matrix size: 64×64.
Image preprocessing
Preprocessing of the structural MRI T1 weighted images included bias correction, skull stripping and tissue segmentation. Bias correction was performed using N41TK, which is an improved MNI_N3 bias correction software package available at http://www.insight-journal.org/browse/publication/640package. Skull stripping was completed using Multi-Atlas Skull Stripping software (MASS, version 1.0), which is based on a multi-atlas registration framework and uses a set of templates from the study data set which best represents the anatomical variations.Reference Doshi, Erus, Ou, Gaonkar and Davatzikos 30 The images were then segmented into GM, WM and cerebrospinal fluid (CSF) using the automated algorithm Multiplicative Intrinsic Component Optimization (MICO).Reference Li, Gore and Davatzikos 31 The quality of the processed images was ensured by automated quality control measures and manual review.
Spatial registration of all the skull-stripped images to the Jakob template was performed using the Deformable Registration via Attribute Matching and Mutual-saliencing Matching registration package (DRAMMS, version 1.1.0; http://www.cbica.upenn.edu/sbia/software/dramms/index.html).Reference Ou, Sotiras, Paragios and Davatzikos 32 The deformation field from the resulting registration was used to obtain the Regional Analysis of Volumes Examined in Normalized Space (RAVENS) maps or regional volumetric maps for GM, WM and CSF. The maps were corrected for individual intracranial volume, down-sampled to 2×2×2 mmReference Atkinson, Sankar, Adams and Fu 3 .
Analysis of structural neuroanatomy: GM and WM
Regional differences in GM and WM between MDD patients and healthy controls were performed with the Optimally Discriminative Voxel Based Analysis (ODVBA, version 2.0) software packageReference Zhang and Davatzikos 23 using the RAVENS maps. In ODVBA, the regional discriminative analysis which is restricted by the non-negativity constraints is firstly applied to a spatial neighbourhood around each voxel in order to identify the coefficients that best highlight the differences between two groups in that neighbourhood. Secondly, the statistical value of each voxel is then determined by a composition of contributions from all neighbourhoods to which it belongs. Finally, the statistical significances are obtained by using permutation tests. In the present study, 2000 permutations were used to derive the significances, and significance was assigned as P (uncorrected)<0.001 because of the relatively small sample size. ODVBA has shown greater sensitivity to detect subtle structural abnormities and improved delineation of the region of abnormality as compared with conventional GLM methodsReference Zhang and Davatzikos 23 , Reference Zhang and Davatzikos 24 in various clinical studies.Reference Zhang, Koutsouleris, Meisenzahl and Davatzikos 33 , Reference Erus, Battapady, Zhang, Lovato, Miller and Williamson 34
Classification using SVM
The GM and WM RAVENS maps were concatenated into a single feature vector for each participant. Classification was performed using SVM,Reference Vapnik and Cortes 35 a multivariate classification technique that can optimally use high dimensional information such as neuroimaging data.Reference Costafreda, Chu, Ashburner and Fu 10 , Reference Fu, Mourao-Miranda, Costafreda, Khanna, Marquand and Williams 19 SVM identifies the optimal linear decision boundary, or hyperplane, that has the maximum margin separating the two training groups, namely MDD patients and healthy controls. SVM treats individual images as points located in high dimensional space. In SVM, both the hyperplane as well as the margin are important in classification accuracy, and usually the wider the margin the better the classification accuracy.Reference Vapnik and Cortes 35
SVM also extracts weight vectors as images, known as SVM discrimination maps, which represent the direction in which the two groups differ the most, and the significance levels were determined using analytical permutation testing.Reference Gaonkar and Davatzikos 25 We used an advanced version which accounted for the SVM margins in addition to the SVM weights.Reference Goankar, Shinohara and Davatzikos 36 The SVM analysis was performed using fivefold cross-validation strategy. The classification scores derived from the SVM analysis was evaluated using a receiver operating characteristic (ROC) curve to illustrate the diagnostic accuracy of the classifier. The area under the curve (AUC) was calculated from the ROC curve, which is a measure of the discriminative power of the classifier and is independent of the chosen P value or sample size.
The GM and WM RAVENS maps were also analysed using the SVM-based classification technique Classification of Morphological Patterns using Adaptive Regional Elements (COMPARE).Reference Fan, Shen, Gur, Gur and Davatzikos 37 The first step in this method is feature selection wherein regions that show high correlation between RAVENS maps and participant groups are extracted using a watershed algorithm. A further volume-increment algorithm is then applied to these regions to extract regional volumetric features, from which a feature selection method based on SVM classification criteria is used to identify the most relevant features for classification.Reference Fan, Shen, Gur, Gur and Davatzikos 37 The feature selection procedure produces a small number of volumetric measurements for more effective classification. The SVM classification technique with the most distinguishing features is then used to predict group differences using the leave-one-out cross-validation strategy.Reference Fan, Shen, Gur, Gur and Davatzikos 37
Results
Structural neuroanatomy
In GM density, reductions were revealed in the right superior frontal region (Talairach coordinates: x, y, z: 17.8, 31.5, 48.2; mass size: 74 voxels), right superior medial frontal region (x, y, z: 11.9, 31.7, 51.8; mass size: 14 voxels) and superior temporal regions (x, y, z: 53.5, −43.6, 20.6; mass size: 13 voxels) in MDD patients compared with healthy controls (P<0.001, uncorrected), and in WM density, reductions were evident in the right postcentral (x, y, z: 25.7, −41.8, 57.4; mass size: 14 voxels), superior parietal (x, y, z: 21.8, −57.3, 58.1; mass size: 212 voxels), middle temporal (x, y, z: 49.5, −51.6, 17.3; mass size: 46 voxels) and left inferior occipital regions (x, y, z: −37.6, −75.8, −1.3; mass size: 10 voxels) in MDD patients relative to healthy controls (P<0.001, uncorrected) (Fig. 1). There were no regions which showed greater volume in MDD patients relative to controls.

Diagnostic classification
Using SVM analysis, 78.3% of MDD patients (sensitivity: 18 of 23 patients) and 55.0% of healthy controls (specificity: 11 of 20 healthy controls) for an overall accuracy of 67.4% (AUC=0.73, P=0.02, positive predictive value=66.67%, negative predictive value=68.75%) were correctly classified based on the combination of GM and WM density (Fig. 2). Based on GM only, the accuracy was reduced to 60.5%, which did not reach statistical significance (AUC=0.55, P=0.2), while the accuracy was higher at 65.1% (AUC=0.73, P=0.05) based on WM only. Regions which contributed to the classification of MDD patients included WM regions in the superior and medial frontal gyri, superior parietal and inferior occipital gyri, and in the cerebellum (Fig. 2).

From the COMPARE analysis which included feature selection, the highest classification rate was 81.4% based on 47 features, while the most stable pattern was observed with an accuracy of around 70% based on 50–70 features (Fig. 2).
Discussion
At present, the diagnosis of depression is based solely on clinical signs and symptoms, and there are no biological markers that can identify the disorder or predict clinical response. Using structural neuroimaging measures and machine-learning analysis, we have identified a potential non-invasive biomarker which can aid in the diagnosis of MDD in patients from a wide ethnic diversity from a community sample. Moreover, the features of depression which are commonly observed in the community were reflected in the present group as all the patients were in an acute depressive episode, were not taking any medications, and were suffering from some degree of psychosocial impairments. These findings provide an important step in the development of potential neuroimaging-based tools for clinical diagnosis as the findings demonstrate that the identification of depression is feasible within a multi-ethnic group from the general community.
It was notable that the highest accuracy was achieved from combining GM and WM features in the structural MRI scans. Regions which contributed to classification included a widespread network encompassing the superior and medial frontal, superior parietal and inferior occipital regions. MDD patients showed GM atrophy in the right superior frontal and temporal regions as well as loss of WM density in the parietal, inferior occipital and lateral temporal regions compared with the healthy controls. Deficits in GM have been consistently reported in the prefrontal regions extending into the precentral cortex and subcortically into the thalamus.Reference Atkinson, Sankar, Adams and Fu 3
Abnormalities in WM have been observed as reductions in volume as well as in fractional anisotropy, a measure of connectivity that is derived from diffusion tensor imaging, also extending from frontal to parietal and occipito-temporal regions,Reference Liao, Huang, Wu, Yang, Kuang and Du 38 which may be associated with more severe symptoms.Reference Cole, Chaddock, Farmer, Aitchison, Simmons and McGuffin 4 A higher accuracy of diagnosis has been reported in patients with a greater severity of illness and of the same ethnicity.Reference Gong, Wu, Scarpazza, Lui, Jia and Marquand 11 , Reference Liu, Guo, Yu, Gao, Gao and Xue 12 Similar regions had contributed to the diagnosis, namely WM regions in the frontal, parietal, and occipital lobes.Reference Gong, Wu, Scarpazza, Lui, Jia and Marquand 11 , Reference Liu, Guo, Yu, Gao, Gao and Xue 12 We also found that WM regions in the bilateral cerebellum contributed towards diagnostic classification, which has been previously observedReference Liu, Guo, Yu, Gao, Gao and Xue 12 but more frequently has not been examined.Reference Kipli, Kouzani and Hamid 14 – Reference Qiu, Huang, Zhang, Wang, Kuang and Li 16 The cerebellum is involved in the regulation of emotional responses,Reference Blatt, Oblak, Schmahmann, Manto, Schmahmann, Rossi, Gruol and Koibuchi 39 and GMReference Frodl, Koutsouleris, Bottlender, Born, Jäger and Scupin 40 as well as WMReference Zeng, Liu, Liu, Shen, Li and Hu 41 deficits have been reported in depression. These findings underline the wide distribution of GM and WM abnormalities within fronto-limbic networks in depression, supporting the necessity of analyses which are capable of combining these features, rather than examining each region individually.
Ethnicity has a significant impact on the development and prognosis of psychiatric and neurological disorders, which may be reflected in their neuropathology.Reference Ikram, Snijder, Fassaert, Schene, Kunst and Stronks 42 Perceived discrimination has been associated with greater activation and increased connectivity with the anterior cingulate cortex in healthy participants from an ethnic minority which was in part mediated by chronic stress.Reference Akdeniz, Tost, Streit, Haddad, Wüst and Schäfer 20 Effects on structural neuroanatomy may be more mixed as no significant effects were observed of ethnicity on hippocampal asymmetry in a community sampleReference Lucarelli, Peshock, McColl, Hulsey, Ayers and Whittemore 22 or on structural brain volumes when young Chinese Singaporeans were compared with White AmericansReference Chee, Zheng, Goh, Park and Sutton,21 although differences in cortical thickness were reported as young White Americans had greater thickness in frontal and right superior parietal regions compared with Singaporeans, who in turn showed increased thickness in the left inferior temporal gyrus.Reference Chee, Zheng, Goh, Park and Sutton 21 Moreover, a comparison of hemispheric shape between Eastern and Western populations revealed shorter but wider hemispheres for Japanese relative to European participants.Reference Zilles, Kawashima, Dabringhaus, Fukuda and Schormann 43 In multiple sclerosis, greater T1-weighted lesion volumes have been reported in patients of African compared with Caucasian ethnicity.Reference Howard, Battaglini, Babb, Arienzo, Holst and Omari 44 Our present findings indicate potential reproducibility in the structural neuroanatomy in depression from diverse ethnicities.
Structural neuroimaging has also demonstrated a comparable accuracy for the diagnosis of schizophrenia, revealing an accuracy of 78% from a meta-analysis in comparison with healthy controls.Reference Kambeitz, Kambeitz-Ilankovic, Leucht, Wood, Davatzikos and Malchow 45 In the present study, we achieved an accuracy of 81%, although the most stable findings were at an accuracy of around 70%. We would expect a higher accuracy for the diagnosis of schizophrenia, which is associated with greater global brain volume reductions, extensive regional atrophy as well as WM disruptions.Reference Bora, Fornito, Radua, Walterfang, Walterfang and Seal 46 Furthermore, we would not expect to fully replicate current diagnostic criteria systems. The process of developing potential neuroimaging-based biomarkers would involve an iterative process, in which the findings would lead to new hypotheses and would be incorporated as prior knowledge for subsequent studies.Reference Fu and Costafreda 18
The majority of machine-learning analyses of neuroimaging measures in depression have examined the predictive potential of structural neuroanatomy and functional neural correlates for diagnosis and prognosis using SVMs.Reference Fu and Costafreda 18 Major advantages of structural MRI measures is the ease with which the data can be acquired, its reliability and reproducibility, as well as its acceptability by patients. While we would not expect that neuroimaging-based diagnostic classification would wholly reproduce current symptom-based classifications, we would emphasise the need for biological markers to aid in the diagnosis of depression and other psychiatric disorders. This would be of particular importance for patients who may not be able to participate in the clinical assessment, who are unable to provide a sufficient clinical history, or when the specific diagnosis is unclear. Examining a single neuroimaging measure though may not fully encompass the multitudinous aspects of the disorder's complex psychopathology. Moreover, the specificity of the diagnostic classification could have implications for healthy individuals. We would expect that the specificity of the classification would improve in an iterative process in the development of the potential biomarker.Reference Fu and Costafreda 18 However, if the specificity were to remain low, this would have implications for the clinical applicability of the biomarker as well as for those healthy individuals who have structural neural features that are comparable with individuals with a diagnosis of depression, analogous to having genetic polymorphisms that are associated with increased risk for the development of a particular disorder or malignancy. Future longitudinal studies are needed to clarify the accuracy of diagnosis and could likely benefit from examining multiple neuroimaging measures as well as different machine-learning techniques. The challenge is to look for valid biomarkers of symptom conditions, perhaps incorporating neural and genetic measures. Such biomarkers could aid clinical interviews and decisions regarding diagnosis, prognosis and disease progression.
A limitation of the present study is the relatively small sample size, although comparable to previous studies.Reference Gong, Wu, Scarpazza, Lui, Jia and Marquand 11 – Reference Mwangi, Ebmeier, Matthews and Steele 13 In order to develop a diagnostically meaningful tool, it is essential to ensure unbiased testing of the model. Ideally, the model should be tested in an independent sample of patients with MDD to evaluate and to validate the generalisability of the model. However, a significant challenge of the analysis of data sets from different scanners is the systematic difference in the scanner protocols and the acquired images, and an important step in the analysis would be to harmonise the data from the different scanners. In the present study, we applied a fivefold cross-validation strategy, by which the whole data set was randomly divided into five exclusive subsets of equal size, and for each fold one of these subsets was used as a test set, while the remaining four were used as training data sets. Furthermore, this process was repeated a thousand times with randomly permuted class labels in order to determine the significance of the classification accuracy. As we achieved converging results from both an SVM model on the imaging data and the COMPARE high-dimensional feature extraction and classification method, and we applied proper cross-validation in the analysis, we believe that our models provide unbiased and robust findings. Advantages of the current sample include that all patients were medication-free status while in an acute depressive episode and were recruited from the community, as one of the highest classification accuracy was observed in patients who were already on antidepressant medications;Reference Mwangi, Ebmeier, Matthews and Steele 13 patients were in their first episodeReference Gong, Wu, Scarpazza, Lui, Jia and Marquand 11 , Reference Qiu, Huang, Zhang, Wang, Kuang and Li 16 as well as having a history of recurrent episodes;Reference Costafreda, Chu, Ashburner and Fu 10 and there was wide ethnicity which included Asian, African and Caucasian participants. Another concern is the access and cost of the MRI scan and the computational requirements of the analysis. We would envisage a database and analysis centre which the data could be sent to and the centre would provide a measure of the likelihood of the diagnosis, as well as the prognosis, and would form part of the clinical assessment and management.
In summary, we found that the diagnosis of MDD is feasible to a high level of accuracy in patients from a wide ethnic diversity. Diagnosis was based on a widespread network of WM as well as GM. The identification of individual patients with depression from an ethnically diverse, community sample indicates the generalisability of the diagnostic neural pattern and provides a valuable step in the development of diagnostic biomarkers. Multicentre validation studies would be important to test the robustness of the present findings.
Acknowledgements
We thank the participants, consultant psychiatrists, radiographers and study coordinators for their assistance in the study.


 Open access
eLetters
No eLetters have been published for this article.