


Policy Significance Statement
This article demonstrates that Twitter data can be a useful resource to monitor immigration-related sentiment in real or near real-time to complement traditional data sources. Although Twitter users are generally not representative of the population at large, Twitter data can contribute to developing effective strategies to counter the spread of discrimination against migrants in emergency scenarios and more broadly, in line with Objective 17 of the Global Compact for Safe, Orderly and Regular Migration, which is to “Eliminate all forms of discrimination and promote evidence-based public discourse to shape perceptions of migration.” As social media is likely to reinforce and geographically extend the trend of social polarization on topics such as migration through “echo chambers,” it is critical to investigate how misinformation and negative sentiments toward migrants spread across virtual networks to design programmes aimed at countering discrimination and fostering social cohesion in communities worldwide.
1. Introduction
Currently, the world faces an unprecedented challenge to tackle and understand the spread and impacts of COVID-19. While large-scale coordinated efforts have been dedicated to understand the global health and economic implications of the pandemic, the rapid spread of prejudice and xenophobia has largely been neglected. Incidents of rising anti-immigration sentiment have been reported since the start of the pandemic (Nature, 2020). Wikipedia (2020) has a dedicated site documenting key racist and xenophobic incidents around the world. Acts and displays of intolerance, discrimination, racism, xenophobia and violent extremism have emerged linking individuals of Asian descendent and appearance to COVID-19 (Coates, Reference Coates2020; Nature, 2020). Fear mongering and racial stereotyping spread on social media and rapidly spilled onto the streets (Cowper, Reference Cowper2020).
Understanding damaging xenophobic narratives is key to prevent the spread of misinformation fuelling misperception, negative attitudes, and discrimination against immigrants. Xenophobic narratives and racist attacks erode social cohesion and are likely to have repercussions which will likely persist beyond the pandemic. Anti-immigration sentiment is often rooted in misperceptions (European Commission, 2019), and experimental evidence has indicated that providing information to address these misconceptions can shift attitudes toward a more supportive view of immigration (Grigorieff et al., Reference Grigorieff, Roth and Ubfal2020). The availability and accuracy of data on public opinion of migration are thus critical for tackling misperceptions and understanding the extent of local openness to immigration and ethnic diversity (Dennison and Dražanová, Reference Dennison and Dražanová2018).
Traditionally, data on attitudes toward immigrants are collected through qualitative sources, namely ethnographies and interviews, or surveys (Rowe et al., Reference Rowe, Mahony, Graells-Garrido, Rango and Sievers2021a). Yet, qualitative methods rely on small samples and normally suffer from sample bias (Ochieng, Reference Ochieng2009). Similarly, while surveys can provide a reliable national representation, they are expensive, infrequent, lack statistical validity at fine geographical scales, and may suffer from data latency with a considerable gap between the date of data collection and release (Ochieng, Reference Ochieng2009; Green et al., Reference Green, Pollock and Rowe2021). Moreover, survey data do not typically provide insights into why people hold certain views on migration, and respondents may interpret the same survey question in different ways (Goyder, Reference Goyder1986).
New forms of data can help overcome these deficiencies. Social media, particularly microblogging, offers an open and dynamic space which provides a unique window to better understand public opinion about immigration. Microblogging is a new form of communication in which users can publish short posts to express live opinions on digital devices. In October 2020, 53% of the world’s population (over 4.1 billion people) were estimated to be active social media users (Hoosuite and We Are Social, 2020). Social media data are produced at an unprecedented temporal frequency, geographical granularity and are accessible in real time (McCormick et al., Reference McCormick, Lee, Cesare, Shojaie and Spiro2017). Coupled with cost-efficient computing and machine learning algorithms, these data enable real-time processing of information to measure and monitor anti-immigration sentiment at frequent temporal intervals over extended timeframes and across the globe (Bartlett and Norrie, Reference Bartlett and Norrie2015; Freire-Vidal and Graells-Garrido, Reference Freire-Vidal and Graells-Garrido2019).
This article aims to measure and monitor changes in attitudes toward immigrants during early stages of the current COVID-19 outbreak in five countries: Germany, Italy, Spain, the United Kingdom, and the United States using Twitter data and natural language processing. Specifically, we seek to:
-
• determine the extent of intensification in anti-immigration sentiment as the geographical spread and fatality rate of COVID-19 increases;
-
• identify key discrimination topics associated with anti-immigration sentiment;
-
• assess how these topics and immigration sentiment change over time and vary by country.
Drawing on a data set of 30.39 million tweets, we examine immigration sentiment from December 1, 2019 (pre-pandemic) to April 30, 2020 comprising the early months of the COVID-19 pandemic. We acknowledge the potential limitations of Twitter to capture immigration sentiment. Twitter may only capture public opinions made by a selected segment of the population whose size and attributes vary by country according to access to digital technology, offering a partial portrayal of immigration sentiment (Rowe, Reference Rowe2021). Yet, Twitter constitutes a novel source of data which offers information on public opinion that did not exist 14 years ago. They have global coverage and offer the potential to enable real- or near real-time monitoring of changing attitudes toward immigrants during dynamic and fast-evolving events, such as pandemics. Thus, Twitter data can be used to complement traditional sources and develop our understanding of public perceptions toward immigration where appropriate data are not available.
Our selection of countries was based on the cooccurrence of having an extensive Twitter user base, immigrant population, and high incidence of confirmed COVID-19 cases and fatality for countries outside Asia. The key rationale was: countries with large immigrant populations that were first and more severely affected by COVID-19 were more likely to experience an escalating number of incidents of racism and xenophobia early in the pandemic (Nature, 2020; United Nations, 2020). Further, a key objective was to identify migration sentiment toward Asian populations so that we selected countries outside Asia. We thus identified countries with some of the largest Twitter user penetration rates globally, in order to maximize the representation of a diverse group of individuals and minimize potential selection biases (Sehl, Reference Sehl2020; Statista, 2020). We also selected countries which first reported COVID-19 cases outside Asia and recorded the world’s largest number of cumulative COVID-19 deaths at the start of the pandemic.
The rest of the article is structured into five main sections. The next section discusses emerging evidence relating to racism during the COVID-19 pandemic and how feelings of anxiety and fear may have influenced perceptions toward immigrants. This section also discusses prior empirical work on attitudes toward immigration based on traditional sources and identify their limitations before discussing the key challenges and opportunities of using Twitter data to measure immigration sentiment. We then describe our strategy of data collection and analysis before presenting and discussing the results. We conclude by identifying implications for future research and immigration policy.
2. Background
2.1. Emerging evidence on anti-immigration sentiment related to COVID-19
As COVID-19 expanded throughout the world in early February 2020, mounting fear and misinformation led to rapid spread of xenophobic and racist rhetoric against individuals of Asian descendent and appearance (OECD, 2020). This rhetoric rapidly expanded through news media coverage and social media platforms across the world via the publication of numerous articles explicitly blaming or associating China with the COVID-19 outbreak (Coates, Reference Coates2020; Cowper, Reference Cowper2020). Narratives quickly translated into actions, with a rising number of violent physical aggression incidents (Bhattacharya et al., Reference Bhattacharya, Banerjee and Rao2020; Wikipedia, 2020). In the United Kingdom, the government reported a 21% increase in hate crime incidents against Asian communities between January and March, and Chinese businesses reported a notorious reduction in footfall during Chinese celebrations (Home Affairs Committee, 2020). The editorial team of Nature published an apology for erroneously associating COVID-19 with China, and noted the influential role of key political figures in invigorating that narrative, particularly in the United States and Brazil: where President Donald Trump repeatedly used the terms “Chinese Virus,” “China Virus,” and “Fung Flu” in reference to COVID-19, and Eduardo Bolsonaro, a son of the Brazilian President, called it “China’s fault” (Nature, 2020).
Prejudice, discrimination and stigmatization during pandemics are not new. They have emerged throughout history as fear and panic mount. The 1300s saw Jewish persecution during the Black Death (Link and Phelan, Reference Link and Phelan2006). The 1980s witnessed the stigmatization of lesbian, gay, bisexual, transgender, queer, and questioning communities during the HIV outbreak (Berger et al., Reference Berger, Ferrans and Lashley2001). More recently, the Ebola outbreak was labeled as an “African disease” (Davtyan et al., Reference Davtyan, Brown and Folayan2014). Stigmatization may influence individual livelihoods and impact broader socioeconomic outcomes. At the individual level, stigma has been linked to mental stress, depression and low self-esteem—all of which can reduce quality of life, generate unemployment and income loss (Link and Phelan, Reference Link and Phelan2006). At the societal level, stigma can impact social inclusion, businesses and the economy (Nature, 2020). In the context of COVID-19, the international education market and universities are predicted to endure large economic losses as international Asian students, who have been primary subjects of verbal and physical abuse, may decide not to resume their studies in fear of racism (Nature, 2020).
The rise in stigmatization has encountered a wave of positive immigration sentiment events recognizing the key role of immigrant workers in frontline occupations during COVID-19, such as social care, health, essential retail and food production (Fasani and Mazza, Reference Fasani and Mazza2020; Gelatt, Reference Gelatt2020). An event widely shared by the international media press was Prime Minister Boris Johnson’s praise to two immigrant nurses for helping save his life during his time in intensive care due to COVID-19 (BBC, 2020). Communication campaigns have also been put in place to tackle emerging COVID-19 anti-immigration narratives. The United Nations, for instance, issued a set of recommendations to address and counter hate speech related to COVID-19. In Germany, an antidiscrimination agency launched a dedicated campaign to raise awareness about the rise of anti-Semitic discrimination and racism (OECD, 2020). In Finland, the government started a nation-wide campaign to tackle misconceptions about COVID-19 on social media (OECD, 2020). In France, actions were put in place to accelerate naturalization processes for immigrants working in the frontline during COVID-19 (OECD, 2020), and in the United Kingdom, frontline healthcare workers have been exempted from paying an immigration health surcharge required for temporary visa applications (Gower, Reference Gower2020).
Various theories of attitudinal formation could help explain shifts in immigration sentiment during COVID-19. Individual-level theories of self-interest (Olzak, Reference Olzak1994), social identity (Tajfel, Reference Tajfel1982), and moral foundation theories (Haidt, Reference Haidt2007) link feelings of fear, anxiety, and personal identification with a foreign group to the formation of negative sentiment toward immigrants. As diseases are linked to specific countries and populations are stigmatized, natives’ feelings of negative impacts of their wellbeing are likely to contribute to the formation or intensification of negative attitudes toward certain populations during pandemics, as has been documented over periods of economic recession (Burns and Gimpel, Reference Burns and Gimpel2000). As suggested by group threat theories (Blumer, Reference Blumer1958), contextual-level factors may have also contributed to intensifying or shifting attitudes toward immigrants as a result of perceived or actual competition which could have been accentuated during lockdowns, closure of retail services, and increased waiting times. Similarly, contact theories suggest that greater interaction promotes more favorable attitudes toward immigrants (Allport et al., Reference Allport, Clark and Pettigrew1954). During COVID-19, interactions between immigrants in key sectors and native-born individuals may have increased, and hence contributed to more favorable attitudes toward immigrants in these sectors.
2.2. Contemporary trends in immigration sentiment
Large-scale surveys have been used to provide a global-scale perspective on public attitudes toward immigration.Footnote 1 The Gallup World Poll in 2012–2014 probably remains the most comprehensive source of data on attitudes toward immigration with a coverage of 140 countries. Based on these data, the International Organization for Migration (IOM, 2015) published the first global-scale study on public attitudes toward immigration examining variations in respondents’ views on whether or not immigration levels should be increased, decreased or stay at present levels. A key finding is that globally a greater percentage of the population would prefer national levels of immigration to reduce (34%), rather than to either stay at their present levels (22%) or to increase (21%) (IOM, 2015).
Yet, wide variability exists across world regions and countries. World regional averages from Gallup World Poll show that people in every major region have a preference for either maintaining or increasing current immigration levels, except in Europe (IOM, 2015). In Europe, residents appear to have the least positive attitudes toward immigration globally, with 52% of the surveyed population, indicating a need to reduce current immigration levels (IOM, 2015). Yet, a sharp divergence exists between Northern and Southern Europe (IOM, 2015). Southern Europeans, including respondents in Spain and Italy, tend to display more negative attitudes toward immigration preferring lower national immigration levels, while northern Europeans favor maintenance or an increase in current immigration levels (IOM, 2015; Dennison and Geddes, Reference Dennison and Geddes2019. In Northern Europe, the United Kingdom stands out as an exception with a larger percentage (69%) of the population in favor of lower immigration levels (IOM, 2015). By contrast, attitudes toward immigration levels are more positive in the United States, with 63% of the surveyed population indicating immigration levels should increase (IOM, 2015). Germany sits on a middle ground with a larger percentage (49%) of people preferring immigration to remain at present levels.
Immigration is however a complex multidimensional issue. Distinctive dimensions of immigration sentiment exist which can even provide varying views of immigration. For instance, public attitudes toward the perceived level of immigration have remained relatively constant over recent decades, while the salience “perceived importance” of immigration has varied wildly in Europe (Dempster et al., Reference Dempster, Leach and Hargrave2020). Analyzing the salience of immigration, recent longitudinal studies have revealed a softening in anti-immigration sentiment across Europe. Based on 2014–2018 Eurobarometer data on feelings toward immigrants from different origin countries, comparative studies have reported evidence of a decreasing trend in anti-immigration sentiment across all 28 European Union countries, including the United Kingdom (Dennison and Dražanová, Reference Dennison and Dražanová2018; Dennison and Geddes, Reference Dennison and Geddes2019). This trend is observed for feelings toward both EU and non-EU immigrants; yet, stronger negative feelings exist toward non-EU immigrants (Dennison and Geddes, Reference Dennison and Geddes2019). In the United Kingdom, this paradoxical trend of softening in anti-immigration sentiment, against little change in perceived levels of immigration, started in 2014 before the Brexit Referendum and has continued since (Blinder and Richards, Reference Blinder and Richards2020; Schwartz et al., Reference Schwartz, Simon, Hudson and Van-Heerde-Hudson2020).
Analyzing different dimensions may even reveal the coexistence of contrasting views on immigration sentiment. Existing evidence suggests that people are generally more positive about the impacts of immigration on the economy, labor market and culture than on immigration levels (Dempster et al., Reference Dempster, Leach and Hargrave2020). For instance, Ueffing et al. (Reference Ueffing, Rowe and Mulder2015) showed that German residents feel strongly about maintaining or reducing current levels of immigration, with an estimated 95% of respondents wanting to keep or decrease existing levels. Yet, they have a relatively more positive view on the impacts of immigration on the economy, labor market and culture, with 26, 29, and 54% (respectively) indicating that: immigrants are perceived as generally good for the country’s economy, do not take jobs away from German-born residents, and improve society by bringing new ideas and culture (Ueffing et al., Reference Ueffing, Rowe and Mulder2015). Similarly, recent British data indicate a prevailing and stable positive perception about the impact immigration had on the country over 2015–2018, but a predominant desire to reduce existing immigration levels, with 58% of respondents wanting to see a reduction in immigration (Kaur-Ballagan et al., Reference Kaur-Ballagan, Gottfried and Aslaksen2017).
Thus, while existing data sources on public opinion about immigration provide a valuable understanding of long-term changes in attitudes toward immigration and cross-national differences, key challenges remain. Survey data represent the main source of immigration sentiment studies; however, they are typically spatially coarse, costly, and infrequent (Rowe et al., Reference Rowe, Mahony, Graells-Garrido, Rango and Sievers2021a). Existing data can be limited through slow data releases and statistical representation, especially at small geographical units. Real-time, frequent, exhaustive and internationally spanning information is crucial to monitor changing attitudes toward immigrants during dynamic and fast-evolving events, such as pandemics. Twitter offers data with these attributes to supplement and complement traditional data systems, to cover their gaps and feed into real-time monitoring of immigration sentiment at an unprecedented temporal granularity and geographic coverage.
2.3. Use of Twitter to capture immigration sentiment
Twitter data have increasingly been used to estimate, understand, and predict the spread of diseases (Achrekar et al., Reference Achrekar, Gandhe, Lazarus, Yu and Liu2011), misinformation (Vosoughi et al., Reference Vosoughi, Roy and Aral2018; Green et al., Reference Green, Musi, Rowe, Charles, Darlington-Pollock, Kypridemos, Morse, Rossini, Tulloch, Dearden, Maheswaran, Singleton, Vivancos and Sheard2020), political polarization (Conover et al., Reference Conover, Ratkiewicz, Francisco, Gonçalves, Menczer and Flammini2011), natural disasters (Bruns and Liang, Reference Bruns and Liang2012), and population movements (Zagheni et al., Reference Zagheni, Garimella, Weber and State2014). Yet, a very small set of studies has employed Twitter data to measure immigration sentiment (Righi, Reference Righi2019). Flores (Reference Flores2017) probably represents the most substantive study. He conducted a quasi-experimental design to assess the impact of a more restrictive immigration policy on rises in anti-immigration attitudes in Arizona. Other research consists of focused case studies to explore the potential use of Twitter data. Bartlett and Norrie (Reference Bartlett and Norrie2015) explored online conversations relating to immigration, analyzing the frequency of keywords and their temporal changes. They pointed to key considerations for data collection, such as potential demographic biases and importance of a clearly defined set of search words. Previous work also focused on exploring how Twitter could be used to understand the refugees’ experiences in Europe during the 2015–2017 refugee crisis (e.g., Gualda and Rebollo, Reference Gualda and Rebollo2016; UN Global Pulse, 2017). More recent work (Freire-Vidal and Graells-Garrido, Reference Freire-Vidal and Graells-Garrido2019; Freire-Vidal et al., Reference Freire-Vidal, Graells-Garrido and Rowe2021) has explored how changes in migration sentiment are linked to specific emotions, and how positive and negative immigration sentiment communities can be identified by analyzing their retweet network.
A related and growing area of research, in which Twitter has displayed great potential, is in the detection and characterization of hate speech (Fortuna and Nunes, Reference Fortuna and Nunes2018; Ribeiro et al., Reference Ribeiro, Calais, Santos, Almeida and Meira2018). Hate speech detection seeks to identify and classify threatening, harassing or seriously offensive language. Several studies have employed Twitter data to study hate speech against immigrants (Bosco et al., Reference Bosco, Patti, Bogetti, Conoscenti, Ruffo, Schifanella and Stranisci2017; Sanguinetti et al., Reference Sanguinetti, Poletto, Bosco, Patti and Stranisci2018; Basile et al., Reference Basile, Bosco, Fersini, Debora, Patti, Pardo, Rosso and Sanguinetti2019; Comandini and Patti, Reference Comandini and Patti2019; Calderón et al., Reference Calderón, de la Vega and Herrero2020). Hate speech is seen as a specific expression of sentiment or attitudes and thus related studies have focused on characterizing how the social network expresses hate. Our work takes a broader perspective. We develop an analytical framework to measure and characterize the pulse of both positive and negative sentiment toward migration.
Several methodological challenges have been identified in the use of Twitter data to measure immigration sentiment (Flores, Reference Flores2017). First, Twitter users make heavy use of slang, emoticons, emojis, initialisms, acronyms, and punctuation to express sentiments. However, the word sets of lexicons normally used to assign the sentiment scores do not contain these expressions, as these are attuned to well-structured text and domain-specific. Second, punctuation, emoticons, emojis, capital shape, and degree intensifier words are often used to signal increased sentiment intensity. Yet these elements are generally dismissed, and positive and negative sentiment are only based on the text component of tweets. Third, tweets contain contrasting statements (e.g., “Immigration is great, though it can have a negative impact on rising housing prices”). By not capturing differences in sentiment intensity, tweets involving contrasting statements are categorized as neutral sentiment (i.e., a score of zero). Fourth, sarcastic statements are often misclassified by sentiment algorithms (UN Global Pulse, 2017). However, sarcastic tweets generally account for a small fraction of tweets and have little to no impact on aggregate daily and monthly metrics of sentiment (Flores, Reference Flores2017; Freire-Vidal and Graells-Garrido, Reference Freire-Vidal and Graells-Garrido2019).
3. Data and Methods
3.1. Data
We draw on a country-stratified random sample of 30.39 million tweets across Germany, Italy, Spain, the United Kingdom, and the United States. Our sample covers the start of the COVID-19 pandemic between December 1, 2019 to April 30, 2020. Differences in the data collection observed across countries reflect variations in local tweet activity relating to migration-related topics. Data were collected via an application programming interface (API) (Campan et al., Reference Campan, Atnafu, Truta and Nolan2019). We used Twitter’s Premium API, which enables access to historical data with a monthly cap of 1.25 million tweets. The API allows 500 tweets per request at a rate of 60 requests per minute; access to tweets, retweets, URLs, hashtags and profile geographic information; and, a total number of 2.5k requests per month.
The data were collected based on a random sampling strategy. To maximize our monthly API data allowance, a sampling strategy was developed to collect a sample of 1.5k tweets for each day of the study period. Geographic and language parameters were applied to each country’s search criteria, to filter for tweets occurring within a country’s geographical boundaries and native language. Data were collected around the peak hour of daily tweet activity. The Twitter API collects data in a reverse manner in relation to time. We set the starting time of data collection 1 hr after the peak in daily activity. In that way, we ensured that the most popular tweets were included in our data set, and as a result, that our sentiment scores were representative of the daily tweet sentiment activity relating to migration. This decision was based on the observation that migration sentiment scores based on Twitter data around the peak time of daily tweet activity are generally good predictors of sentiment scores based on a full-day data set. We conducted this analysis for a sample of data for the United Kingdom and the United States during March, 2020. This approach follows Rowe et al. (Reference Rowe, Mahony, Graells-Garrido, Rango and Sievers2021a) approach. They compared migration sentiment scores from: (a) a sample containing tweets around the daily peak hour; and (b) a sample containing tweets all daily tweets for seven full days for the United Kingdom. The resulting sentiment scores from both data sets consistently identified similar daily patterns of immigration sentiment across four lexicons.
To collect tweets focusing on migration, we were guided by the principles of the Campbell policies and guidelines standards for the conduct of systematic reviews (Campbell Collaboration, 2020). A key component of conducting a systematic review is planning a search strategy to capture relevant content. In consultation with migration experts at IOM, a set of key search terms were developed, including words, Twitter accounts and hashtags. No accounts of media outlets were specifically targeted to avoid biases in our analysis. However, we captured relevant migration discussions posted by media outlets via our search terms and other users. Media outlet accounts were excluded because they are known to have a political leaning and thus a certain stand on migration issues; and, they all publish large volumes of information on a range of topics which would have limited our capacity to capture a wider variety of views on migration given the Twitter cap restrictions. The list of words and hashtags used in our search terms is reported in Supplementary Table S1. Twitter accounts are not displayed for ethical considerations. Table 1 reports the data used in the analysis.
Summary of tweets collected between December 1, 2019 and April 30, 2020

We translated tweets collected for Spain, Germany, and Italy samples into English using the Google Cloud Translation API (Google, 2020). This was necessary as the lexicon used to measure tweet-level sentiment only contains English words. While we did not directly assess how tweet-based sentiment scores were impacted by the translation, existing research on machine translation and sentiment analysis has shown that English lexicons applied to translated texts produce comparable results to lexicons applied within a text in the original language as the resulting sentiment scores are word-based, rather than on the semantic structure of text (Peisenieks and Skadins, Reference Peisenieks and Skadins2014; Mohammad et al., Reference Mohammad, Salameh and Kiritchenko2016; Shalunts et al., Reference Shalunts, Backfried and Commeignes2016). The translation was also necessary for our topic modeling approach, in order to make comparisons across countries. Topic modeling relies on term frequency to identify themes and estimate similarity between texts (Grün and Hornik, Reference Grün and Hornik2011). If applied to nontranslated tweets, it is likely that similarities between conversations in different languages would remain unidentified, due to the differences in vocabulary, making cross-country comparison less effective (Grün and Hornik, Reference Grün and Hornik2011). For topic modeling, we also used the Natural Language Toolkit (NLTK) English stop words corpus to remove stop words (Loper and Bird, Reference Loper and Bird2002). This corpus is widely used in natural language processing research applications and can be readily implemented in Python (Perkins, Reference Perkins2010).
3.2. Sentiment analysis
To capture immigration sentiment, we used sentiment analysis, also known as opinion mining or emotion artificial intelligence. Sentiment analysis refers to the use of natural language processing to systematically identify, measure and analyse emotional states and subjective information. It computationally identifies the polarity of text, that is, whether the underpinning semantics of an opinion is positive, negative or neutral. Furthermore, it allows deriving quantitative scores to identify the attitude or position on the distribution of negative or positive terms in a given piece of text.
We specifically employed VADER (Valence Aware Dictionary and sEntiment Reasoner) (Hutto and Gilbert, Reference Hutto and Gilbert2014). VADER is a lexicon and rule-based sentiment analysis tool which is tailored to the analysis of sentiments expressed in social media. VADER has been shown to perform better than 11 typical state-of-practice sentiment algorithms at identifying the polarity expressed in tweets (Hutto and Gilbert, Reference Hutto and Gilbert2014), and has remained one of the most widely used sentiment analysis methods for social media data (e.g., Elbagir and Yang, Reference Elbagir and Yang2020)—see Ghani et al. (Reference Ghani, Hamid, Hashem and Ahmed2019) and Rosa et al. (Reference Rosa, Pereira, Ribeiro, Ferreira, Carvalho, Oliveira, Coheur, Paulino, Simão and Trancoso2019) for recent comprehensive reviews of social media analytics.
VADER overcomes limitations of existing approaches by more appropriately handling informal text, including the use of negations, contractions, slang, emoticons, emojis, initialisms, acronyms, punctuation, and word-shape (e.g., capitalization) as a signal of sentiment polarity and intensity. Most commonly, lexicon-based approaches only capture differences in sentiment polarity (i.e., positive or negative) but do not identify differences in sentiment intensity (strongly positive vs. moderately positive) or contrasting statements. They have also been designed to capture sentiment in well-structured sentences, generally meaning their lexicons do not include slang, emoticons, emojis, acronyms, and capitalized word differentiation. We note that accurate identification and scoring of sarcastic statements remain a key challenge in natural language processing, but these statements tend to represent a small fraction of daily tweets.
VADER provides a normalized, weighted composite score which captures the polarity and intensity of individual tweets. The score ranges from −1 to +1, representing the most negative to most positive sentiment, respectively. Intuitively, to derive the score, VADER assigns a score to each word in a tweet, ranging from −4 (extremely negative) through 0 (neutral) to +4 (extremely positive) based on positive and negative text features identified in the text. These scores are then aggregated and normalized to range between −1 and +1. We used the daily average of the composite score to track the daily evolution of immigration sentiment on Twitter. We then identified positive sentiment tweets (i.e., composite score > 0.05) and negative sentiment tweets (i.e., composite score < −0.05).
3.3. Topic modeling
We used topic modeling to identify themes or topics of discussion in our data. Topic modeling uses term frequency measures to identify patterns in word-usage across a corpus of documents (Grün and Hornik, Reference Grün and Hornik2011). We employed latent Dirichlet allocation (LDA), which is an unsupervised topic modeling approach (Blei et al., Reference Blei, Ng and Jordan2003; Negara et al., Reference Negara, Triadi and Andryani2019). LDA is a hierarchical Bayesian model which assigns each document within a corpus a list of weights, based on the prevalence of different topics within the text. We chose this approach because it is a well-established methodology within topic modeling (Blei et al., Reference Blei, Ng and Jordan2003; Grün and Hornik, Reference Grün and Hornik2011) and has been proven to perform well when classifying tweets (e.g., Ostrowski, Reference Ostrowski2015; Del Gobbo et al., Reference Del Gobbo, Fontanella, Sarra and Fontanella2021), as well as in other online contexts, such as product reviews (Guo et al., Reference Guo, Barnes and Jia2017; Wang et al., Reference Wang, Feng and Dai2018). As a first step, the user defines a desired number of topics. The model then uses the frequency of terms across all documents in a corpus to probabilistically identify commonly occurring collections of terms. Topic probabilities are then used to optimize the partitioning of the data into the desired number of topics, with the aim of maximizing the probability of words occurring within a topic, whilst minimizing the probability of them occurring within other topics. For each document, these probabilities are then aggregated to create a document-level estimate as to the prevalence of each topic within the text. A LDA model produces two sets of outputs: probabilities of words occurring within a topic; and, estimates of topic prevalence within a document.
To decide the number of topics, we used “ldatuning” (Moor, Reference Moor2020), an R package which calculates how well LDA group the data into distinct topics. Four sets of metrics—developed by Griffiths and Steyvers (Reference Griffiths and Steyvers2004), Cao et al. (Reference Cao, Xia, Li, Zhang and Tang2009), Arun et al. (Reference Arun, Suresh, Madhavan and Murthy2010), and Deveaud et al. (Reference Deveaud, SanJuan and Bellot2014)—were used. Supplementary Figure S1 shows the results of these metrics for 2–20 topic solutions. We selected a data partition of 15 topics as it provided a good balance between level of detail, ease of interpretation and communication. Each tweet was associated with one of the most prevalent topics occurring in the text. The tweet text was processed before being used for modeling, removing punctuation, emojis, line breaks, URL links, account names and stop words (Bird et al., Reference Bird, Klein and Loper2009). The remaining words were then converted to their root form using Lemmatization (NLTK, 2020).
Supplementary Figure S2 shows the 25 terms most likely to appear in each topic and the 15 topics generated by our LDA model. In addition to examining individual words, we assessed the tweets containing the most frequently occurring terms and identified those that most strongly associated with each topic. Based on this information, we refined the resulting LDA typology to achieve a more optimal partition of the data. To this end, we collapsed all groups of tweets relating to migration that could not be clearly defined into a single miscellaneous topic, whilst groupings considered not relevant to migration were assigned to a noise topic. The final solution comprises 12 topics which are described in Subsection 4.4.
4. Results
4.1. Describing the extent of immigration-related tweet activity
Figure 1a reports the total number of tweets containing at least one of our search terms between December 1, 2019 and April 30, 2020. They capture all the tweet activity relating to migration. Figure 1b presents a selection of these tweets; that is, tweets relating to migration and COVID-19. To identify these tweets, we filtered our data based on a list of terms which have been commonly used on Twitter to refer to COVID-19 (Twitter, 2020). Figure 1c displays the number of new COVID-19 cases per million and a stringency index, which is part of the Oxford COVID-19 Government Response Tracker (OxCGRT) and a composite indicator to measure the extent and variation of the nonpharmaceutical interventions globally, such as school closures, workplace closures, travel restrictions and public gathering bans (Hale et al., Reference Hale, Petherick, Phillips and Webster2020). The indicator ranges from 0 (no measures) to 100 (the strictest possible scenario).
Migration-related tweet activity, COVID-19 cases and level of stringency measures, December 1, 2019 to April 30, 2020. (a) Number of daily immigration-related tweets and (b) immigration-COVID-related tweets. Details about the selection of tweets reported are provided in Section 3.1. (c) Number of cases (purple line) refers to the number of new COVID-19 cases per million. The stringency index (yellow line) measures the level of nonpharmaceutical interventions to COVID-19, such as social distancing and lockdown measures. Hundred indicates the strictest.
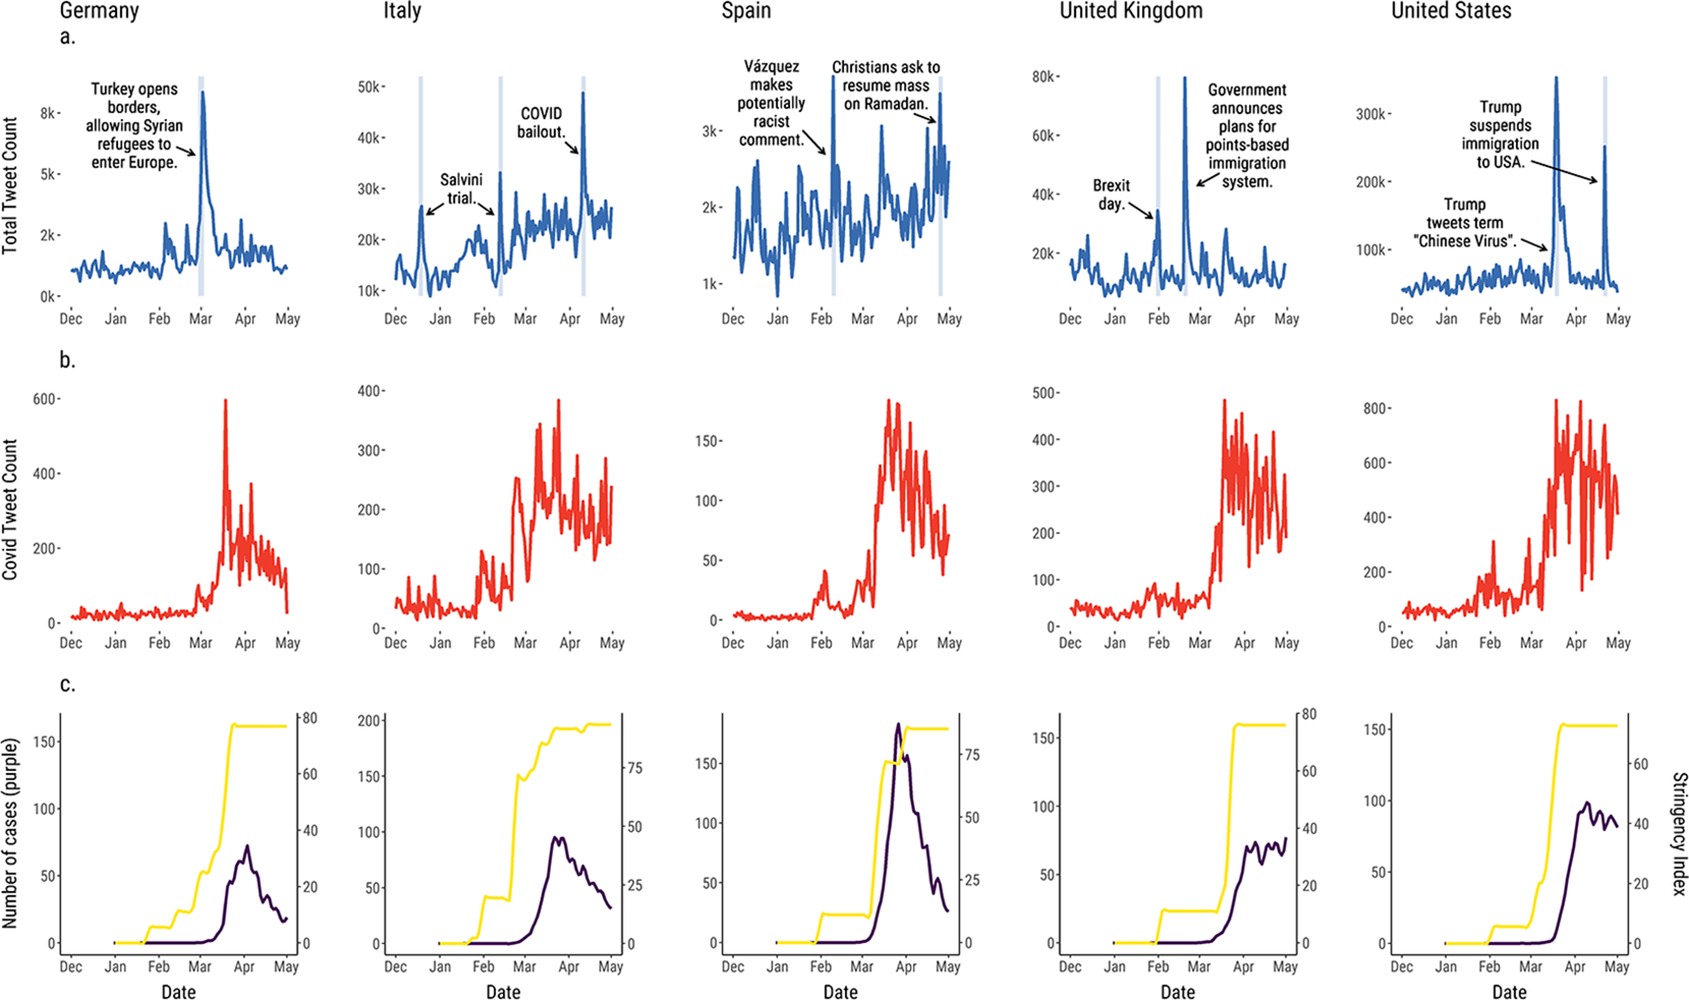
Figure 1 reveals a consistent level of immigration-related tweet activity with sudden spikes during key events, except for Spain, which displays high variability. Comparatively higher volume of immigration-related tweet activity is observed in Italy, the United Kingdom and particularly the United States, relative to Germany and Spain. Figure 1 also reveals an escalation in immigration-COVID-19-related tweet activity as the number of new COVID-19 cases started to rise in individual countries. Increases in immigration-COVID-19-related tweet activity began first in Italy and Spain during late January and early February, and in early-mid March in Germany, the United Kingdom, and the United States as the number of new COVID-19 cases accelerated and strict lockdown measures were implemented. High levels of immigration-COVID-19-related tweet activity seem to have remained relatively stable in Italy, the United Kingdom and the United States during April, while a declining trend is observed in Germany and Spain.
4.2. Assessing the overall distribution of sentiment
Figure 2 displays the overall distribution of tweet sentiment scores between December 1 to April 30, 2020. As expected, it shows a high frequency of neutral polarity tweets across all five countries in our sample, but also reveals a relatively high share of negative and positive polarity scores in the [0.5–1] range, indicating the existence of a polarized discussion on issues relating to immigration. Negative sentiment scores in this range account for an average of over 30% of all tweets across all five countries, which exceeds the respective share of positive sentiment tweets (18.6%). The share of neutral sentiment tweets accounts for a small fraction (13.1%), and scores of moderate negative and positive sentiment in the |0.05–0.5| range record 18.1 and 16.4% of all tweets, respectively. These results may reflect a wider societal trend of social polarization on controversial issues, in which immigration has featured as a key divisive topic in all the countries in our sample. Social divisions have become increasingly aligned with partisan identities in recent years (Dennison and Geddes, Reference Dennison and Geddes2019) and attributed to echo chambers—patterns of information—sharing that reinforce pre-existing beliefs by restricting exposure to opposing political views (Bail et al., Reference Bail, Argyle, Brown, Bumpus, Chen, Fallin Hunzaker, Lee, Mann, Merhout and Volfovsky2018). Social media is often believed to represent a main channel leading to selective exposure to information and political polarization (Conover et al., Reference Conover, Ratkiewicz, Francisco, Gonçalves, Menczer and Flammini2011; Hong and Kim, Reference Hong and Kim2016).
Density (a) and cumulative (b) distribution of sentiment scores.

Across our sample, public opinion around immigration in Spain seems to be the most polarized. Strongly negative sentiment scores account for 37.6%, while the share of strongly positive sentiment scores is 20%. Germany, Italy, the United Kingdom and the United States display a similar spread of sentiment scores, with a larger share of strongly negative sentiment scores. Italy displays a more balanced distribution.
4.3. Determining the extent of short-term fluctuations in sentiment
Figure 3a shows the daily average tweet sentiment score. Figure 3b reveals the sentiment intensity composition of tweets. Four key observations emerge from these figures. First, they reveal a consistently predominant pattern of overall negative sentiment, except for Italy, where the daily average sentiment score tends to fluctuate between −0.05 and 0. All countries also display a trending daily average sentiment score approaching 0 in late April, indicating neutral sentiment. Second, they reveal that the observed polarization in the Twitter discussion around immigration in Spain reported above based on the overall distribution of sentiment scores is fairly persistent over time, showing consistently large daily average sentiment scores approximating −0.5. Third, a cyclical pattern of short-term fluctuations of increased negative immigration sentiment in reaction to key events (see Figures 1 and 3). For instance, Italy displays a greater share of negative sentiment tweets in December 18, 2019 and February 12, 2020 reflecting tweets on a criminal case against Matteo Salvini, a far-right leader, accused of preventing 131 migrants from disembarking from a coast guard ship. Similarly, the United Kingdom records a greater share of negative sentiment tweets in January 31, 2020 and February 18, 2020 relating to the day the country exited the European Union and following the announcement of a new points-based immigration system.
Daily evolution of tweet sentiment: (a) Average overall sentiment score. Smoothed conditional means are reported and were estimated via locally weighted scatterplot smoothing (loess) using a span of 0.3. (b) Percentage of sentiment scores classified into strongly negative (<−0.5), negative (−0.5 to −0.05), neutral (−0.05 to 0.05), positive (0.05 to 0.5), and strongly positive (>0.5).
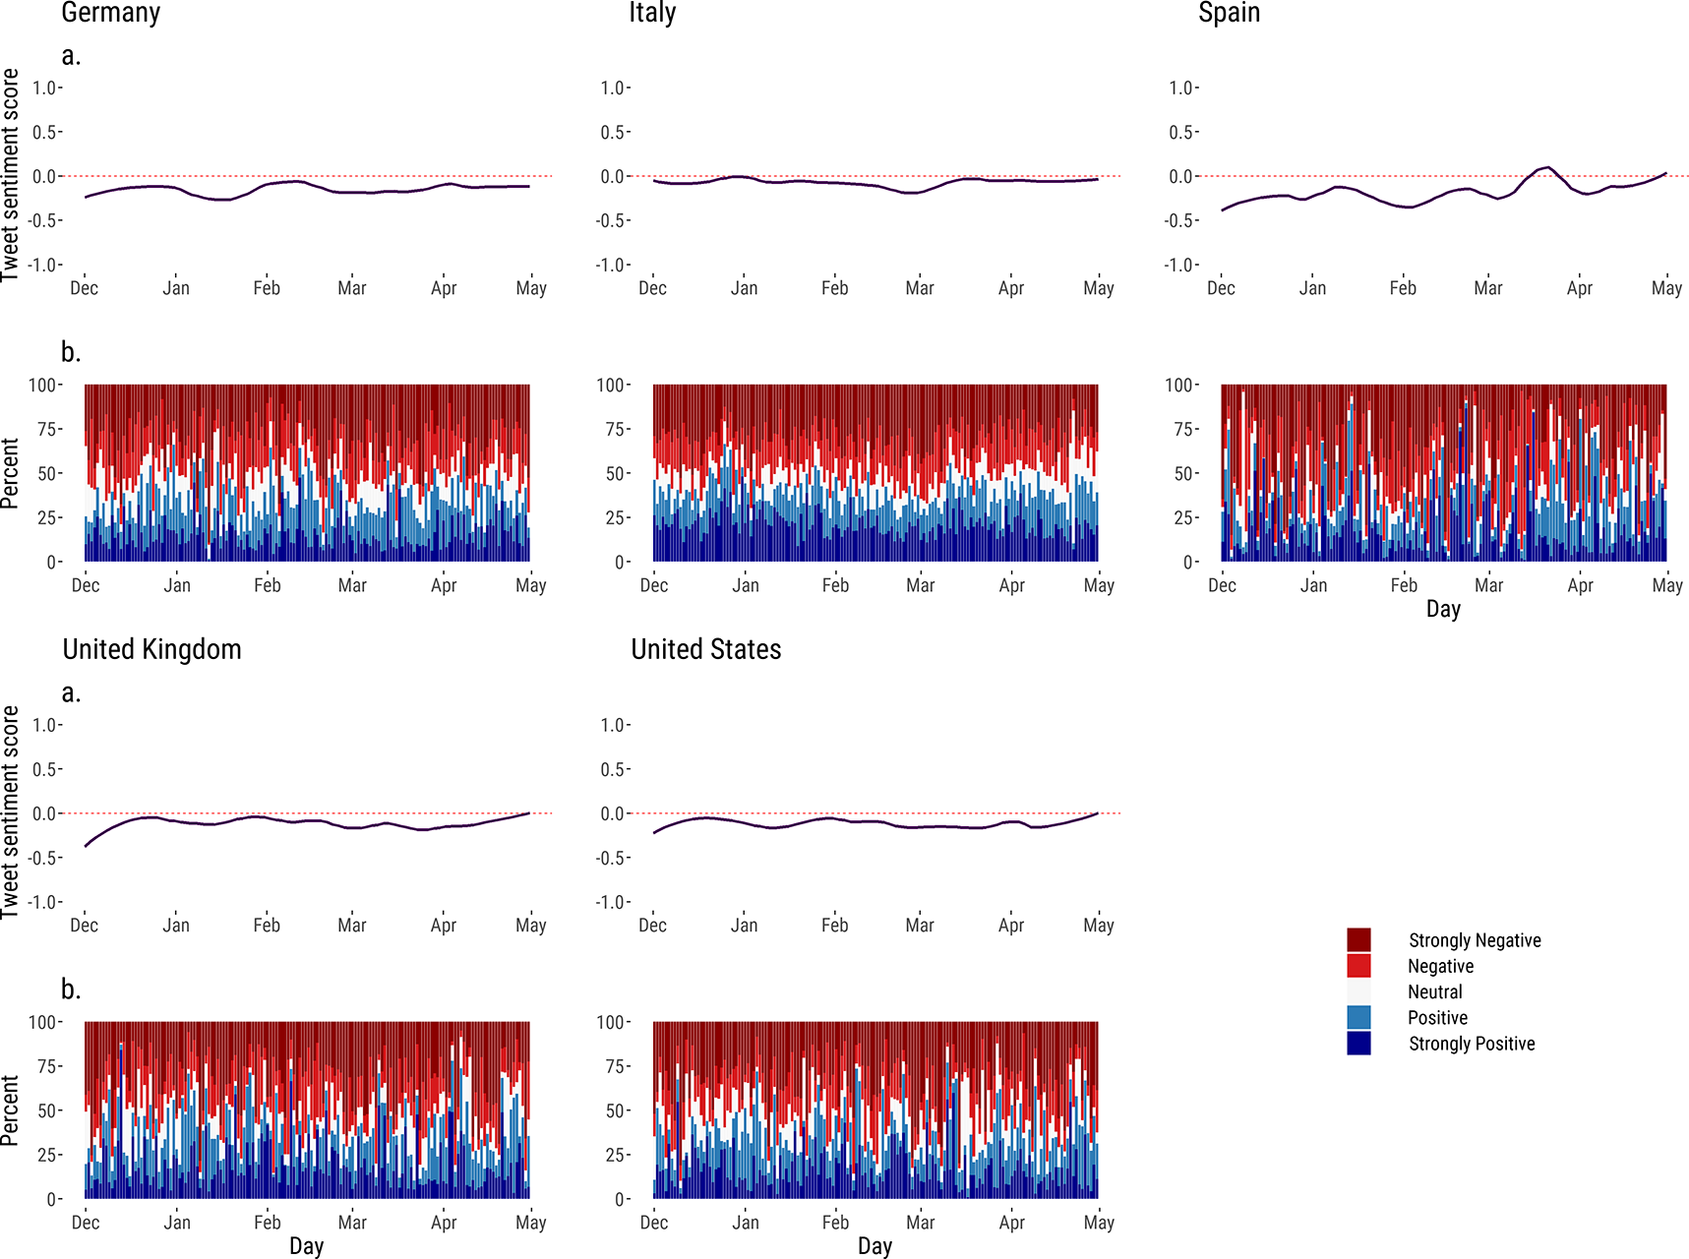
Fourth, the results show little fluctuation in the average daily sentiment score suggesting no significant intensification of negative sentiment tweets during early stages of the COVID19 pandemic. This is an unexpected finding, given the significant rise in immigration-COVID-related tweets observed following increases in the number of new COVID-19 cases, roll-out of stringent nonpharmaceutical interventions and reports of rising xenophobic and racist incidents against people of Asian descent and appearance. However, coinciding with these events, slightly larger average daily negative scores during late February–mid April are observed in Germany, the United Kingdom, and the United States, suggesting a moderate rise in negative immigration-related sentiment. Additionally, these trends also indicate that the increase in immigration-COVID-related tweet activity observed in Figure 1 does not only reflect a rise in tweets carrying negative immigration sentiment narratives, but also represents a comparable increase in tweets containing a positive immigration sentiment (see Figure 3b).
4.4. Identifying emerging sentiment narratives
To identify the narratives underpinning changes in immigration-related sentiment, we applied topic modeling as described in Section 3, and identified 12 distinctive topics:
-
1. Human Rights Abuses (12.38%): This cluster is largely composed of tweets reporting abuses of human rights, including harassment, sexual abuse, homicide, torture, oppression of civil liberties, and genocide. A particularly prominent theme is the detention and deportation of migrants and refugees on the US Southern Border. Tweets expressing concern about COVID-19 and conditions of detention centers, as well as migrants’ access to medical facilities were also present.
-
2. Activism (1.68%): This cluster includes tweets relating to activism around a variety of social issues, involving racism, sexism, ableism, and homophobia linked to migration. The prominent term is a hashtag “#LeaveNoOneBehind.”
-
3. Trump (11.15%): This grouping encapsulates discussions about the Trump administration and its stance on immigration. Tweets tend to express neutral or negative views toward Trump’s immigration stance, including changes in US immigration policy, voicing anger at the President and advisors, or defending the rights and contribution of immigrants to the US society. A smaller minority of tweets in defense of the Trump administration is also included.
-
4. Vulnerable EU Migrants (7.16%): This cluster primarily involves views about immigrants and refugees in detention and holding camps in Southern Europe, particularly Greece and Turkey. It largely revolves around Turkey’s decision to open their border in early March, allowing 4 million migrants and refugees to enter Europe (Bhatti and Apostolou, Reference Bhatti and Apostolou2020; Rankin, Reference Rankin2020). It contains pro-migrant tweets expressing empathy about the poor health and safety conditions of migrant camps, including COVID-19 related risks, and demands on camp closure or opening of EU borders. Neutral tweets tend to report related news. Negative tweets tend to express fear and anger toward migrants and refugees in camps.
-
5. Legal Assistance (1.58%): This group largely includes tweets discussing migration-related legal issues, such as communicating changes in immigration laws, and providing legal travel and migration support services (e.g., visa applications).
-
6. COVID-19 East Asian Prejudice (15.22%): Tweets in this category generally refer to COVID-19-related prejudice behavior against individuals of Asian background, particularly China. The most prominent sentiment is anger toward the Chinese government and people, and tweets accusing the Chinese of causing the pandemic. This cluster also includes expressions of sympathy and solidarity with Chinese and Asian regions.
-
7. Racism and Xenophobia (4.74%): This topic includes tweets on racism and xenophobia relating to right-wing extremist politics, mostly expressing anger toward social intolerance, accusing people or institutions of discriminating against immigrants, as well as religious, ethnic or other minority groups.
-
8. Undocumented Immigration (10.85%): Tweets on this topic largely involve expressions of animosity toward undocumented immigrants. Prevalent concerns include migrants’ illegal status, their burden on taxpayers through benefits and relief funds, and potential to obstruct democratic processes through voter fraud. These tweets tend to use detrimental language, referring to migrants as “illegals,” “aliens,” or “criminals.”
-
9. Brexit (4.41%): This topic includes tweets relating to Brexit and impact on migrants. Prominent issues include proposed changes to the UK immigration policy and implications for EU migrants.
-
10. Migrant Boat Crossings (6.95%): This cluster primarily involves tweets about migrant boat crossing, relating to the UK, Spain and particularly Italy. Tweets mostly refer to Africans crossing the Mediterranean to the coast of Italy.
-
11. Miscellaneous (8.77%): This category includes a variety of tweets related to migration that could not be easily assigned to other categories. A prominent theme is advertisements for events relating to migration, including lectures, debates, academic publications, and opportunities at research institutions. It also contains immigration related tweets from topics which could not be clearly defined (see plots 12 and 13, Supplementary Figure S2).
-
12. Noise (15.09%): This topic incorporates all tweets considered not relevant to migration filtered from topics 5, 9, and 11. It includes themes such as commercial law, UK politics and adverts for nonmigrant events which are neutral in sentiment. It also includes an additional cluster of miscellaneous tweets generated by the LDA (see plot 1, Supplementary Figure S2).
Figure 4 shows the topic composition of tweets for individual countries. Supplementary Figure S3 reports a breakdown of this composition by positive and negative sentiment scores. Whilst a range of views on immigration exists in each country, Figure 4 reveals a consistent prevalence of certain topics. In Germany, vulnerable EU migrants represents the dominant topic, comprising 39% of all German tweets and reflecting concerns around the health and safety conditions of migrants in refugee camps, and opening of Turkey’s EU borders to immigrants. In Italy, migrant boat crossings is the most prevalent topic, accounting for 52% of all tweets in Italy. This topic reflects an ongoing migrant debate largely defined by Mediterranean boat crossings originating from Africa. In Spain, racism and xenophobia is the most prominent topic, involving 33% of all tweets. The predominance of this topic reflects the high degree of negative sentiment observed in Spain (see Figure 2) as related tweets make use of highly detrimental language against migrants. In the United Kingdom and the United States, COVID-19 East Asian prejudice is the most prevalent topic followed by Trump, human rights abuses, and undocumented immigration—all accounting for over 10% of the respective country’s total tweet count. Brexit also features as a key topic in the United Kingdom with 7.7% of all tweets.
Per cent of tweets by topic. See text for a description of each topic.
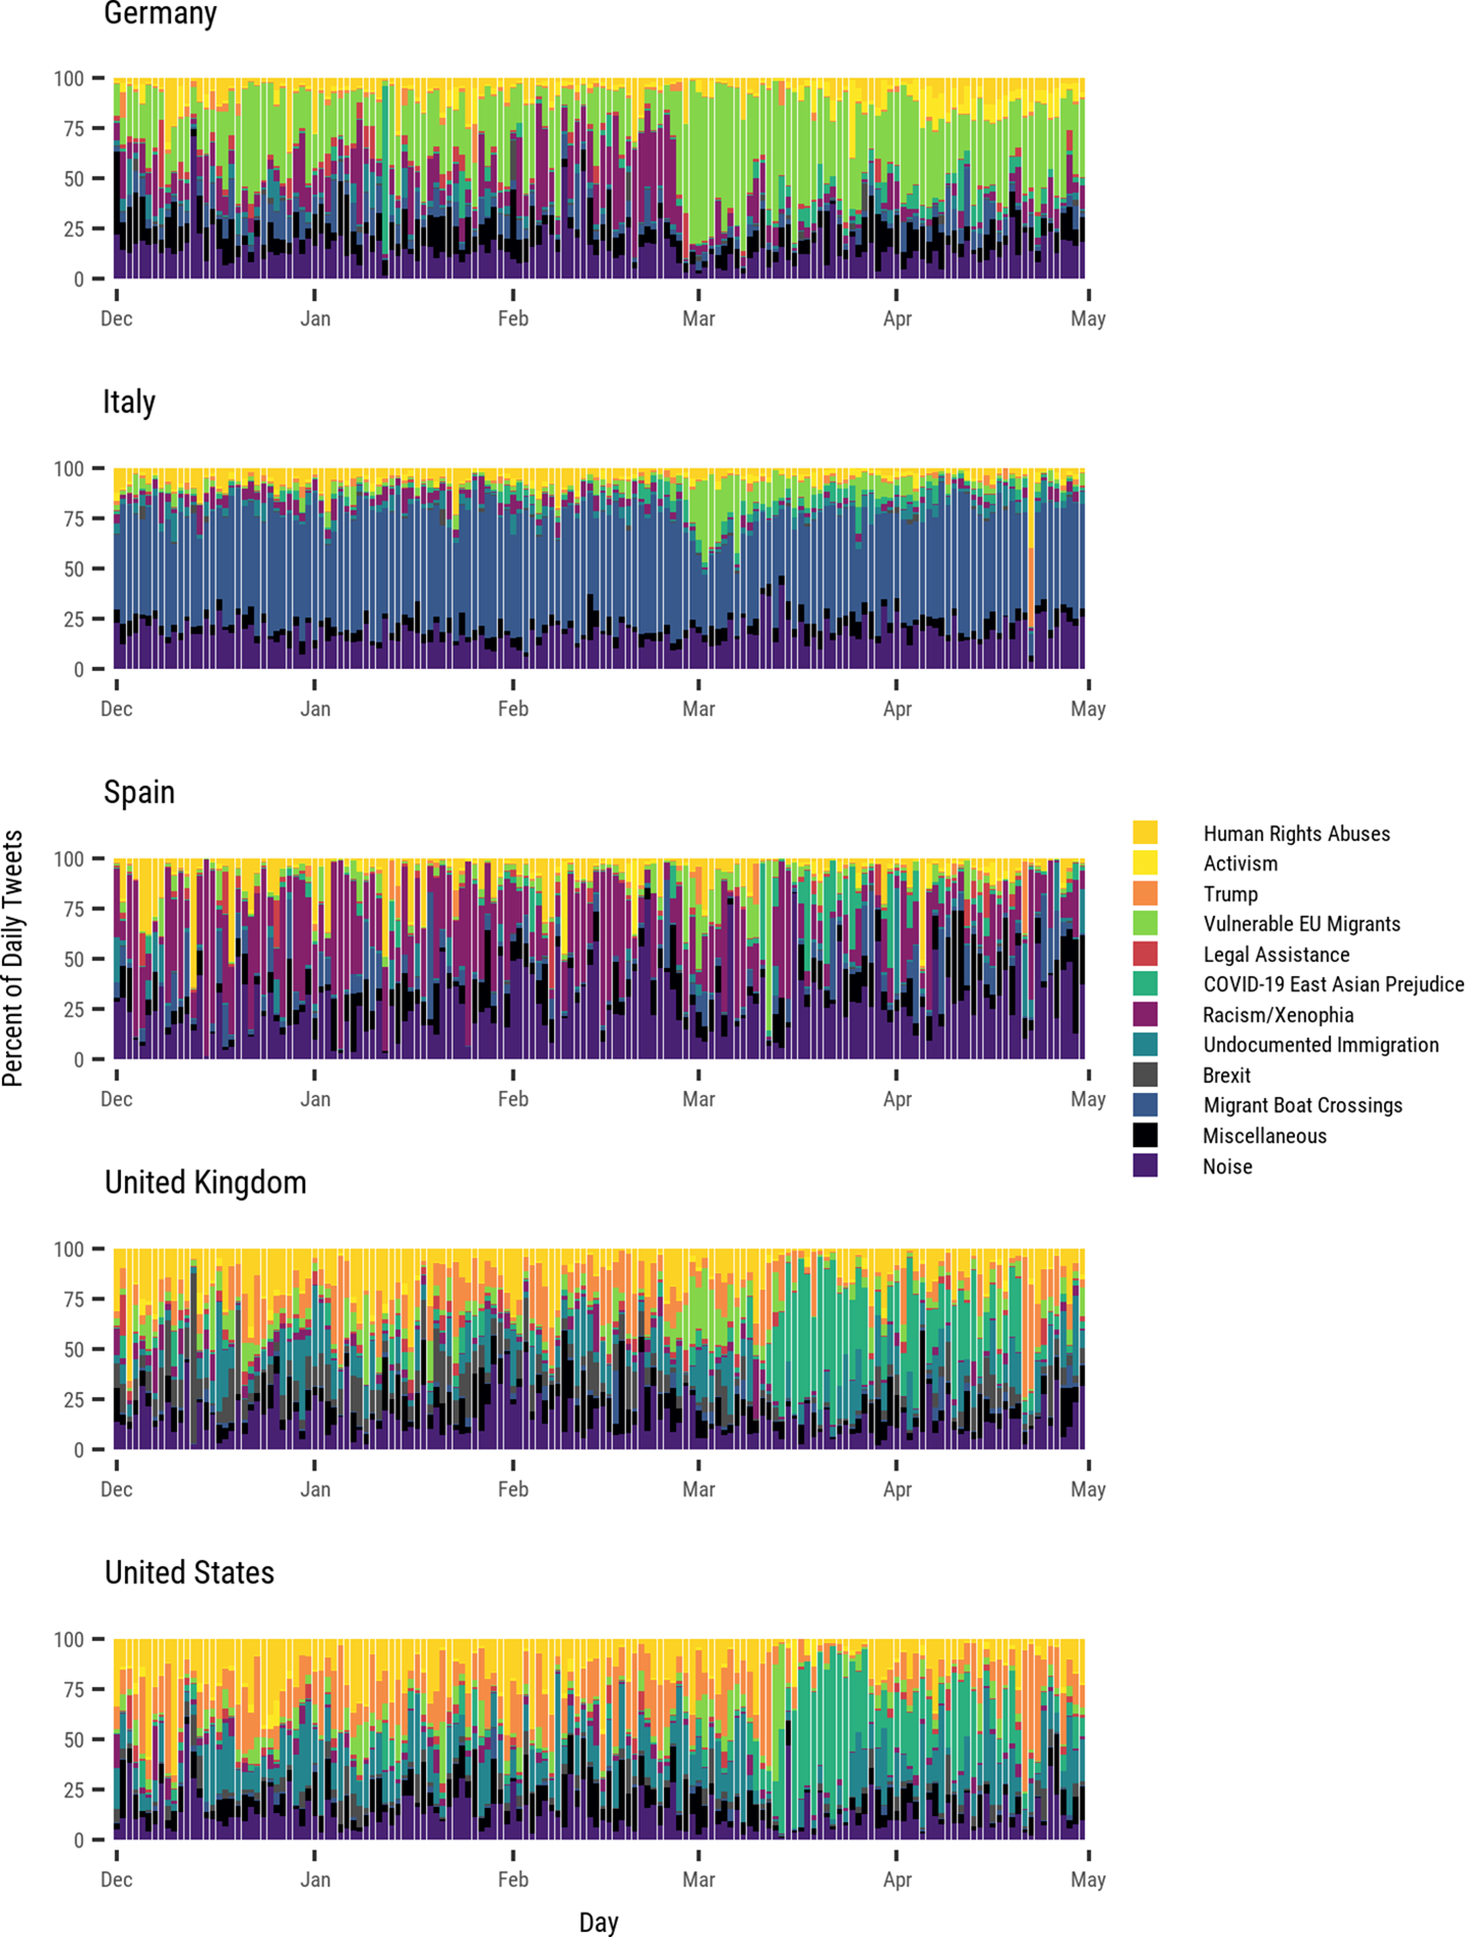
Figure 4 reveals the topics underpinning the temporal changes in daily average sentiment observed in the previous section. It shows that the strengthening in negative sentiment observed in the United Kingdom and the United States was underpinned by a noticeable rise in tweets linked to the COVID-19 East Asian prejudice topic, particularly during mid-March to mid-April. This rise coincides with the remarks made by US President Trump referring to COVID-19 as the “Chinese Virus” on March 17, triggering an increase in the use of negative radicalized terms (see Supplementary Figure S3). Prior to this period (i.e., late February–early March), increased negative sentiment seems to have been driven by tweets linked to three topics: Trump, vulnerable EU migrants, and undocumented immigration. A key event linked to the vulnerable EU migrants topic is Turkey’s decision to let 4 million migrants into Europe in early March (Bhatti and Apostolou, Reference Bhatti and Apostolou2020; Rankin, Reference Rankin2020), which seems to have resulted in increased negative sentiment in all five counties.
In Germany, the topic COVID-19 East Asian prejudice had very little prominence. What seems to have driven an increase in negative sentiment during late February and early April is the vulnerable EU migrants topic. During this period, this topic comprised between 35 and 52% of all tweets in Germany. While positive and negative messages were expressed, tweets containing negative language were expressed more strongly, resulting in higher average sentiment scores. For example, for the first 3 weeks of March, it was −0.52 exceeding average positive sentiment score of 0.44.
The share of the category noise varies across countries. It ranges from only 5% of all tweets in Italy to 11% in Spain. This category tends to comprise tweets with neutral sentiment content, and thus it exerts a very marginal impact on the daily average sentiment score reported in Figure 3. In fact, if anything, it would offset some of the negative sentiment, particularly in Spain where the noise category is more prevalent.
Figure 4 also reveals key topics underpinning the softening of negative sentiment observed toward the end of April in Spain, the United Kingdom, and the United States. In Spain, an increase in positive miscellaneous tweets relating to academic work seems to be a key cause (see Supplementary Figure S3). In the United Kingdom and the United States, three key changes appear to explain this pattern. First, the share of tweets related to the COVID-19 East Asian prejudice topic declined in late April, resulting in a decline in associated expressions of negative sentiment. Second, both countries experience an increase in tweets relating to the Trump topic from April 21, lasting for approximately a week. This shifted the focus of the discussion in both countries to the US President’s announcement of plans to suspend all immigration to the United States (Robinson, Reference Robinson2020). Associated tweets were characterized by a high proportion of neutral to moderately positive tweets (see Figure 3b).
5. Discussion
5.1. Key results
Incidents of rising anti-immigration sentiment have been reported since the start of the COVID-19 pandemic. Yet, lack of data has prevented large-scale analysis of shifts in immigration sentiment. Drawing on Twitter data, we developed a novel framework to measure and monitor changes in immigration sentiment during the COVID-19 pandemic. While we found evidence of an increase in the number of tweets relating to immigration and COVID-19 as the number of new cases rise and lockdown measures were implemented, we did not find consistent evidence of a significant increase in anti-immigration sentiment in any of the five countries in our sample. Yet, we found evidence of a moderate rise in immigration-related tweets conveying negative sentiment during the period of rapidly rising COVID-19 cases in late February to mid-April in Germany, the United Kingdom, and the United States.
We also presented a novel classification of immigration-related tweets, identifying 11 distinct topics (excluding a noise category—see Section 3.3). This classification revealed the prevalence of particular immigration-related discussions in individual countries over time: vulnerable EU migrants in Germany, migration boat crossings in Italy, racism and xenophobia in Spain, East Asian prejudice, Trump, human rights abuses, and undocumented immigration in the United Kingdom and the United States. It also revealed that an increase in negative sentiment tweets linking COVID-19 and immigrants underpinned the moderate rise in negative sentiment in the United Kingdom and the United States, particularly during mid-March to mid-April. Prior to this period (i.e., mid-February/early March), topics revolving around US President Trump’s stance on immigration, vulnerable EU migrants and undocumented immigration largely underpinned the rise in negative sentiment in both countries. In Germany, tweets around racism and xenophobia, and vulnerable EU migrants were associated with the moderate rise in negative sentiment observed during late February–mid April.
We also provided evidence of a consistent pattern of moderate negative sentiment across all countries in our sample. Shifts in tweet sentiment occurred but the observed changes were temporary. Spain stood out as the country with the largest daily negative sentiment scores, which were associated with a discussion around racism and xenophobia that tended to include strong negative language. We also offered evidence of social polarization in relation to immigration, showing a relatively high concentration of strongly positive and negative sentiment tweets. Neutral, moderate positive and negative sentiment tweets were less prominent.
5.2. Interpretation
Our findings suggest a mild intensification in negative sentiment only in Germany, the United Kingdom, and the United States, despite a significant increase in tweet activity as the pandemic unfolded in late February–early March in the five countries in our sample. This is because, coupled with a rise in negative sentiment tweets on immigration, there was also an increase of comparable magnitude in positive sentiment tweets, highlighting the contribution of migrants to the COVID-19 response working in essential occupations, such as the healthcare, food and agriculture, and hospitality sector, particularly in the United Kingdom and United States (ODI, 2020). In addition, positively praised, empathetic tweets expressing concerns about the ways COVID-19 was impacting vulnerable migrant groups were particularly prominent in Germany. The resulting overall daily sentiment of the discussion in individual countries was thus relatively balanced.
We presented evidence of a predominantly negative immigration sentiment in Germany, the United Kingdom and the United States, particularly in Spain, and to a lesser extent in Italy. These findings are consistent with existing research indicating predominantly negative attitudes in varying intensity in Europe (Dennison and Geddes, Reference Dennison and Geddes2019; Heath et al., Reference Heath, Davidov, Ford, Green, Ramos and Schmidt2020) and a pattern of declining but persistent opposition to immigration in the United States (Heath et al., Reference Heath, Davidov, Ford, Green, Ramos and Schmidt2020). We also presented evidence which expands existing work by showing the short-term shifts in immigration sentiment. These changes highlight how the prevalent sentiment may experience temporary changes in response to key political, xenophobic and abusive incidents, but also statements fueling misinformation.
We also contributed to existing research by capturing the multidimensional views of immigration. While studies have explored various dimensions of immigration attitudes, prior empirical work tends to focus on a single dimension of immigration, particularly on the perceived level or salience of immigration (Dempster et al., Reference Dempster, Leach and Hargrave2020). Yet, public perception varies widely across various dimensions (Ueffing et al., Reference Ueffing, Rowe and Mulder2015). We provided a more holistic perspective of the range of topics which contribute to the manifestation of immigration attitude. We presented a classification of 11 topics which help to characterize the themes and issues discussed in individual countries. These topics capture persistent discussions around racism, xenophobia, illegal immigration, and human right abuses, but also issues which emerge more recently, such as COVID-19, Brexit, vulnerable EU migrants and Trump’s stance on immigration. As a result, our measure of immigration sentiment can be conceived as a composite indicator of attitudes toward immigration comprising a range of perceptions.
Taken together, our findings underscore the dynamic and responsive nature of Twitter users, and the capacity of tweets with negative sentiment content to generate immediate positive sentiment responses and vice versa (Bae and Lee, Reference Bae and Lee2012). Second, they also highlight that Twitter data can serve as a useful resource to measure and monitor immigration-related sentiment in real or near real-time. Global trends indicate that new microbial threats will continue to emerge at an accelerating rate (Jones et al., Reference Jones, Patel, Levy, Storeygard, Balk, Gittleman and Daszak2008), and we know that pandemics trigger stigmatization (Link and Phelan, Reference Link and Phelan2006). The unpredictable emergence and rapid geographical proliferation of stigmatization during pandemics mean that developing effective strategies for inhibiting the spread of stigmatization is challenging. Traditional sources of information on public attitudes are expensive and hard to collect in pandemic settings, especially if we are dealing with stigmatization on a global scale that accounts for multiple contexts. We now have time to prepare and anticipate the next pandemic outbreak or events that may cause sudden shifts in migration sentiment—and develop analytical frameworks to monitor these shifts, to appropriately inform policy interventions as to when and where shocking racist and xenophobic incidents are occurring.
We also presented evidence of immigration as a highly divisive societal issue, particularly in Spain. Evidence of increasing political polarization exists in the United Kingdom and the United States, and immigration has featured as a main divisive topic (Conover et al., Reference Conover, Ratkiewicz, Francisco, Gonçalves, Menczer and Flammini2011; Hong and Kim, Reference Hong and Kim2016; Bail et al., Reference Bail, Argyle, Brown, Bumpus, Chen, Fallin Hunzaker, Lee, Mann, Merhout and Volfovsky2018). Social media is likely to reinforce and geographically expand this trend to other national settings. Social media echo chambers are expected to reinforce pre-existing beliefs by restricting exposure to opposing views (Bail et al., Reference Bail, Argyle, Brown, Bumpus, Chen, Fallin Hunzaker, Lee, Mann, Merhout and Volfovsky2018). Social media may thus lead to increased social polarization regarding immigration, and rising cases of xenophobia, racism and prejudice. Understanding social media networks is thus critical to determine how anti-immigration sentiment content is shared and spread, as well as identifying key spreaders of negative sentiment and active bots sharing misinformation. Such understanding is essential to disrupt the spread of misconceptions on which negative immigration sentiment is usually based (European Commision, 2019). Recent evidence demonstrated that knowing key pieces of information underpinning immigration-related misbeliefs is key to fostering a more favorable view toward immigration (European Commision, 2019). Effective and timely monitoring of public opinion about immigration policy changes and impacts may help formulate interventions to reduce anti-immigration attitudes and foster social cohesion. If rigorously and responsibly handled, Twitter data would be an important tool to expand our existing knowledge of the misconceptions and contact network underpinning the formation of attitudes toward immigration, especially if they are used to complement existing data sources. Facilitating access to, and handling of, Twitter data represent major challenges that need to be addressed to deliver this promise (Kim et al., Reference Kim, Hansen, Murphy, Richards, Duke and Allen2013).
5.3. Challenges and limitations
Gauging the wider generalizability of our findings is challenging. Twitter users are not representative of national populations, being over-represented by younger age groups, particular ethnicities and socioeconomic status (McCormick et al., Reference McCormick, Lee, Cesare, Shojaie and Spiro2017; Sloan, Reference Sloan2017). Extending our analysis to incorporate other platforms that each have different demographics and purposes can help to broaden the generalizability of our results, as well as integrating these data with information from traditional survey sources. An emerging approach to improve public opinion estimates based on Twitter data is the use of demographic sample weights (McCormick et al., Reference McCormick, Lee, Cesare, Shojaie and Spiro2017), which may need prediction of demographic attributes from Twitter users’ information profiles (Graells-Garrido et al., Reference Graells-Garrido, Baeza-Yates and Lalmas2020) as these attributes are not always or rarely available. As this area develops and best practices are established, the design and implementation of sample weights represents a fruitful area for future research.
We analyzed changes in migration sentiment over early stages of the pandemic. Future research is needed to establish long-term trend changes in attitudes toward immigration extending beyond the pandemic, and assess if the changes identified in our analysis were indeed temporary. The pandemic may have actually triggered long-term scarring effects on the way in which East Asian populations are perceived. Additionally, we identified key topics and events related to these changes in migration attitudes. Future research could expand this analysis by identifying the key factors influencing shifts in migration sentiment during the pandemic. This is however a challenging task requiring a causal experimental design and integration of disparate data sources, if available, to measure and isolate the influence of individual-, family-level and contextual factors on attitudes toward migration. Such analysis could enable assessing the impact of specific social, political, economic and media events on attitudes toward immigration, and testing of hypotheses from theories on attitudes formation.
A key challenge in measuring sentiment from text is the appropriate interpretation of sentiment scores. Not all messages associated with negative (positive) sentiment scores convey negative (positive) sentiment toward immigration. Messages may contain multiple opinion targets with contradicting sentiment expressions. Sentiment may also relate to other textual features in a tweet, such as processes of slavery and human trafficking, rather than immigration or immigrants. Antimigrant groups may use expressions containing positive sentiment to celebrate events which restrict migrant rights (Rowe et al., Reference Rowe, Mahony, Graells-Garrido, Rango and Sievers2021a). Interpretation of sentiment polarity scores must thus be coupled with a systematic analysis of the original tweets as we have proposed in this article through the use of topic modeling.
Additionally, an unpredictable amount of “noise” (i.e., tweets which are not directly relevant to a search criteria) is likely to infiltrate into the data collection. We identify two key sources of “noise”: (a) the use of search terms; and, (b) the use of APIs. The use of specific words will necessarily entail the collection of tweets which contain a term but relating to a very different context. For example, our search terms captured a small number of tweets containing the term “migration” in the context of bird migration. Similarly, the use of API implies some noise will be introduced into the resulting data sets as the default option of the Twitter keyword operator is to search wound and unwound URLs within tweets (Twitter, 2020), and while URLs tend to contain words included in the search criteria, the tweet message may not. Future research based on Twitter should consider strategies to mitigate this unpredictable amount of noise in the data collection design while minimizing the loss of some relevant tweets.
6. Conclusion
COVID-19 has inflicted a significant health cost and triggered a wave of prejudiced behavior and physical attacks against individuals of Asian descendent and appearance. Lack of timely data has prevented detailed analysis of the evolution of immigration sentiment since the start of the pandemic. Yet, robust and scalable approaches are needed to understand the scale and spread of these discriminatory acts and develop appropriate counter-measures. Drawing on Twitter data, this article proposed a framework to measure and monitor changes in attitudes toward immigrants during early stages of the COVID-19 outbreak in Germany, Italy, Spain, the United Kingdom, and the United States. We presented evidence of growing social polarization concerning migration, showing high concentrations of strongly positive and strongly negative sentiments. We also found evidence of an increase in the number of tweets relating to immigration and COVID-19, but no evidence of a significant increase in anti-immigration sentiment is apparent in our sample as rises in the volume of negative messages are offset by comparable increases in positive messages. These results do not mean that governments should ignore the potential impact of misinformation fuelling misconceptions and prejudiced behavior against immigrants. Rather, a systematic approach is needed to monitor immigration sentiment and identify when and where pandemic-related racist and xenophobic incidents are occurring. Social media has become a key battleground in the fight against misinformation and social hazards during COVID-19. It is important that physical as well as digital spaces remain safe, accessible and free from abuse, and that people are not stigmatized, and their fears and distress are not exploited during crises.
Supplementary Materials
To view supplementary material for this article, please visit http://doi.org/10.1017/dap.2021.38.
Data Availability Statement
The data, code, and relevant description to replicate the analysis and results reported in this article can be found in an open-access Github repository registered on the Open Science Framework with DOI 10.17605/OSF.IO/84JWV.
Acknowledgments
We are grateful to Mark Green for sharing some base code for data collection and pre-processing. We also acknowledge a pre-print of the current article (Rowe et al., Reference Rowe, Mahony, Graells-Garrido, Rango and Sievers2021b; Rowe et al. Reference Rowe, Mahony, Sievers, Rango and Graells-Garrido2021c).
Funding Statement
This research was supported by grants from the University of Liverpool Global Challenges Strategy Group Grant; Liverpool COVID-19 Partnership Strategic Research Fund.
Competing Interests
The authors declare no competing interests exist.
Author Contributions
F.R. devised the project, the main conceptual ideas, and proof outline. F.R. and M.M. performed the numerical calculations and wrote the first draft. F.R., M.M., and E.G.-G. discussed the technical details. M.M. collected the data. F.R., M.M., E.G.-G., M.R., and N.S. discussed the results, revised the manuscript, and approved the final version.
Ethical Standards
The research meets all ethical guidelines, including adherence to the legal requirements of the study country. Ethical approval for the project was granted by the University of Liverpool Research Ethics Committee (ref: 7654).


 Open access
Comments
No Comments have been published for this article.