

The emergence of the Neolithic in south-west Asia encompasses the transition from Late Pleistocene hunter-gatherer to Holocene sedentary farming communities. Our understanding of this transition is dependent upon an accurate and detailed chronology, most notably for the late Epi-Palaeolithic and Pre-Pottery Neolithic A (PPNA) periods. A calibrated 14C chronology for the whole of the Neolithic in south-west Asia has been proposed (Aurenche et al. Reference Aurenche, Gaket, Régagnon-Caroline and Évin2001) and a burgeoning catalogue of additional 14C dates has been assembled (http://www.exoriente.org/associated_projects/ppnd.php). Recent studies have focused on the chronological relationships between human settlement and climate change (eg Weninger et al. Reference Weninger, Alram-Stern, Bauer, Clare, Danzeglocke, Jöris, Kubatzki, Rollefson, Todorova and van Andel2006; Blockley & Pinhasi Reference Blockley and Pinhasi2011; van der Plicht et al. Reference Van der Plicht, Akkermans, Nieuwenhuyse, Kaneda and Russell2011). Unfortunately, few individual Epi-Palaeolithic and PPNA sites have been subject to a rigorous dating analysis, making the use of their dates within such long-term studies problematic. Moreover, the number of samples from any single site is usually too small and they have insufficient contextual information to enable an intra-site chronological study; it is regrettable that lists of dates are still published from potentially important sites without any information about sample material or context, which significantly reduces their value (eg for Tell Qaramel: Mazurowski et al. Reference Mazurowski, Danuta, Michczyńska, Pazdur and Piotrowska2009).
Even when 14C datasets have been obtained from well-documented sites such as at Mureybet in the northern Levant (Ibàñez Reference Ibáñez2008), chronological interpretations have been greatly challenged by the redeposition of sediment containing cultural material and charcoal used in dating programmes. The severity of this situation was noted by Ofer Bar-Yosef (Reference Bar-Yosef2009, 127) in his review of Mureybet’s chronology ‘Apparently the intensive building and rebuilding of rounded and oval pithouses caused an overall mixing of the charcoal samples and their spatial and vertical distribution is meaningless.’
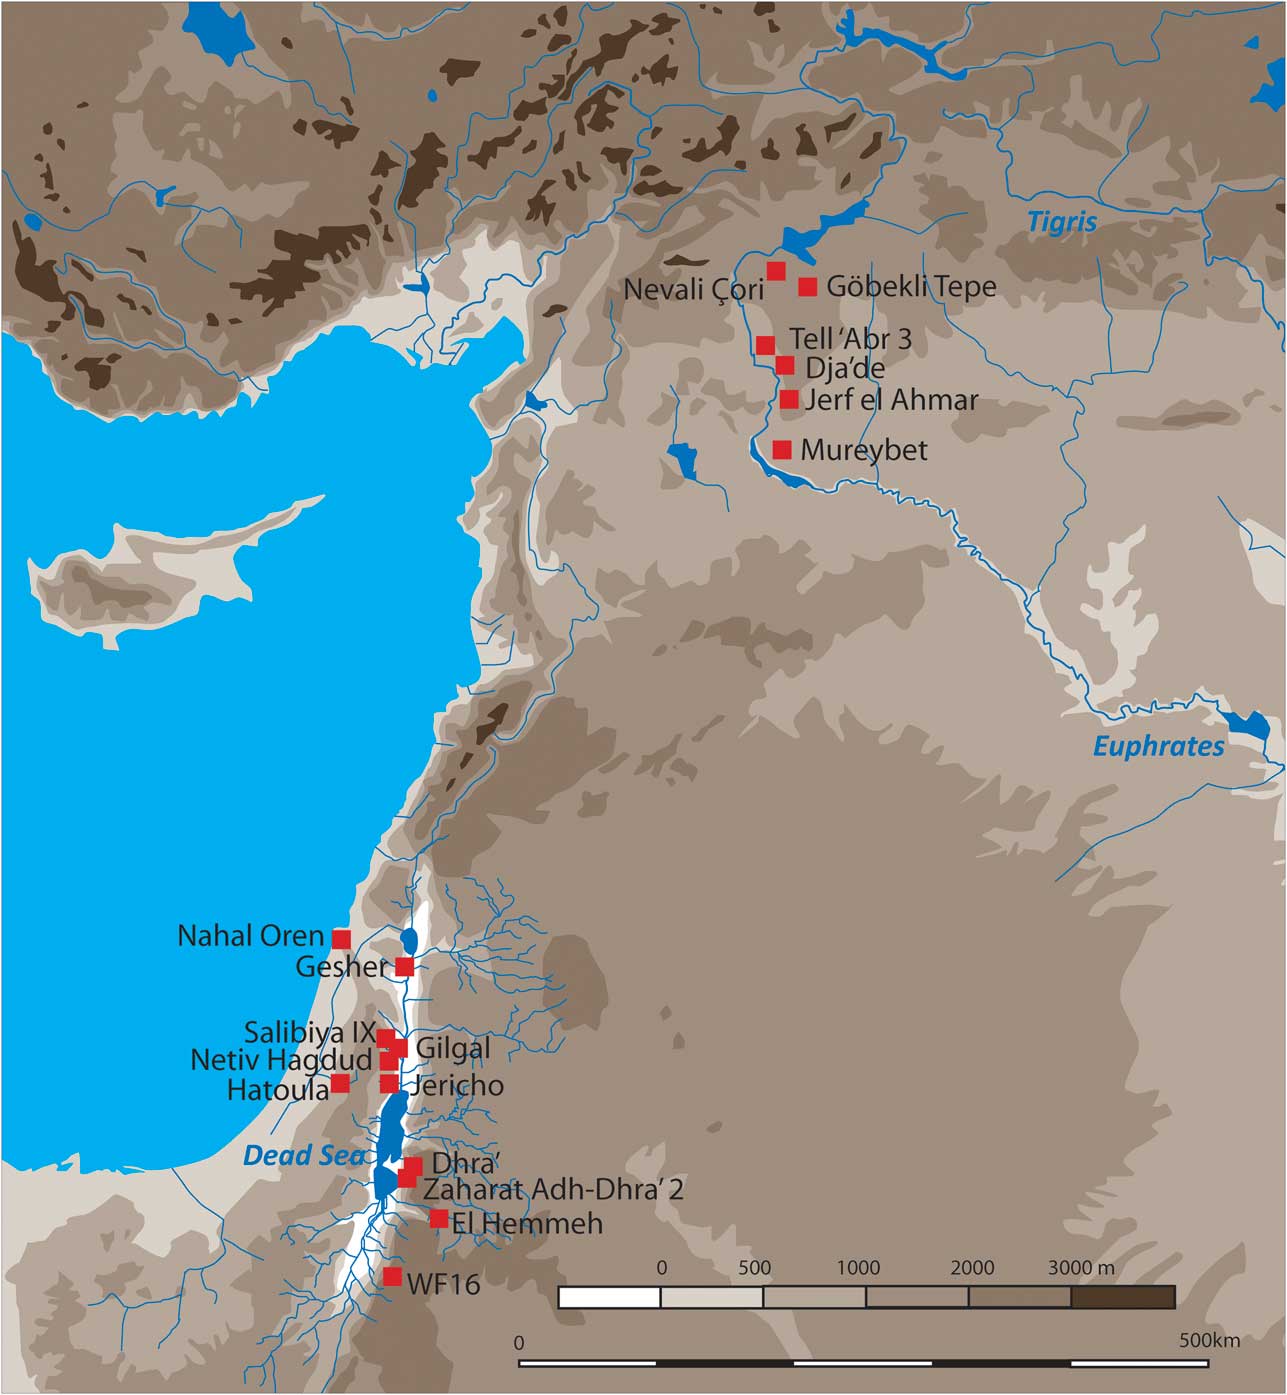
In this contribution we attempt to find ‘meaning’ in a similar dataset obtained from the PPNA site of WF16 located in southern Jordan (Fig. 1). Using archaeo-botanical evidence we quantify an old wood effect known to be present (Finlayson & Mithen Reference Finlayson and Mithen2007, 460–9) that we use to offset age ranges obtained from samples which are likely to be old wood. Using this offset, we undertake Bayesian analysis of 46 AMS 14C dates to develop chronological models for five individual structures, a midden, an exterior mud-plaster surface, and three evaluation trenches containing multiple structures – all of which are referred to as ‘Objects’ (O, as in O45, O75 and O100). This term was used during the 2008–2010 excavation as a grouping of spatially and stratigraphically bound contexts making up an archaeological entity such as a structure or an area between the structures and we broaden it here to include individual stratigraphic sequences from three evaluation trenches. The term derives from the Integrated Archaeological Database (IADB http://www.iadb.org.uk), which is widely used to manage large-scale excavation and post-excavation projects including that of WF16.
Location of WF16 & key PPNA sites in the Levant
We use these models to provide estimates for the likely start of activity associated with the excavated deposits from the Objects. We then aggregate the dates from each Individual Object Model (IOM) to create a single Site Chronological Model (SCM) for which we evaluate the influence of plateaus on the calibration curve by using simulation techniques. Finally we draw out methodological issues arising from this study that are of general relevance for dating early Neolithic occupation sites in arid, erosional environments and summarise the chronology for WF16 as ascertained from this study.
As such, we are hopeful that this study provides a sufficiently refined approach to 14C date analysis, in keeping with the observation made by Benz et al. (Reference Benz, Coşkum, Hajdas, Deckers, Riehl, Alt, Weninger and Özkaya2012, 291) in their recent study of Körtik Tepe that ‘a cautious and critical analysis of the sample provenience in each individual case is a paramount condition for chronological discussions’. Moreover, we demonstrate that WF16 has the potential to provide a veritable laboratory for exploring methodological issues relating to the 14C dating of early Neolithic sites within arid and eroding environments.
WF16 And The PPNA In The Southern Levant
WF16 is located in Wadi Faynan at its confluence with Wadis Dana and Ghuwayr (Fig. 2). It is positioned on a gravel knoll overlooking the floor of the wadi, with the knoll having been accentuated by the accumulation of collapsed pisé and other archaeological debris from the PPNA and potentially preceding Epi-Palaeolithic activity. The site was discovered in 1996, subject to evaluation between 1997–2003 and excavation between 2008–2010 (Finlayson & Mithen Reference Finlayson and Mithen2007; Finlayson et al. Reference Finlayson, Mithen and Smith2011a; Mithen et al. Reference Mithen, Finlayson, Smith, Jenkins and Maričevićforthcoming).
The knoll of WF16 within Wadi Faynan landscape: a) viewed from the south with Wadi Ghuwayr in the background; b) viewed from the south-east in relation to the confluence of Wadi Ghuwayr & Wadi Dana forming Wadi Faynan

The PPNA is a transitionary culture between mobile hunter-gatherers and fully-fledged sedentary farmers, often cited as existing between c. 12.00–10.55 ka cal bp, and hence starting within the Younger Dryas (Bar-Yosef & Belfer Cohen Reference Bar-Yosef and Belfer Cohen1989; Kuijt & Goring-Morris Reference Kuijt and Goring Morris2002). It is distributed throughout the Levant, with a notable cluster of sites in the Mediterranean zone of the Jordan Valley, including Jericho, Hatoula, Netiv Hagdud, Gilgal, and Gesher (Fig. 1; Kenyon & Holland Reference Kenyon and Holland1981; Lechavallier & Ronen Reference Lechavallier and Ronen1994; Bar-Yosef & Gopher Reference Bar-Yosef and Gopher1997; Garfinkel & Dag Reference Garfinkel and Dag2006; Bar-Yosef et al. Reference Bar-Yosef, Goring-Morris and Gopher2010) and in northern Syria and southern Turkey, the latter having spectacular architecture and artworks such as at Jerf el Ahmar, Göbekli Tepe, Dja’de, and Tell ‘Abr 3 (Stordeur et al. Reference Stordeur, Helmer and Wilcox1997; Coqueugniot Reference Coqueugniot1999; Yartah Reference Yartah2004; Schmidt Reference Schmidt2011). A further cluster of sites has been explored on the eastern side of the Wadi Araba in southern Jordan, including Dhra’, WF16 , Zaharat Adh-Dhra’ 2, and El Hemmeh (Fig. 1; Edwards et al. Reference Edwards, Meadows, Metzger and Sayej2002; Finlayson et al. Reference Finlayson, Kuijt, Arpin, Chesson, Dennis, Goodale, Kadowaki, Maher, Smith, Schurr and McKay2003; Makarewicz et al. Reference Makarewicz, Goodale, Rassman, White, Millers, Haroun, Carlson, Pantos, Kroot, Kadowaki, Casson, Williams, Austin and Fabre2006; Finlayson & Mithen Reference Finlayson and Mithen2007).
The scale of architecture, volume of refuse, and its pattern of discard suggest a degree of sedentism within the PPNA, with sites such as Jericho acting as the apex of a settlement hierarchy (Kuijt Reference Kuijt1994) while Göbekli Tepe may have served as a locality for seasonal aggregations (Schmidt Reference Schmidt2011). Although the quantity, diversity, and size of mortars and pestles suggest the intensive processing of plants, there are no unequivocal examples of morphologically domesticated cereals or legumes within the PPNA (Nesbitt Reference Nesbitt2002), and the continued use of mortars rather than querns suggests cereal exploitation was still of limited dietary importance. The intensity of plant gathering, processing, and storage appears substantial in light of the storage facilities found at Dhra’ and the dedicated processing areas at Jerf el Ahmar (Kuijt & Finlayson Reference Kuijt and Finlayson2009; Wilcox & Stordeur Reference Willcox and Stordeur2012). Weed floras, concentrations of wild barley and wild oats from Gilgal, and of wild lentils from Netiv Hagdud, suggest plant cultivation (Colledge Reference Colledge2001; Weiss et al. Reference Weiss, Kislev and Hartmann2006), while seedless figs at Gilgal might indicate artificial manipulation of tree crops (Kislev et al. Reference Kislev, Hartmann and Bar-Yosef2006; Lev-Yadun et al. Reference Lev-Yadun, Ne'eman, Abbo and Flaishman2006; Zeder Reference Zeder2009). As such, PPNA communities fall into the category of ‘low-level food producers’ as described by Smith (Reference Smith2001).
Despite playing a critical role in Neolithic emergence, the chronology of the PPNA remains poorly understood. Although a substantial number of 14C dates are available, many samples lack contextual data, identification of the material dated and information about pre-treatment; numerous dates have large uncertainties, which seriously inhibit their value. With regard to the southern Levant, Blockley and Pinhasi (Reference Blockley and Pinhasi2011) attempted to cleanse the 14C database by rejecting all such problematic dates, reducing the number of samples for the Later Epi-Palaeolithic (Natufian) and PPNA from 152 to 89. From these they proposed that the beginning of the PPNA falls within a range of 11.78–11.42 ka cal bp, coinciding with the start of the Holocene rather than being located within the Younger Dryas.
WF16 provided one of the largest samples of dates used within the Blockley and Pinhasi (Reference Blockley and Pinhasi2011) study, these being drawn from the 21 AMS dates arising from the 1997–2003 site evaluation (Finlayson & Mithen Reference Finlayson and Mithen2007). The 2008–2010 excavation has more than doubled the WF16 sample size by providing a further 25 AMS dates. As such, the total sample of 46 AMS dates can be used to compare Blockley and Pinhasi’s proposal for the regional start of the PPNA with that derived for WF16 itself. They also enable an estimate for the overall duration of PPNA activity at a single locality and how one settlement may have developed over time – as far as can be determined from a partially excavated site.
WF16: Site Evaluation & Excavation
The site evaluation was undertaken by the excavation of three small test trenches (Trenches 1–3) and 19 test pits around the periphery and in the vicinity of the WF16 knoll (Fig. 3). This suggested the PPNA activity was concentrated on the knoll itself and involved sub-circular, semi-subterranean structures constructed with a mixture of pisė- and stone-built walls. Twenty-one AMS dates were acquired from the three test-trenches, which were stratigraphically isolated from each other. While these dates suggested occupation between 11.6 and 10.2 ka cal bp (Finlayson & Mithen Reference Finlayson and Mithen2007), the influence of potential old wood remained unresolved, while the limited scale of excavation combined with a complex taphonomic history and lack of Bayesian analysis impeded interpretation of the dates.
Plan of WF16 showing location of 1997–2003 evaluation trenches & the 2008–2010 excavation

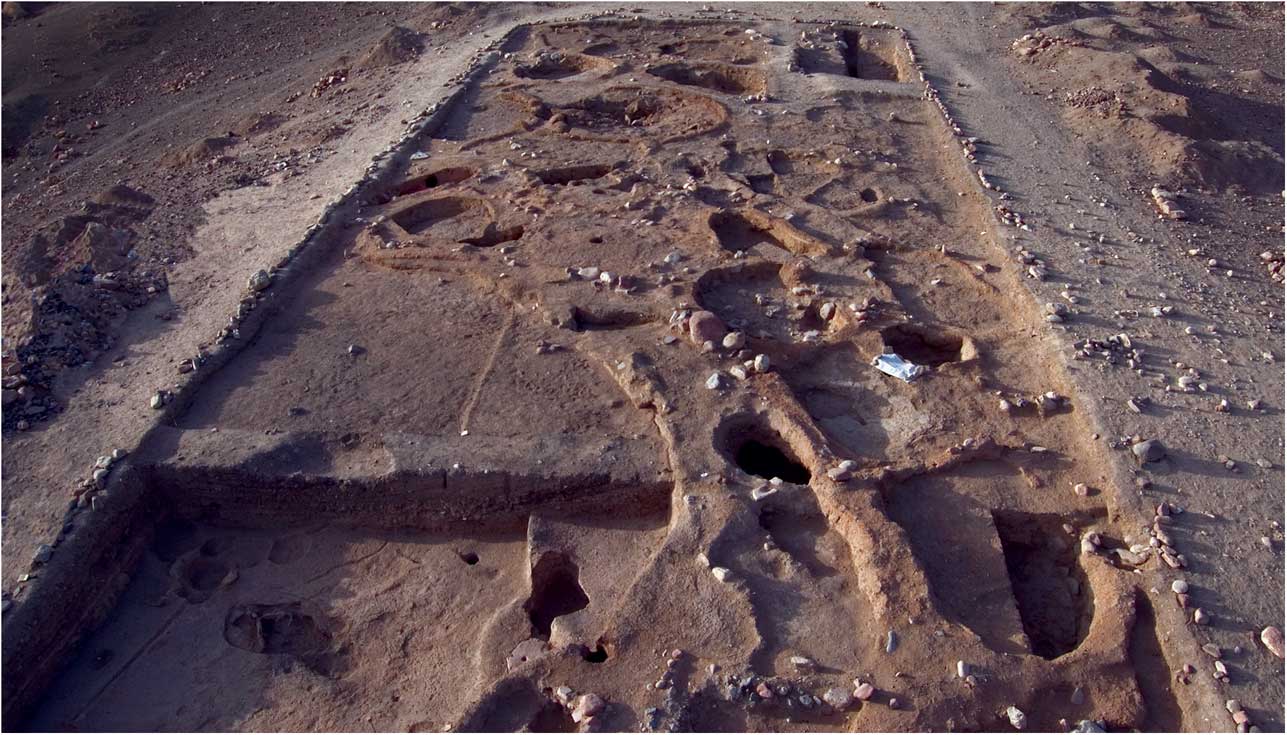
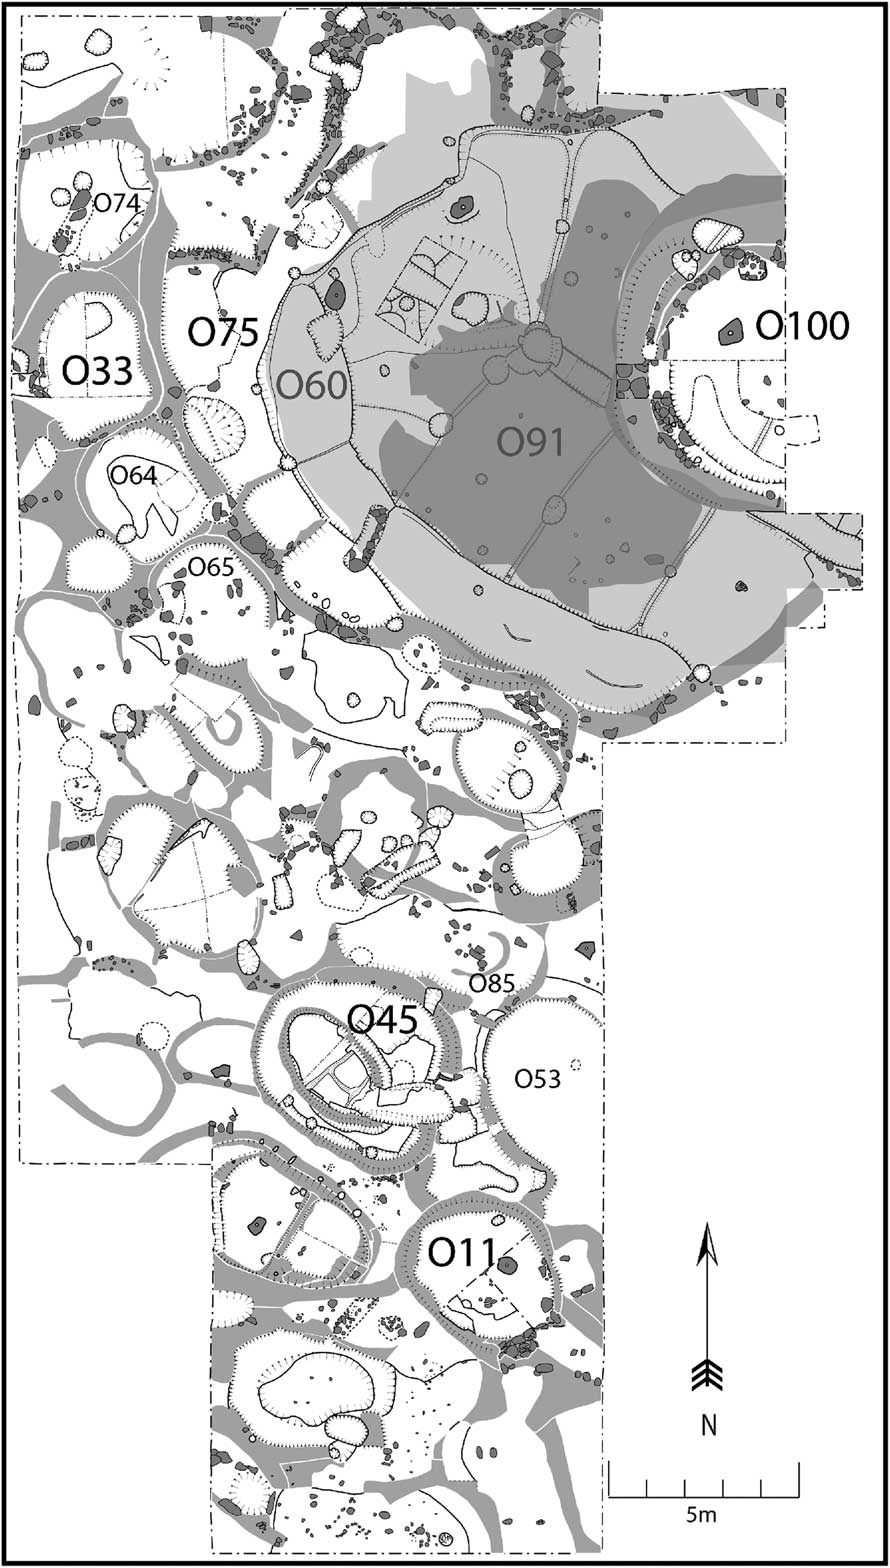
A 40×15 m area excavation was undertaken across the summit of the knoll during three field-seasons between 2008 and 2010 (Figs 3–5). This exposed a dense cluster of structures of varying size and architectural design, which had a limited extent of inter-cutting between their walls. They included one particularly large semi-subterranean structure (O75), most likely used for communal activity (Mithen et al. Reference Mithen, Finlayson, Smith, Jenkins, al-Najjar and Maričević2011), which was succeeded by a circular free-standing structure O100 and an accompanying exterior surface O91 built within the sunken interior of Structure O75. An extensive midden (O60) then accumulated on top of surface O91 filling up the remaining interior of Structure O75. This kind of vertical structural sequence is so far uncommon elsewhere within the excavated part of WF16. In some instances the archaeological evidence suggests the building of new structures with spatial respect to those already existing (eg Structures O74, O33, O65, and O64 built in respect to Structure O75) and in some cases the conjoined redevelopment of adjacent structures (O45, O53 and O85). One of the key interpretative challenges of this settlement is the extent to which the spatially compatible structures were in contemporaneous use. Some could have fallen into disuse or became midden depositories while nearby structures were occupied, but they could then have been cleaned out, rebuilt and reoccupied on more than one occasion (eg O45, O53).
Excavation at WF16 April 2009 showing the exposure of the floor of Structure O75 in the foreground and the Midden O60 contained with in the walls of Structure O75
Plan of WF16, labelling the Objects that have been dated by AMS, along with others referred to in the text
More than 30 burials were excavated, these having been cut into floors and walls (Mithen et al. Reference Mithen, Finlayson, Maričević, Smith, Jenkins and al-Najjar2016). The majority appear to derive from a late phase of the PPNA settlement, one that has largely been destroyed by erosion other than for the burials cut into earlier deposits. A large quantity and diversity of artefacts were recovered, including chipped and coarse stone artefacts, worked bone, stone and shell beads, all of which were technologically and typologically consistent with the PPNA. Large samples of archaeo-botanical and faunal remains were also recovered which are currently undergoing analysis; preliminary evaluation suggested an insufficient survival of collagen within the bones to enable AMS dating. However, a further 25 AMS dates were acquired from charcoal, this being the maximum number of dates possible with the available funding. The samples were taken from well-documented stratigraphic contexts within five of the c. 30 structures exposed by the 2008–2010 excavations, Structures O11, O33, O45, O75 (the ‘communal’ structure) and O100 (free-standing circular building), from a midden O60, and from an exterior mud-plaster surface O91.
Although the total of 46 AMS dates acquired from WF16 is a sizeable number for a single PPNA site they come from a restricted number of structures, middens, and floors. None of the currently dated samples derives from the uppermost cultural horizons, these having been heavily disturbed by recent Bedouin activity and erosion. Nor have any dates come from the lowest cultural horizons because the excavation did not reach the base of the stratigraphy in any location. This was simply because of the extent of funding for the excavation, the depth of the stratigraphy, and the complexity of the archaeology. Its primary purpose was to expose a large spatial area rather than to make deep soundings. As such, the sample may not represent the entire chronological extent of PPNA activity at WF16. Nevertheless, as will become evident from the analysis, there appears to have been considerable redeposition of sediment containing charcoal during the course of occupation.
The contexts and stratigraphy within the dated structures, midden, and exterior surface, along with the stratigraphic relationships between these Objects are fully described within the 1997–2003 evaluation report and the forthcoming 2008–2010 excavation report (Finlayson & Mithen Reference Finlayson and Mithen2007; Mithen et al. Reference Mithen, Finlayson, Smith, Jenkins and Maričevićforthcoming). For the purpose of this contribution we provide stratigraphic summaries and will only refer to context numbers from which samples for dating were collected. With regard to the stratigraphic relationships between Objects we simply note that structures O11, O33, and O45 cannot be related to the O75, O91, O100, O60 sequence described above nor to each other. None of the structures excavated in 2008–2010 is stratigraphically linked to the 1997–2003 evaluation trenches. Evaluation Trench 2 contained distinctive semi-subterranean architecture based on stone rubble walls, similar to those of the late Epi-Palaeolithic Harifian found west of the Wadi Araba (Finlayson et al. Reference Finlayson, Mithen, al-Najjar, Smith, Maričević, Pankhurst and Yeomans2011b). The rubble walls were embedded into the gravel knoll itself, supporting the notion that they come early in the archaeological sequence at WF16. In contrast, Evaluation Trench 3 contained freestanding stone architecture, similar to that at Zahrat Adh-Dhra’ 2, and argued to be typical of the end of the PPNA (Edwards et al. Reference Edwards, Meadows, Sayej and Westaway2004).
Methods
Sample selection
During both the evaluation and excavation, samples for AMS dating were selected from stratified, undisturbed contexts as far as could be ascertained within the field. Preference was given, whenever possible, to wood charcoal samples deriving from twigs and juvenile branches (categorised as ‘Juvenile’ forms) as identified by the presence of strongly curved growth-ring boundaries, rather than heartwood and large branches, for dating (Table 1). This was undertaken to limit the old wood effect present in dates deriving from charcoal from mature wood of long-lived plant species (categorised under ‘Mature’ forms in Table 1). In some cases, however, such charcoal along with ‘Indeterminate’ forms had to be used because no other types were available, this being notably the case in the site evaluation trenches. During the 2008–2010 excavation, preference was also given to selecting dating samples from a limited number of structures, seeking to develop chronological models for their occupation history.
MODELLED DATE RANGES
The resulting 14C dataset consisted of 11 samples of charcoal from members of the Cupressaceae family, three samples of Pistacia, five of Tamarix, three from members of the Chenopodiaceae family, three of Ficus, and seven samples from members of the Salicaceae (Table 1). Of the remaining 14C charcoal samples (n=13), these were categorised ‘Unidentified’ wood. A further two 14C samples were obtained from seeds.
Radiocarbon calibration
Chronological analysis required the calibration of the 14C dataset to produce probability frequency distributions (Stuiver & Reimer Reference Stuiver and Reimer1993) of their calendar date ranges using the recent refinements to the atmospheric (IntCal13) calibration curve (Reimer et al. Reference Reimer, Bard, Bayliss, Beck, Blackwell, Bronk Ramsey, Grootes, Guilderson, Haflidason, Hajdas, Hatte, Heaton, Hoffmann, Hogg, Hughen, Kaiser, Kromer, Manning, Niu, Reimer, Richards, Scott, Southon, Staff, Turney and van der Plicht2013), this being accessible via the OxCal v. 4.2 14C plotting software (Bronk Ramsey Reference Bronk Ramsey2009). All calibrated date ranges are given at 95% probability unless stated as otherwise in the text.
Radiocarbon statistical consistency
Elementary chi-square tests (Ward & Wilson Reference Ward and Wilson1978) using the R_Combine command in OxCal were undertaken to test for statistically consistent 14C determinations. This provided a measure of the minimum number of episodes of human activity required to account for the radiocarbon-dated record. Where statistical consistencies were identified, these were interpreted as representing a single ‘activity event’ (cf. Wicks & Mithen Reference Wicks and Mithen2014, 250) or a series of episodes occurring in close succession that provided an evaluation of the contemporaneity in the timing of activity associated with the occupation and use of space across the site.
Bayesian chronological models
The Bayesian approach to 14C date analysis has the potential to provide greater chronological precision than that obtained by calibration alone (see for instance Bayliss et al. Reference Bayliss, Bronk Ramsey, van der Plicht and Whittle2007). This is likely to be achieved when large 14C datasets deriving from well-resolved archaeological stratigraphy are available. While 46 AMS dates from secure archaeological contexts is a relatively large number for the PPNA in the southern Levant, the number of dates for each Object being dated is often relatively low. Nevertheless, each Object and area yielded 14C datasets of a sufficient size to begin to model a preliminary chronology for associated activity at WF16.
Bayesian analytical devices available in OxCal were used to construct chronological models for individual Objects and areas that, wherever possible, factored in stratigraphically constrained 14C calibrations. Mithen and Finlayson’s (Reference Mithen and Finlayson2007) analysis of the 1997–2003 AMS dates had demonstrated several stratigraphically-inverted 14C determinations, most likely arising from the redeposition of sediments containing charcoal from previous phases of occupation and/or the burning of wood from long-lived tree species. In constructing individual models, therefore, we dealt with these chronological reversals in the following manner, either by:
-
i) Constructing stratigraphic sequence models following the removal of clear outliers within a group of dates used to date individual Objects or areas;
-
ii) Simplifying our a priori assumptions concerning stratigraphic ordering of radiocarbon-dated material. This was achieved by grouping dates from individual Objects and areas into chronological single-phase models that assumed a uniform distribution of radiocarbon-dated events that could have occurred concurrently. Whilst such an approach inevitably reduces the resolution of the sequence of occupation overall, it does provide a realistic solution for sequences of 14C dates containing several age reversals, or
-
iii) Adjusting modelled estimates by factoring in an OxCal Offset command on 14C dates obtained from mature and indeterminate forms of Cupressaceae. Estimation of the offset is discussed below.
This resulted in chronological models for each of the three trenches from the 1997–2003 evaluation, one being divided into a northern and central area, and seven Objects from the 2008–2010 excavation (for convenience collectively referred to as IOMs). We then used the modelled lower and upper boundary posterior density estimates to anchor the timing for the human activity associated with each individual Object and area, noting that their use is limited in models containing low numbers (ie ≤2) of 14C dates. In those instances, lower and upper boundaries estimates tend to have wide distributions in the 95.4% probability range, a statistical problem arising from the use of a model with few a priori constraints (ie stratigraphy) or likelihoods (ie calibrated date ranges). Posterior density estimates follow the convention of being represented throughout the text using italicised values.
Model validation
The validity of these models can be measured by their agreement indices ([Amodel]; [A]) which should fall above 60% with convergence values [C] ideally greater than 95% (Bronk Ramsey Reference Bronk Ramsey2011). All of the models utilised in this study produced acceptable agreement index values and reached in excess of 95% convergence in every instance, although we acknowledge that our chronological interpretations may be revised in light of new priors being added to existing chronological frameworks.
Measuring variability in the intensity of occupation
Interpretations of the WF16 chronology are challenged on several fronts, these largely stemming from atmospheric carbon plateaus, sample reworking, old wood effects, and relatively low frequencies of 14C dates obtained from Individual Object Models. We used a mainstay of time-series analysis to overcome some of these difficulties by extracting a summed calibrated probability distribution (SCPD) from a single-phase chronological model containing the entire WF16 14C dataset (Bronk Ramsey Reference Bronk Ramsey2009). This provided us with a time-series proxy that we used to model the intensity of human activity at WF16 for comparison with SCPDs embedded in the Individual Object Models to evaluate their relative influence on the overall WF16 site model.
We are aware that the use of SCPDs as a proxy for human occupation can produce unreliable results when derived from an inadequate sample size (cf. Williams Reference Williams2012). Whilst SCPD outputs have been shown to be sensitive to sample size, we are confident that Sum analysis of the WF16 dataset is likely to provide a statistically robust output, as its mean standard deviation (ΔT) and time series span are sufficiently low. Nevertheless we acknowledge that further explicit tests will be required to demonstrate unequivocally the validity of the correspondence between the size of the WF16 dataset, its uncertainties and the time-series thresholds bracketing activity at the site (see for instance Michczyńska & Pazdur Reference Michczyńska and Pazdur2004; Michczyńska et al. Reference Michczyńska, Michczyński and Pazdur2007; Williams Reference Williams2012).
A further advantage of placing the summed WF16 14C dataset within a Bayesian framework is that the resulting output provides boundaries that estimate likely calibrated date ranges for the start and ending of occupation at WF16 that otherwise would have remained less-well resolved (cf. Bayliss et al. Reference Bayliss, Bronk Ramsey, van der Plicht and Whittle2007, 9).
Quantification Of The Old Wood Effect
Mithen and Finlayson (Reference Mithen and Finlayson2007) identified a probable old wood effect influencing the radiocarbon dating of Trenches 1, 2, and 3. This derived from the presence of charcoal coming from trees within the Cupressaceae family, which are renowned for their long life spans. Identification of the genera represented by the Cupressaceae charcoal – most likely Juniperus and Cupressus sempervirens – was not attempted due to the difficulties in separating the two anatomically (Fahn et al. Reference Fahn, Werker and Baas1986, 56). It is likely, however, that the dominant taxon identified within the Cupressaceae category of the WF16 14C assemblage derives from trees of Juniperus, this having been determined as the most abundant taxon on the basis of cellular (ray) arrangement in a previous analysis of the Cupressaceae assemblage from WF16 (Austin Reference Austin2007, 414). Modern distributions of J. phoenicea provide a useful analogue for this genus, now found in localised pockets of evergreen needle-leaved woodland across the circum-Mediterranean zone (Boratyński et al. Reference Boratyński, Lewandowski, Boratyńska, Montserrat and Romo2009). Known for their extended life cycles, individual trees have been shown to attain more than 1000 years in age (Vidakovic Reference Vidakovic1991). Assuming it provides a sufficient analogue for that of the archaeological samples, this indicates that the presence of mature forms of Cupressaceae might be delivering an old wood influence on the WF16 chronology.
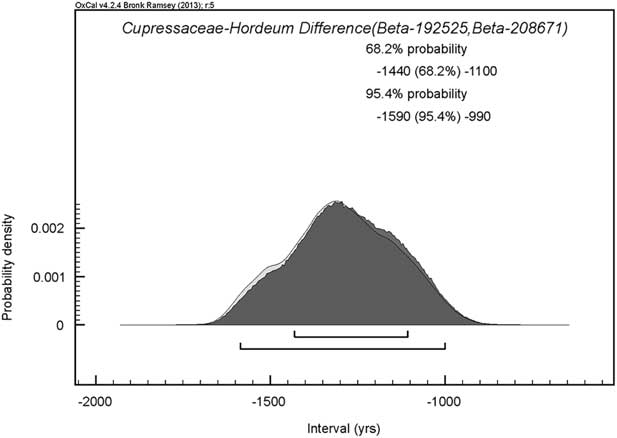
This is most evident from Trench 2 for which there is a wide separation in age between a date from a seed (Beta-208671) and that from a mature Cupressaceae sample (Beta-192525), both contained within a sealed and deeply stratified context (239, Table 1 and see Finlayson & Mithen Reference Finlayson and Mithen2007, 175–90 for detailed stratigraphic information about Trench 2). By using OxCal, the separation in age of these samples was estimated by inserting a Difference command into the Individual Object Model for Trench 2 (as fully described below), which suggests an old wood effect in the order of 990–1590 years (95.4% probability; Fig. 6), Whilst we cannot exclude the possibility that the seed was intrusive, it is at least feasible that the seed and Cupressaceae samples were deposited simultaneously and thus provide an indication of the over-estimation in age of associated activity with objects yielding mature forms of Cupressaceae used in the WF16 dating programme.
Results of Difference analysis providing estimates for the separation in age between short-lived & long-lived plant remains used to date the same sealed context (239) in Trench 2
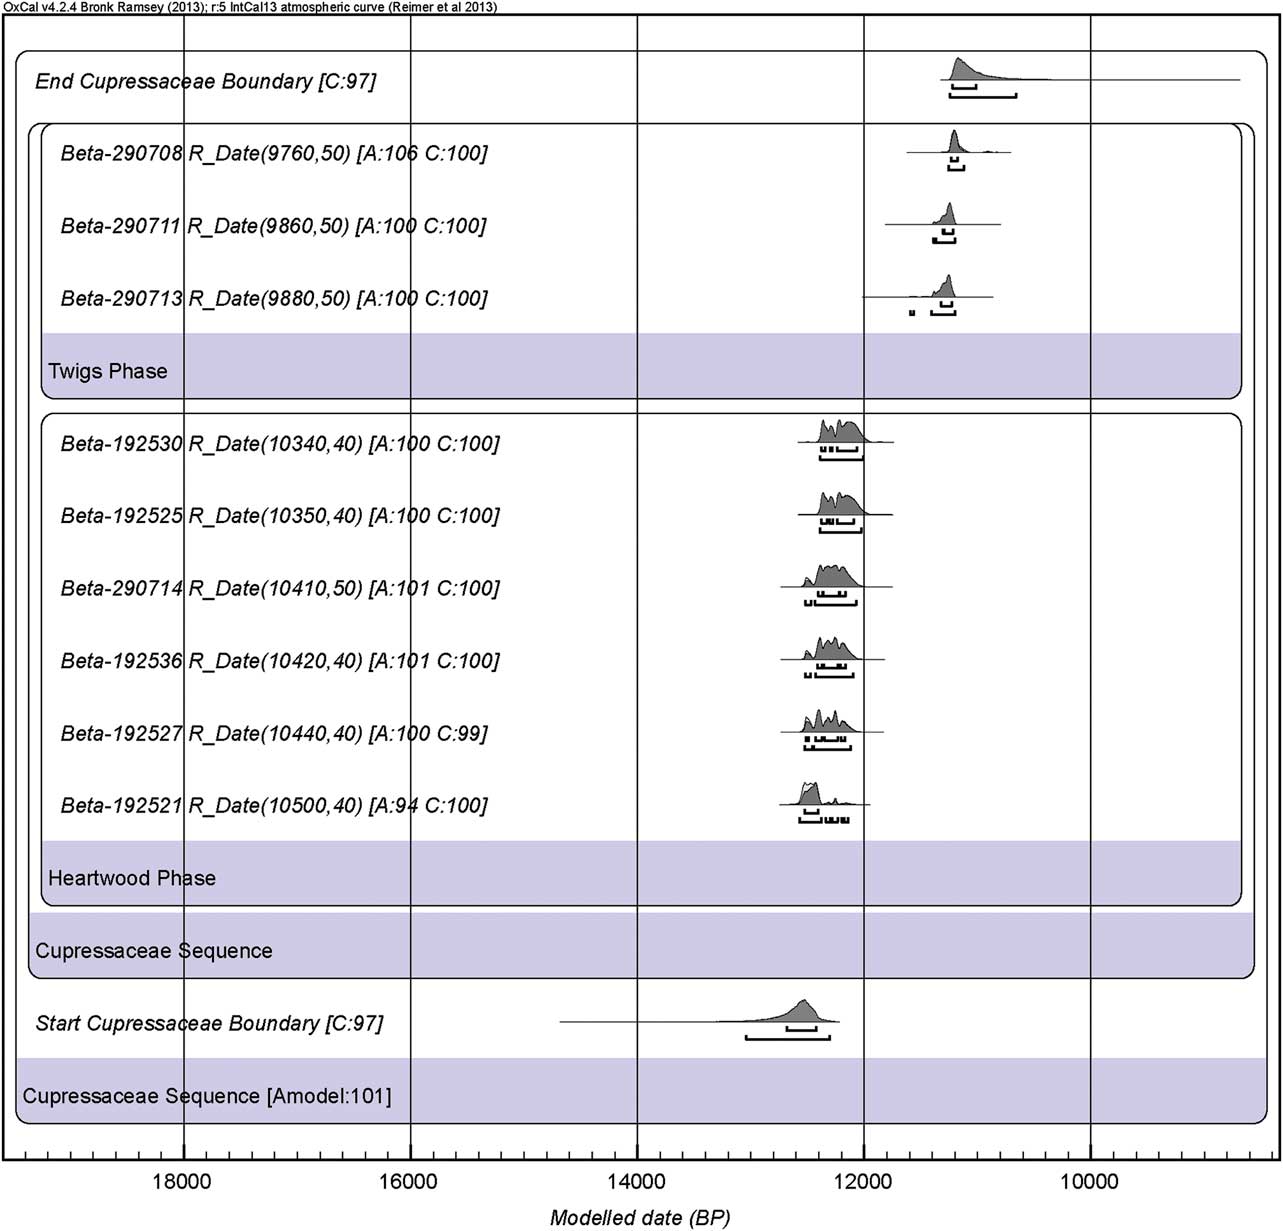
We sought confirmation of this potential old wood effect by exploring the difference in age between Cupressaceae samples having derived from mature heart/branch wood (eg Beta-192521, Beta-192527, Beta-192536, Beta-290714, Beta-192525, & Beta-192530) against those from more juvenile branches and twigs (eg, Beta-290713, Beta-290711, & Beta-290708; Table 1). When plotted as two phases within a contiguous sequence comprising a lower unit of mature wood succeeded by an upper unit of juvenile wood, the model produced acceptable agreement index values (Amodel=101; Fig. 7). This agreement suggested that our model provided a valid interpretation of the chronological separation in age of the two forms of Cupressaceae identified in the WF16 assemblage. While we must be cautious because we lack samples of juvenile branch/twig and mature heart/branch wood from the same context, we note that the three samples of juvenile branch/twig wood all come from the lowermost dated contexts within their respective Structures of O45 (Beta-290713), O75 (Beta-290711), and O100 (Beta-290708). As such, we believe it unlikely that the difference in age between the juvenile branches/twig and mature heart/branch wood can be explained on the grounds of site stratigraphy.
Posterior density estimates for mature (heartwood and large branches) & young (small/branch twig) wood of Cupressaceae wood charcoal from WF16
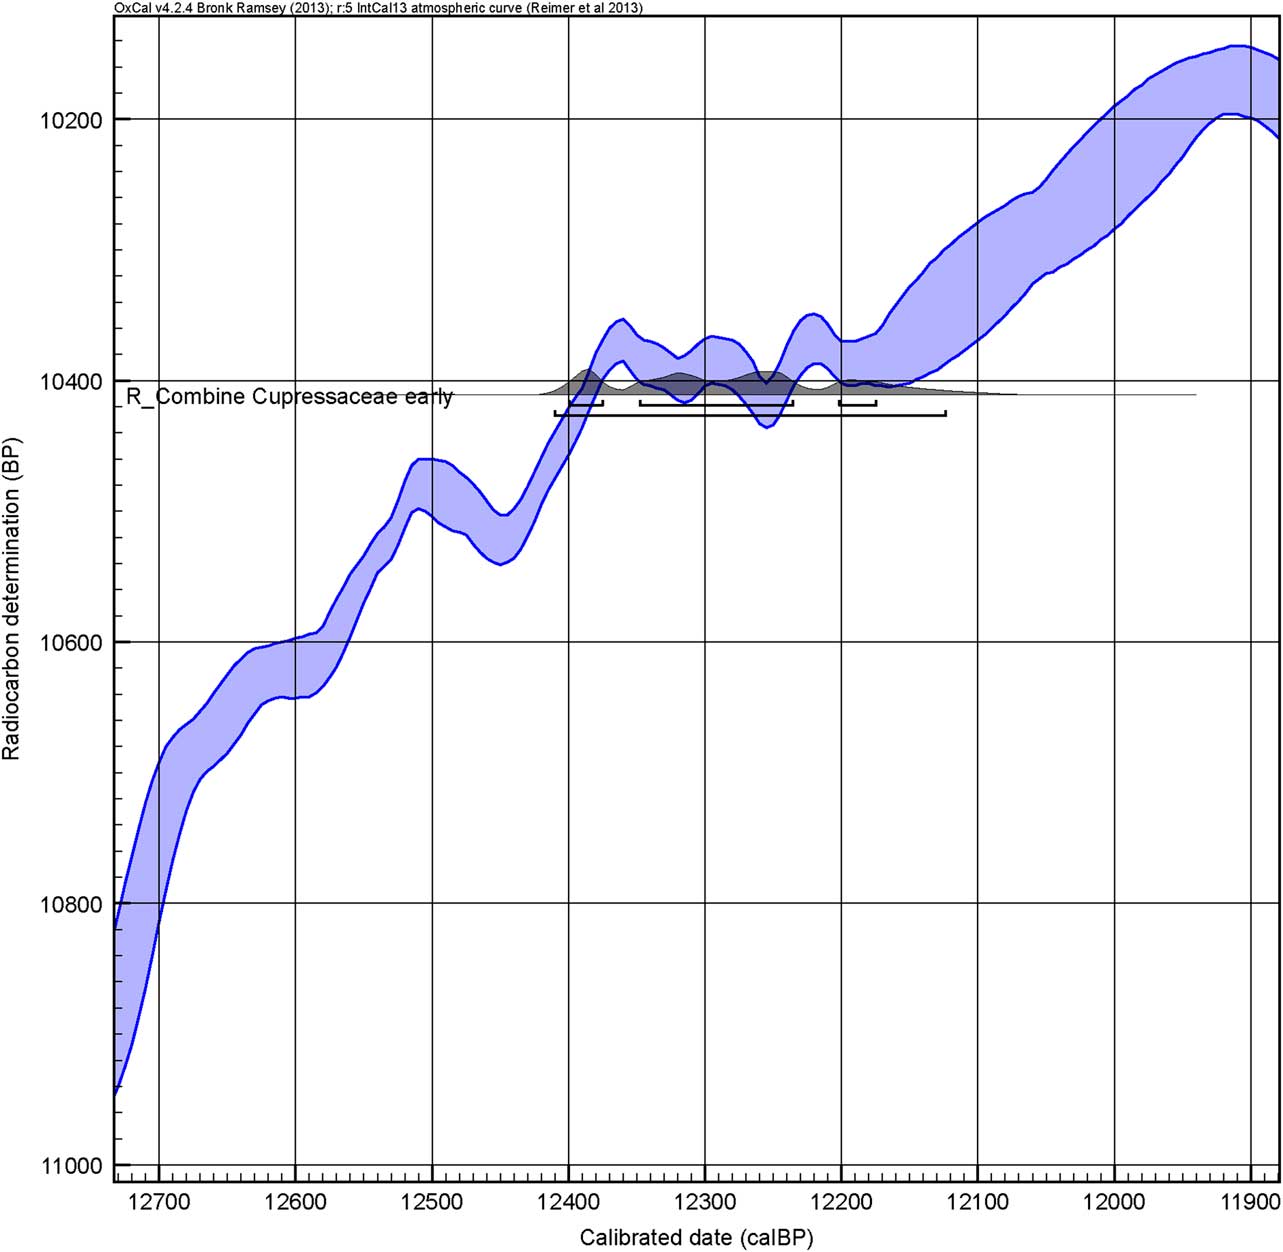
To further this interpretation we note that the six dates coming from Cupressaceae of mature form are statistically consistent (χ2-test: df=5; T=11.0; 5% critical value=11.1) centred on 12.28 ka cal bp despite coming from four separate Objects (Trenches 1, 2, and 3, and Structure O45). Similarly, although we note small sample sizes, the two dates from Cupressaceae of indeterminate form (Beta-192524 and Beta-253735) are consistent (χ2-test: df=1; T=0.1; 5% critical value=3.8) centred on 11.81 ka cal bp, and the three dates from Cupressaceae of juvenile form are also consistent (χ2-test: df=2; T=3.3; 5% critical value=6.0), centred on 11.23 ka cal bp.
The most likely explanation for the statistical consistency of the six samples of mature forms of Cupressaceae is the plateau on the calibration curve over this time period (Fig. 8), which produces calibrated dates that give a potentially false impression of contemporaneity. A feasible interpretation for the difference in the dates of the mature and juvenile forms is that most if not all of the Cupressaceae samples derive from wood acquired and used at a date denoted by the juvenile/twig wood, centred on 11.23 ka cal bp and possibly the indeterminate forms centred on 11.81 ka cal bp. In this explanation, the dates of the mature forms would derive from an old wood effect, while also continuing to be influenced by the calibration curve plateau to give a false impression of contemporaneity. The date of the indeterminate forms might also be influenced by an old wood effect; one of less magnitude than the mature forms if they are from branches younger than the heartwood but older than the juvenile/twig wood.
Calibrated radiocarbon dates from mature forms of Cupressaceae combined to show their position on a plateau in the calibration curve between c. 12.41–12.12 ka cal bp
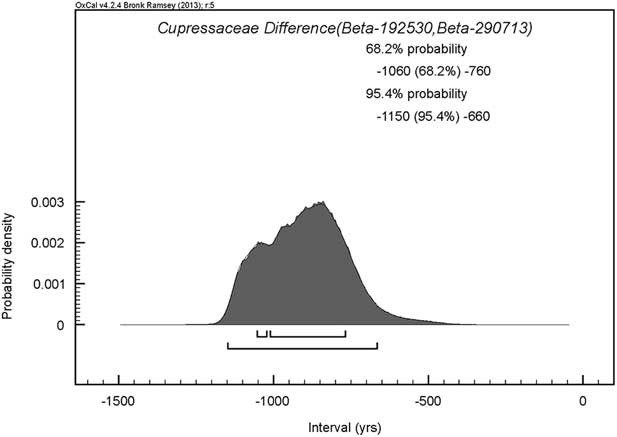
We used OxCal Difference analysis between the youngest sample of mature wood (Beta-192530) and oldest sample of juvenile wood (Beta-290713) to estimate an old wood effect from Cupressaceae. This indicated that estimates for the old wood effect evident in WF16 Cupressaceae could range from 660–1150 years (95.4% probability; Fig. 9). If we average the lower and upper limits of this 95.4% probability result with the upper and lower limits from the Difference analysis between the seed and mature form Cupressaceae from Trench 2 (990–1590 years at 95.4% probability), we arrive at an estimate for the old wood effect as falling between 825 and 1370 years. This range encompasses what we would expect from modern analogues for Late Pleistocene/Early Holocene Cupressaceae such as J. phoenicea.
OxCal plot showing estimates for the difference in timing of calibrated dates obtained from mature & young wood of Cupressaceae
In addition to the age of the wood itself, however, this range might also encompass additional contributions to the old wood effect. It is possible that the occupants of WF16 had collected wood from trees that had been fallen in the local woodlands for a considerable period of time, perhaps several centuries if the wood had become desiccated. In addition, samples of Cupressaceae might have been redeposited at WF16 from earlier horizons, which were not reached by the excavation. While the absence of clearly Epi-Palaeolithic artefacts suggests that it is unlikely that an Epi-Palaeolithic horizon has been reached, the architecture of Trench 2 suggests that a very early PPNA phase may have been present. It is possible, of course, that all three factors have played a role in the old wood effect: long-lived taxa, collection of dead wood and the redeposition of samples.
Such is the potential for an old wood effect in the WF16 14C dataset, we incorporated an OxCal Offset command into those models containing dates derived from mature and indeterminate forms of Cupressaceae using the mean and standard deviation (1098±273 years) of the WF16 old wood effect estimate of 825–1370 years. We have refrained from extrapolating an old wood offset for indeterminate forms of Cupressaceae due to the low number of samples categorised within this group. The validity of applying a time-series constant offset to archaeological samples requires further explicit testing utilising modern ethnographic wood charcoal assemblages. As such we are confident that our use of an old wood offset provides a testable basis by which to address old wood influences in PPNA chronologies via future fieldwork and 14C analysis of both archaeological and modern datasets.
Individual Object Models
Structure O45
Structure O45 is the largest structure excavated in the southern half of the 2008–2010 trench, with maximum internal dimensions of 5.5×4.5 m (Fig. 10a). It contains deposits from at least three phases of activity contained within a sub-circular pisé-built wall that had been reused and remodelled on at least as many occasions. The earliest known deposits associated with the structure are a mud plaster floor and a pisé wall forming the lowermost stage of the O45 wall. A charcoal rich deposit (context 1033) was sealed between this early wall and the next stage of wall construction, which was built directly on top (Fig. 10d). A second stratigraphic phase of O45 consisted of a semi-subterranean structure with a raised floor around a central internal construction made from a mud-plaster covered wicker-frame dome, perhaps used for storage. This second stratigraphic phase structure was either deliberately or accidently burned down, resulting in a rubble deposit (context 1012) from the collapsed roof and walls (Fig. 10c). The collapse was sealed by accumulated sediment onto which a hearth was constructed which has a charcoal-rich fill (context 249), this representing the third stratigraphic phase of activity for structure O45 (Fig. 10b).
Structure O45: a) post-excavation photograph; b) mud-clay constructed hearth from the upper-most levels of O45 containing fill context 249; c) section through rubble deposit 1012; d) charcoal rich deposit context 1033 sealed between two stages of wall construction

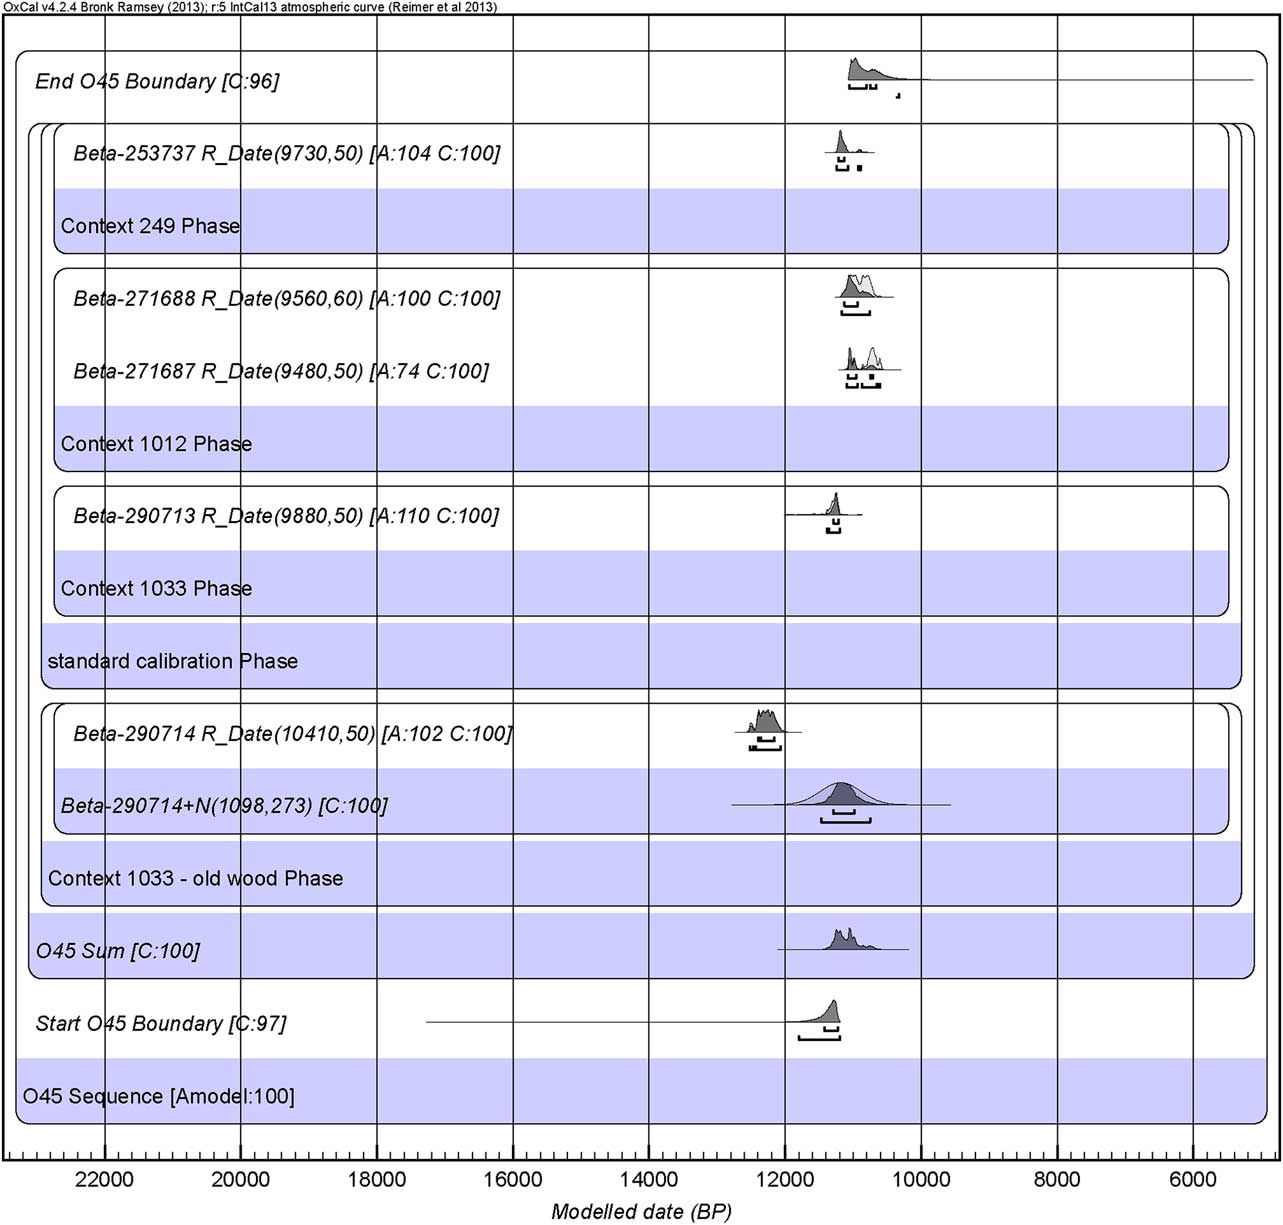
Five charcoal samples were selected for 14C dating from contexts within O45: two from Phase 1 context 1033 (Beta-290713, Beta-290714); two from the Phase 2 rubble deposit context 1012 (Beta-271687, Beta-271688) and one from the third phase hearth fill context 249 (Beta-253737) (Table 1). An initial chronological interpretation grouped the 14C dates as a stratified sequence model comprising three contiguous phases of radiocarbon-dated events. This produced unacceptable agreement index values caused by an insufficient level of correlation between the calibrated ages for samples and their position within the stratigraphic sequence, and hence was rejected. An alternative model grouped the three phases within a single-phase chronological model (Fig. 11), whilst a third stratigraphic sequence model produced acceptable agreement index values having removed an outlier from the sequence (Fig. 12). The outlier was the sample (Beta-253737) from within the hearth (context 249), representing the third stratigraphic phase of Structure O45. This date was significantly older than those from stratified contexts below – its posterior density estimate in the chronological model dating to 11.25–10.88 ka cal bp , several centuries prior to the date of the underlying pisé rubble accumulation (Fig. 11 & Table 1). This suggests that the Salicaceae wood burned within the hearth might have already been old, perhaps deriving from collapsed structures elsewhere at the settlement, from an old tree (its form was indeterminate) or a combination of these factors. As such, the date would not represent the activity of the fire within the hearth itself and can be justifiably excluded.
Posterior density estimates for 14C dates from O45 grouped within a chronological model using an offset to down weight the influence of the old wood effect on the lower boundary
Posterior density estimates for 14C dates from O45 grouped within a stratigraphic model using an offset to down weight the influence of the old wood effect on the lower boundary. Note that an acceptable agreement index value has been reached for the model as a whole following the removal of an outlier (Beta-253737)
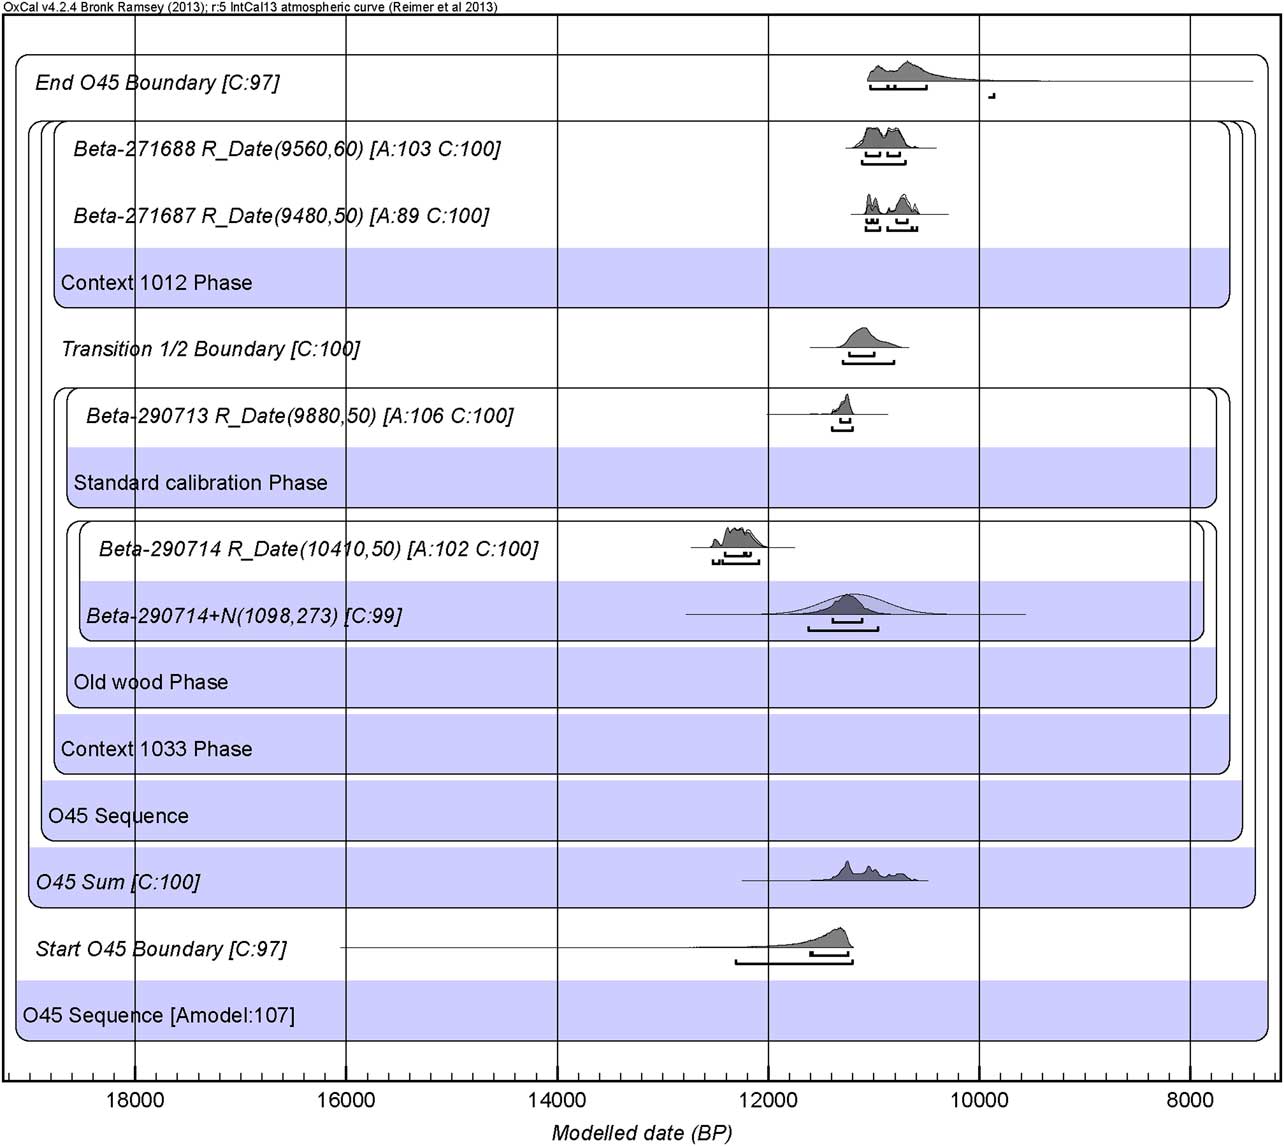
Both the chronological and stratigraphic models incorporated the old wood offset, this being applied to Beta-290714 derived from a mature form of Cupressaceae (Figs 11 & 12). Posterior density estimates for O45 are provided in Tables 1 and 2.
LOWER AND UPPER BOUNDARY ESTIMATES
The bi-modal distribution of the sum (SCPD) produced by the stratigraphic sequence model suggests at least two or three pulses of activity associated with activity within O45 (Fig. 12). The two dates from context 1033 (Beta-290713 & Beta-290714) suggest that this deposit is an accumulation of material of similar ages forming between 11.62–11.20 ka cal bp (stratigraphic model) and 11.47–10.75 ka cal bp (chronological model). The two dates (Beta-271687 & Beta-271688) from context 1012 are statistically consistent (χ2-test: df=1; T=1.1; 5% critical value=3.8), providing a calibrated combined value centred on 10.82 ka cal BP for the accumulation of the pisé rubble arising from destruction of the structure by fire (Table 3).
STATISTICALLY CONSISTENT 14C DATES
Overall, posterior density estimates generated from the stratigraphic model place the start of activity associated with the excavated deposits at O45 at 12.31–11.20 ka cal bp ; the lower limit produced from the chronological model making that estimate several centuries younger (Figs 11 & 12, Table 2). Additional 14C dates from context 1033 will be required to identify whether the stratigraphic or the chronological model provides the most reliable lower boundary estimate, as acceptable agreement index values were produced by both the stratigraphic (Amodel=107.3%) and chronological (Amodel=100%) interpretations represented in Figures 11 and 12. Estimates for the end of activity associated with the O45 excavated deposits indicate that its use had ceased by 10.32 ka cal bp (chronological model, including the third stratigraphic phase, context 249) or 9.86 ka cal bp (stratigraphic model, excluding the third stratigraphic phase).
Structure O11
Structure O11 is located towards the southern end of the 2008–2010 trench and close to the eastern limit of excavation (Figs 5 & 13). It is elliptical in shape, c. 4×3 m, defined by a pisé wall with a stone-lined adjoining area that may have once formed an entrance-way. The interior deposits consisted of a succession of mudplaster floors, some with embedded mortars, and occupation horizons. They included a silt containing ash, burnt, and unburnt bone fragments at the base of the excavated sequence (context 1061), and then successively a degraded floor surface (context 828), occupation debris (context 824), a well-preserved mud-plaster floor (context 837), further occupation debris (context 466), and a horizon rich in bird bones.
Section through Structure O11, showing basal floor containing cremation deposit context 1061, section through contexts 828 & 824, & upper floor surface context 837
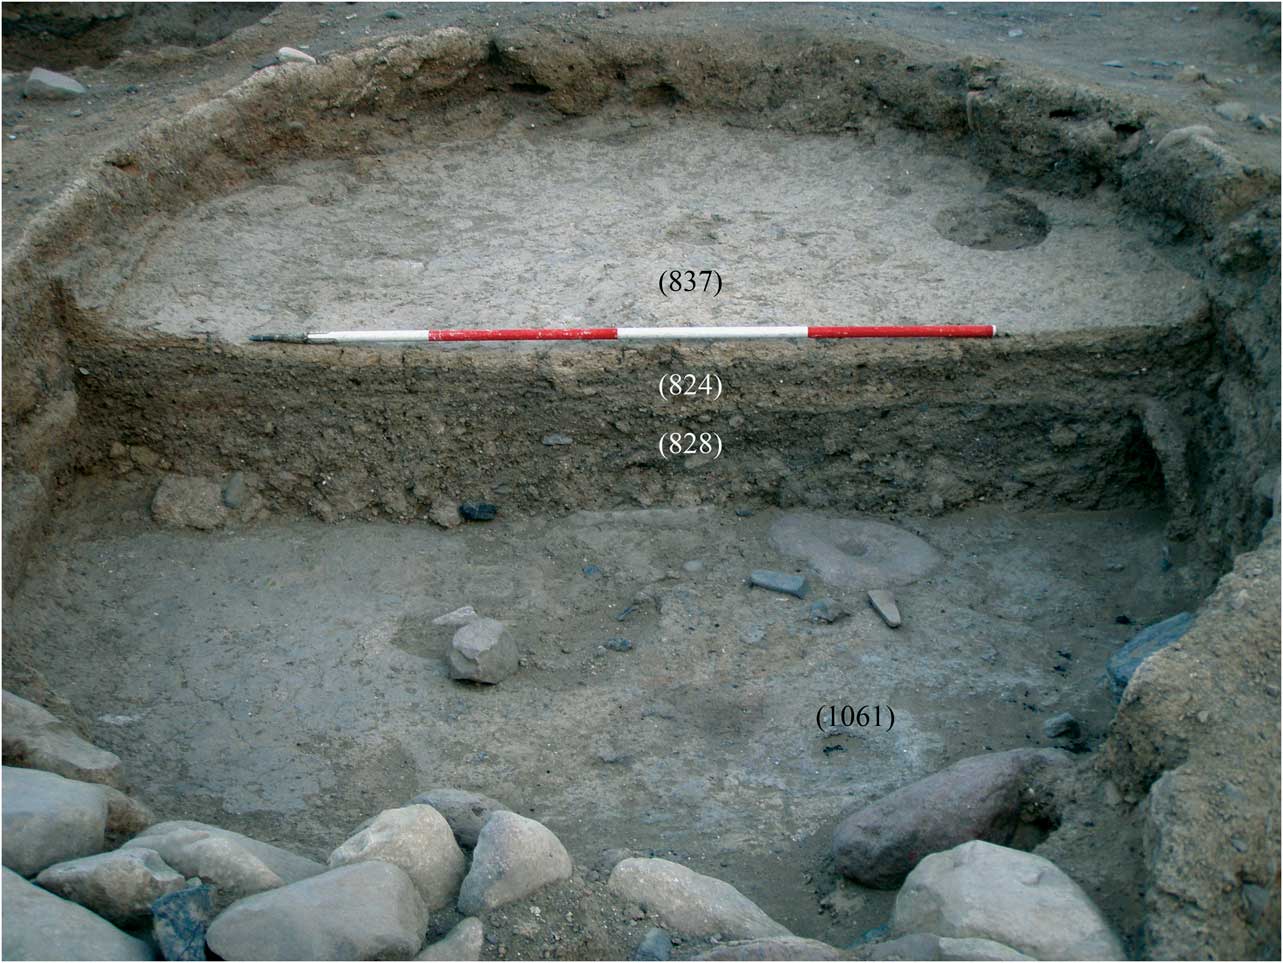
Seven charcoal samples from five stratified contexts were selected for 14C dating: two from the basal context 1061 (Beta-271685, Beta-271686), one from the degraded floor context 828 (Beta-271684), two from the overlying occupation debris context 824 (Beta-271683, Beta-290706), one from the mud-plaster floor context 837 (Beta-290705), and one from the overlying occupation debris context 466 (Beta-253736) (Table 1).
An initial chronological interpretation grouped the 14C dates as a stratified sequence model comprising five contiguous phases of radiocarbon-dated events, each relating to a succession of single contexts. The OxCal output lacked posterior density estimates due to a null hypothesis testing true (Amodel=0), this being caused by chronological reversals indicated by the stratigraphic positions of Beta-253736, Beta-271683, and Beta-290705. The dates were re-modelled grouping the five phases within a single-phase chronological model (Fig. 14), this producing acceptable agreement index values. Posterior density estimates generated from the Bayesian analysis of the chronological model for O11 are provided in Figure 14 and in Tables 1 and 2.
Posterior density estimates for 14C dates from O11 grouped within a chronological model

The bi-modal distribution of the sum (SCPD) of the chronological model suggests at least one main pulse of activity associated with the use of O11 with possibly intrusive material giving the impression of later activity separated by a considerable hiatus in use (Fig. 14). The uppermost dates (Beta-253736 & Beta-290705) come from two discrete contexts (466 & 837 respectively) separated by a combination of collapse and occupation deposits. Despite the stratigraphic separation, these dates provided statistically consistent 14C determinations centred on 11.57 ka cal bp (χ2-test: df=1; T=0.3; 5% critical value=3.8) (see Table 3). These are the oldest of the seven samples from O11 and two of the oldest dates from the site as a whole. They are derived from Salicaceae and Pistacia, the latter sample being identified as twig wood. As such we have no reason to believe that an old wood effect is present. Our interpretation is that the pisé used to construct the upper floors and walls of structure O11 had been made with redeposited sediment that already contained charcoal and hence resulted in this inverted stratigraphy. While the dates do not provide a useful estimate for activity at the upper surviving levels of O11, they nevertheless contribute towards our overall dating of the activity at WF16.
Beta-271683, coming from context 824 which was below contexts 466 and 837 from which Beta-253736 and Beta-290705 had derived, provided the youngest date of the whole sequence, 10.41–10.17 ka cal bp . Indeed, this is the youngest of the dates acquired from the samples taken during the 2008–2010 excavations. We have no reason to think that this sample may have been contaminated and conclude that it must be intrusive. We suspect that this charcoal had become redeposited by insect or rodent burrowing activity that was evident during excavation. Again, although it fails to indicate a date for the activity represented by context 824, we believe it is a useful date with regard to the span of activity at WF16, it being agreeable with dates coming from Trench 3 of the 1997–2003 evaluation.
Our best estimate for the date of the occupation debris of context 824 comes from sample Beta-290706. This date is statistically consistent with three dates coming from contexts lower in the sequence, one from context 828 a degraded floor surface, and two from context 1061, an ashy deposit containing burnt bone. All four of these dates are statistically consistent, providing a calibrated combined value centred on 11.21 ka cal bp (χ2-test: df=3; T=1.7; 5% critical value=7.8) (Table 3). We interpret these dates as indicating a relatively rapid accumulation of the stratigraphic sequence between contexts 1061 and 824, although the calibrated date range encompasses a period of roughly two human generations.
We regard the posterior density estimates for the lower and upper boundaries shown in Figure 14 with caution (Table 2). Overall, posterior estimates place the start of activity associated with the excavated contexts of O11 at 12.44–11.36 ka cal bp , although, as we noted above, the oldest samples within this structure may have been redeposited from elsewhere at WF16. Estimates for the end of activity associated with the O11 excavated deposits indicate that this had ceased by 9.44 ka cal bp , although this may be too young due to the potential intrusive nature of the dating sample that provided the youngest date.
Structure O33
Structure O33 is a sub-circular pisé walled structure measuring approximately 4×5m located towards the northern end of the excavation trench (Figs 5 & 15). It has a single mud-plaster floor at the base of its sequence, above which there was a thin occupation deposit (context 377). This was sealed by c. 1m of pisé rubble within a silt matrix, suggesting deliberate and rapid back-filling to level the structure. Some of the rubble blocks are angular, suggesting they may have derived from mud bricks. Extensive traces of rodent burrowing were evident within and below the pisé rubble, immediately above the mud-plaster floor. This pisé block fill was partly sealed by the floor of a later structure (O31) and partly by the overburden of the site.
Structure Object O33 showing basal floor immediately below occupation horizon (377) from which AMS dating samples were acquired, & section revealing pisé block fill

Three charcoal samples were selected for 14C dating from the occupation deposit context 377 (Beta-253733, Beta-253734, & Beta-253735). The dates were grouped within a single-phase chronological model incorporating an old wood offset, this being applied to Beta-253735 derived from an indeterminate form of Cupressaceae (Fig. 16). Posterior density estimates generated from the Bayesian analysis of the chronological model for O33 are provided in Figure 16 and in Tables 1 and 2.
Posterior density estimates for 14C dates from O33 grouped within a chronological model using an offset to down weight the influence of the old wood effect on the lower boundary
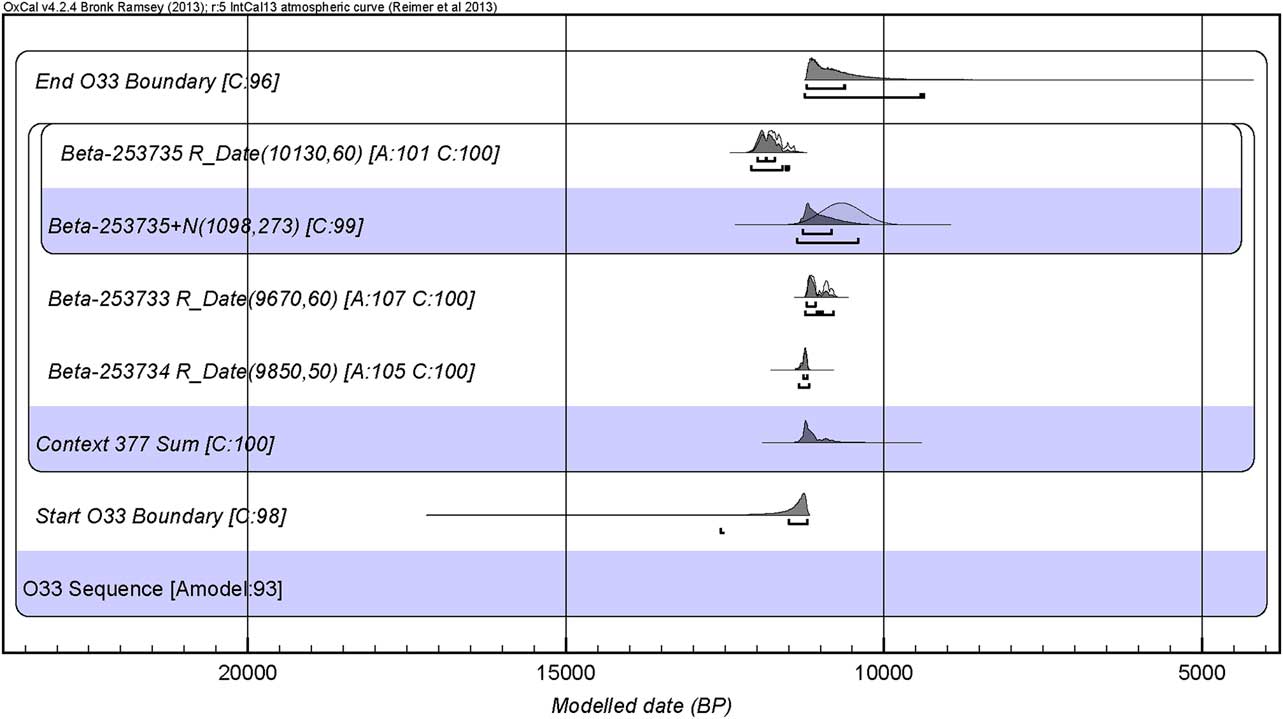
At face value, the unimodal distribution of sum (SCPD) of the chronological model suggests at least initially a marked pulse of activity contributing to the accumulation of deposits (context 377) on the floor of Structure O33 (Fig. 16). Although coming from a well-defined, relatively thin and deeply stratified context, the three samples provided inconsistent values, separated by periods of up to c. 450 years between each radiocarbon-dated event. Three explanations, and combinations of these explanations, are possible. First, it may be the case that the thin occupation debris (context 377) accumulated across a period of more than 900 years (as indicated by the lower and upper limits of the 68.2% probability boundary estimates). Second, it might be the case that the material used to construct the underlying floor and/or the thick layer of fill immediately above the occupation deposit (context 377) on the floor involved recycled pisé deposits of varying age from elsewhere within the site from which charcoal of quite different ages had eroded into the occupation deposit. This may have arisen by rodent activity, evident from burrows within sediments. A third possibility is one of old wood because the three samples come from quite different types of wood: the oldest date (Beta-253735) being on Cupressaceae, the second oldest (Beta-253734) on Tamarix and the youngest (Beta-253733) on a member of the Chenopodiaceae family. Of these the chenopod is the least likely to involve an old wood effect and the Cupressaceae the type most susceptible. If this is the case, the most likely date for the horizon comes from Beta-253733, centred on 11.13ka cal BP.
We note that sample Beta-253733 is enriched with respect to its δ13C value (-10.5‰) when compared to the other two samples from O33. This might be because Chenopodiaceae in this region are predominantly of C4 plants (Carol Palmer pers. comm.). Alternatively, it might reflect contamination of the sample from fulvic and humic acids in the surrounding matrix. We also note that the δ13C value (-10.5‰) is comparable to those reported for a variety of plant types when growing in conditions of increased aridity (eg McCarroll & Loader Reference McCarroll and Loader2004; Leavitt Reference Leavitt2007; Frumkin Reference Frumkin2009). The date derived from sample Beta-253733 is not associated with a known regional arid event in the southern Levant but it might relate to a localised condition in the vicinity of WF16 from where the Chenopod was acquired.
In light of the statistically inconsistent dates, we regard the posterior density estimates for the lower and upper boundaries for the occupation horizon in structure O33 as shown in Figure 16 with caution (Table 2). Overall, posterior estimates indicate that activity associated with this occupation as likely to have commenced by 12.57 ka cal bp and to have ended by 9.37 ka cal bp .
Midden O60
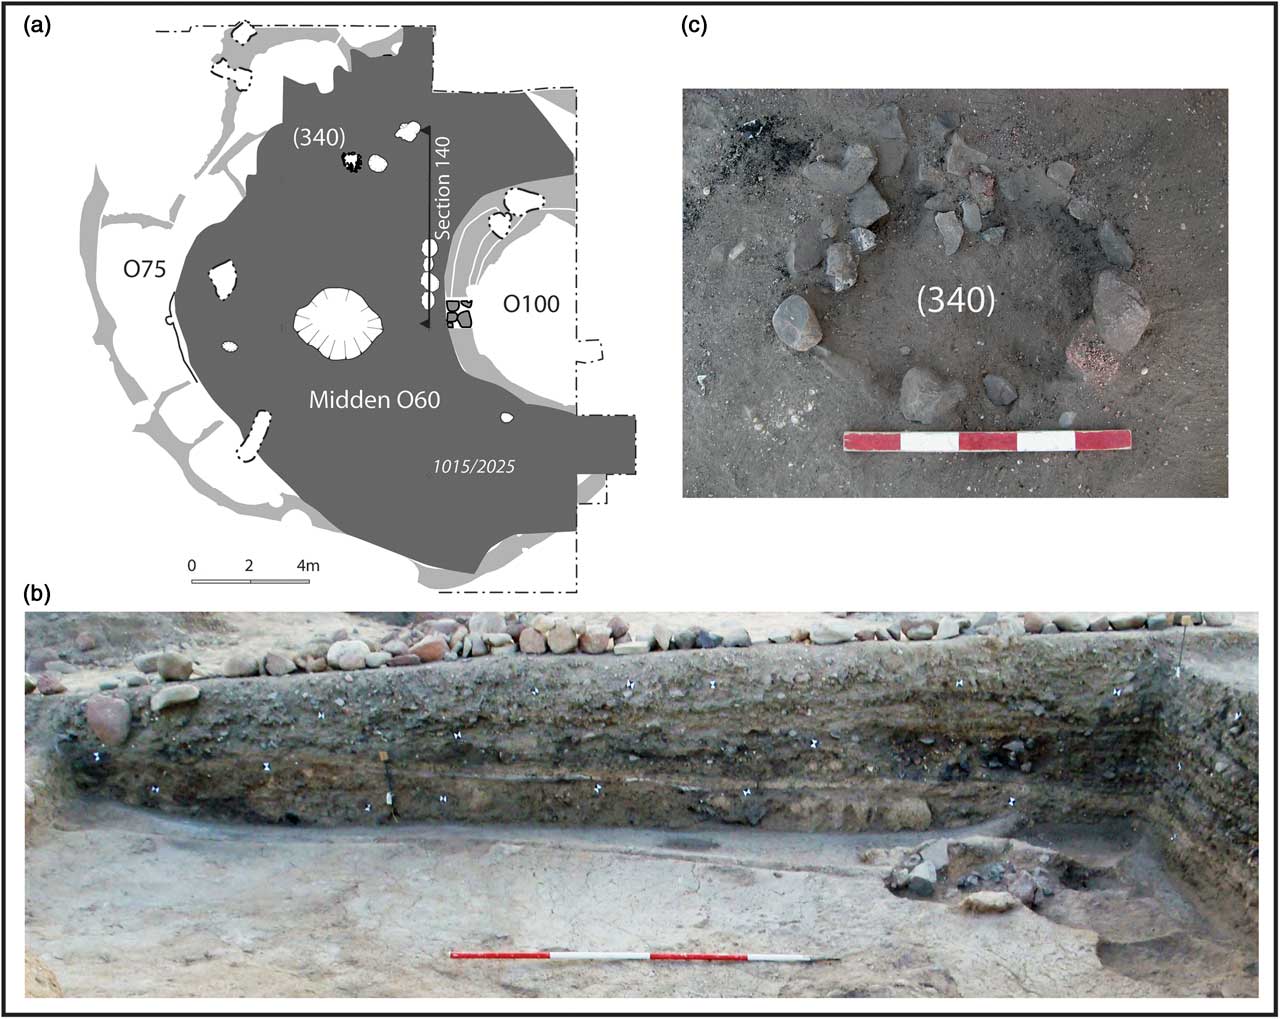
This is the most extensive area of midden at WF16. It accumulated over an external surface, Surface O91, which partially sealed abandonment deposits within Structure O75; Midden O60 also directly overlay those abandonment deposits in the absence of Surface O91. Midden O60 is located outside Structure O100 (Fig. 5) and fills the interior of Structure O75 up to a level immediately below the overburden (Fig. 17). It amounts to an elliptical area measuring close to 16 m east–west and over 17m north–south, with a volume estimated as 83 m3. Although described as a midden, O60 was also a work area where knapping, butchery and other activities took place. Burials, artefact concentrations, ephemeral surfaces and a stone-constructed hearth (fill, context 340) were located within the midden deposits.
a) spatial extent of Midden O60 showing the location of hearth [345](340); b) west-facing section S140 through Midden O60; c) Hearth [345] with fill (340)
Two charcoal samples were selected for 14C dating from the fill of the hearth, context 340: Beta-253738 and Beta-253739 (Table 1). The dates were grouped within a single-phase chronological model (Fig. 18), it predictably producing acceptable agreement index values. Posterior density estimates generated from the Bayesian analysis of the chronological model for O60 are provided in Fig. 18 and in Tables 1 and 2.
Posterior density estimates for 14C dates from O60 grouped within a chronological model. Note the relative precision of the sum compared to the lengthy lead-in and tail of the boundary estimates in the 95.4% probability range.
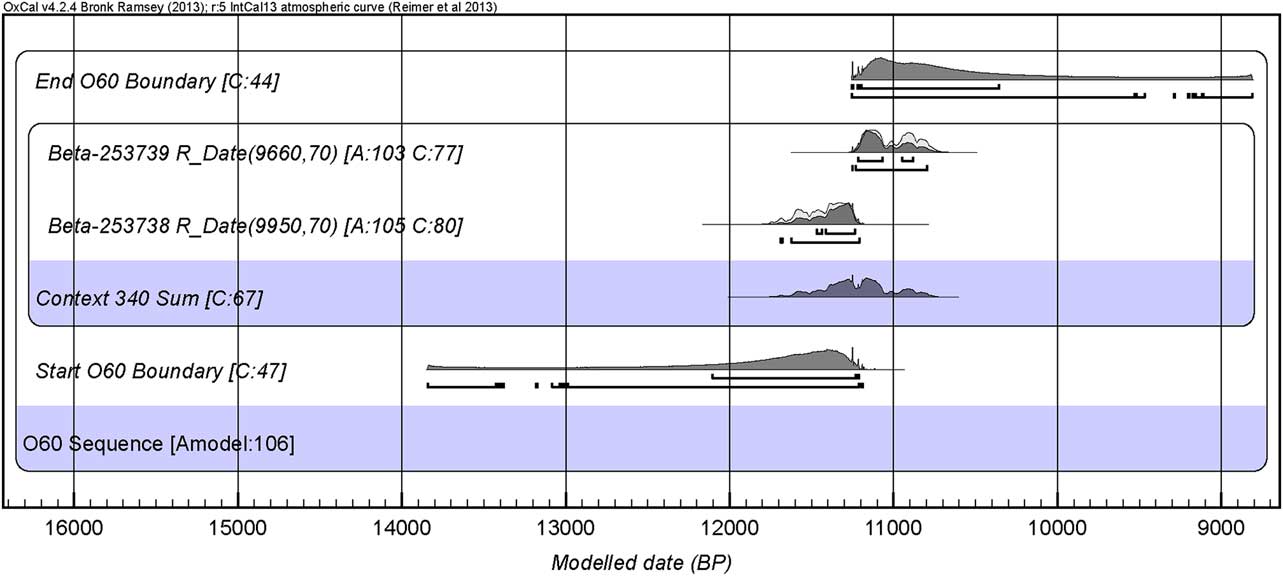
At face value, the multi-modal distribution of the sum (SCPD) of the chronological model suggests at least two pulses of activity could be recorded within this hearth situated in Midden O60, this being confirmed by the inconsistency of the two date that are separated by potentially at least c. 340 years. Two explanations appear possible. First, the older sample, Beta-253738, coming from the mature stem wood of a Tamarix tree, might be more influenced by an old wood effect than the younger sample, Beta-253739, which derived from twig wood. The posterior density estimate for the younger determination, 11.26–10.79 ka cal bp , is likely, therefore, to provide the most reliable estimate for the use of the hearth. Alternatively, all of the firewood used for the hearth in the midden might have been drawn from discarded wood found within the midden, perhaps from old structures or previous firewood. As such, it is possible that neither of the samples have yielded a 14C determination that is contemporary with the actual use of the hearth.
Hence, we regard the posterior density estimates for the lower and upper boundaries shown in Figure 18 with caution (Table 2). Overall, posterior estimates place the age of the charcoal within the hearth at 13.85–11.18 ka cal bp , with the end of associated activity estimated at 11.26–8.81 ka cal bp .
Structure O100
Structure O100 is located close to the northern edge of the trench and against the eastern baulk (Fig. 5). It is a large structure, up to 9 m in diameter with massive walls up to 2 m thick, and positioned within the exterior walls of Structure O75 (Fig. 19). Its construction was associated with a floor or trampled surface (Surface O91) located to the exterior of O100 and above the initial in-filling deposits of Structure O75. The walls of O100 include massive pisé and course stone components (context 920); its interior contained a sequence of floors, occupation deposits, and massive mortars, above a basal mud-plaster constructed floor (context 917). Structure O100 is unique in its architectural form at WF16, but may be the sole surviving example of a final phase on the site, preserved from erosion by its location within the hollow left by Structure O75.
Post-excavation view of Structure O100, looking towards the west, showing pisé and stone constructed wall, context 920, and under-lying pisé-constructed floor, context 917
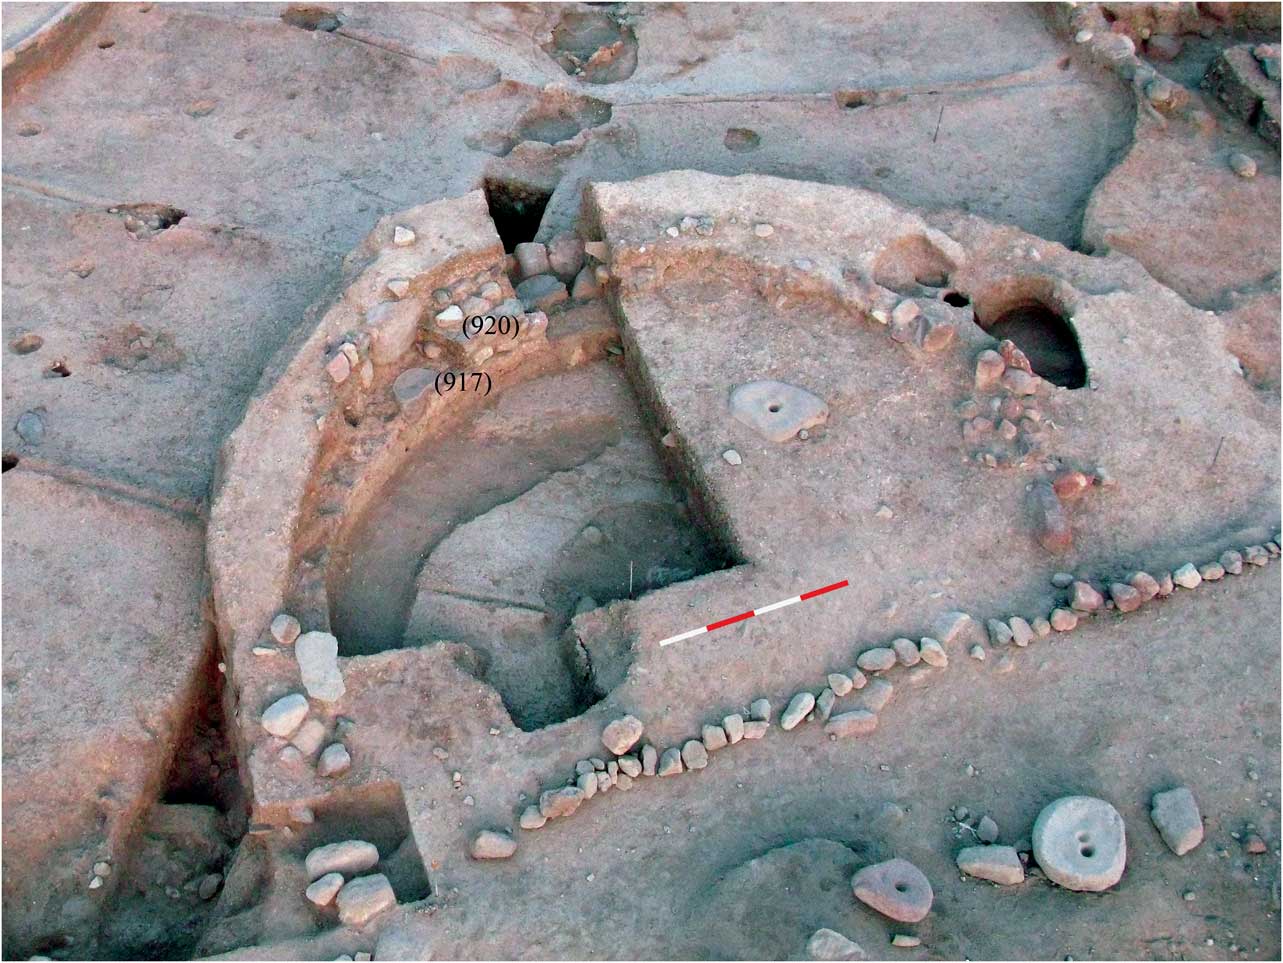
Two charcoal samples were selected to date activity associated with the construction of the base of O100: one from the basal floor surface, context 917 (Beta-290707), and one from the matrix of the wall, context 920, constructed directly above that floor (Beta-290708) (Table 1).
The dates were grouped within a single-phase chronological model (Fig. 20), it predictably producing acceptable agreement index values. Posterior density estimates generated from the Bayesian analysis of the chronological model for O100 are provided in Figure 20 and in Tables 1 and 2.
Posterior density estimates for 14C dates from O100 grouped within a chronological model. Note the relative ‘precision’ of the sum compared to the lengthy lead-in and tail of the boundary estimates in the 95.4% probability range
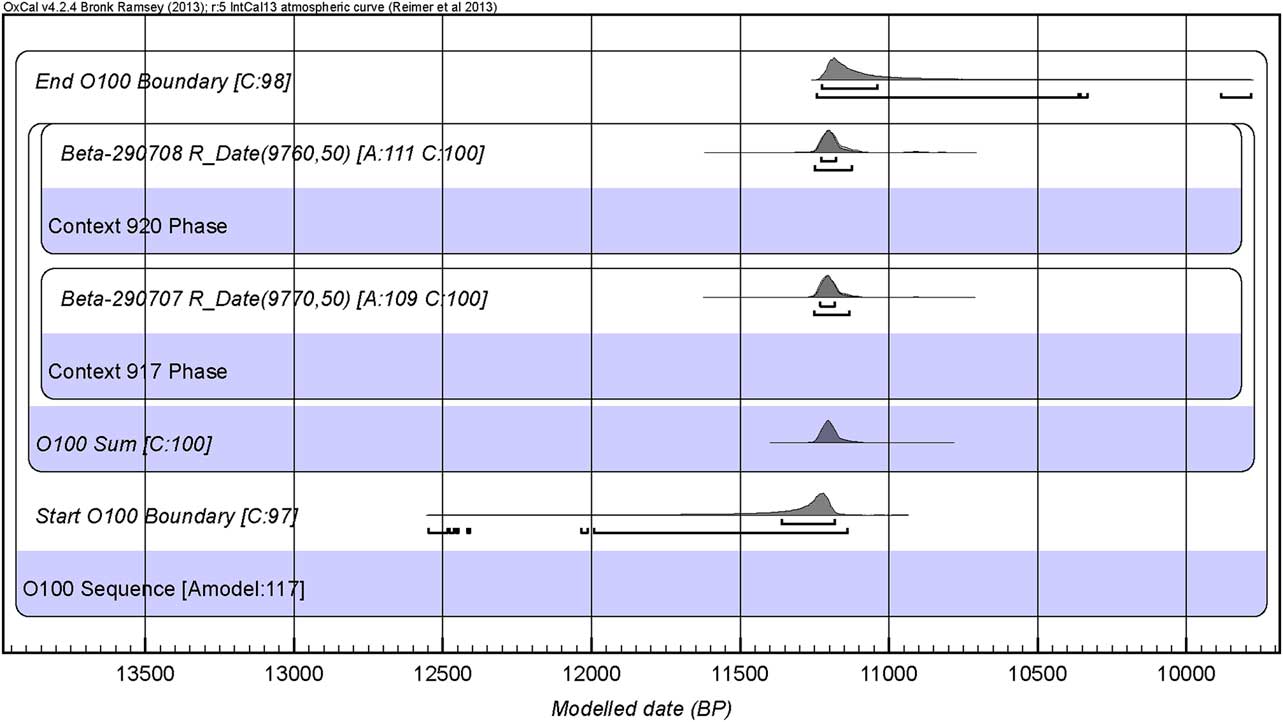
The uni-modal distribution of the sum (SCPD) of the chronological model suggests at least one pulse of activity associated with the construction of the base of O100, this being confirmed by the statistical consistency of the two dates contained in the model (χ2-test: df=1; T=0.0; 5% critical value=3.8) providing a combined calibrated value centred on 11.20 ka cal bp (Table 3). As such, activity associated with the construction of the base of Structure O100 appears to have occurred as a single event or series of episodes in close succession. Posterior density estimates for the lower and upper boundaries bracketing this construction activity fall at 12.55–11.13 ka cal bp and 11.25–9.78 ka cal bp respectively (Table 2).
Structure O75
Structure O75 is an exceptionally large structure, c. 20×18 m, in the north-east corner of the trench (Fig. 5). Structure O75 probably lay at the eastern edge of the settlement because of the steep downward slope from the knoll into a gully to its immediate east, although the slope’s gradient may have been exaggerated by post-Neolithic erosion. In addition to its size, Structure O75 is unique by virtue of the scale and complexity of its architecture (Fig. 21). In summary, it has a central floor composed of multiple mud plaster surfaces with two tiers of benches extending around the south and south-west perimeter and a possible platform at the north-west apex of the structure. The benches appear to have been heavily eroded on the north and north-east sides of the structure. The central floor area is divided by a herringbone pattern of raised moulded gullies running between a central trough lined with mud plaster and the perimeter of the structure. Numerous stake-holes, post-holes and hearths were either cut or moulded into the floor. Although modified by later construction, partially obscured by Structure O100 and eroded at the edge of the knoll, it appears that the original form of Structure O75 was broadly symmetrical along the line of the central trough.
Plan of Structure O75 with the window showing the location of AMS dated contexts and the stratigraphic position of contexts (1803) and (1767) in sections 190 & 178 respectively
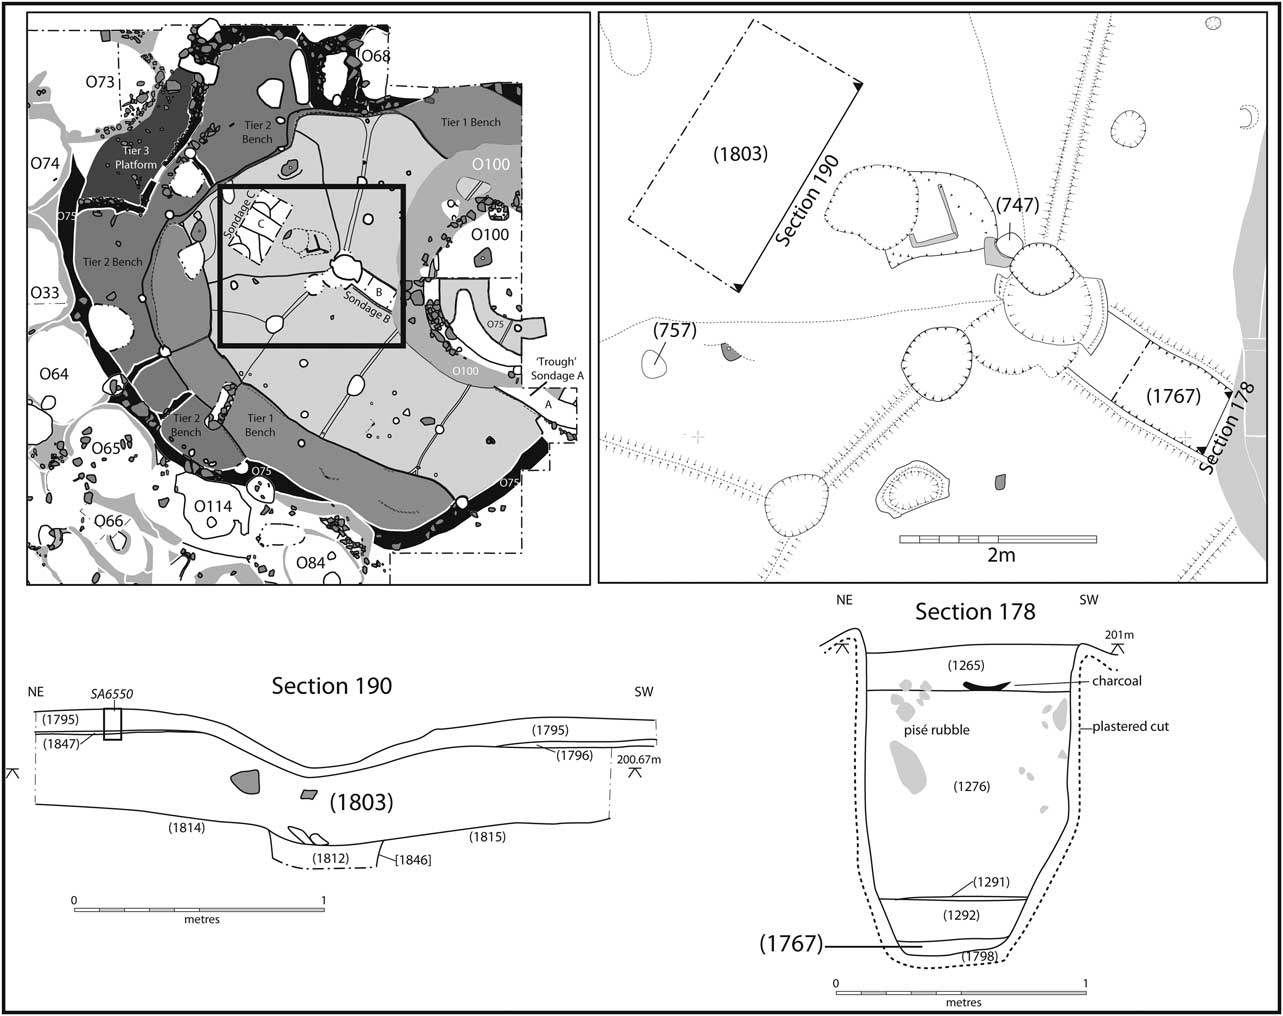
Four charcoal samples were selected to date activity associated with the use of O75 (Table 1). Three of these came from a stratified sequence of deposits within O75. The fill of a hearth, context 747 (Beta-271680) was stratigraphically the highest placed context of the three, placed within the sequence of hearths overlying both the fills of the trough, including context 1767 (Beta-290711) excavated in Sondage B, and the floor surface 1823=1795, which sealed context 1803 (Beta-290712) in Sondage C. Deposit 1803 (Beta-290712) sealed the fills of the trough in Sondage C, but had no direct stratigraphic association with context 1767 (Beta-290711) in Sondage B (Chapter 38) The remaining sample came from the fill of a post-hole cut into the floor of O75, context 757 (Beta-271681), which had no direct stratigraphic association with any of the other dated samples in Structure O75.
Our chronological interpretation grouped the 14C dates within a single phase model comprising a stratified sequence containing a phase populated by Beta-290711 and Beta-290712 succeeded by Beta-271680, which was structured so that it overlapped with Beta-271681 (ie assuming an initial uniform distribution of two radiocarbon-dated events that occurred prior to a second event; all of which have an equal likelihood of occurring concurrently with a fourth radiocarbon-dated event associated with the use of O75; Fig. 22). Posterior density estimates generated from the Bayesian analysis of the model for O75 (Amodel: 107.7%) are provided in Figure 22 and in Tables 1 and 2.
Posterior density estimates for 14C dates from O75 grouped within a stratigraphic model
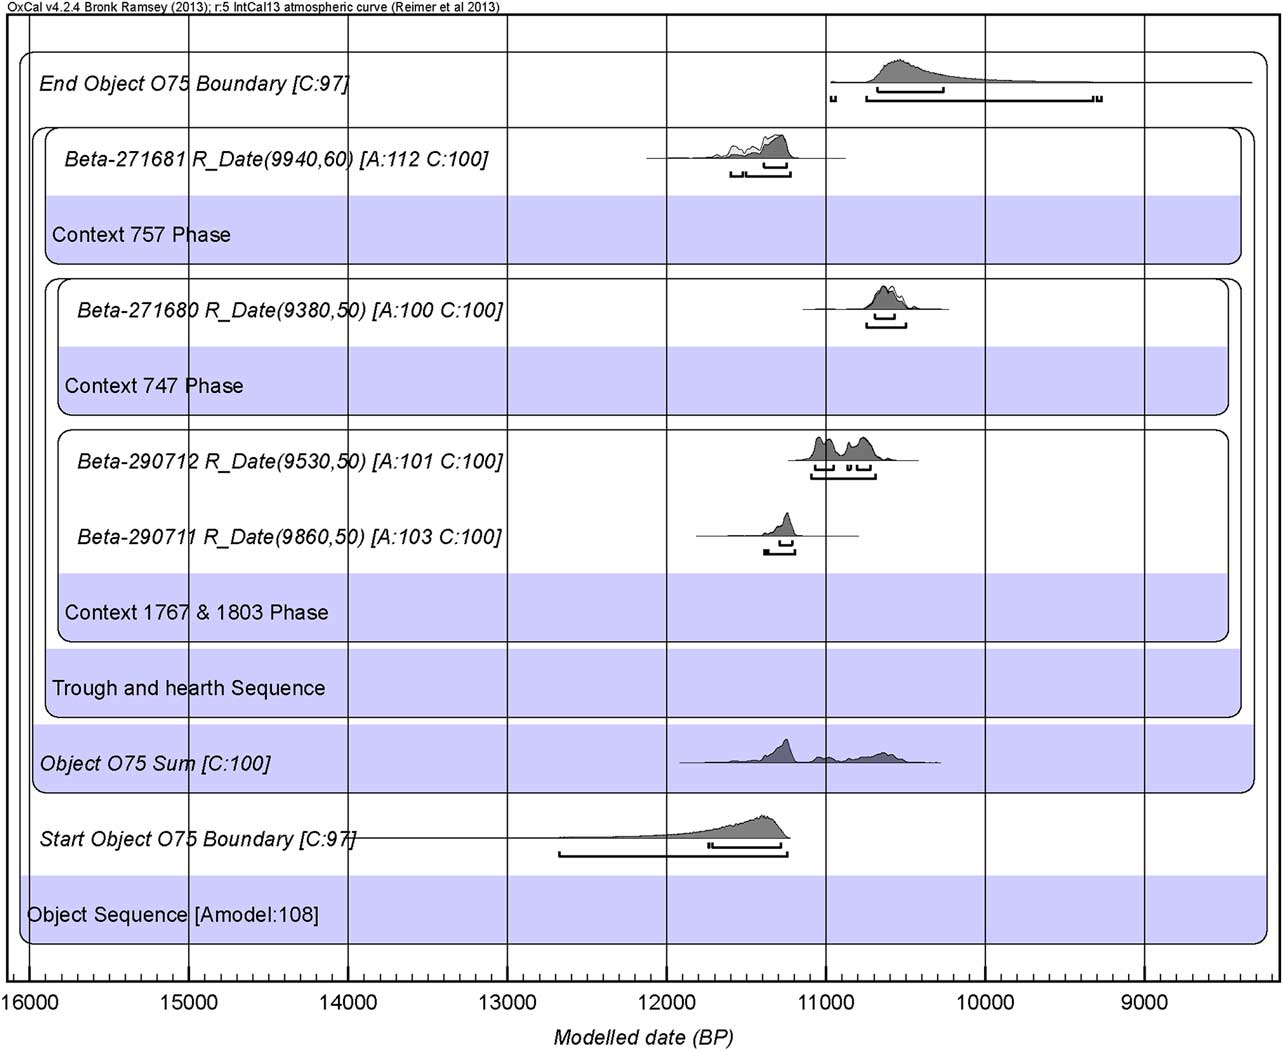
The multi-modal distribution of the sum (SCPD) of the chronological model suggests a series of pulses of activity associated with the use of O75. Good agreement index values for the sequence of dates indicates that Beta-290711, Beta-290712 and Beta-271680 are coherently stratified, suggesting that – provided there are no old wood effects and sample redeposition – sediment within the trough accumulated sometime between 11.39–10.69 ka cal bp (Table 2).
Beta-271681 returned a date statistically consistent with Beta-290711 (χ2-test: df=1; T=1.1; 5% critical value=3.8) producing a combined calibrated date centred on 11.28 ka cal bp (Table 3). This provided the best estimate for the construction of the secondary floor and sediment accumulation within the trough of O75, especially as one of these samples (Beta-271681) came from twig wood thus reducing the risk of an old wood effect. The remaining sample, Beta-290712, was derived from the fill of the trough (1803) as exposed via the sondage. This returned a date of 11.10–10.69 ka cal bp , indicating that the construction of O75 and the date of wood burned within the hearth dated by Beta-271680 could have been contemporaneous occurrences.
We note that the isotope ratios for Beta-271680 are enriched with respect to δ13C (–11.6‰), providing similar values to those recorded for Beta-253733 used to date Structure O33. As noted above, this might be caused by the Salicaceae tree/shrub having grown in a localised area of aridity or reflect contamination of the sample from fulvic and humic acids from the surrounding matrix.
Posterior density estimates for the lower boundary marking the start of activity associated with the use of this area fall at 12.68–11.24 ka cal bp , with the upper boundary suggesting this had ceased by 9.27 ka cal bp (Table 2). We note, however, that O75 is stratigraphically below O100, for which we have two statistically consistent dates centred on 11.20 ka cal bp with posterior density estimates for the lower and upper boundaries bracketing this construction activity at 12.55–11.13 ka cal bp and 11.25–9.78 ka cal bp respectively. Consequently, we are satisfied that a relatively short separation in time exists between the start of use of O75 with that of O100, as indicated by their stratigraphic relationship with one another.
Surface O91
Surface O91 is a mud plaster surface located within the area of the former Structure O75, above the floor of O75 and to the exterior of Structure O100 (Fig. 23). It is believed to be an outdoor surface relating to Structure O100, possibly to its construction. It is not clear whether Surface O91 was intentionally built, derives from mud spilt during the construction of O100, from mud washing off from the pisé walls of Structure O100, or a combination of these processes. Either way, hearths and small pits found cut into this horizon suggest that this exterior space was used for a range of activities.
Surface O91, located to the exterior to Structure O100 and above the floor of Structure O75

Two charcoal samples were selected to date activity associated with the construction of O91 (Table 1). The first sample was collected from within the floor surface itself, context 1211 (Beta-290710). The second came from a thin mud-plaster layer above this floor and immediately adjacent to the exterior wall face of O100, context 1207 (Beta-290709). Our chronological interpretation grouped the 14C dates within a stratified sequence model comprising Beta-290710 at its base succeeded by Beta-290709 (ie assuming two contiguously ordered radiocarbon-dated events associated with episodes of use of this Object; Fig. 24). Posterior density estimates generated from the Bayesian analysis of the model for O91 (Amodel: 99.3%) are provided in Figure 24 and in Tables 1 and 2.
Posterior density estimates for 14C dates from O91 grouped within a stratigraphic model.
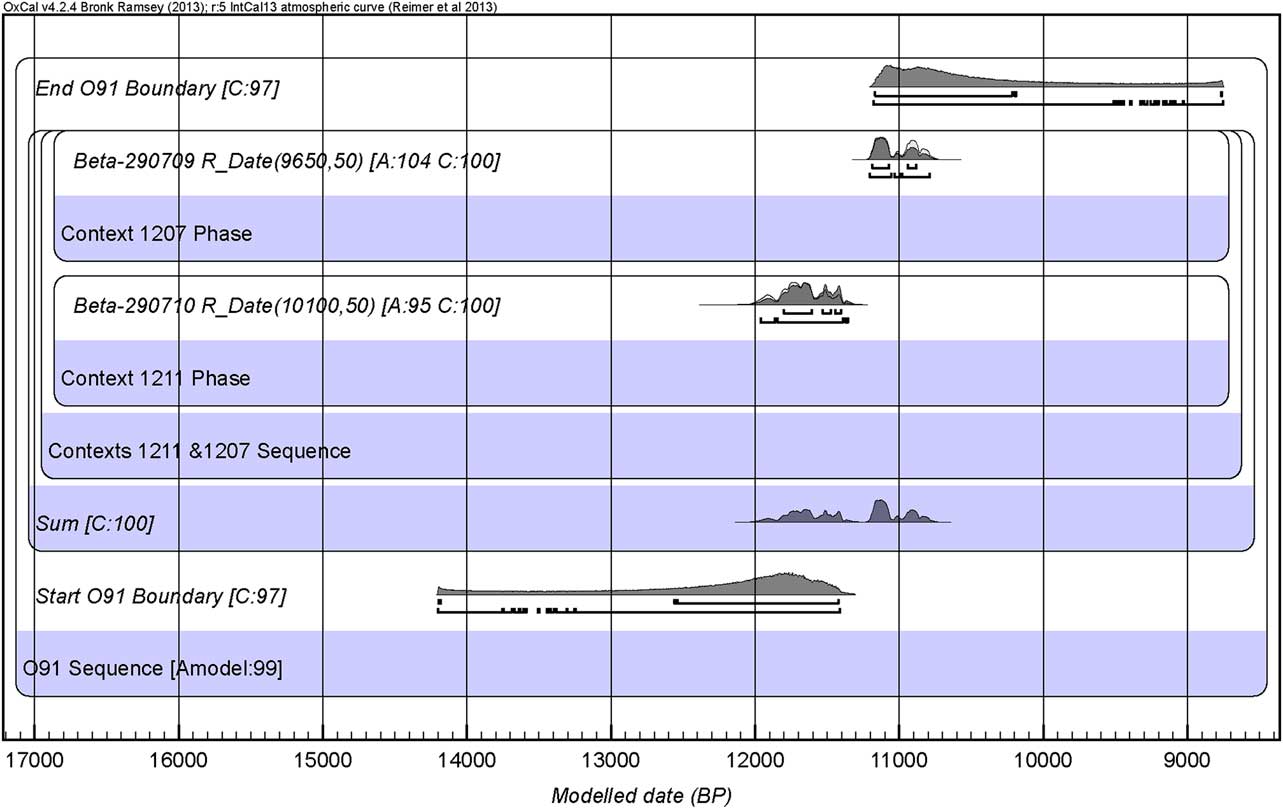
The bi-modal distribution of the sum (SCPD) produced by the stratified sequence model suggests a minimum of two pulses of activity associated with Surface O91. The dates form a coherently stratified sequence of events although we should have more confidence in the younger date, Beta-290709, as this comes from Chenopodiaceae with a relatively lower risk of being susceptible to old wood effects, whereas the older sample, Beta-290710, is from unidentified wood type, which was likely to have been a small branch. This latter sample provides one of the oldest dates from the site as a whole and is stratigraphically inconsistent with the dates coming from Structure O75, which are sealed below the Surface O91 deposits. As such, given that Beta-290710 has been identified as juvenile wood and therefore is unlikely to be substantially influenced by an old wood effect it may derive from charcoal that had been reworked into a chronologically younger deposit. Although it may not date the construction of O91, it does contribute to the overall chronology of the site.
Posterior density estimates for the lower boundary marking the start of activity associated with the use of this area fall at 14.21–11.41 ka cal bp , with the upper boundary suggesting this had ceased by 11.18–8.75 ka cal bp (Table 2).
Trench 1
Trench 1 was located at the south-west extent of the WF16 knoll and originally excavated in 1997 as a 2×2.75 m trench to explore a ring of stones exposed on the surface, designated as Feature F1 (Fig. 3). The trench was extended in 1998 to an area of 2.5×7.25 m, while in 1999 a 1 m wide box section was cut in an attempt to expose the entire depth of archaeological deposits in the west-facing section of the trench (Fig. 25).
East-facing section of Trench 1, WF16, September 1998, with midden layer 110 marked by a horizon of snail shells, the base of 112 indicated by a horizon of burnt angular rocks, & the basal stones used for the construction of Feature F1
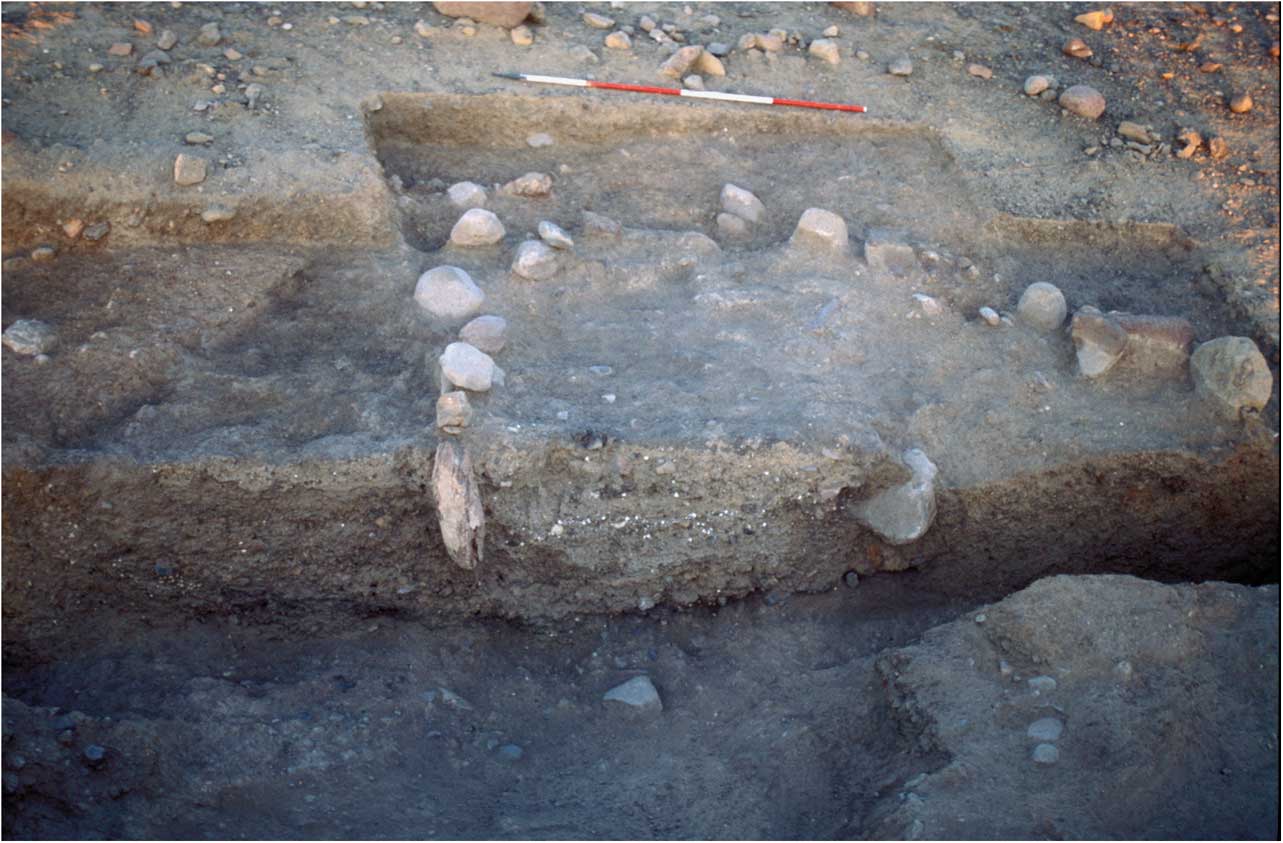
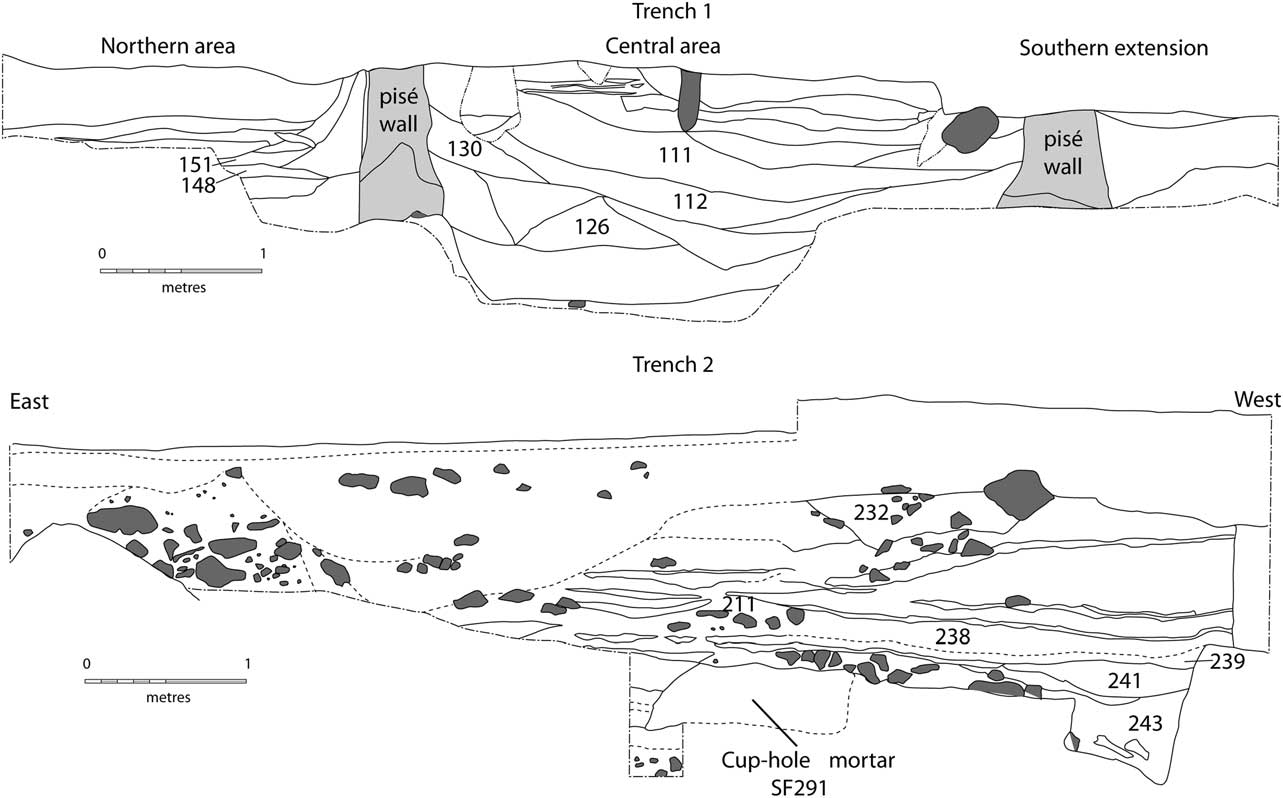
The archaeological sequence exposed within Trench 1 begins with a thick mud-plaster floor onto which a sub-circular pisé wall was constructed, this having been bisected by the box section of the excavation (Fig. 26). More than a metre depth of deposits had accumulated within the interior of this structure, referred to as the Central Area of Trench 1. These included (from the base) shell and bone-rich midden (eg context 126), pit fills (eg context 130), further midden (eg context 112), and slope-wash deposits (eg context 111), prior to the construction of Feature F1 as a circular stone structure embedded into these deposits. To the north of the pisé wall, referred to as the Northern Area of Trench 1, there was a similar sequence of deposits that was stratigraphically isolated from that in the interior of the pisé walled structure. These included a mud-plaster floor, context 148, over which a midden, context 151, had accumulated.
East-facing section of Trench 1 & north-facing section of Trench 2 showing AMS dated contexts
Two samples were selected for 14C dating from contexts within the Northern Area of Trench 1, from context 148 (Beta-192522) and context 151 (Beta-192523; Table 1).
Our chronological interpretation grouped the 14C dates within a stratified sequence model comprising Beta-192522 at its base succeeded by Beta-192523 (ie assuming two contiguously ordered radiocarbon-dated events associated with episodes of use of this area; Fig. 27). Posterior density estimates generated from the Bayesian analysis of the model for the Northern Area of Trench 1 (Amodel: 92.7%) are provided in Figure 27 and in Tables 1 and 2.
Posterior density estimates for 14C dates from the northern area of Trench 1 grouped within a stratigraphic model. Note the relative ‘precision’ of the sum compared to the lengthy lead-in & tail of the boundary estimates in the 95.4% probability range
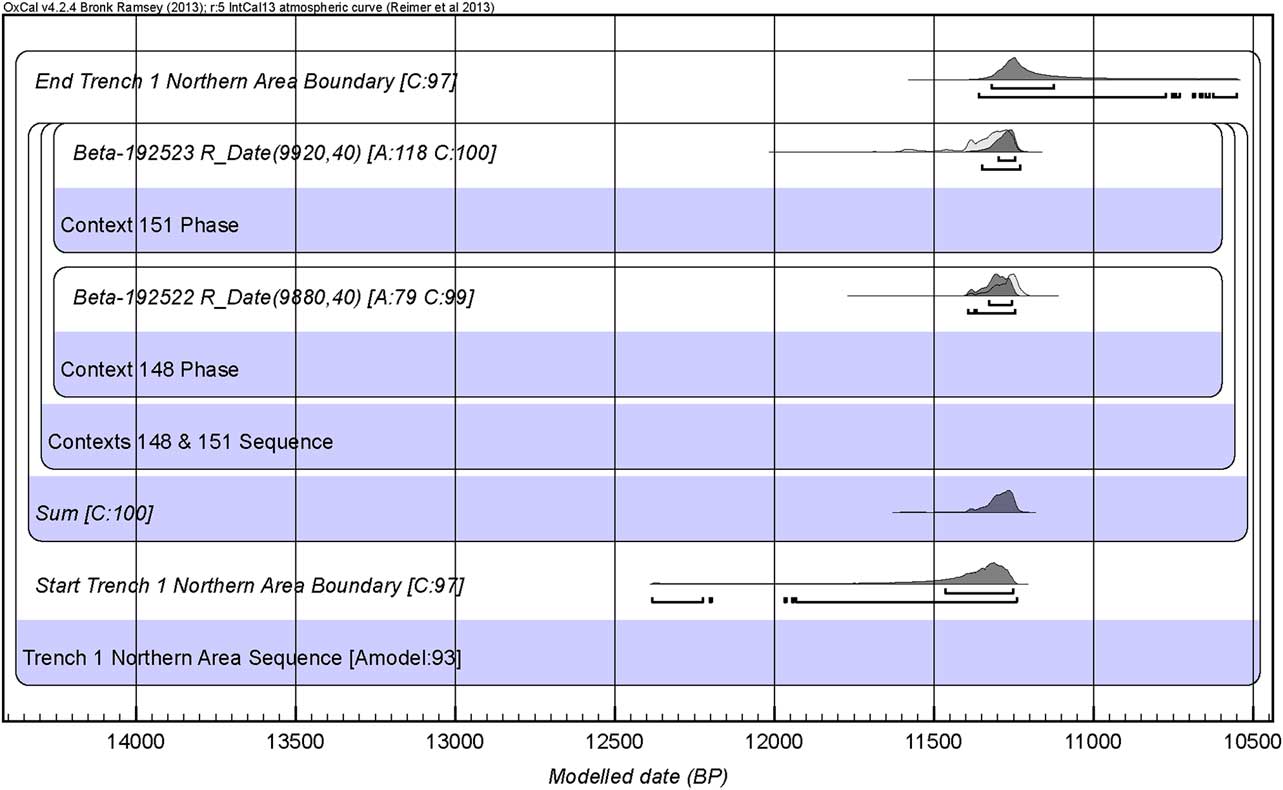
The uni-modal distribution of the sum (SCPD) produced by the stratified sequence model suggests at least one pulse of activity associated with the use of the Northern Area in Trench 1, this being confirmed by the statistical consistency of the two dates contained in the model (χ2-test: df=1; T=0.5; 5% critical value=3.8) providing a calibrated combined value centred on 11.28 ka cal bp (Table 3). As such, the floor and midden appear to have been in use as part of a single event or series of occupations occurring in close succession. Posterior density estimates for the lower and upper boundaries bracketing this activity fall at 12.39–11.24 ka cal bp and 11.36–10.55 ka cal bp respectively (Table 2).
Five charcoal samples were selected for 14C dating from contexts within the Central Area of Trench 1, from context 126 (Beta-192520), context 130 (Beta-192521), context 112 (Beta-120207), and context 111 (Beta-120205 and Beta-120206) (Table 1; Figs 25 & 26). An initial chronological interpretation grouped the 14C dates as a stratified sequence model comprising of two contiguous phases of radiocarbon-dated events associated with the use of the Central Area, with the first phase consisting of the lowermost contexts of 126, 130, and 112, and the second phase the slope-wash deposits of context 111. This produced unacceptable agreement index values caused by an insufficient level of correlation between the calibrated ages for samples and their position within the stratigraphic sequence, and hence was rejected. An alternative model grouped the two phases within a single-phase chronological model (Fig. 28), whilst a third stratigraphic sequence model produced acceptable agreement index values (Amodel=90.1%) having removed an outlier from the sequence and thus provides equally valid posterior density estimates (Fig. 29) as those produced from the chronological model. Both of these models incorporated the old wood offset, this being applied to Beta-192521 derived from a mature form of Cupressaceae. Posterior density estimates generated from the Bayesian analysis of both the chronological and stratigraphic models for the Central Area of Trench 1 are provided in Figures 28 and 29 and in Tables 1 and 2.
Posterior density estimates for 14C dates from the central area of Trench 1 grouped within a chronological model. The model uses an offset to down weight the influence of the old wood effect on the lower boundary

Posterior density estimates for 14C dates from the central area of Trench 1 grouped within a stratigraphic model. The model uses an offset to down weight the influence of the old wood effect on the lower boundary. Note that an acceptable agreement index value has been reached for Beta-120205 & for the model as a whole following the removal of the outlier (Beta-120207)
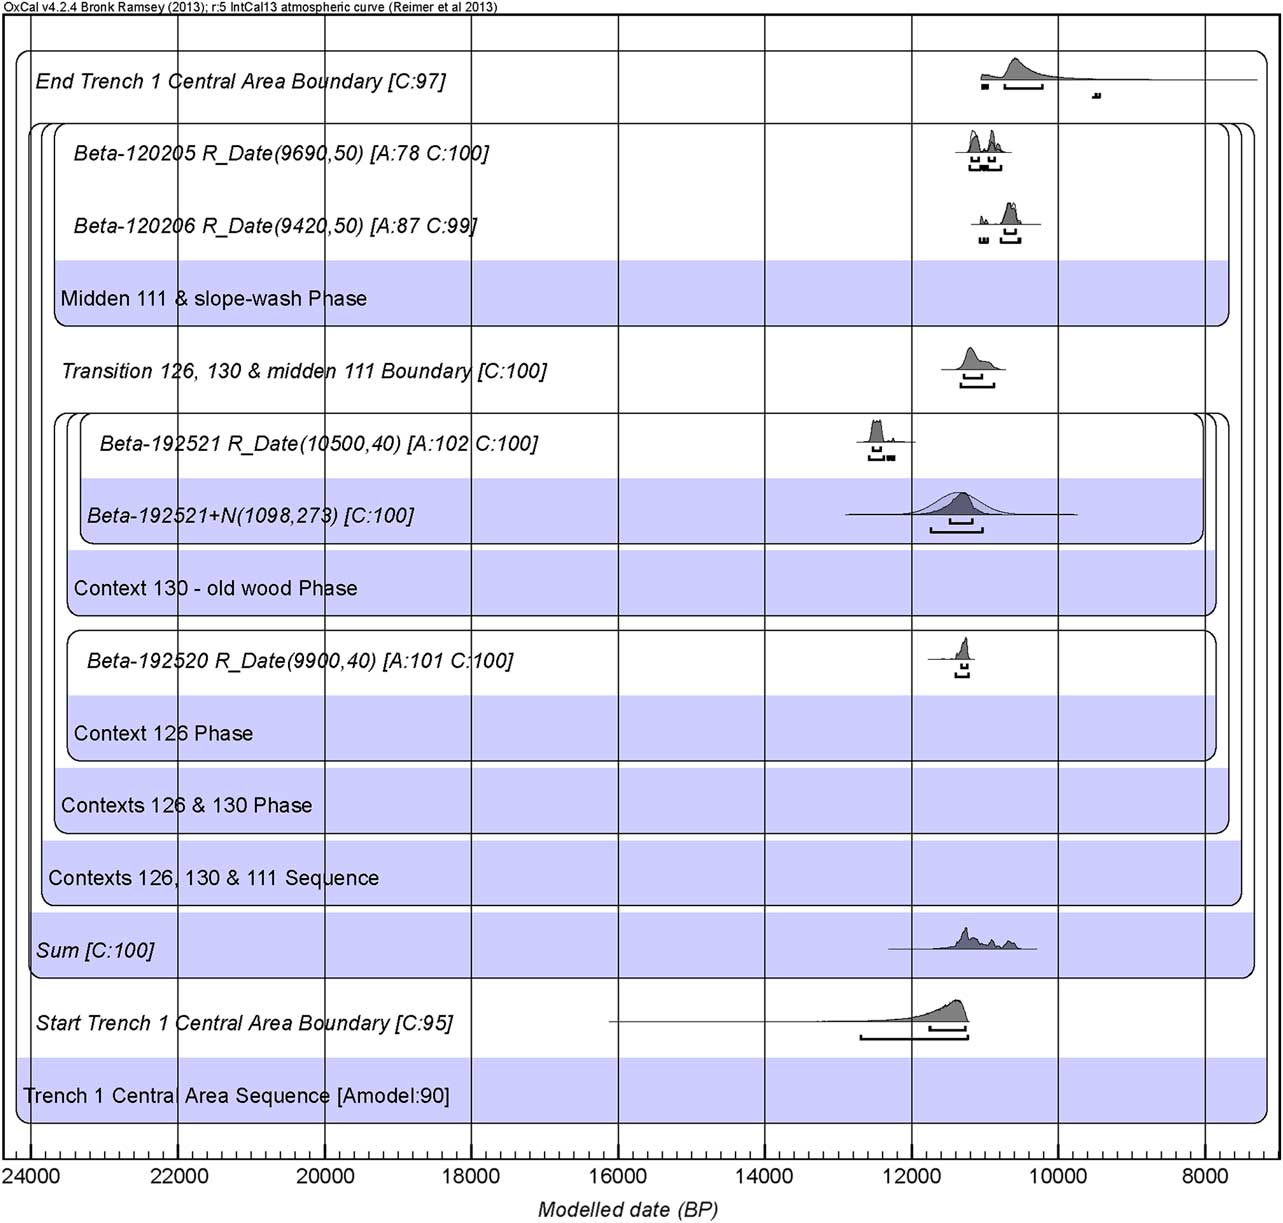
The multi-modal distribution of the sum (SCPD) produced by the stratigraphic sequence model suggests a series of pulses of activity associated with the use of Central Area of Trench 1 (Fig. 29). Statistically inconsistent date ranges were obtained from the middens (contexts 112 and 126) and the pit-fill (context 130), with posterior density estimates indicating that these activity areas were in use sometime after 12.15 ka cal bp (chronological model) or 12.70kacalbp (stratigraphic model) (Table 2). A degree of chronological continuity is suggested across the areas containing middens contexts 111 and 112. Tests for statistical consistencies indicate that those deposits yielding Beta-120206 (context 111) and Beta-120207 (context 112) could derive from a close succession of separate episodes of deposition centred on c. 10.64 ka cal bp (χ2-test: df=1; T=0.1; 5% critical value=3.8; Table 3), although the poor agreement value reached by Beta-120207 in an initial stratigraphic model suggests that it could be intrusive in context 112 having possibly been re-deposited from context 111 by burrowing animals. Further difficulties are indicated by a disparity in δ13C enrichment in the isotopic ratios for these two dates (-25.8‰ and -12.1‰ respectively), potentially reflecting contamination of Beta-120207 or that the (unidentified) plant from which this derived had grown in an area of localised aridity.
Statistical inconsistencies in dates obtained from midden context 111 suggest that it could have remained in use potentially for at least c. 370 years, with activity associated across the central area estimated as having come to an end by 9.86 ka cal bp (chronological model) or 9.44 ka cal bp (stratigraphic model).
Trench 2
Trench 2 is located outside of the 2008–2010 excavation area on the northern slope of the knoll, to the immediate north of Structure O75 (Fig. 3). It was excavated between 1997 and 1999, initially to explore a ring of stones exposed on the surface of the knoll, referred to as Feature F8 (Finlayson & Mithen Reference Finlayson and Mithen2007, 175–90). The total excavated area was 7.5×5.0 m which revealed F8 as a circular stone built structure, with further structures to its immediate east and west (Fig. 30). An archaeological sequence was exposed that began with a wall constructed from large boulders around a hollow within the underlying gravel (Fig. 26). This contained a solid mud-plaster floor, within which a cup-hole mortar was embedded and through which a burial was cut with a charcoal rich fill (context 243). The burial was sealed by a further horizon of mud-plaster (context 241) prior to being cut for the deposition of further bones. Above these floors, a series of thinner mud-plaster floors, silts and horizons of occupation debris (eg contexts 210 /238) accumulated, some of which may have been deliberate levelling deposits (eg context 211), while others appear to derive from periods of abandonment (eg context 239). A new circular wall was then constructed from uncut stone blocks and bound by mortar, the upper courses of which had been exposed on the surface of the knoll and designated as Feature F8. Thin mud-plaster floors (eg context 232) had continued to be created within the structure and occupation debris accumulated; eventually some of the stones from the wall slumped inwards, after which there was no further activity at this location.
North-facing section through feature F8 within Trench 2, WF16, September 1998, showing burial pit 243 to the right of the picture

Six samples of charcoal and two seeds were selected for 14C dating: from context 243 (Beta-192527), context 241 (Beta-192536), context 211 (Beta-120211), context 239 (Beta-192525, Beta-208671), context 210/238 (Beta-120210, Beta-208672), and context 232 (Beta-192524) (Table 1). An initial chronological interpretation grouped this succession of 14C dates as a stratified sequence model comprised of six contiguous phases of radiocarbon-dated events associated with the use of the area exposed in Trench 2. This model tested true for a null hypothesis (Amodel=0) due to chronological reversals indicated by the stratigraphic positions of Beta-120210, Beta-192524, Beta-208671, and Beta-208672, and hence was rejected. An alternative model grouped the dates within a single-phase chronological model (Fig. 31) as the 14C dataset obtained from Trench 2 lacked any clear outliers with which to attempt further refinements to the stratigraphic sequence model. Beta-192524 to -192527 were also embedded within an old wood offset, deriving from mature or indeterminate forms of Cupressaceae. Posterior density estimates generated from the Bayesian analysis of the models for Trench 2 are provided in Figure 31 and in Tables 1 and 2.
Posterior density estimates for 14C dates from Trench 2 grouped within a chronological model using an offset to down weight the influence of the old wood effect on the lower boundary
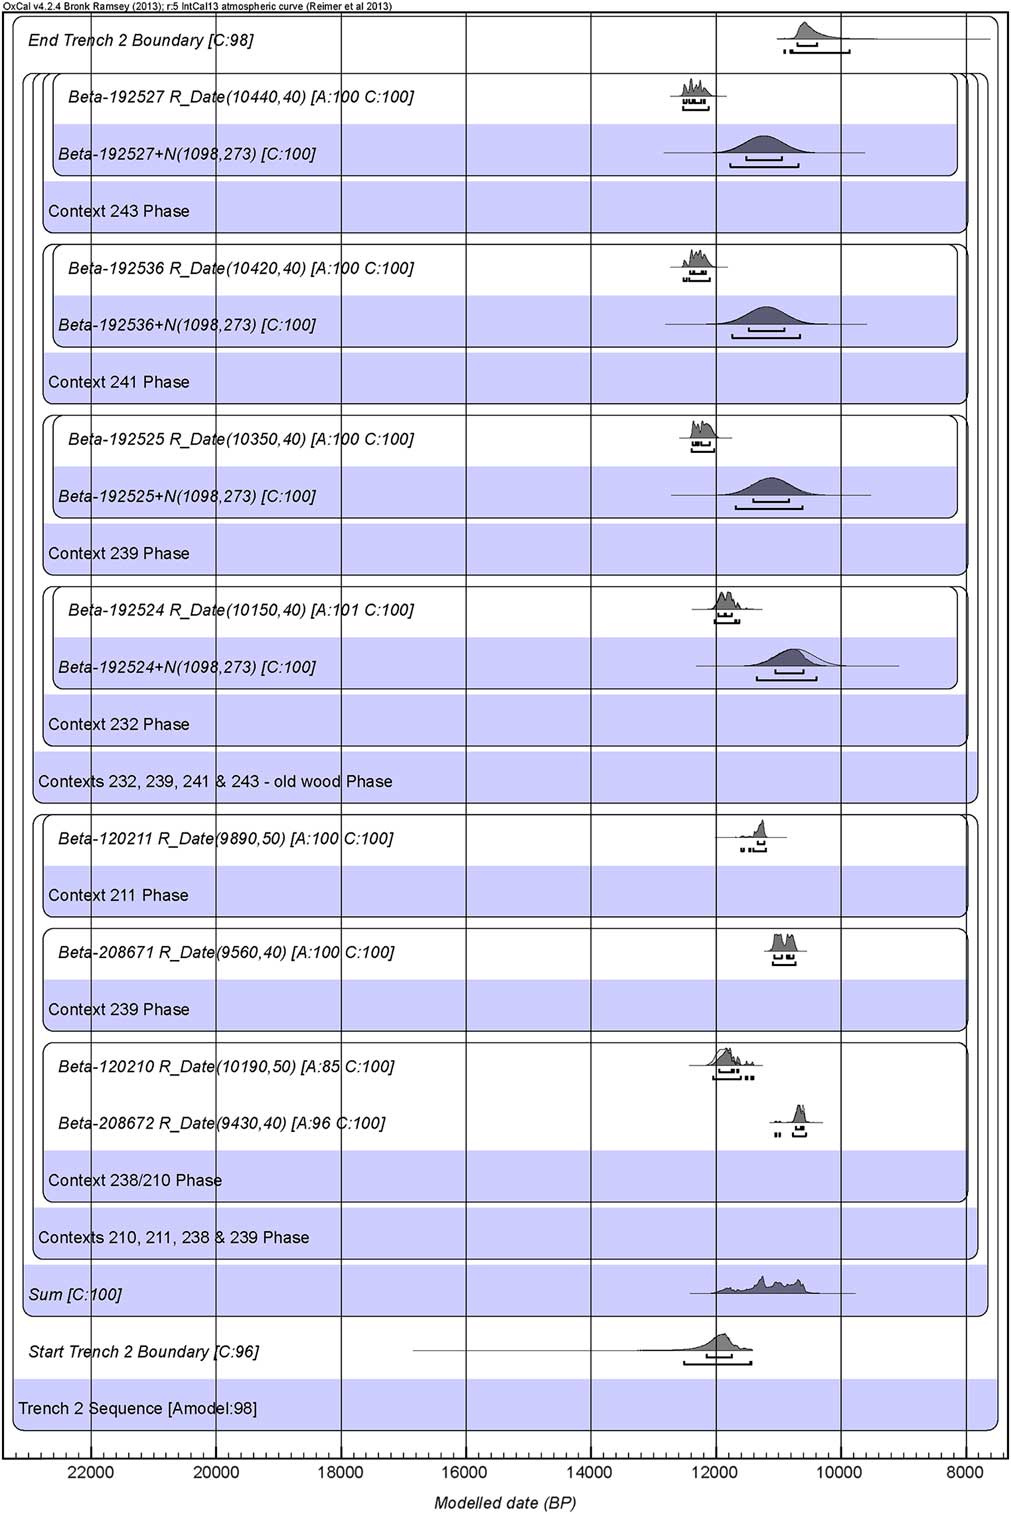
The multi-modal distribution of the sum (SCPD) produced by the chronological model suggests a series of pulses of activity associated with the use of the area in Trench 2. The earliest phase of activity relates to the use of a burial pit (context 243; Beta-192527) and a fragment of floor (context 241; Beta-192536), with the model indicating that these could have occurred by c. 11.74 ka cal bp . Tests for statistical consistency indicate that these dates on Cupressaceae are consistent with stratigraphically later dates on Cupressaceae associated with an abandonment horizon, context 239 (Beta-192525; χ2-test: df=2; T=2.8; 5% critical value=6.0; Table 3). An early date from context 239 is significant because this level also produced a considerably younger date from a grass seed (Hordeum), Beta-208671. This date was similar to, although not statistically consistent with, a date obtained from another grass seed (Bromus) coming from within a trampled floor (context 238) immediately overlying context 239 (Beta-208672).
We cannot discount the possibility that the seeds in contexts 239 and 238 are intrusive, and are hence providing spuriously young dates for those contexts, although the contexts are deeply stratified within the trench. Contexts 239 and 238 are interpreted as a temporary period of abandonment and hence a viable interpretation is that the Bromus and Hordeum were growing as weeds. Overall, we are more confident that the seed dates, Beta-208671 and Beta-208672, provide a more reliable indication of the timing of occupation of the activity within Trench 2 than the dates obtained from Cupressaceae; this being likely to have occurred sometime after c. 11.10 ka cal bp (Table 2). Assuming this is correct, it is on this separation in time between the short-lived and potentially long-lived plant remains that we have been able to extrapolate a realistic old wood offset as discussed in the previous section.
Overall, estimates place the date of the charcoal at the base of the excavated areas within Trench 2 at 12.51–11.43 ka cal bp, with final stages of associated activity estimated at having occurred by 10.91–9.86 ka cal bp .
Trench 3
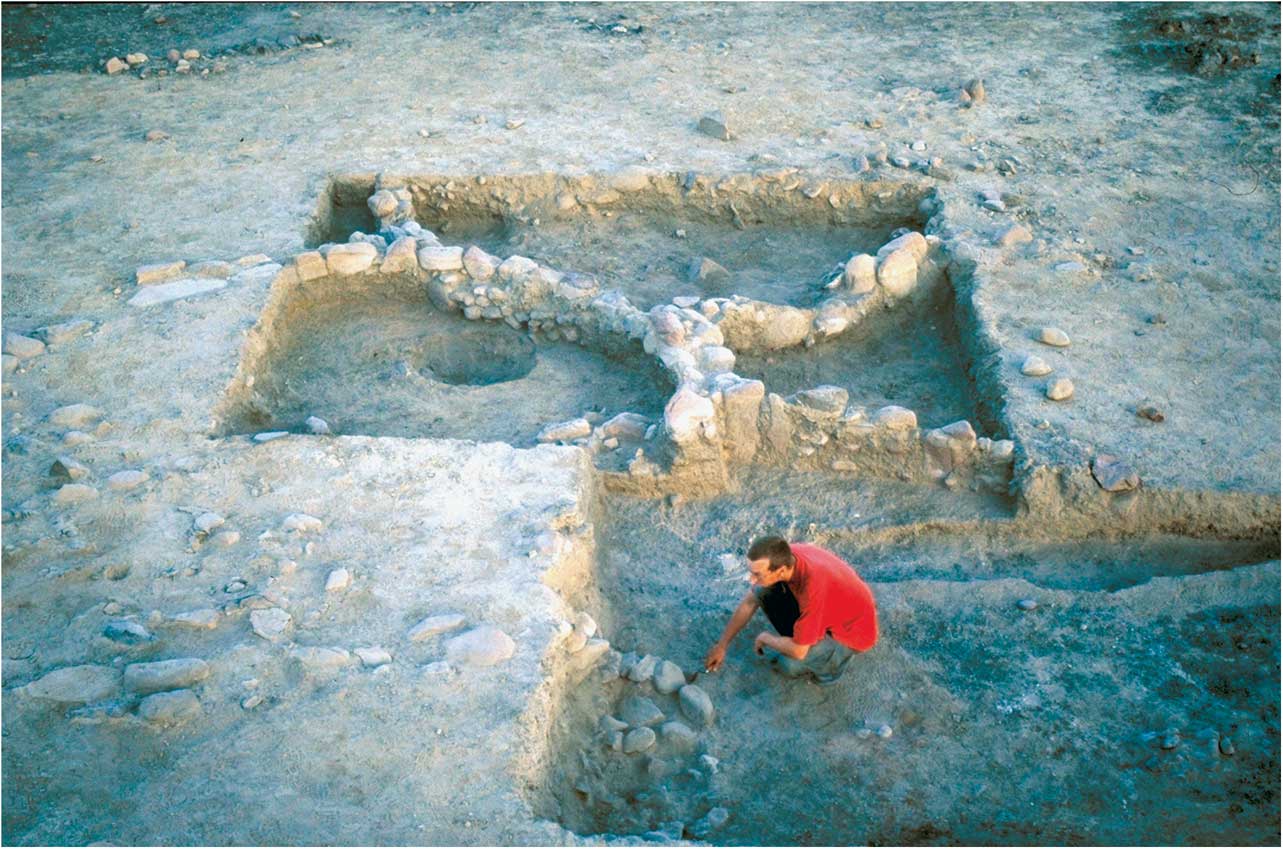
Trench 3 was located on the summit of a knoll to the immediate east of the WF16 knoll on which several arcs of stone-walling were exposed on the surface (although not shown in Fig. 3 this indicates its location). A 5×5 m trench was excavated in 1998, which was extended by an adjoining 5×5 m trench in 1999 (Fig. 32). This knoll consisted of porphyry bedrock and provided shallow archaeological deposits with limited stratigraphy. The arcs of stone-walling were shown to come from at least three adjoining structures, designated as F3992, F39911, and F3991, with F3991 having been the latest construction. They contained patchy, poorly preserved mud-plaster floor horizons (eg context 310) surviving between rubble collapse, with a small area of occupation debris (context 330) being found above this floor within one of the structures (F3992). Three pits had been cut into the degrading bed-rock. One of these, F39910, was directly sealed by the occupation debris (context 330) and contained a human burial and a charcoal-rich fill (context 332). Charcoal for dating was also recovered from the fills of the other two pits (F3996, context 327 and F3995, context 329). There was no stratigraphic relationship between the pits; it remained unclear whether these had been cut through the floor (context 310), cut prior to that floor being established or were part of a single construction event – the third option being our preferred interpretation.
Excavation of Trench 3, WF16, September 1999, looking north. F39910 that contained a human burial is visible in the mid-ground, adjacent to an arc of walling
Six charcoal samples were selected for 14C dating from Trench 3: from context 329 (Beta-135110), context 327 (Beta-192531), context 310 (Beta-209010), context 332 (Beta-135111, Beta-192530), and context 330 (Beta-192529) (Table 1). There was limited charcoal available for dating in Trench 3, and that present was of poorer quality than elsewhere at WF16. As such four of the six samples could not be identified to species, which constrains the analysis because of the possibility of old wood, while one further sample (Beta-192530) was from mature Cupressaceae, which has been already been shown to return old wood effects.
Our chronological interpretation grouped the 14C dates within a single-phase model comprised of one phase containing Beta-135110, Beta-192531, and Beta-209010. This overlapped with a sequence containing Beta-135111 and Beta-192530 grouped as a phase at its base and an upper phase containing a single date (Beta-192529). This arrangement assumes that an ordered distribution of three radiocarbon-dated events were likely to have occurred concurrently alongside three uniformly distributed events associated with the use of the area in Trench 3 (Fig. 33). This model also embedded Beta-192530 within an old wood offset, deriving from a mature form of Cupressaceae. Posterior density estimates generated from the Bayesian analysis of the model for Trench 3 are provided in Figure 33 and in Tables 1 and 2.
Posterior density estimates for 14C dates from Trench 3 grouped within a chronological model using an offset to down weight the influence of the old wood effect on the lower boundary
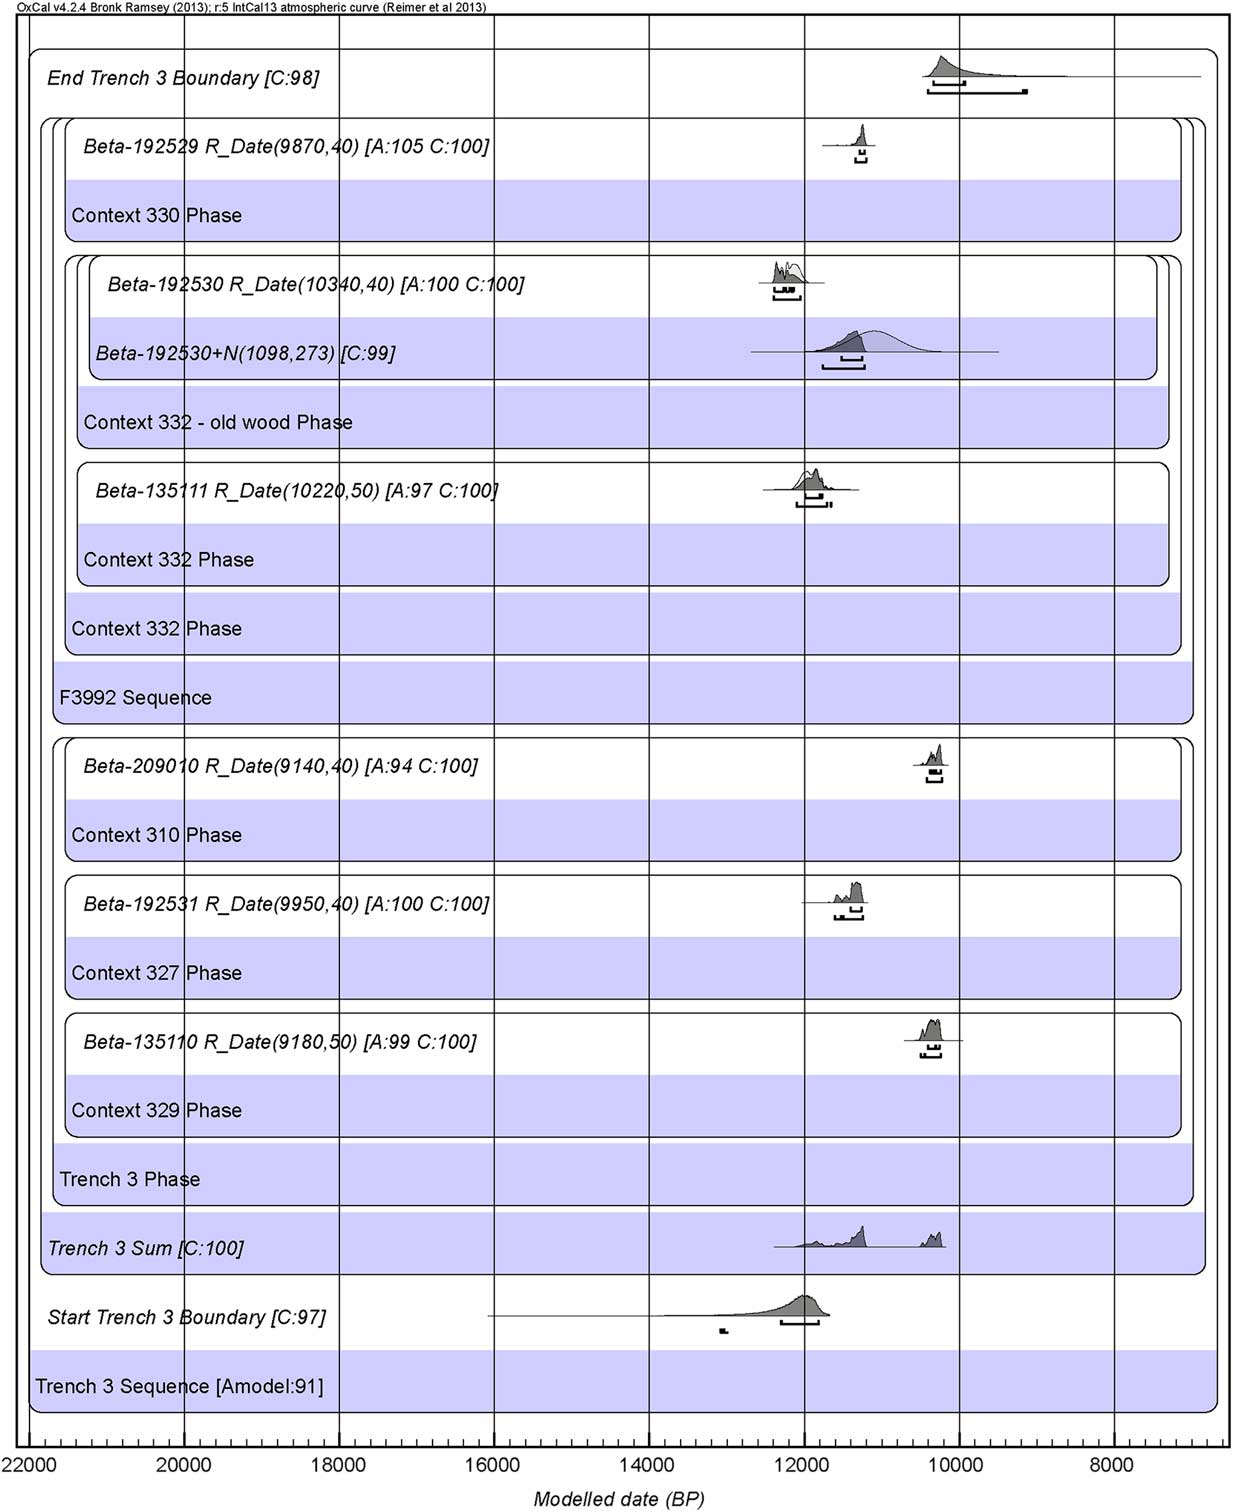
The multi-modal distribution of the sum (SCPD) produced by the chronological model suggests at least three pulses of activity could be associated with the use of the area in Trench 3, the last of which is likely to have occurred sometime after preceding episodes. Tests for statistical consistency confirm this, by indicating that activity associated with the excavated deposits falls into a minimum of four separate episodes. The first of these is centred on 11.88 ka cal bp and associated with the use of context 332 in pit F39910 (Beta-135111). A second episode associated with the use of pit F39910 occurs c. 460 years later (Beta-192530). There then appears to be a change in activity marked by the deposition of the overlying occupation context 330; this coming into use by c. 11.26 ka cal BP (Beta-192529, 11.35–11.20 ka cal bp ). This date is statistically consistent with the estimated date for context 327 from pit F3996 (Beta-192531; χ2-test: df=1; T=2.0; 5% critical value=3.8; Table 3). The fourth episode of activity derives from context 310, the occupation debris from within F39911 (Beta-209010) and context 329, the fill of pit F3995 (Beta-135110), both of which yielded statistically consistent dates centred on 10.30 ka cal bp (χ2-test: df=1; T=0.4; 5% critical value=3.8).
Posterior density estimates for the lower boundary marking the start of activity in this area indicate that this probably could have occurred by 13.09 ka cal bp , with it coming to an end by 9.13 ka cal bp (Table 2).
Site Model & Summed Calibrated Probability Distribution
Site model
One objective of this chronological study was to obtain an estimate for the beginning and end of activity at WF16 as represented by the excavated deposits. To do so we initially integrated the Individual Object Models according to the WF16 site matrix but these produced a Site Chronological Model with unacceptably low-agreement index values due to the extent of chronological reversals occurring across the site, as evident in the majority of the Individual Object Models.
In this light, we constructed a single-phase Site Chronological Model containing the entire WF16 14C dataset (n=46), embedding dates derived from mature and indeterminate forms of Cupressaceae within an old wood offset. Figure 34 provides the posterior density estimates for the lower and upper boundaries bracketing the WF16 14C dataset that indicate that associated activity had commenced by 12.02–11.64 ka cal bp (Table 2). This estimate is coincident with the terminal stages of the Younger Dryas/GS-1 cooling and, as far as can be determined from the excavated deposits, provides an overlap with Blockley and Pinhasi’s (Reference Blockley and Pinhasi2011) estimate for the start of the PPNA in the southern Levant derived from a regional analysis of AMS dates of 11.78–11.42 ka cal bp.
Summed calibrated probability distribution of modelled 14C dates bracketed by posterior density estimates indicating the beginning & end of occupation at WF16
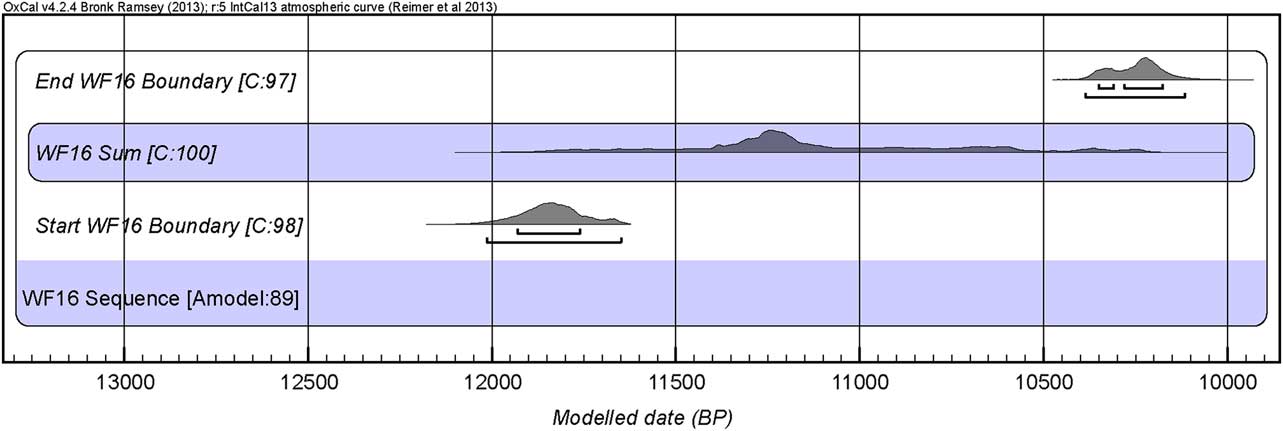
The upper boundary estimates show that activity at WF16 as represented by the excavated deposits ended by 10.39–10.11 ka cal bp (Table 2). We are confident that the upper boundary provides a reliable estimate of when the site fell into dis-use as represented by the excavated deposits (which might include intrusive charcoal from the very end of PPNA human activity at WF16, the archaeological horizons of which have been destroyed by erosion). This confidence is due to the constraint placed on the upper boundary estimate by 14C dates obtained from relatively short-lived taxa.
Summed calibrated probability distributions
Summed calibration probability distributions are often used as proxies for the intensity of human activity (eg Weninger et al. Reference Weninger, Alram-Stern, Bauer, Clare, Danzeglocke, Jöris, Kubatzki, Rollefson, Todorova and van Andel2006; Wicks & Mithen Reference Wicks and Mithen2014). We have so far used SCPDs embedded within Individual Object Models to explore possible frequencies and tempos apparent in episodes of activity associated with construction phases and uses of space at WF16 that we have then used to augment inferences drawn from the statistical consistencies present in the 14C dataset. Their use in that regard requires interpretation in light of the biases potentially imposed by the nature of the calibration curve.
Natural variation in concentrations of atmospheric carbon over time has resulted in significant plateaus in the calibration curve. A well-known consequence is the reduction in the precision of calibrated date ranges of 14C determinations falling across flattened sections of the calibration curve. The plateaus occurring across the Late Pleistocene–Early Holocene transition are particularly pronounced, these tending to exhibit sharp increases in the gradient of the calibration curve immediately preceding the plateaus (Figs 8 & 35). Such slope steepening influences the post-calibration shape of posterior density functions (PDF) generated from pooled 14C datasets, which can result in the generation of tall narrow peaks (Bartlein et al. Reference Bartlein, Edwards, Shafer, Edward and Barker1995; Michczyński & Michczyńska Reference Michczyński and Michczyńska2006). To the inexperienced these can be misinterpreted as representing variability in the 14C proxy for past human activity, particularly at times when changes in activity arising from climate and/or environment change are to be expected. To explore the potential correlation between calibration gradients and PDF enhancement, we followed Wicks and Mithen (Reference Wicks and Mithen2014) by comparing the WF16 SCPD against a simulated SCPD generated from a uniform distribution of 14C dates (n=51; mean SD [ΔT] = 50 years) spanning the period of occupation at WF16.
Posterior SCPDs extracted from the WF16 chronology (solid polynomial) and uniformly-distributed simulated dataset (hollow polynomial), plotted against changing gradients in the 14C calibration curve between 13.0–9.5 ka cal bp. Notable plateaus in the calibration curve occur at c. 12.35–12.15 ka cal bp, c. 11.10–10.80 ka cal bp, and c. 10.15 bp 9.95 ka cal bp, immediately preceded by steep sections that correspond with tall narrow peaks in the posterior density function of pooled calibrated 14C datasets. ΔT=average SD
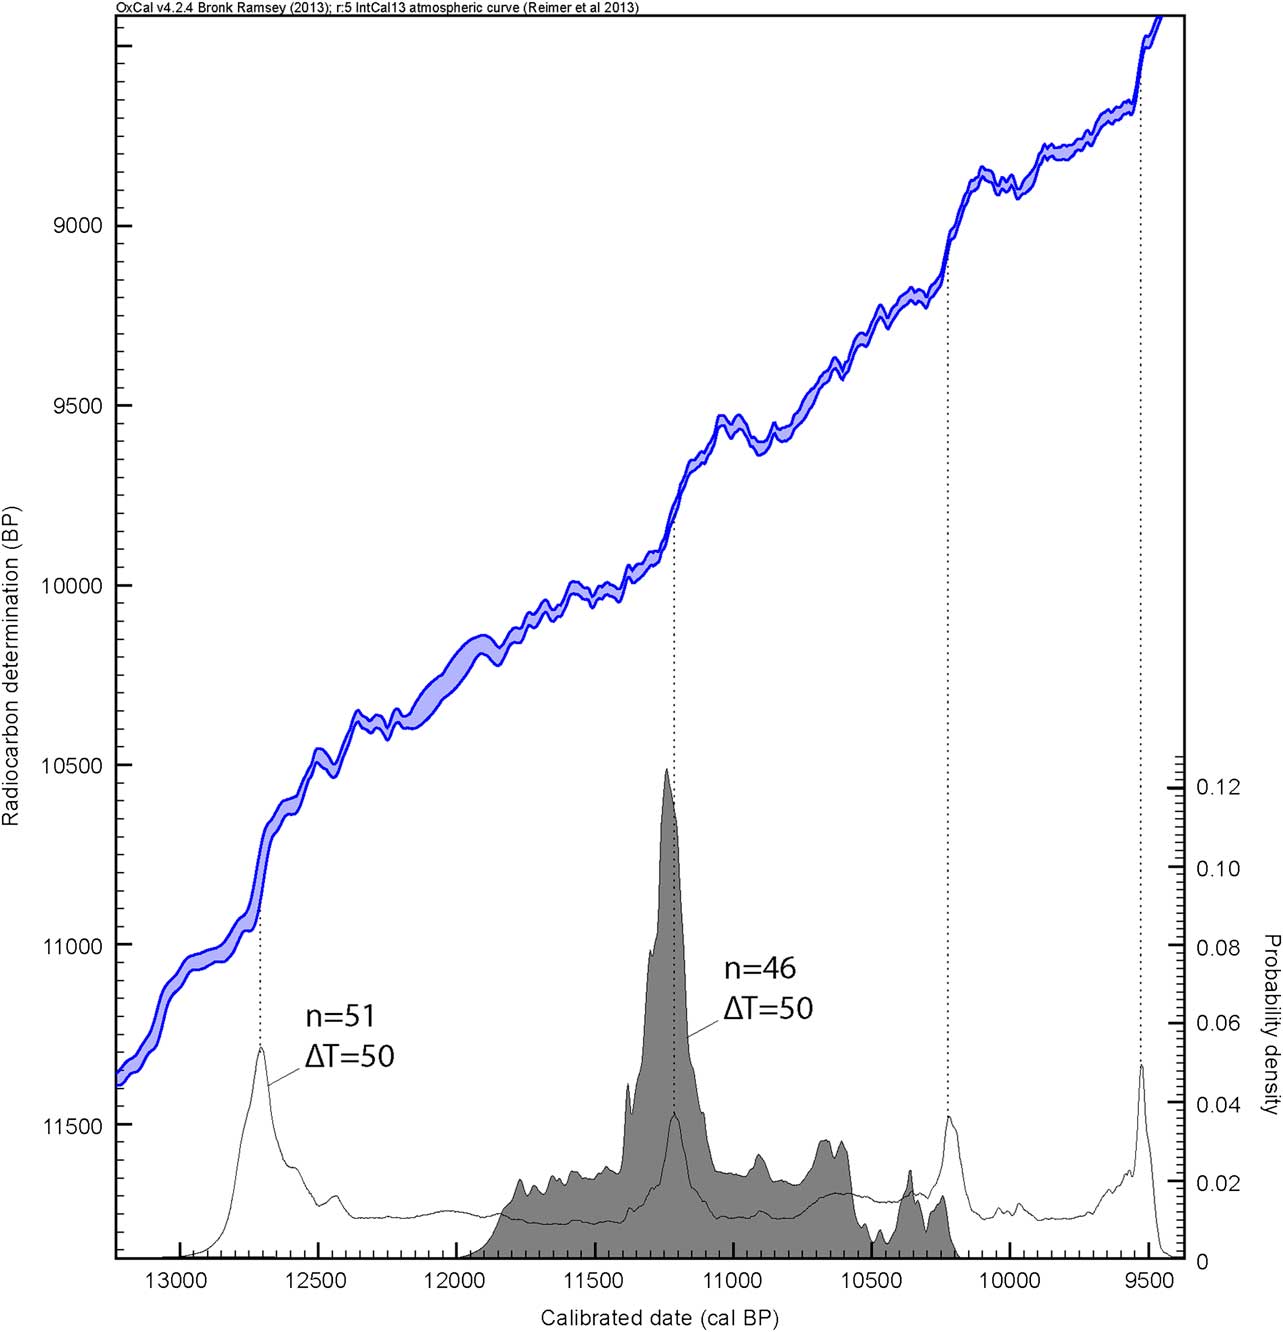
Figure 35 provides a comparison of the SCPDs extracted from the WF16 chronology and the simulated dataset of uniformly-distributed dates, aligned against the corresponding section of the 14C calibration curve. This shows a tall narrow peak in both the real and simulated SCPDs between c. 11.1–11.4 ka cal bp that corresponds with a steep gradient that precedes a plateau in the section of the calibration curve that intercepts with the ordinate between 9500–9950 14C years bp. As such, the apparent concentration of human activity between c. 11.1–11.4 ka cal bp could be no more than an artefact of the calibration curve.
To further explore this we tested whether a tall peak at c. 11.25 ka cal bp could be reproduced in groups of randomly-distributed 14C determinations, this providing a more effective simulation of the WF16 14C dataset than a uniformly-distributed dataset.
A random number generator was used to generate values (n=50) with comparable uncertainties (ΔT=50 yrs) falling within the range of 14C determinations obtained for WF16. A Sum command was used in conjunction with a single-phase model containing the randomly-generated 14C determinations, a procedure that we repeated ten times, five of which are illustrated in Figure 36. In 60% of cases a tall peak was evident in the randomly-distributed simulated SCPD at c. 11.25 ka cal bp, indicating that there is a 60% probability that summed 14C determinations calibrating to this date are likely to exhibit calibration curve influences. In light of this likelihood, we interpret the precise correlation of the WF16 11.25 ka cal bp peak with a steep calibration gradient as an indication that its SCPD is exhibiting strong calibration effects that to some extent may be masking the archaeological signal.
A selection of posterior SCPDs extracted from randomly-distributed simulated 14C datasets spanning the period of occupation at WF16. ΔT=average SD

Whilst this calibration influence is present, we note that the height of the WF16 peak is much more pronounced than that resulting from the simulated datasets, suggesting additional causal factors are present. We also note that the uniformly-distributed simulated SCPD produced three further peaks with similar probability densities to its c. 11.25 ka bp peak. These are expected, being in concert with steep sections of the calibration curve intercepting with the abscissa at 10,950–10,600 14C years bp, 9180–8900 14C years bp, and 8650–8000 14C years bp (Fig. 35). The peak at c. 10.2 ka cal bp in the SCPD of the uniformly-distributed simulated dataset is not evident in the WF16 SCPD, suggesting that calibration influences are not consistently obscuring archaeological patterns. Unfortunately, the range of the existing 14C dataset for WF16 does not extend to the steep-sections of the calibration curve calibrating to c. 12.7 ka cal bp and 9.5 ka cal bp enabling further consideration of calibration curve effects.
In summary, given that the WF16 SCPD does not suggest a peak at c. 10.2 ka cal bp to coincide with that on the uniformly-distributed simulated SCPD, and that the WF16 SCPF peak at c. 11.25 ka cal bp is significantly more pronounced than that on the uniformly-distributed simulated SCPD, we suspect the latter is partly a true reflection of the intensity of human activity at WF16.
Discussion
As far as we are aware, 46 AMS dates is a significantly larger sample than from any other PPNA sites within the southern Levant. Twenty 14C dates are available from Jericho and ten from Netiv Hagdud (Sayej Reference Sayej2004) but in both cases their value is constrained by a lack of contextual information and material identification. As evident, however, 46 AMS dates is an inadequate number of samples to date a site of the size and complexity of WF16, which is not atypical for the PPNA. This arises from the difficulty of relating the stratigraphic sequence from one structure to that of another, resulting in multiple Individual Object Models, each with a small number of AMS dates the interpretation of which are challenged by potential old wood effects, sediment redeposition, bioturbation and plateaus on the calibration curve.
These provide significant constraints on our understanding of the chronology of WF16. Several of the Individual Object Models demonstrate stratigraphic inversion of dates that cannot be attributed to old wood effects. With Structure O11, for instance, the two dates from the upper-most floors provided the oldest dates from the Structure O11 stratigraphic sequence as a whole, neither of which come from samples that are suspected of being especially old wood. In this case we suspect that the sediment used to create the upper most floors in Structure O11 had been redeposited from earlier deposits within WF16 itself, perhaps collapsed walls. A further illustrative example comes from the date from a sample embedded within the surface of Surface O91, which although not identified to plant taxa comes from a young specimen. This date is older than those from the floor of Structure O75 that are stratified below Surface O91. Again, we suspect the redeposition of sediment containing charcoal to construct Surface O91, this coming from earlier activity at the site. Supporting evidence for the re-use of sediment in this manner comes from stone artefacts and other materials having been found within the angular pisé blocks that formed the fill of Structure O33 and the pisé walls within Trench 1, both suggesting the re-use of occupation debris. In general, the settlement of WF16 appears to have been in a constant state of being re-modelled, this being made relatively easy by the extensive use of pisé and mud-plaster rather than stone as the primary building materials.
Old timbers appear to have been used as fuel for the hearths within Structure O45 and Midden O60. Both are relatively late in their respective stratigraphic sequences (that of Midden O60 being provided by the underlying O100/O91 and O75) but appear to have burned wood that had been scavenged from earlier deposits at WF16, producing AMS dates that are older than their stratigraphic position can allow.
The redeposition of older material is complemented by cases of the intrusion of younger material, although these are more problematic at WF16. An anomalously young date was acquired from an apparently sealed context within Structure O11, this date being one of the youngest for the site as a whole. This might be an example of intrusion caused by insect or rodent burrowing within the sediments, although because the older dates stratified above this sample are likely to derive from redeposited charcoal, the young date might be an accurate indication for late activity within Structure O11. Another possible example of intrusion are the two seeds dated from Trench 2, providing significantly younger dates than the wood charcoal from the same and adjacent contexts. As discussed above, it remains unclear whether the chronological discrepancy reflects intrusive younger seeds, old wood or a combination of both effects.
Our attempt to quantify the old wood effect relating to mature and indeterminate forms of Cupressaceae indicated that this is likely to be in the order of 825–1370 years. We note, however, that an old wood effect may not be restricted to Cupressaceae alone. The three dates coming from samples within the thin occupation debris above the floor in Structure O33 suggest that Tamarix might be providing an old date potentially by as much as 440 years. This assumes that the Chenopodiaceae specimen from that context is providing a date for the formation of that debris, this taxa most likely being shorter lived than Tamarix and both being shorter-lived than the Cupressaceae specimen that provides the third date from this context. If Tamarix is providing old dates, this might require that further adjustments are made to the posterior density estimates for the Individual Object Models in a similar manner to those made to allow for the old Cupressaceae effect.
These matters remain unresolved because 46 AMS dates is an inadequate sized sample to unravel the inter-relationships between taxa, maturity of specimen, stratigraphy, sediment redeposition and intrusive material when an attempt is being made to date multiple structures that are stratigraphically isolated. Fortunately, our analysis suggests that with a larger sample of dates these matters can be resolved; moreover the excavation has provided an ample supply of suitable material for dating, coming from well-defined contexts and for which both taxa and maturity can be established.
Conclusion
A principle objective of this study was to explore the correspondence between Blockley and Pinhasi’s (Reference Blockley and Pinhasi2011) proposal for the start of the PPNA within a range of 11.78–11.42 ka cal bp, with that derived from WF16. We have found a good correspondence utilising our Lower Boundary Posterior Density estimate for the Site Chronological Model containing an old wood offset of 825–1370 years, resulting in a range of 12.02–11.64 ka cal bp . As such, we agree with Blockley and Pinhasi that the onset of the PPNA is likely to fall across the Younger Dryas/Early Holocene transition, although our study shifts that start earlier by potentially 200–300 years. Moreover, we have only dated the activity associated with the excavated deposits. Our excavations have not reached the base of the stratigraphy, and hence we cannot entirely reject a significantly earlier date for the onset of the PPNA at WF16.
For the excavated deposits at WF16, activity is likely to have started by c. 11.84 ka cal bp and lasted for at least c. 1590 years, ceasing by c. 10.24 ka cal bp. On the basis of the SCPD providing a proxy for the intensity of human activity, this appears to have been particularly intense for a period lasting c. 350 years centred on c. 11.25 ka cal bp, followed by less intensive activity lasting a further c. 880 years, although that apparent decline might be a consequence of having lost later PPNA deposits by erosion . We emphasise that using the SCPD as a proxy for human activity is problematic, because of natural variations in the calibration curve. We were able to show, however, that while those variations may have exaggerated the apparent peak in the SCPD centred on 11.25 ka cal bp, this is likely to be a true reflection of human activity as represented by the available radiocarbon dating samples.
The constraints imposed by old wood, sediment redeposition, bioturbation, and plateaus on the calibration curve constrain the level of chronological resolution we have been able to achieve within our Individual Object Models. It is nevertheless striking that the most reliable dates from several of the structures – those dates which are unaffected by old wood and sediment redeposition – are all closely clustered around c. 11.20–11.25 ka cal bp. These dates include those concerning the activity leading to the accumulation of debris within Structure O11, the activity on the floor of Structure O33, activity within Trench 3, and that in the Northern Area of Trench 2.
The stratigraphic sequence at the northern extent of WF16 consisting of Structure O75, followed by Surface O91 and Structure O100, and then Midden O60 appears to have formed over a short period of time. At face value the posterior density estimates suggest a chronological overlap between these objects although their stratigraphic succession has been clearly established by excavation.
If Structure O45 had also been constructed at c. 11.20 ka cal bp at the upper limits of its Lower Boundary estimates, then it appears to have been in use for several hundred years until it burnt down, our best estimate for that falling at c. 10.82 ka cal BP (the median of the 95.4% calibrated date range for the statistically consistent Beta-271687 and Beta-271688, having been combined prior to calibration - see Table 3)
Whether the methodological challenges arising from sediment redeposition and old wood are especially severe at WF16 or common to the PPNA throughout the Levant remains unclear. We suspect the latter. Other than the large O75 structure, the archaeology at WF16 is typical for PPNA sites, consisting of a series of structures with isolated stratigraphic sequences that are now located in highly arid, erosional environments and susceptible to bioturbation from insects and rodents. Indeed the methodological challenges at WF16 appear similar to those facing the interpretation of 14C dates from Mureybet (Ibàñez Reference Ibáñez2008). We hope to have demonstrated that by using Bayesian approaches, controlling for the old wood effect and with meticulous attention to stratigraphy and context, contra Bar-Yosef (Reference Bar-Yosef2009, 127) some ‘meaning’ can be derived from the 14C dates coming from archaeological sites with these characteristics.
Finally, we should note that although the combined effects of old wood, sediment redeposition, bioturbation and human activity on the chronology of WF16 have not been fully resolved, there is an opportunity to do so by expanding the number of dated-samples. Indeed, in light of the quantity of charcoal and seeds coming from well-defined stratified contexts, enabling several hundred AMS dates to be secured, WF16 potentially provides a veritable archaeological laboratory for exploring methodological issues relating to the 14C dating of early Neolithic sites within arid and eroding environments.
Acknowledgements
Awards from the British Academy, Arts and Humanities Research Board, and the Council for British Research in the Levant funded the 1997–2003 excavations at WF16 and the post-excavation analyses. The 2008–2010 excavations were funded by the Arts and Humanities Research Council (AH/E006205/1) and the Wenner Gren Foundation, and supported by the Council for British Research in the Levant and the University of Reading.


 Open access