

In South Africa, the prevalence of hypertension in the adult black population is 24·4 %. Diagnosis and management of the condition in this group is particularly poor(Reference Steyn, Gaziano, Bradshaw, Laubscher and Fourie1–Reference Seedat5). The daily salt intake (7·8 g) in this group(Reference Charlton, Steyn, Levitt, Zulu, Jonathan, Veldman and Nel6) exceeds the recommended maximum of 6 g/d(7) while K intake is low (between 50 and 60 mmol/d)(Reference Charlton, Steyn, Levitt, Zulu, Jonathan, Veldman and Nel8, Reference Matlou, Isles, Higgs, Milne, Murray, Schultz and Starke9) and falls far below the intake that would be required to keep the Na:K ratio close to one, as recommended by the WHO(10). Furthermore, low habitual dietary intakes have been reported for Ca and Mg(Reference Vorster, Oosthuizen, Jerling, Veldman and Burger11). These data indicate a need for population-based approaches to change dietary behaviour for the prevention and management of hypertension.
The DASH trial provided evidence that a dietary pattern that is rich in fruit, vegetables and low-fat dairy products can reduce blood pressure (BP) significantly(Reference Appel, Moore and Obarzanek12). The follow-up DASH-Sodium study demonstrated additional BP-lowering benefits of salt restriction over and above the merits of the DASH diet(Reference Sacks, Svetky and Vollmer13).
In the South African context, promotion of the DASH eating plan is unrealistic due to high levels of food insecurity among the poor(Reference Charlton and Rose14) and the very low intake of fruit, vegetables and dairy products(Reference Steyn, Bradshaw, Norman, Joubert, Schneider and Steyn15). Identification of an affordable, sustainable and culturally acceptable dietary pattern is paramount to compliance in this group. It has been proposed that the way to lower salt intake on a population level is through the reduction of the Na content of processed foods(Reference Greenfield, Smith, Maples and Wills16, Reference Williams, McMahon and Boustead17). Bread is a staple but also provides the highest proportion (41–73 %) of non-discretionary Na in the diets of black South Africans(Reference Charlton, Steyn, Levitt, Zulu, Jonathan, Veldman and Nel8), thus is an obvious target. We hypothesise that a moderate reduction in Na intake, in the presence of an increased intake of K, Mg and Ca in commonly consumed foods, will reduce BP significantly in black South Africans with hypertension.
Subjects and methods
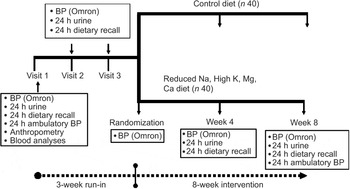
We conducted a randomised, double-blind, controlled trial to investigate the impact of an 8-week feeding study (in which Na intake is decreased, and K, Mg and Ca intake is increased) on BP in mild-to-moderate hypertensive black South Africans (Fig. 1). The participants were black residents of a Cape Town township (Langa), aged 50–75 years, with drug-treated mild-to-moderate hypertension (systolic BP ≤ 160 mmHg and diastolic BP ≤ 95 mmHg) were eligible. Exclusion criteria included taking two or more diuretics; taking furosemide for cardiac failure; cerebral infarction or haemorrhage; renal impairment (serum creatinine > 114·4 μmol/l or creatinine clearance < 50 ml/min (Cockroft–Gault equation)(Reference Cockcroft and Gault18)), three or more alcoholic drinks per day; type 1 diabetes mellitus; impaired cognitive function(Reference Broderick19, Reference Brooke and Bullock20); incontinence; and BMI > 45 kg/m2. Subjects with severely uncontrolled hypertension (i.e. >160/95 mmHg) were excluded. Those with uncontrolled diabetes and/or hypertension were referred to health-care providers during the run-in period.
Scheme of study design (BP, blood pressure)
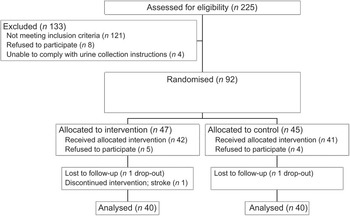
Sample size calculations used the nQuery Advisor 5·0 program. Assuming a reduction in systolic BP of 6·3 mmHg,(Reference Midgely, Matthew, Greenwoood and Logan21) an sd of 10 mmHg, and a two group t-test with a 0·050 two-sided significance level and 80 % power, a sample size of forty-one subjects per arm (n 82 in total) was required. The study was undertaken in two phases (May–December 2004 and January–July 2005). Recruitment and enrolment took place at a church-based setting and a community health centre, and advertisements were placed in the local community newspaper. Eligible subjects who completed a 3-week run-in period were randomised (Fig. 2).
Recruitment and screening of subjects
In an industry–academia partnership, the Na content and K, Mg and Ca content were modified in five commonly consumed food items: brown bread, margarine, stock cubes, soup mixes and Aromat (monosodium glutamate-based flavour enhancer)(Reference Charlton, MacGregor, Vorster, Levitt and Steyn22). The intervention comprised these modified foods plus a salt replacement (Solo™) and 500 ml of maas (fermented milk commonly eaten) daily. The control diet provided the same foods but of standard commercial composition, as well as artificially sweetened cold drink instead of maas. The subjects rated the palatability of trial foods using a 5-point Likert scale rating(Reference Drewnowski, Ahlstrom Henderson, Driscoll and Rolls23).
Subjects were instructed to consume their usual amounts of food(Reference Charlton, Steyn, Levitt, Zulu, Jonathan, Veldman and Nel8) and sufficient food was provided for the whole family. Based on laboratory-determined chemical food analyses, compared to control foods, the intervention foods were planned to provide 41 % less Na (100·3 v. 170·3 mmol/d), 826 % more K (70·9 v. 8·6 mmol/d), 388 % more Ca (857 v. 221 mg/d) and 368 % more Mg (13·8 v. 3·7 mmol/d).
Both study participants and fieldworkers were blinded to diet group allocation of subjects. A single dietitian was responsible for food-packing and all food was locked and sealed in large shopping bags, labelled only with participants’ names and contact details. A driver delivered the food three times a week.
Clinical measurements and biological samples were taken and questionnaires administered by trained fieldworkers in either Xhosa or English before, during and after the intervention at the time points, as shown in Fig. 1. Height was recorded using a stadiometer and weight recorded on a calibrated scale, to the nearest 100 g. BMI was calculated as weight (kg)/(height (m))2. Body fat was measured using a standard tetrapolar 50 kHz bioimpedance monitor (Bodystat™), with the subject lying supine. The prediction equations include body weight, height, age and gender.
Urinary and fasting blood parameters were analysed by National Health Laboratories Institute, based at Groote Schuur Hospital, using standard methods and quality control procedures. Completeness of 24 h urine collection was assessed as at least 500 ml volume and a urinary creatinine value ≥0·18 mmol/kg lean body mass/d for men or ≥0·12 mmol/kg lean body mass/d for women(Reference Laposta24). Urinary analyses included Na, K, Mg, Ca and creatinine.
A questionnaire included sociodemographic data, medical history and self-perceived health status using an adapted EQ-5D instrument(Reference Jelsma, Mkoka, Amosun and Nieuwveldt25). Subjects were asked to bring all prescribed medications for recording by trained nurses. Subjects completed interviewer-administered 24 h dietary recalls(Reference Gibson26) using the South African validated Dietary Assessment Education Kit(Reference Steyn and Senekal27) to quantify food portion sizes. Recorded foods were converted to gram weights and daily nutrient intake using the Medical Research Council (MRC) Food Quantities Manual(Reference Langenhoven, Conradie, Wolmarans and Faber28) and Foodfinder III computerised dietary assessment program based on national food tables(Reference Langenhoven, Kruger, Gouws and Faber29). Dietary compliance was monitored using data from 24 h recalls and 24 h urinary electrolyte concentrations, and returned salt and Aromat shakers were weighed weekly. Physical activity levels were measured using the Yale Physical Activity Survey instrument(Reference Dipietro, Caspersen, Ostfield and Nadel30).
The primary outcome variable was resting office BP, measured according to the American Heart Association Recommendations for BP Determination(Reference Perloff, Grim and Flack31), using a validated automated method with pre-set inflation(Reference Altunkan, Ilman, Kayatürk and Altunkan32) (Omron M4-I BP monitor; Omron Matsusaka Co., Ltd, Japan). A large cuff was used for arm circumferences ≥33 cm. BP was measured three times on each occasion and an average of the second and third measurements taken for analyses. BP was measured weekly four times before the initiation of the intervention and the mean taken as baseline BP (‘Pre’). Thereafter, BP was measured on two occasions each at weeks 4 and 8.
In addition, average 24 h ambulatory systolic and diastolic BP and awake and asleep BP were measured at baseline and during the final week of the intervention, using an Oscar 2 (SunTech Medical) Ambulatory Blood Pressure Monitor (ABPM), which has been validated and endorsed by the British Hypertension Association as being reliable for use in clinical trials(Reference Goodwin, Bilous, Winship, Finn and Jones33).
The Research and Ethics Committee of the University of Cape Town approved the study protocol. The trial was registered with the South African Department of Health National Research Register (DOH-27-0806-1394). Written informed consent was obtained from all participants who were closely monitored for adverse effects.
Intention-to-treat analyses were performed. For analysis of office (Omron) BP, linear regression was performed to assess the intervention effect at weeks 4 and 8. The model had indicators for diet group, phase, time and interaction effects for testing the consistency of the intervention effect over the two phases and the expected differential change in BP over time in the two diets. The analysis accounted for the repeated nature of the BP measurements within each subject by using the generalised estimation equation (GEE) approach. From this model, a contrast in Omron BP measurements for the change from baseline to the intervention period between the diet groups was estimated. Using a method described by Rochan (1995)(Reference Rochan34) to adjust for a covariate which is observed post-randomisation, a seemingly unrelated regression analysis was used to model the BP outcomes and change to anti-hypertensive medication (yes or no response) on diet group and phase. The SUR program of STATA was used for this analysis.
For analysis of 24 h ABPM, multivariate linear regression was used to assess the intervention effect. The vector of 24 h ABPM measurements (systolic and diastolic BP for average, wake, sleep and mean arterial pressure (MAP)) obtained at the end of the intervention period was modelled on indicator variables for diet and phase as well as the baseline values of average 24 h systolic and diastolic BP and 24 h MAP. The intervention effect with 95 % CI was estimated for the pooled data. Regression analyses were also conducted using the SUR model in order to account for medication change as a post-randomisation covariate.
Change in other variables between baseline and post-intervention was assessed using paired t-tests within diet groups. Between-diet group differences were investigated using independent t-tests. Multivariate linear regression modelling for change in systolic and diastolic BP included the following variables in the model: change in 24 h urinary excretion of Na, K, Mg and Ca; diet group; and the interaction effects of diet and urinary cation changes.
Results
During the intervention, one subject each in the intervention and control groups dropped out and one intervention group participant had a stroke, leaving eighty subjects (n 40 per diet group; Fig. 2). Baseline sociodemographic characteristics, BP and lifestyle factors associated with BP control are shown in Table 1. Mean age was 61·7 (sd 7·9) years and the control group was on average 5 kg heavier than the intervention group.
Baseline sociodemographic characteristics of the sample, lifestyle factors associated with hypertension control and self-perceived health status
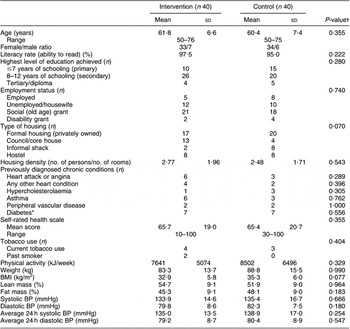
BP, blood pressure.
*Data obtained from medication history during run-in period, plus one newly diagnosed diabetic in low salt group of phase 1.
†Independent t-test for difference between groups; Fisher’s exact test for categorical data.
The average number of prescribed anti-hypertensive medications was 2·1 (sd 0·9) with the most common medication being low-dose thiazide diuretics (76·2 % participants), followed by ACE inhibitors (55·0 %). Thirty per cent were on monotherapy.
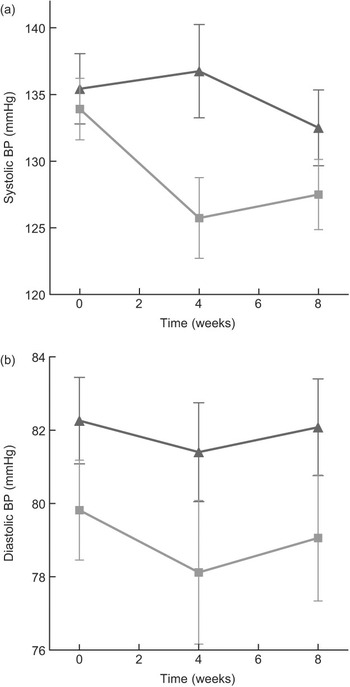
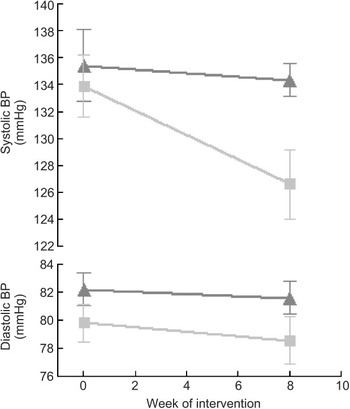
Compared to mean Omron BP at baseline, mean values estimated at weeks 4 and 8 are shown in Fig. 3. The figure demonstrates that most of the intervention effect had already occurred within the first 4 weeks of the intervention. No significant difference was found in change from baseline between weeks 4 and 8 for both systolic and diastolic BP (results not shown). The average BP of weeks 4 and 8 (‘Post’) is shown in Fig. 4. The estimated intervention effects, which included diet and phase in the regression modelling, are shown in Table 2. Mean post-intervention Omron systolic BP in the intervention group was 6·2 mmHg (P = 0·021) lower than in the control group with no significant between-group difference in diastolic BP. For ABPM the significant reduction in average (4·5 mmHg) and wake (5·1 mmHg) systolic BP was also due to the intervention.
(a) Mean systolic blood pressure (BP) (Omron) at baseline (week 0), week 4 and week 8 of intervention, according to diet group allocation (error bars reflect sem). (b) Mean diastolic BP (Omron) at baseline (week 0), week 4 and week 8 of intervention, according to diet group allocation (error bars reflect sem) (![]() , control;
, control; ![]() , low salt)
, low salt)
Mean systolic and diastolic blood pressure (BP) at pre (baseline) and post (mean of week 4 and week 8 measurements), according to diet group allocation (error bars reflect sem) (![]() , control;
, control; ![]() , low salt)
, low salt)
Estimated intervention effects for office BP and 24 h ABPM
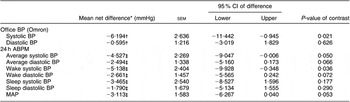
BP, blood pressure; ABPM, ambulatory blood pressure monitor; MAP, mean arterial pressure.
*Low-salt−control.
†Contrast between groups of pre to post changes. Pre = mean of run-in visits (1, 2, 3) and visit 4 (day 1 of intervention); post = mean of week 4 and week 8 measurements.
‡Contrast between groups at week 8 adjusted for baseline covariates.
The SUR modelling, which adjusted for medication change (yes or no), provided similar results but found a mean between-group change in systolic BP from baseline to post-intervention of −6·43 mmHg (95 % CI −11·2, −1·7; P = 0·008) and a non-significant change in diastolic BP of −0·988 mmHg (95 % CI −3·23, 1·47; P = 0·464). For 24 h BP, diet-related reductions in average systolic and diastolic BP were both significant (P < 0·05) at −4·91 mmHg (95 % CI −9·2, −0·7) and −2·65 mmHg (95 % CI −5·13, −0·17), respectively. Change in systolic BP during waking hours was the 24 h BP parameter found to have the greatest reduction associated with the intervention effect (mean = −5·59 (sem = 2·31) mmHg; P = 0·015).
Twenty-two subjects (n 13 (intervention); n 9 (control)) had a change in anti-hypertensive medication during the trial. No significant difference in the profile of medication change (i.e. medications added (n 11); removed (n 6); combination of both (n 5); or no change (n 58)) was found between diet groups (Fisher’s exact test; P = 0·095). At baseline, there was no difference in systolic BP between those who had no change to their anti-hypertensive medication during the trial (n 58) and those who did have medication changes (n 22) (133·8 (sd 16·8) v. 137·0 (sd 11·9) mmHg, respectively; P = 0·2105). Similarly, there was no baseline difference in 24 h systolic BP between groups that had medication changes compared to those that did not (135·6 (sd 15·6) v. 140·4 (sd 3·1) mmHg, respectively; P = 0·1061). Results for diastolic BP were similar.
There were no baseline differences in reported food intake patterns between the two groups. During the intervention, in both groups reported energy and carbohydrate intake increased significantly but reported protein, fat and cholesterol intake remained unchanged. Reported dietary Na intake increased in the control group, but was unchanged in the intervention group (Table 3). Reported K, Ca and Mg intake significantly increased in the intervention group, but not in the control group. A significant between-group difference was found for change in intake between intervention and baseline for Na, K, Ca and Mg. Mean difference in Na/4200 kJ was a reduction of −104 (sd 418) mg/4200 kJ for the intervention group and an increase of 558 (sd 1058) mg/4200 kJ for the control group, yielding a net between-diet difference of −661 (sd 805) mg/4200 kJ (P = 0·0006). The significant mean increase of dietary Ca intake of 310 mg/d in the intervention compared to the control group was explained by a reported increased intake of maas from 33 g/d at baseline to 275 g/d in the intervention group.
Reported daily dietary intake at baseline and during the intervention, according to diet group (values are in mean and sd)
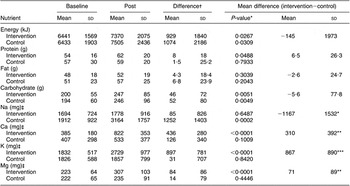
Baseline = average of visits 1, 2 and 3 during run-in; Post = average of weeks 4 and 8.
*P < 0·01; **P < 0·001; ***P < 0·0001 for differences between diet groups.
†Difference = Post−Baseline.
‡For conversion to mmol/d, divide by following factors: 23 (Na); 40 (Ca); 39 (K); 24 (Mg).
There were no between-group differences for the household quantity of either salt or Aromat used during the trial. The low-salt margarine (87·5 %) and the salt replacement (75 %) were reported to taste less acceptable than the normal products; however, other intervention food items were preferred to the regular consumed varieties. The control group reported that they preferred all of the food items provided, despite the fact that the foods were unaltered in cation content.
The 24 h urinary excretion data found that there was a trend for a reduced Na excretion in the intervention group, but this was not significantly lower than that of the control group (Table 4). Significant between-group differences after the intervention were found for urinary K and Mg excretion with no change in urinary Ca excretion.
Mean and sd 24 h urinary excretion of Na, K, Mg and Ca (mmol/d)
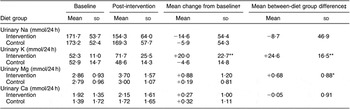
Baseline = Average of run-in visits 1,2,3; Post = average of weeks 4 and 8.
*P < 0·05; **P < 0·001.
†Baseline minus Post.
‡Intervention diet minus Control.
No change between baseline and end of intervention was found for weight, BMI, % body fat, self-perceived health status score or physical activity in either the groups.
Discussion
This study demonstrates a public health intervention that can achieve a clinically significant reduction in systolic BP in moderately hypertensive subjects on treatment living in a low-income community setting in South Africa through the dietary manipulation of seven commonly consumed processed foods. The study also illustrates that this will require partnerships between public health agencies and the food industry.
An important difference between the design of our study and that of other food-based BP trials(Reference Appel, Moore and Obarzanek12, Reference Sacks, Svetky and Vollmer13, Reference Miller, Erlinger and Young35, 36) is that we did not attempt to alter habitual food patterns, in either quantity or quality.
The BP-lowering effect we found for systolic BP was similar to or higher than responses reported in meta-analyses of randomised trials of either Na reduction (n 40 trials) or K supplementation (n 27 trials)(Reference Geleijnse, Witteman, Bak, den Breeijen and Grobben37). Our results are also similar to the findings of a 24-week randomised trial in 55–75-year-old untreated Dutch hypertensives in which the same salt replacement product was used(Reference Geleijnse, Kok and Grobbee38). The DASH 8-week feeding study, however, demonstrated a much greater BP reduction (−13·2/−6·1 mmHg) in the subgroup analyses for African-Americans with hypertension(Reference Sacks, Svetky and Vollmer13). All food and beverages were provided in the DASH study and subjects consumed one supervised meal a day at the research centre, thus enhancing compliance. In trials such as PREMIER(36), where patients are required to follow the DASH diet while purchasing their own food, the recommended number of daily servings of fruit and vegetables could not be met. Few food-based trials have been conducted in developing countries. A randomised 8-week crossover study of low-salt and high-salt intakes conducted in Jamaica and Nigeria demonstrated a mean between-diet change in systolic BP of approximately 5 mmHg in both country sites(Reference Forester, Adeyamo and Soarres-Wynter39). In the Nigerian site, participants were able to achieve substantial Na reductions by simply not adding salt during meal preparation.
The dietary intervention achieved an overall increase in K, Mg and Ca but surprisingly without a substantial decrease in the Na content of the diet, at least according to the urinary excretion results. The intervention diet was calculated to provide a decrease in dietary Na intake of 70 mmol/d, compared to the control diet (41 % reduction). The 24 h dietary recall data found a significant increase in energy and carbohydrate intake in both diet and control groups, explained by increased bread consumption in both groups during the trial. It appears that the increased bread intake displaced other staple foods, notably maize meal, to which large quantities of salt are generally added (de Goede J, van der Meij B (2001) Risk factors of obesity in black, female Community Health Workers living in an urban area in South Africa. M.Sc. Dissertation. Wageningen UR, unpublished).
The discrepancies between the urinary excretion and dietary intake data may be related to methodological difficulties associated with the collection of both these variables. The dietary data found a significant between-group reported difference in Na intake of 51 mmol/d, and this difference remained even after controlling for an increased energy intake during the intervention.
It was not the purpose of this study, nor was it powered, to determine the contribution of each dietary manipulation (i.e. decreased Na and increased K, Mg and Ca) to BP reduction, but rather to demonstrate effectiveness of a practical composite dietary approach that could be of public health significance in the target population. However, regression modelling suggests that increased urinary K excretion contributed most to the BP-lowering impact of the intervention (data not shown).
Dairy foods are an important component of the DASH diet(Reference Appel, Moore and Obarzanek12) and Ca supplementation is associated with a modest reduction in BP (average of −1·86/−0·99 mmHg) with a slightly higher reduction in people with Ca intakes below 800 mg/d (−2·63/−1·30 mmHg)(Reference van Mierlo, Arends, Streppel, Zeegers, Kok, Grobbee and Geleijnse40). In the present study, participants in the intervention group did not manage to consume the recommended additional 500 g of maas (fermented milk)/d that was provided and reported about half of this intake, presumably because it was shared with other household members. It is recommended that further dietary BP studies be conducted in populations with habitually low-Ca intakes, to compare the BP-lowering effect of an increased intake of dairy foods as compared to other strategies such as Na reduction.
In effect, our trial simulated the high-Na arm (150 mmol Na/d) of the DASH-Sodium trial(Reference Steyn, Bradshaw, Norman, Joubert, Schneider and Steyn15). Urinary K excretion of subjects in the low-salt arm increased during the trial to similar levels as described for subjects following the DASH diet in both the original DASH study (74·5 mmol/d) and the follow-up DASH-Sodium study (75·0 mmol/d). Urinary Mg levels rose to similar concentrations (4·03 mmol/d), but urinary Ca was considerably lower than DASH study participants (3·64 mmol). We achieved similar BP reductions between diet-control groups as those reported in participants in the high-Na arm of the DASH-Sodium study. Thus, simply by changing the cation content of five commonly eaten foods, providing a salt replacement, and the daily addition of a fermented milk drink, the effects of the DASH diet can be achieved in South African black treated hypertensive subjects who consume a high salt intake.
On a population level, it is estimated that the BP-lowering effect of this dietary intervention would result in a 20 % reduction in the number of deaths attributed to high BP, preventing more than 9000 deaths in one year (Rosana Norman, personal communication, based on secondary analysis of the South African Demographic and Health Survey data(41) to estimate the disease burden attributable to high BP in South Africa for the year 2000(Reference Norman, Gaziano, Laubscher, Steyn and Bradshaw42)).
A limitation of the study is that the intervention effect was calculated using the mean of four repeated measurements for the baseline measure and the mean of only two repeated measurements (week 4 and week 8) as the ‘post’ BP measure. The large variability in BP change far exceeded that reported in the DASH study(Reference Vollmer, Appel and Svetkey43).
The study aimed to demonstrate effectiveness of a community-based dietary intervention, rather than its efficacy; therefore, only treated hypertensives were included in the study. We considered it to be unethical to ask participants to stop their anti-hypertensive medication for almost 6 months since the target population is known to be at high risk of cerebrovascular disease. It is logistically not feasible to recruit a sample of untreated hypertensives in the South African context and in reality most hypertensive patients will be taking anti-hypertensive medication when they start making dietary changes to further improve their BP control. In line with the national guidelines for the management of hypertension in the primary health-care setting that recommend diuretic agents as the first-line drug for all patients with hypertension(44, Reference Opie and Steyn45), 86 % of participants were being prescribed diuretics with thiazide-type diuretics, the cheapest anti-hypertensive agent available, being the most commonly used agent. Individuals who were taking more than one diuretic were excluded as this is considered to be inappropriate management, based on national and international therapeutic guidelines. Our inclusion strategy is in line with international drug trials in hypertension that currently enter patients already on multiple anti-hypertensive drugs, such as the VALUE Trial(Reference Weber, Julius and Kjeldsen46).
The change in BP medication during the trial was similar between the intervention and control groups and did not impact on the study outcomes. The reported results provide pragmatic estimates of the effect of the intervention in general, including the effect over time (the study was conducted in two phases) and the effect over all medication adjustments. The important message from this trial conducted in a low-income community setting is that, regardless of medication change, changes in diet can have beneficial outcomes for systolic BP.
Generalisability of the results warrants consideration. To facilitate the practical delivery of the foods, participants were recruited from only one geographical area, Langa, one of the oldest and more established peri-urban townships of Cape Town, which has an estimated population of 46 505, mostly Xhosa-speaking Africans(47). Good BP control is rarely achieved in this high-risk group which may be attributed to socio-economic factors, such as failure to return to health-care centres for follow-up visits due to transport costs and time involved, patients’ lack of knowledge of the disease and its outcomes, and poor service delivery at primary health-care level in South Africa(Reference Hale, Fritz and Eales48, Reference Daniels, Biesma, Otten, Levitt, Steyn, Martell and Dick49). Extrapolation of the findings to the normotensive population and to those with severe hypertension cannot be assumed. Similarly, the inclusion of mostly obese women, and few men, limits the generalisability of the results to other sectors of the target population. Further, the relatively short duration of the trial (8 weeks) raises questions regarding compliance with the dietary changes over the longer term.
Conclusion
This randomised controlled trial provides evidence that manipulation of the Na, K and Mg content of commonly consumed processed foods, together with the provision of a salt replacement and daily consumption of 500 ml fermented milk, lowers BP in free-living, black South Africans with moderate hypertension who were using medication. The South African food industry needs to be lobbied by consumers, the Department of Health and other health agencies to lower the Na content of their products (preferably while concurrently increasing K), particularly in staple foods such as bread, in order to lower BP.
Acknowledgements
Sources of funding: This study was funded by a doctoral fellowship provided by Unilever South Africa Foods and by additional financial support from Sasko Bakeries (Division of Pioneer Foods, South Africa) and research grants provided by the South African MRC, the Circulatory Diseases Research Fund, the South African Hypertension Society and the THRIP initiative of the National Research Foundation. The experimental bread was developed and provided free-of-charge by Sasko Bakeries. Unilever South Africa provided, free-of-charge, the control and intervention margarine, stock cubes, soup mixes and Aromat. SOLO™ salt replacement was donated by the Low Sodium Sea Salt Co. Ltd. (UK). The study funders had no role in the study design, nor in the collection, analysis or interpretation of the data.
Conflict of interests: There are no conflicts of interests.
Authorship contributions: K.E.C., the principal investigator, was responsible for conceptualisation and design of the study, participated in the collection, analysis and interpretation of the data and was overall responsible for writing the paper. K.S. and N.S.L. participated in the conceptualisation and design of the study, and in the collection, analysis and interpretation of the data. N.P. supervised the fieldwork and data collection and collected the ABPM measurements. K.R. packed the food items and performed dietary analyses, data coding and data entry. T.G. and D.J. were responsible for participant recruitment, fieldwork planning and data collection. N.G. participated in statistical analysis of the data. C.J.L. performed sample size calculations, randomisation of participants, and was responsible for the primary statistical data analysis.
Acknowledgements: Ms Ria Laubscher is thanked for the dietary analyses and Ms Jean Fourie for typesetting the questionnaires.


