

Inulin-type fructans are naturally occurring oligosaccharides found in many plants, such as onion, garlic, leek, artichoke, asparagus and chicory (Cichorium intybus)(Reference Van Loo, Coussement, De Leenheer, Hoebregs and Smits1, Reference Roberfroid2). Inulin has a degree of polymerisation from 2 to 60+, whereas oligofructose is produced by partial enzymic hydrolysis of the inulin chains and has a degree of polymerisation 3 to 8. Inulin-type fructans are built up of fructose monomers linked by β-2-1 bonds, making these compounds indigestible in the upper gastrointestinal tract(Reference Coudray, Bellanger, Castiglia-Delavaud, Remesy, Vermorel and Rayssignuir3). Consequently, inulin and oligofructose enter the lower part of the intestine intact, where they are selectively fermented by the endogenous bacterial flora to SCFA, lactic acid and gases. Selective fermentation by the bacterial flora is a prerequisite for being a prebiotic. Prebiotics are non-digestible food ingredients that improve host health by selectively stimulating the growth and/or activity of one or a limited number of bacteria in the colon(Reference Gibson and Roberfroid4). Numerous studies in human subjects have demonstrated that inulin and oligofructose intake increases the numbers of bifidobacteria and lactobacilli in the large intestine, and that these bacteria are associated with health(Reference Gibson and Roberfroid4–Reference Tuohy, Finlay, Wynne and Gibson6). Such associated health benefits upon inulin and oligofructose intake are an improvement in mineral absorption and bone mineralisation(Reference Delzenne, Aertssens, Verplaetse, Roccaro and Roberfroid7–Reference Abrams, Griffin, Hawthorne, Liang, Gunn, Darlington and Ellis11), modulation of lipid metabolism(Reference Delzenne and Kok12–Reference Pereira and Gibson16), immune-modulating activity(Reference Watzl, Girrbach and Roller17) and a reduction in cancer risk, mainly of the colon(Reference Roller, Pietro Femia, Caderni, Rechkemmer and Watzl18–Reference Rafter, Bennett and Caderni20).
The aim of the present study was to investigate the effects of lifelong intervention with an oligofructose-enriched inulin (10 % of Synergy1) in male and female rats on the ageing process and lifespan. Biological measures were performed every 6 months. To our knowledge, the present study is the first to report the effects of lifelong supplementation with an inulin-type fructan.
Materials and methods
Animals
The study was carried out using sixty male and sixty female Sprague–Dawley rats (Charles River Laboratories, 69 St-Germain sur l'Arbresle, France), weighing 250–275 g (3 months old) at their arrival at ETAP Research Centre. Nine rats per group were used for anatomopathological analyses (three at 12, 18 and 24 months) and twelve other rats for biological sampling. At the end of the experiment, most of the rats had died, so the number of rats was less than twelve per group.
Diets
Standard food pellets (energy value 12·30 kJ/g) (M20 food pellets; Dietex, 95 Saint Gratien, France) were used to feed the rats. This diet contained 3·2 % fat, 18·0 % protein, 3·9 % fibre, 57·5 % total carbohydrates, 6·8 % ash and 10·0 % moisture. To prepare the test diet (energy value 12·01 kJ/g), 10 % of an oligofructose-enriched inulin (Orafti™ Synergy1; BENEO-Orafti N.V., Tienen, Belgium) was incorporated into the M20 pellets. Synergy1 is obtained from chicory root and is a selected combination of 90–94 % of long inulin chains and shorter oligofructose chains (1:1) and 6–10 % of mono- and disaccharides (glucose, fructose and sucrose). Diets were administered to rats from the age of 3 months and for the whole experiment.
Housing conditions
On receipt, the 3-month-old rats were housed, three rats per cage, in polycarbonate cages measuring 48 × 27 × 20 cm (U.A.R., 91 Epinay-Sur-Orge, France) in a regular environment (temperature 22 ± 1°C; humidity 50 ± 5 %) with an inverted light–dark cycle (lights on from 20.00 to 08.00 hours). Rats were allowed free access to tap water and their specific diets during the whole experiment. After an acclimatisation period of 7 d which started at the day of arrival, rats were enumerated by marking the tails using indelible markers and male and female rats were weighed and randomly assigned to one of the four groups (thirty rats per group): male control (Cont-M) group, male Synergy1 (SYN1-M) group, female control (Cont-F) group and female Synergy1 (SYN1-F) group. The present study was performed according to the guidelines of the Association for the Study of Animal Behaviour Ethical Committee for the use of animals in research(21) and the Canadian Council on Animal Care(Reference Olfert, Cross and McWilliam22, Reference Olfert, Cross and McWilliam23), and procedures were in agreement with the European Communities Council Directive of 24 November 1986 (86/609/EEC)(24).
Experimental procedures: animals' stimulation programme
Throughout the whole experiment, animals were placed once per week for 2 h in a training environment with large cages, with several floors, provided with scales, tunnels, footbridges and comprising various objects; in dry or water open-fields for encouraging locomotor and exploratory activities and on rotarods for physical locomotor training. Training environments were modified every month to keep environmental stimulation and avoid any habituation of the animals to situations with repetitive spatial configurations. Rats were also allowed to have sexual activity every 6 months, putting the male rats together with 3-month-old sexually receptive females and females with castrated males for a period of 2 h.
Applying such a training programme during the whole experiment allows rats to age gracefully (harmoniously) and to avoid any disadvantages that occur when breeding in restricted cages due to the lack of social and environmental stimulations which is accompanied by physical, neurological, physiological, psychological and cognitive impairments.
Morphological and biological markers
Body weight and food intake
All animals in each group were weighed every 15 d. Food intake was evaluated on four successive days every 4–6 weeks.
Body composition
Evaluation of body composition was carried out at 12, 18 and 24 months of age using the non-invasive method of electric conductivity(Reference Cunningham, Molnar, Meara and Bode25, Reference Unangst and Merkley26).
Lipid status and basal glycaemia
At the ages of 12, 18 and 24 months, fasting (12 h fasting period) blood (300 μl) samples (twelve rats per group) were taken to assess cholesterol (total cholesterol and HDL), triacylglycerolaemia levels and glycaemia. Cholesterol and triacylglycerolaemia levels were determined using classical laboratory procedures(27).
Basal glycaemia was determined using a reflexion photometer Glucotrend2 (Roche Diagnostics GmbH, Mannheim, Germany) and reactive ‘Accu Chek Active Glucose’ strips (Roche Diagnostics, Meylan, France). One drop of blood was sampled from the extremity of the tail and the glucose analysis was immediately carried out using the Glucotrend2 apparatus. A chip of calibration inserted in the apparatus before use and two control solutions of glucose (Accu-Chek Active Control; Roche Diagnostics, Meylan, France) were used.
Lifespan and anatomopathological analyses
At 12, 18 and 24 months of age, three rats per group (one cage randomly chosen, excluding the four cages kept for biological sampling) were anaesthetised with intraperitoneal injections of acepromazine (Calmivet; Vetoquinol, Lure, France) at the dose of 2 mg/kg and ketamine (Ketamine 1000; Virbac, Carros, France) at the dose of 50 mg/kg. Histological samples were taken: prostate, bladder, seminal vesicles, ovaries, distal part of the colon and brain. Macroscopic and microscopic observations identified the oncological state of the organs. Histological samples were fixed in 10 % formol solution at pH 7·4 during 12 h and were then included in paraffin according to Sainte-Marie(Reference Sainte-Marie28). According to the recommendations of the United Kingdom Coordinating Committee on Cancer Research(29) on ethics, when the body weight (BW) of an animal decreased by more than 25 % or when the animal showed a tumour which size represented more than 10 % of its BW, euthanasia was carried out. The day of euthanasia was considered as the natural day of death of rats to avoid suffering(Reference Daubioul, Taper, De Wispelaere and Delzenne30). Throughout the experiment, the date of natural death of each rat was noted in order to determine the mean lifespan of each rat.
Statistical analysis
Student's t test and the Mann–Whitney U test were used to compare data between males and between females of test v. control groups. The χ2 test was used to determine lifespan of male and female rats of the four groups. The results are expressed as mean values with their standard errors. Differences are considered to be significant at the level of P < 0·05. All statistical analyses were carried out using the StatView® 5 statistical package (SAS Institute, Inc., Cary, NC, USA).
Results
Morphological and biological markers
The number of rats per group at each time and for each morphological and biological marker is reported in the figures. At 12, 18 or 24 months, the number of rats could be different between the parameters measured because measurements were made within 1 month, some rats dying during this period; the number of rats per group at each time and for each morphological and biological marker is reported in the figures. The biological sampling was done on twelve rats per group and the anatomopathological analyses on three rats per group.
Body-weight evolution
As shown in Fig. 1, the BW of the SYN1-M group was lower compared with that of the Cont-M group during the whole experiment. Significant differences were observed at 6 (t = 2·94; P < 0·01), 9 (t = 2·61; P < 0·05), 12 (t = 2·15; P < 0·05), 21 (t = 2·66; P < 0·05) and 24 months of age (t = 2·56; P < 0·05) and the BW of the SYN1-M group tended to be lower at 15 (t = 1·91; P < 0·10) and 18 months of age (t = 1·87; P < 0·10).
Body-weight evolution in male rats fed a control diet (Cont-M; -○-) or a Synergy1-supplemented diet (SYN1-M; -●-). Values are means, with standard errors represented by vertical bars. Mean value was significantly different from that of the SYN1-M group: *P < 0·05, **P < 0·01 (Student's t test). † Mean value was marginally significantly different from that of the SYN1-M group (P < 0·10; Student's t test).

As shown in Fig. 2, the BW of the SYN1-F group was significantly lower compared with that of the Cont-F group at 6 (t = 2·22; P < 0·05), 9 (t = 3·09; P < 0·01) and 12 months of age (t = 2·23; P < 0·05) and tended to be lower at 15 (t = 1·93; P < 0·10) and 21 months of age (t = 1·81; P < 0·10).
Body-weight evolution in female rats fed a control diet (Cont-F; -○-) or a Synergy1-supplemented diet (SYN1-F; -●-). Values are means, with standard errors represented by vertical bars. Mean value was significantly different from that of the SYN1-F group: *P < 0·05, **P < 0·01 (Student's t test). † Mean value was marginally significantly different from that of the SYN1-F group (P < 0·10; Student's t test).

Food intake
In male rats, food intake (Table 1) was significantly lower at 18 months of age in the SYN1-M group compared with the Cont-M group (U = 17·5, P < 0·05 for g/kg BW and U = 11·0, P < 0·01 for kJ/kg BW). No differences in food intake were observed during the other time points. No differences were observed in food intake in female rats (Table 1), except at 9 months of age when food intake was higher in the SYN1-F group (U = 19·0, P < 0·05 for g/kg BW and U = 28·0, P < 0·10 for kJ/kg BW).
(Mean values with their standard errors)

Cont-M, male control; SYN1-M, male Synergy1; Cont-F, female control; SYN1-F, female Synergy1.
* Mean food intake was significantly different from that of the rats of the same age and sex fed the Synergy1-supplemented diet (P < 0·05; Mann–Whitney U test).
** Mean energy intake was significantly different from that of the rats of the same age and sex fed the Synergy1-supplemented diet (P < 0·01; Mann–Whitney U test).
† Mean energy intake was marginally significantly different from that of the rats of the same age and sex fed the Synergy1-supplemented diet (P < 0·10; Mann–Whitney U test).
Evolution in body composition
In male rats, the fat mass composition of the SYN1-M group was not significantly different than that of the Cont-M group even though the results were lower for the SYN1-M rats at 12 months (11·99 (sem 0·13) % for SYN1-M (n 12) v. 12·40 (sem 0·23) % for Cont-M (n 12); NS), 18 months (13·28 (sem 0·35) % for SYN1-M (n 11) v. 14·11 (sem 0·40) % for Cont-M (n 12); P < 0·10) and 24 months of age (12·93 (sem 0·40) % for SYN1-M (n 11) v. 13·88 (sem 0·48) % for Cont-M (n 12); P < 0·10).
Also for the female rats, a similar trend towards a lower fat mass deposition in the SYN1-F group compared with the Cont-F group was observed at 12 months (12·01 (sem 0·26) % for SYN1-F (n 12) v. 12·45 (sem 0·23) % for Cont-F (n 11); NS), 18 months (10·82 (sem 0·43) % for SYN1-F (n 12) v. 11·77 (sem 0·37) % for Cont-F (n 10); NS) and 24 months of age (10·64 (sem 0·46) % for SYN1-F (n 12) v. 12·30 (sem 0·70) % for Cont-F (n 9); P < 0·10).
Triacylglycerolaemia, cholesterol and glucose levels
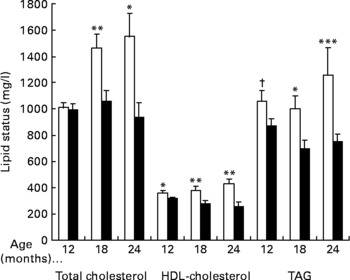
As shown in Fig. 3, in the male rats, total cholesterol levels were similar between both groups at 12 months of age and levels were significantly lower in the SYN1-M group after 18 and 24 months of age (P < 0·01 and P < 0·05, respectively). With respect to the isolated cholesterol fractions, HDL-cholesterol levels were significantly lower in the SYN1-M than in the Cont-M group (P < 0·05, P < 0·01 and P < 0·01 at 12, 18 and 24 months, respectively). Triacylglycerolaemia levels (Fig. 3) were lower in the SYN1-M group compared with in the Cont-M group during the whole intervention and differences were significant at 18 and 24 months of age (P < 0·05 and P < 0·005, respectively).
Lipid status in male rats fed a control diet (Cont-M; □) or a Synergy1-supplemented diet (SYN1-M; ■). At 12 and 18 months there were twelve rats in each group; at 24 months there were six rats in the Cont-M group and eight rats in the SYN1-M group. Values are means, with standard errors represented by vertical bars. Mean value was significantly different from that of the SYN1-M group: *P < 0·05, **P < 0·01, ***P < 0·005 (Student's t test or Mann–Whitney U test). † Mean value was marginally significantly different from that of the SYN1-M group (P < 0·10; Mann–Whitney U test).
In the female rats (Fig. 4), levels of triacylglycerolaemia were also significantly lower in the SYN1-F group (n 12) compared with the Cont-F group (n 12) at 18 months of age (P < 0·05 for both) whereas no significant differences were found for total or HDL-cholesterol levels.
Lipid status in the female rats fed a control diet (Cont-F; □) or a Synergy1-supplemented diet (SYN1-F; ■). At 12 and 18 months there were twelve rats in each group; at 24 months there were three rats in the Cont-F group and six rats in the SYN1-F group. Values are means, with standard errors represented by vertical bars. * Mean value was significantly different from that of the SYN1-F group (P < 0·05; Student's t test).

Fasting glycaemia levels did not differ between groups at any time point.
Anatomopathological analyses
At 12, 18 and 24 months of age, three rats in each group were euthanised and organs (prostate, bladder, seminal vesicles, ovary, distal part of the colon and brain) were analysed for abnormalities. No specific differences in anatomopathological lesions were detected between the groups. Normally occurring lesions due to the ageing process such as acute prostatitis and mammary adenofribroma were found among the groups.
Physical appearance and lifespan
No significant differences were observed between the causes of death of the rats fed the control or Synergy1 diet. Some of them were found dead in the cage; mostly males that died of both groups were weak and they had lost 25 % of their highest weight. In the Cont-F and SYN1-F groups, females developed mammary fibromas and when the volume of the mass became superior to 10 % of the weight of the rat, they were euthanised. Only one difference was observed: the control rats died earlier than the Synergy1 rats but of the same causes.
Rats of the SYN1-M group showed a fur well-groomed and were in a better condition compared with rats of the Cont-M group at 24 months of age (Fig. 5); they were still interested in their environment. In their home cage, rats of the SYN1-M group continued to be interested by the activity in the animal room (entrance of animal-care individuals, food distribution, etc); rats came in front of their cage in a rearing position and they played with their cage mates. In the stimulation programme they showed curiosity and more activity than the Cont-M group. No difference was observed in the appearance of the Cont-F and SYN-F groups.
Appearance of the male rats fed a control diet (a) or a Synergy1-supplemented diet (b) at 24 months of age.

To determine the lifespan of male and female rats, twenty-one rats in each group were followed. As shown in Fig. 6, the survival rate of rats of the SYN1-M group was significantly higher than that of the rats of the Cont-M group at the age of 18 months (100·0 % in SYN1-M v. 76·2 % in Cont-M, χ2 = 20·06, P < 0·001) and 24 months (81·0 % in SYN1-M v. 52·4 % in Cont-M; χ2 = 14·36; P < 0·001). At 24 months of age, the SYN1-M group was composed of 35·3 % more rats than the Cont-M group.
Survival rate of male rats fed a control diet (Cont-M; □) or a Synergy1-supplemented diet (SYN1-M; ■). *** Survival rate was significantly different from that of the Cont-M group (P < 0·001; χ2 test).

For the female rats, as shown in Fig. 7, the survival rate in the SYN1-F group tended to be higher than in the Cont-F group at 12 months of age (100·0 % in SYN1-F v. 95·2 % in Cont-F; P < 0·06) and differences were significant at 24 months of age (42·9 % in SYN1-F v. 28·6 % in Cont-F; χ2 = 4·28; P < 0·05). At 24 months of age, the SYN1-F group was composed of 33·3 % more rats than the Cont-F group.
Survival rate of female rats fed a control diet (Cont-F; □) or a Synergy1-supplemented diet (SYN1-F; ■). * Survival rate was significantly different from that of the Cont-F group (P < 0·05; χ2 test). † Survival rate was marginally significantly different from that of the Cont-F group (P < 0·10; χ2 test).
Discussion
The study was designed to determine the effects of lifelong supplementation with an oligofructose-enriched inulin (Synergy1) in rats on the onset of age-related physiological and morphological changes (BW, fat mass, blood levels of cholesterol, TAG and glucose) and the prolongation of life. With ageing, the increase in fat-mass storage and excess weight gain accounts for many of the ageing-associated morbidities and mortality. Given the increased prevalence of overweight during adolescence and adulthood, strategies to modulate BW during ageing are important in the prevention of disease and more particularly chronic diseases associated with excess fat storage. The results of the present study show that lifelong administration of Synergy1 to adult rats limits excess BW gain over the lifespan. These results are consistent with previously obtained findings that showed a decrease in BW and fat mass (epididymal fat mass) in rats fed a diet enriched with oligofructose(Reference Daubioul, Taper, De Wispelaere and Delzenne30, Reference Cani, Neyrinck, Maton and Delzenne31). In the present study, Synergy1-supplemented rats (particularly males) had lower cholesterol and TAG levels during the whole intervention. This is in accordance with the findings of Fiordaliso et al. (Reference Fiordaliso, Kok, Desager, Goethals, Deboyser, Roberfroid and Delzenne14), who demonstrated reductions in serum TAG in rats when fed fructo-oligosaccharides. In the same way, it was shown that male rats fed a high-fat diet supplemented with inulin or oligofructose (10 %) had significantly lower serum TAG and phospholipid levels, reduced postprandial triacylglycerolaemia (by 50 %) and lower cholesterolaemia(Reference Delzenne, Daubioul, Neyrinck, Lasa and Taper13). Kok et al. (Reference Kok, Roberfroid, Robert and Delzenne32) also demonstrated that rats fed Synergy1 had lower serum TAG levels through to a reduction in the de novo fatty acid synthesis in the liver. The authors also showed that oligofructose added to a high-fat diet protected rats against an increase of free cholesterol serum level induced by the high-fat diet. In the latter study, oligofructose also decreased serum TAG by enhancing TAG-rich lipoprotein catabolism(Reference Kok, Taper and Delzenne33). Another study in hamsters (fed with high-fat or cholesterol-rich diets) found that inulin lowered blood lipids and that this was due to several mechanisms, including altered hepatic TAG synthesis and VLDL secretion and impaired reabsorption of circulating bile acids(Reference Trautwein, Rieckhoff and Erbersdobler34). Daubioul et al. (Reference Daubioul, Taper, De Wispelaere and Delzenne30, Reference Daubioul, Rousseau, Demeure, Gallez, Taper, Declerck and Delzenne35) showed that growing obese Zucker rats fed with an oligofructose-enriched diet had less BW gain and lower TAG accumulation in the liver. The high propionate concentrations in the portal vein (v. control rats) may explain the lipid-modulating actions of inulin and oligofructose, since propionate is well known to be involved in lipid metabolism. Along with the hypotriacylglycerolaemic effect of inulin and oligofructose, Busserolles et al. (Reference Busserolles, Gueux, Rock, Demigné, Mazur and Rayssiguier36) found a protective effect of oligofructose against oxidation induced by a high-fructose diet. In the latter study, oligofructose supplementation increased the vitamin E:TAG ratio, lowered thiobarbituric acid-reactive substances and reduced heart tissue susceptibility to peroxidation. Additionally, in male apo E-deficient mice, oligofructose-enriched inulin (Synergy1) supplementation lowered atherosclerotic-lesioned areas by 25 % and this was related to the changes in lipid metabolism(Reference Rault-Nania, Gueux, Demougeot, Demigne, Rock and Mazur37). Also, other studies showed the cholesterol-lowering potential of inulin in mice with spontaneous hypercholesterolaemia(Reference Mortensen, Poulsen and Frandsen38) and in Balb/c mice(Reference Chen, Hsiang, Wu and Lin39). It appears that there is not a single biochemical locus through which prebiotics modulate serum, hepatic and whole-body lipid content in animals. The effects observed depend on the pathophysiological and nutritional conditions(Reference Delzenne and Williams40).
Also, in humans with modest hyperlipidaemia, inulin supplementation to the diet significantly lowered total cholesterol and LDL concentrations (v. placebo phase), but no effects on HDL-cholesterol or serum TAG concentrations were seen(Reference Davidson, Synecki, Maki and Drennan15). Canzi et al. (Reference Canzi, Brighenti, Casiraghi, Del Puppo and Ferrari41) observed significant lower TAG and cholesterol concentrations in young male volunteers consuming 9 g inulin per d. In healthy young men, 18 % of inulin in a cereal breakfast for 4 weeks had no effects on BW, faecal and bile acid output or faecal SCFA, whereas plasma total cholesterol and TAG decreased. Changes in blood lipids were negatively correlated with bifidobacteria counts and positively with secondary bile acid excretion. Also, Brighenti et al. (Reference Brighenti, Casiraghi, Canzi and Ferrari42) concluded that inulin has lipid-lowering potential, probably mediated by mechanisms related to its colonic fermentation. The addition of 10 g inulin to the diet of middle-aged men and women for 8 weeks resulted in lower plasma TAG levels, particularly in subjects in whom fasting TAG levels were greater than 1·5 mmol/l(Reference Jackson, Taylor, Clohessy and Williams43). The risk factors for atherosclerosis were also reduced by inulin supplementation in the study of Letexier et al. (Reference Letexier, Diraison and Beylot44) in which men ingested a high-carbohydrate, low-fat diet supplemented with 10 g inulin per d for 3 weeks. Inulin supplementation led to a lower plasma TAG concentration and hepatic lipogenesis(Reference Letexier, Diraison and Beylot44). Oligosaccharides and inulin are almost completely fermented in the human colon, producing SCFA (acetate, propionate, butyrate)(Reference Pomare, Branch and Cummings45). Acetate traverses the liver and enters the peripheral circulation, propionate is extracted by the liver and affects lipid metabolism(Reference Bridges, Anderson, Deakins and Wood46) and butyrate leaves the colon for extraction by the liver(Reference Pomare, Branch and Cummings45). An in vitro fermentation of inulin by bacteria growing in the human large intestine showed an acetate : propionate : butyrate ratio of 72:19:8(Reference Wang and Gibson47). Because soluble dietary fibres such as oligofructose or inulin are extensively fermented in the colon, they also have a potential to increase the bifidobacteria counts of the colon. This elevation in bifidobacteria offers health benefits independent of those normally attributed to fibre-rich foods. Inclusion of soluble dietary fibres in the diet offers benefits not only to the heart, but also to overall health(Reference Anderson and Hanna48).
In the present study, fasting glycaemia was not affected by inulin supplementation, most probably because the glycaemia of the rats was within the normal range. In the studies of Cani et al. (Reference Cani, Neyrinck, Maton and Delzenne31) and Delzenne et al. (Reference Delzenne, Cani, Daubioul and Neyrinck49) oligofructose was found to restore normal glycaemia in diabetic-induced rats.
Interestingly, the present study demonstrated for the first time increased survival rates of both male and female rats after lifelong supplementation with Synergy1. However, the observed anatomopathological lesions were not affected by the type of feeding, and if any abnormalities were presented these were related to the ageing process. The mechanisms underlying this prolongation of life with Synergy1 supplementation remain unclear, but it might be assumed that this is related to the beneficial changes in biomarkers observed in the present study. Inulin-type fructans stimulate health-promoting bacteria in the large intestine, thereby improving digestive health which is vital to maintain overall health and wellbeing. The use of Synergy1 in the diet offers several advantages compared with energy-restricted diets that permit the extension of survival rate: energy-restricted diets have been tested in rodents, usually in post-weaning animals during all their life, and a study in mice showed that mice were hungry during the whole experimental period(Reference Speakman and Hambly50). These conditions are unacceptable and unfeasible in humans. Inulin and oligofructoses are already common in human food (cereal bars, bread, chocolate, cheese, sugar, pasta, noodles, frozen desserts, etc) and could be eaten each day without chance of distaste. In rodents, a 40–45 % energy-restricted diet(Reference Sohal, Ku, Agarwal, Forster and Lal51) taken during all life or a 10 % Synergy1 diet, without hunger and with good health and life pleasure, involved a similar extension of life of 30–35 %.
To conclude, the present study showed that lifelong supplementation with Synergy1 limited BW and fat-mass gains and beneficially modulated lipid metabolism during ageing, and additionally increased lifespan in rats. Further studies are needed to investigate the mechanisms by which Synergy1 increases lifespan and whether such prevention of age-related dysfunctions by administration of Synergy1 can be observed in humans as well.
Acknowledgements
All the authors of this article attest that there was no potential conflict of interest that could have influenced the present study. No author's institution has contracts relating to this research through which it or any other organisation may stand to gain financially now or in the future. No other agreements of authors or their institutions could be seen as having a financial interest in the study.
Financial support related to the paper was provided by BENEO-Orafti.
All authors have reviewed the contents of the paper, approve of its contents and validate the accuracy of the data.


