



There is growing evidence from epidemiological studies, animal studies and randomised controlled clinical trials in human subjects that long-chain (LC) n-3 fatty acids (FA), mainly EPA and DHA, found in oily fish have multiple health benefits( Reference Ruxton, Reed and Simpson 1 ). They are best known for positive outcomes of cardiovascular health( Reference Wang, Harris and Chung 2 – Reference Wilk, Tsai and Hanson 6 ). There is also accumulating evidence for the role of n-3 FA in the prevention or treatment of colorectal cancer( Reference Cockbain, Toogood and Hull 7 ) and inflammatory conditions( Reference Calder 8 – Reference Miles and Calder 10 ), including inflammatory bowel disease( Reference Camuesco, Comalada and Concha 11 – Reference Cabre, Manosa and Gassull 13 ), and associated evidence for positive neurological effects( Reference Dyall and Michael-Titus 14 – Reference Martins 17 ). Since there is a relatively low intake of n-3 FA in the Australian population( Reference Grieger, Miller and Cobiac 18 ), there have been recommendations to increase the intake of n-3 FA through increased consumption of fish or supplements, or functional foods enriched with LC n-3 FA, especially to reduce the risk of CVD( Reference Mori 19 ).
Fish oil is unstable and highly susceptible to oxidation( Reference Sharma, Sanguansri and Marsh 20 ), leading to the development of undesirable flavours. Therefore, despite the health benefits associated with LC n-3 FA, eating fish or taking fish oil capsules is not a desirable option for everyone. This is possibly due to food preferences of some consumers and undesirable effects of taking fish oil supplements such as fishy aftertaste and gastrointestinal (GI) upset( Reference Fetterman and Zdanowicz 21 ). To mask the fishy taste and protect unsaturated FA from oxidation, fish oil may be microencapsulated before addition to food products. This approach has enabled successful incorporation of oils containing unsaturated FA into a range of dairy products( Reference Sharma, Sanguansri and Marsh 20 ), yogurt( Reference Tamjidi, Nasirpour and Shahedi 22 ), luncheon meat( Reference Volker, Weng and Quaggiotto 23 ) and bread( Reference Yep, Li and Mann 24 ). Microencapsulated fish oils may have different profiles of lipolysis, release and uptake of FA along the GI tract, and thus influence the bioavailability of n-3 FA( Reference Barrow, Nolan and Holub 25 – Reference Raatz, Redmon and Wimmergren 28 ). Dietary lipids are normally digested and absorbed rapidly after a meal. The LC FA and monoacylglycerols are packed into chylomicrons, which transport the absorbed TAG and other dietary lipids via the lymphatic system into the blood with peak absorption occurring in the first 2–4 h after ingestion( Reference Yep, Li and Mann 24 ).
Previously, we have demonstrated in a rat model that microencapsulated fish oil formulations stabilised by heated protein–carbohydrate encapsulants can deliver fish oil to the GI tract( Reference Patten, Augustin and Sanguansri 27 ), with n-3 FA being bioavailable alone( Reference Augustin, Patten and De Luca 29 ) or in combination with other bioactive compounds( Reference Augustin, Abeywardena and Patten 30 ). Some human studies have examined the bioequivalence of fish oil, and different emulsion and powdered formulations acutely over a period of 48 h( Reference Raatz, Redmon and Wimmergren 28 ) and over the short term for a period of 3 weeks( Reference Barrow, Nolan and Holub 25 ). Recently, bioavailability of microencapsulated fish oil incorporated into different food matrices such as cereal bar, orange juice or yogurt was assessed in ileostomy patients, revealing that over 99 % of n-3 FA were absorbed into the GI tract( Reference Sanguansri, Shen and Weerakkody 31 ). From this study, it has been suggested that bioavailability, absorption and accumulation of n-3 FA in the blood needs to be confirmed in healthy subjects( Reference Sanguansri, Shen and Weerakkody 31 ).
It is important to test the bioavailability of different microencapsulated formulations in the intended food product as both the microencapsulated formulation and the food vehicle may influence bioavailability. We have previously developed fish oil powders, which are shelf stable, by formulating fish oil emulsions stabilised by heated mixtures of proteins and carbohydrates and converting them into powders by spray-drying( Reference Augustin, Sanguansri and Bode 32 ). The aim of the present study was to compare the bioavailability of n-3 FA delivered as microencapsulated fish oil powders or fish oil gel capsules (FOGC) taken with a flavoured milk in healthy participants. The microencapsulated fish oil powders were formulated either with heated mixtures of milk protein–sugar (formulation 1 (F1)) or milk protein–sugar–resistant starch (formulation 2 (F2)). We hypothesised that microencapsulated fish oil formulations would be bioequivalent to a FOGC preparation, with regard to the uptake of EPA and DHA into the plasma and erythrocyte membranes. To do this, we investigated the indices of LC n-3 FA bioavailability (1) in an acute study for 48 h (with a single dose approximately 1·0 g DHA+EPA) by measuring the accumulation of LC n-3 FA in plasma, and (2) in a short-term study (with daily supplementation of approximately 1·0 g DHA+EPA over a period of 4 weeks) by measuring the accumulation of LC n-3 FA in plasma and erythrocytes, including the omega-3 index over a period of 4 weeks. Plasma lipid profiles were also assessed.
Participants and methods
Participants
According to the power calculation, about twelve participants (per group) were required to have an 80 % chance of detecting a 30 and 45 % increase in DHA compared with the FOGC (control) (α = 0·05) in the acute and short-term studies, respectively. An extra five participants per treatment group (i.e. n 17) were included to safeguard against participant non-compliance and other contingencies. Standard deviations for the above variables were sourced from the literature( Reference Arterburn, Hall and Oken 26 , Reference Raatz, Redmon and Wimmergren 28 ).
Participants were recruited from an existing database of volunteers in Adelaide, South Australia, who have previously given permission to be contacted again to receive information with regard to other studies. Each participant was screened by responses given to a standard Commonwealth Scientific and Industrial Research Organisation (CSIRO) health questionnaire using inclusion and exclusion criteria. Participants were recruited from the same pool for the ‘acute’ and ‘short-term’ studies.
Inclusion criteria for apparently healthy participants (with no reported current or previous metabolic diseases, GI disorders, renal or CVD) were either male or female between the age of 18 and 65 years with normal dietary habits (with no medically prescribed diet, no slimming diet, and no vegan or macrobiotic diet) and BMI between 18 and 30 kg/m2. Exclusion criteria included regular use of supplements containing n-3 FA, regular consumption of foods supplemented with n-3 FA such as some breads and milk products, consumption of fish as part of regular dietary patterns, high alcohol consumption (>21 standard drinks/week), reported participation in another biomedical trial 3 months before the start of the study or during the study, food allergies or intolerances (such as dairy products, lactose, peanuts and shellfish), and recent history (within 12 months) of substance abuse including alcohol. Age and anthropometric data including height and weight were collected in duplicate by a trained researcher following the International Society for the Advancement of Kinanthropometry protocol and standards, using A & D Weighing HW-PW200 digital electronic scales and a Seca stadiometer. All the participants gave written and informed consent. The Human Research Ethics Committee of CSIRO Food and Nutrition Flagship approved the study (no. 10/20), which included a power calculation and was registered as ACTRN12611000046909.
Acute study
A randomised, cross-over, non-blinded study design was used for the acute study. A total of fourteen participants were included for this study. There was a 4-week run-in period before the start of taking the treatment dose, followed by a 6-week washout period between consumption of each of the three treatments. Group A consumed four FOGC containing approximately 1049 mg EPA+DHA in total (647 mg EPA and 402 mg DHA) taken with 250 ml flavoured milk. Group B consumed 8 g F1 containing approximately 1013 mg EPA+DHA in total (618 mg EPA and 395 mg DHA) that was supplied as a sachet and mixed in 250 ml flavoured milk by the participants. Group C consumed 8 g F2 containing approximately 1026 mg EPA+DHA in total (629 mg EPA and 397 mg DHA) that was supplied in a sachet and mixed in 250 ml flavoured milk by the participants. The treatment dose was consumed immediately after taking a fasted blood sample. Participants were randomised into the following treatment orders: ABC; BCA; CAB. Blood samples were taken at 0, 2, 4, 6, 24 and 48 h for each of the three treatment groups. Participants were advised to avoid consumption of fish or fish oil products for the entire study duration of 16 weeks, and recorded any deviations from this protocol. A list of foods and supplements to be avoided was also provided to all the participants.
Short-term study
A randomised, parallel, non-blinded study design was used for the short-term study. A total of forty-seven participants were randomised to one of the three treatment groups. Participants followed a diet that excluded fish or fish oil-supplemented foods for 8 weeks (i.e. during the 4-week run-in period and 4-week supplementation period), as indicated in the Acute study section. The baseline characteristics of the participants in the short-term study are summarised in Table 2. The three treatment groups were the same as those in the acute study except that a daily dose was taken for 4 weeks. Participants took four FOGC (1049 mg EPA+DHA in total) with 250 ml flavoured milk, and mixed 8 g F1 powder (1013 mg EPA+DHA in total) or F2 powder (1026 mg EPA+DHA) into 250 ml of flavoured milk before consumption. The inclusion/exclusion criteria were the same as those for the acute study, and participants were advised to avoid consumption of fish or fish oil products for the entire study duration of 8 weeks and recorded any deviations. A compliance checklist was developed to monitor the regular consumption and occasions where foods high in n-3 FA had been inadvertently consumed.
Production of microencapsulated fish oil powders
Fish oil with an 18:12 ratio of EPA/DHA was obtained from Catalent Pharma Solutions. Microencapsulated fish oil powders (containing 50 % (w/w) fish oil) were manufactured following the procedures described previously( Reference Patten, Augustin and Sanguansri 27 ). Briefly, aqueous mixtures of sodium caseinate–glucose–dried glucose syrup (ratio 1:1:1, F1) or sodium caseinate–glucose–processed resistant starch (ratio 1:1:1, F2) adjusted to pH 7·5 were heated in a retort (100°C, 40 min) and then cooled down to 60°C. Fish oil (preheated to 60°C) was dispersed into the heated protein–carbohydrate encapsulants and homogenised at 35 MPa and 10 MPa in two stages using a homogeniser (Rannie, The Frain Group). The homogenised emulsion was then spray-dried into powders and packed into aluminium foil sachets (8 g powder per sachet) and supplied to all the participants. The same fish oil was used in the manufacture of the microencapsulated fish oil powders and the FOGC.
Measurement of plasma and erythrocyte fatty acids by GC
Blood was collected into 9 ml Vacutainer tubes containing EDTA, cooled to 4°C and separated into plasma and erythrocytes by centrifugation at 1500 g for 10 min. Erythrocytes were washed twice with isotonic saline and reconstituted to the original volume in water to lyse the cells. Aliquots of plasma and lysed erythrocytes were stored at − 80°C until analysis.
For the measurement of total plasma FA composition, 50 μl 17 : 0 FA as the internal standard (1·0 mg/ml) in chloroform (as triheptadecanoin, Sigma T-2151), 100 μl plasma and 1 ml methanol were added to culture tubes (16 mm × 125 mm). The tubes were mixed briefly by shaking; 2 ml chloroform (0·005 % butylated hydroxytoluene) was added followed by vigorous vortex mixing for 30 s. Then, 0·5 ml of 0·1 m-HCl were added to the tube, vortexed again for 30 s and centrifuged for 10 min at 1000 g . The aqueous (top) layer was removed by aspiration, and the chloroform layer was transferred carefully to a culture tube (20 mm × 150 mm) and evaporated to dryness with a stream of dry N2 at 35–40°C. The residue was methylated with 1·5 ml of 1 % H2SO4 in dry methanol in sealed tubes at 50°C for 18 h. After cooling to room temperature, 3 ml of pure water and 5 ml petroleum spirit (boiling point 40–60°C) were added and mixed vigorously for 30 s. The top organic phase was transferred to a glass tube (16 mm × 125 mm). The aqueous phase was extracted again with 5 ml petroleum spirit; the organic phase was combined with the first extract and evaporated to dryness with a stream of dry N2. FA methyl esters (FAME) were dissolved in 1·5 ml hexane and applied to solid-phase extraction columns made from glass Pasteur pipettes blocked with glass wool and packed to a height of 20 mm with Florisil (F-7752; Sigma-Aldrich) to remove contaminants. The columns were washed with an additional 1·0 ml hexane and FAME eluted with 2 ml of 10 % diethyl ether in hexane into chromatography vials. Solvents were evaporated using a stream of dry N2. FAME were dissolved in 50 μl isooctane for GC analysis.
Frozen lysed erythrocyte samples were thawed on ice and prepared for analysis by a method based on a published report( Reference Ridges, Sunderland and Moerman 33 ), which uses a one-step extraction and transesterification procedure. Briefly, 0·5 ml of lysed erythrocytes were added to 9·0 ml of cold Tris–EDTA buffer (10 mm-Tris, 1 mm-EDTA, pH 7·4) in a 10 ml polycarbonate ultracentrifuge bottle (Beckman 355603), mixed by inverting the tube gently four times and followed by centrifugation at 50 000 g at 5°C for 30 min. The supernatant was carefully removed by aspiration, and the erythrocyte membrane pellet was transferred quantitatively in a total volume of 200 μl of water to a screw cap glass tube containing the internal standard (50 μg 17 : 0 FA as triheptadecanoin; Sigma T-2151). Then, 2 ml of methanol–toluene (4:1, v/v) were added, briefly vortex mixed and followed by careful dropwise addition of 200 μl of acetyl chloride while vortex mixing the tube to minimise vigorous reaction. The tubes were capped firmly and placed in a heating block at 100°C for 1 h. After cooling, 3 ml of 10 % K2CO3 were added and mixed. Toluene (200 μl) was added, tubes were capped and shaken vigorously for 60 s. After centrifugation for 5 min at 1000 g , the upper toluene phase was transferred to a glass vial and evaporated to dryness under a stream of N2. FAME were redissolved in 1 ml hexane and applied to Florisil solid-phase extraction columns as described for the measurements of plasma FA composition before GC analysis.
Plasma and erythrocyte FAME were quantified by GC. A 0·2 μl sample was injected onto a bonded-phase vitreous-silica BPX70 column (30 m × 0·53 mm × 0·5 μm; SGE) in an Agilent 6890N gas chromatograph equipped with a cool on-column injector. The oven temperature programme was initially set at 120–180°C (6°C/min) and increased to 230°C (3°C/min), and the flame ionisation detector was set at 300°C. Peak identification was based on a comparison of retention times with Supelco 37-Component FAME Mix 47 885-U (Sigma-Aldrich Pty Limited). Individual FA were calculated as a percentage of the total FA. The omega-3 index is the content of EPA plus DHA, expressed as a percentage of total FA( Reference Harris and Von Schacky 34 ).
Measurement of plasma lipids
Cholesterol, HDL-cholesterol and TAG concentrations in the plasma were measured on a Boehringer Mannheim/Hitachi 902 clinical analyser (Hitachi Science Systems Limited) using appropriate diagnostic kits from Roche Diagnostics Australia. LDL-cholesterol was calculated using the Friedewald equation( Reference Freidewald, Levy and Fredrickson 35 ).
Statistical analyses
Data are presented as means with their standard errors. All statistical analyses were performed using GraphPad Instat (GraphPad Software). The graphs were plotted using Graph-Pad Prism version 5.04 for Windows (GraphPad Software) and used to calculate the AUC, the time to maximal value (T max) and the maximal value (C max). The FA data of plasma and erythrocytes and blood lipid parameters of cholesterol, HDL-cholesterol and TAG were found to have no significant differences between standard deviations, as determined by the method of Bartlett, and the data were sampled from populations that followed Gaussian distributions using the Kolmogorov–Smirnov method. The effects of the dietary treatments on FA and lipid parameters were determined using two-way ANOVA. When significance was attained (P< 0·05), selected pairwise multi-comparison procedures were adopted using the Bonferroni post-test.
Results
Participant compliance
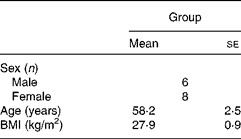
There were no withdrawals or lack of compliance in the acute study. Of the fifty-one participants who commenced the short-term study, four participants withdrew. None of the participants withdrew from the FOGC group, three withdrew from the F1 group due to health problems with only one reporting an aversion to taste and odour of the test products, and one withdrew from the F2 group due to family health issues. The baseline characteristics of the participants in the acute study are summarised in Table 1. There were no significant differences between age and BMI of the treatment groups (Table 2).
Baseline characteristics of the study participants in the acute (0–48 h) study (Mean values with their standard errors; n 14)
Baseline characteristics of the study participants in the short-term (4 weeks) study (Mean values with their standard errors)
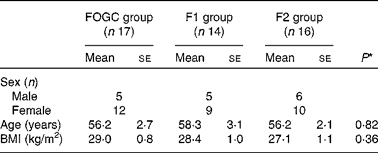
FOGC, fish oil gel capsule; F1, formulation 1; F2, formulation 2.
* P values were obtained from one-way ANOVA (two-sided) for the determination of differences between the treatment groups.
Acute study
Fatty acid composition of plasma
In all the treatment groups, the percentage of EPA, DHA and total n-3 FA in the plasma rose steadily from 0 to 6 h, with a further increase in the percentage of EPA up to 24 h. Although the percentage values were marginally decreasing after 24 h, they remained elevated at 48 h with no significant differences between the groups at individual time points (Fig. 1). The difference (Δ) from t= 0 h and the individual time points was also calculated (as a percentage of total FA) for EPA, DHA and total n-3 FA for each treatment group (Fig. 2). The percentage of Δ values for EPA in the F1 group was found to be significantly higher than that of the FOGC group at 2 h (P< 0·001) and 4 h (P< 0·01) (Fig. 2(A)). Similarly, for DHA, the percentage of Δ values was significantly higher in the F1 group than in the FOGC group at 4 h (P< 0·05; Fig. 2(B)). Also, for total n-3 FA, the F1 group had higher percentage of Δ values at 2 and 4 h (P< 0·05) than the FOGC group (Fig. 2(C)). Furthermore, the time to reach maximum value (T max) for the total n-3 FA was shorter in the F1 group than in the F2 and FOGC groups (Table 3).
Acute time course from 0 to 48 h of the composition of fatty acids (FA) as a percentage of the total FA pool in the plasma of the study participants (n 15) given at t= 0 h a single dose of fish oil gel capsules taken with a flavoured milk (○), or a flavoured milk containing formulation 1 (□) or formulation 2 (Δ). The FA shown are EPA (A), DHA (B) and total n-3 FA (C), which includes α-linolenic acid, EPA, docosapentaenoic acid and DHA (note: the ordinate axis does not start at 0 %). Values are means, with their standard errors represented by vertical bars.

Acute time course showing the change (Δ) from baseline t= 0 h to t= 2, 4, 6, 24 and 48 h in the composition of fatty acids (FA) as the percentage of the total FA pool in the plasma. Participants (n 15) were given at t= 0 h a single dose of fish oil gel capsules taken with a flavoured milk (○), or a flavoured milk containing formulation 1 (□) or formulation 2 (Δ). The FA shown are EPA (A), DHA (B) and total n-3 FA (C), which include α-linolenic acid, EPA, docosapentaenoic acid and DHA. Values are means, with their standard errors represented by vertical bars. Mean value for the formulation 1-treated group was significantly different from that of the fish oil gel capsule-treated group: * P< 0·05, ** P< 0·01, *** P< 0·001 (ANOVA with Bonferroni post-test).

Net changes in acute (0–48 h) plasma fatty acid (FA) composition as AUC (arbitrary units), time (h) to maximal value (T max) and maximal value (%) (C max) in the study participants (n 14) administered a single dose of fish oil gel capsules (FOGC) taken with a flavoured milk or a flavoured milk containing formulation 1 (F1) or formulation 2 (F2) (Mean values with their standard errors)
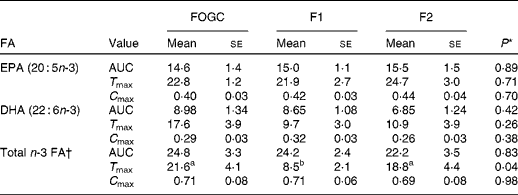
a,bMean values within a row with unlike superscript letters were significantly different (P< 0·05).
* P values were obtained from ANOVA with Bonferroni post-test on selected groups.
† Total n-3 FA includes α-linolenic acid, EPA, docosapentaenoic acid and DHA.
Short-term feeding study
Fatty acid composition of plasma
There were no significant changes in the values of individual SFA, individual MUFA, or total SFA and total MUFA across the treatment groups or within the treatment groups across the study duration of 4 weeks (Table 4). There were no significant changes in the values of 18 : 2n-6 (linoleic acid), 20 : 4n-6 (arachidonic acid), total n-6 FA or 18 : 3n-3 (α-linolenic acid) from 0 to 4 weeks for the FOGC, F1 and F2 groups (Table 4). No differences were observed between the treatment groups in relation to the changes in the values of n-6 FA. There were no significant differences between the three groups with respect to the increases in the values of EPA, DPA, DHA, total n-3 FA and omega-3 index from 0 to 4 weeks (P< 0·01).
Plasma fatty acid (FA) composition of the study participants administered daily with fish oil gel capsules (FOGC) taken with a flavoured milk, or formulation 1 (F1) or formulation 2 (F2) supplemented with a flavoured milk in the short-term study for 4 weeks (Mean values with their standard errors)

LA, linoleic acid; AA, arachidonic acid; ALA, α-linolenic acid; DPA, docosapentaenoic acid.
a,bMean values within a row with unlike superscript letters were significantly different (P< 0·05).
* P values were obtained from ANOVA with Bonferroni post-test on selected groups.
† FA are expressed as a percentage of the total FA pool, for fourteen to seventeen individuals per group (see Table 2).
‡ Δ values represent the change from t= 0 weeks to t= 4 weeks. The n-3:n-6 FA ratio is the total percentage of n-3 FA divided by the total percentage of n-6 FA.
Fatty acid composition of erythrocytes
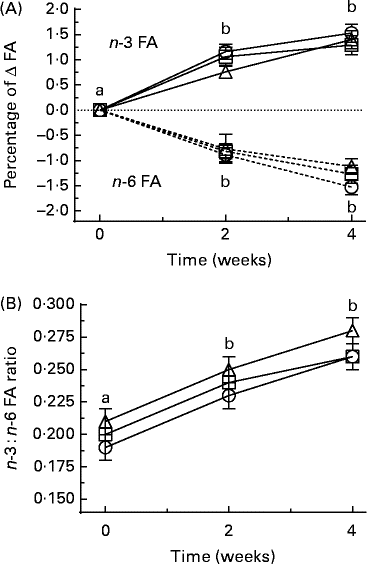
There were no significant changes in the values of individual SFA, individual MUFA or total SFA and total MUFA across the treatment groups or within the treatment groups across the study duration of 4 weeks (results not shown). At 2 and 4 weeks, there were no significant changes in individual n-6 FA values in erythrocytes compared with those at 0 weeks, but total n-6 FA values had significantly decreased at 4 weeks for all the treatment groups. For EPA, the values increased significantly at 2 and 4 weeks compared at 0 weeks (P< 0·05) in all the three groups (Table 5). Total n-3 FA values significantly increased in the FOGC groups at 2 and 4 weeks, but increased significantly in the F1 and F2 groups at 4 weeks (Table 5). The omega-3 index value increased in the FOGC and F1 groups at 2 and 4 weeks, but for the F2 group, the increase was significant only at 4 weeks (Table 5). When these results were expressed as the change (percentage of Δ) in total n-3 or n-6 from baseline for all the treatment groups at 2 and 4 weeks, the n-3 FA values were increased and n-6 FA values were decreased (P< 0·05; Fig. 3(A)). The n-3:n-6 FA ratio was increased only at 4 weeks (P< 0·05; Table 5 and Fig. 3(B)).
Erythrocyte membrane fatty acid (FA) composition of the study participants administered daily with fish oil gel capsules (FOGC) taken with a flavoured milk, or formulation 1 (F1) or formulation 2 (F2) in the short-term study for 2 and 4 weeks (Mean values with their standard errors)

LA, linoleic acid; AA, arachidonic acid; ALA, α-linolenic acid; DPA, docosapentaenoic acid.
a,bMean values within a row with unlike superscript letters were significantly different (P< 0·05).
* P values were obtained from ANOVA with Bonferroni post-test on selected groups.
† FA are expressed as a percentage of the total FA pool, for fourteen to seventeen individuals per group (see Table 2).
‡ Δ values represent the change from t= 0 weeks to t= 2 and 4 weeks.
§ Omega-3 index is EPA+DHA, expressed as a percentage of total FA.
Short-term time course showing (A) the change (Δ) from baseline t= 0 to t= 2 and 4 weeks in the composition of fatty acids (FA) as a percentage of the total FA pool of total n-3 ( ) and total n-6 (
 ) in erythrocyte membranes, or (B) as the n-3:n-6 FA ratio. Participants were given a daily dose of fish oil gel capsules taken with a flavoured milk (○), or a flavoured milk containing formulation 1 (□) or formulation 2 (Δ). Values are means, with their standard errors represented by vertical bars. Significance was determined by ANOVA with Bonferroni post-test. a,bMean values with unlike letters were significantly different (P< 0·05).
Plasma lipids
Total cholesterol, HDL-cholesterol and LDL-cholesterol levels did not change significantly over the 4 weeks of supplementation for any of the treatment groups (Table 6). However, for the FOGC group, the changes (Δ) in HDL-cholesterol levels were significantly increased compared with the F1 and F2 groups (P< 0·05) at 4 weeks. There were no significant changes in plasma TAG concentrations between the treatment groups. The TAG:HDL-cholesterol ratio did not change significantly at 2 or 4 weeks (Table 6).
Plasma lipid levels of the study participants administered daily with fish oil gel capsules (FOGC) taken with a flavoured milk, or a flavoured milk containing mixed formulation 1 (F1) or formulation 2 (F2) in the short-term study for 2 and 4 weeks (Mean values with their standard errors)

a,bMean values within a row with unlike superscript letters were significantly different (P< 0·05).
* P values were obtained from ANOVA with Bonferroni post-test on selected groups.
† Values are mmol/l, for fourteen to seventeen individuals per group (see Table 2).
‡ Δ values represent the change from t= 0 weeks to t= 4 weeks.
Discussion
The recent challenge to the food industry has been to introduce LC n-3 FA into functional foods where oxidation and rancidity is avoided and fishy taste and aroma are masked( Reference Stonehouse, Pauga and Kruger 36 ). Microencapsulation technology using heated protein and carbohydrates was developed in our laboratory to stabilise oxygen-sensitive oils and mask the undesirable taste of fish oil and other bioactive compounds( Reference Patten, Augustin and Sanguansri 27 , Reference Augustin, Patten and De Luca 29 , Reference Augustin, Abeywardena and Patten 30 ). Microencapsulated fish oil formulations were used in the present study to facilitate the delivery of n-3 oils into food and beverage products. The present study measured the acute absorption kinetics and short-term bioavailability (steady state) of two microencapsulated fish oil formulations in healthy human subjects. In the acute study, the F2 group was expected to be better protected from gastric and intestinal fluid and digestive enzymes due to the presence of high-amylose resistant starch in the encapsulant, and hence delayed release as observed in a previous animal study( Reference Patten, Augustin and Sanguansri 27 ). However, the delayed release of n-3 FA from the F2 powder (formulated with pre-processed resistant starch) was not observed in the acute study, which was similar to the results obtained in an earlier animal study( Reference Augustin, Patten and De Luca 29 ). Resistant starch has been found to delay the release of peptides, oils and probiotics( Reference Sanguansri and Augustin 37 , Reference Augustin and Sanguansri 38 ). In the present study, the type of the carbohydrate used in combination with sodium caseinate for encapsulation of fish oil was not the major factor influencing lipolyis in vivo. In the acute study, the faster rate and higher plasma concentration of n-3 FA in the F1 and F2 groups compared with the FOGC group suggests that the size of the oil droplets, rather than the nature of the interface of the oil droplet, may have influenced the rate of lipolysis and lipid digestion. Previous work has shown that under the conditions used for the production of microencapsulated fish oil powders, the oil is in an emulsified state with an average particle size of approximately 0·35 μm( Reference Patten, Augustin and Sanguansri 27 ). It is well known that smaller oil droplets have a much higher surface area (at the oil–water interface) available for the enzyme lipase, during lipid digestion, which will increase the rate of lipolysis. The results from the acute study has shown that even though the F1 and F2 groups had shorter times to reach the maximum value for plasma n-3 FA compared with the FOGC group, the AUC for total n-3 FA uptake over a period of 48 h showed no significant differences. The health implications and the importance of having a short time to reach maximum peak for plasma n-3 FA need to be considered.
At 4 weeks, the EPA and DHA values and the n-3:n-6 FA ratio were significantly higher in erythrocyte membranes, and the calculated omega-3 index ranged from 4·5 to 5·1 % at baseline and increased to 5·8–6·3 % after 4 weeks. In the present study, daily supplementation with fish oil powder containing at least 1·0 g EPA+DHA did not raise the omega-3 index to 8 %, as recommended for potential cardiovascular protection( Reference Harris and Von Schacky 34 , Reference Harris 39 ), but was in the intermediate range between 4 and 8 %( Reference Harris 39 ). In a recent trial, participants were supplemented with 1·7 g EPA+DHA/d as an emulsified preparation (Coromega, Inc.) with the erythrocyte omega-3 index value increasing from 3·2 to 5·2 % within a period of 4 weeks( Reference Root, Collier and Zwetsloot 40 ). In another earlier trial, the omega-3 index value increased from 4·3 to 7·8 % within a period of 8 weeks in participants who were administered soft gel fish oil capsules containing a total of 2·16 g EPA+DHA/d( Reference Cao, Schwichtenberg and Hanson 41 ). These results, and studies by others( Reference Stonehouse, Pauga and Kruger 36 ), have suggested that to achieve optimal erythrocyte omega-3 index values of about 8 %, supplementation above 2 g EPA+DHA/d for at least 8 weeks is required in one form or the other. It was concluded that approximately 1 g/d intake of LC n-3 FA may result in an approximate increase of 2 % in the omega-3 index value over an 8-week period( Reference Stonehouse, Pauga and Kruger 36 ). This is the dose amount also proposed to elicit anti-inflammatory actions, but few dose-finding studies in human subjects have been performed( Reference Calder 8 ).
At a dose of at least 1·0 g EPA+DHA/d in the present study, there was a trend towards lower TAG levels over a period of 4 weeks for all the three treatment groups. This is not surprising as recent evidence suggests that the TAG-lowering effect of LC n-3 FA is best seen at a concentration above the normal range of 1·7 mmol/l( Reference Pirillo and Catapano 42 ). However, the Δ HDL-cholesterol values decreased significantly for the F2 group compared with the FOGC group over a period of 4 weeks. The calculated TAG:HDL-cholesterol ratio, which is also used as a risk factor for CVD( Reference Eslick, Howe and Smith 43 ), with an increased ratio recognised as increased risk, did not change. In a human study where 1·7 g EPA+DHA/d was ingested for 4 weeks, there was no reported change in TAG levels( Reference Root, Collier and Zwetsloot 40 ). In an earlier study, a cohort of human subjects who ingested 5·9 g microencapsulated (multi-core microcapsules as a gelatine and polyphosphate by complex coacervation) fish oil powder containing 2·0 g EPA+DHA, plasma TAG levels declined significantly from 2·68 to 1·86 mmol/l with a concomitant drop in the TAG:HDL-cholesterol ratio( Reference Barrow, Nolan and Holub 25 ). Again, this suggests that the amount of n-3 FA used in the present study may not have been at the threshold required to significantly lower plasma TAG levels in healthy volunteers. However, for participants with hyperlipidaemia, a meta-analysis showed that fish oil supplementation produced a clinically significant dose-dependent reduction in fasting blood TAG levels, but not total, HDL- or LDL-cholesterol levels( Reference Eslick, Howe and Smith 43 ).
In agreement with our hypothesis, we conclude that F1 and F2 demonstrated equivalence with regard to bioavailability and uptake of LC n-3 FA into plasma for 48 h (acute study) and plasma and erythrocyte membranes over a period of 4 weeks (short-term study) compared with FOGC in human subjects, and raised the omega-3 index value into the intermediate range for all the treatments.
The model used in the present study could be used to compare different food matrices with those presented here using different types and forms of lipid. It is suggested that a higher dose of EPA+DHA (>2 g/d) could be used over longer durations of up to 16 weeks with good compliance encouraged over this period.
Acknowledgements
The authors gratefully acknowledge Wayne Beattie, Sukhdeep Bhail and Li Jiang Cheng for the production of microcapsules, and the CSIRO clinic staff for their assistance with the clinical trial. They also thank Dr W. Stonehouse for reviewing the manuscript.
The present study was solely funded by the CSIRO Food and Nutrition Flagship, Australia (project no. WBS R-00101-16). The study received no specific grant from any funding agency, commercial or not-for-profit sectors. The CSIRO Food and Nutrition Flagship had no role in the design and analysis of the data or in the writing of this article.
The authors' contributions are as follows: L. S., M. A. A., T. J. L., P. J. R., M. T. M. and M. Y. A. designed the research; L. S. and P. J. R. conducted the research; L. S., M. A. A., M. Y. A., M. T. M. and G. S. P. were responsible for the analysis, discussion of the data and writing of the paper, and had primary responsibility for the final content. All authors reviewed, critiqued and approved the final manuscript.
The authors declared that they have no conflict of interest.



