

A widely held belief among nineteenth-century observers was that the United States had exceptionally high rates of intergenerational mobility compared to European societies (Tocqueville Reference Tocqueville1835; Marx Reference Marx1852). Indeed, Long and Ferrie (Reference Long and Ferrie2013a) show that the United States exhibited higher mobility than Britain through the early twentieth century, which was recently extended by Pérez (Reference Pérez2019) to argue that the Old and New Worlds were characterized by distinctly different mobility regimes.
Today, the highest rates of intergenerational mobility are observed in Scandinavian countries such as Sweden (Breen and Jonsson Reference Breen and Jonsson2005; Björklund and Jäntti Reference Björklund, Jäntti, Salverda, Nolan and Timothy2009; Blanden Reference Blanden2013). Sweden’s high mobility is often attributed to a compressed income distribution and redistributive welfare-state policies (Erikson and Goldthorpe Reference Erikson and Goldthorpe1992; Corak Reference Corak2013). However, a century ago, Sweden exhibited higher levels of income inequality than the United States and had similarly low levels of redistribution as other European countries (Lindert Reference Lindert2004; Roine and Waldenström Reference Roine and Waldenström2008; Piketty Reference Piketty2014). Was Sweden also unexceptional in terms of intergenerational mobility?
In this paper, we provide the first representative estimates of inter-generational occupational mobility in Sweden prior to the rise of the welfare state. We make use of full-count census data to link a representative sample of 240,000 sons born in the late-nineteenth century to their fathers. To facilitate comparison, we pair our linked Swedish data with similarly constructed historical datasets for Argentina, Britain, Norway, and the United States (Long and Ferrie Reference Long and Ferrie2013a; Pérez Reference Pérez2019; Modalsli Reference Modalsli2017).Footnote 1

As in prior historical work, we focus on the intergenerational transmission of occupations, the only outcome consistently available in historical datasets. In the analysis, we examine two dimensions of occupational mobility. First, absolute mobility corresponds to the share of sons who transition into a different occupational group than that of their fathers. Second, we use the approach developed by Altham and Ferrie (Reference Altham and Ferrie2007) to examine relative mobility, capturing how the chance of entering a particular occupation differs for sons born to fathers from different groups. Absolute and relative mobility thus capture distinct dimensions of mobility. For example, in a society where only the sons of one social group are upwardly mobile, relative mobility will remain low, because although there are opportunities for upward mobility, those opportunities are not equally shared.
Our central finding is that present-day Sweden’s high levels of inter-generational mobility predate the rise of the welfare state by several decades. To establish this result, we first compare historical levels of mobility in Sweden to those observed for its American and European counterparts. More than half of all Swedish sons born in the late-nineteenth century transitioned into a different occupational group than their fathers, a higher level of absolute mobility than observed in both Europe and the United States. Sweden also exhibited high levels of relative mobility, with a pattern of mobility closer to that observed in the American “land of opportunity” than to its European neighbors. We then go on to analyze how the relative mobility levels observed in Sweden prior to WWI compare to those in Europe and the United States during the post-WWII era. We find higher levels of relative mobility in Sweden historically than among cohorts born in the mid-twentieth century in Britain, Norway, and the United States that grew up under the modern welfare state. Most strikingly, we document that Sweden exhibited more relative mobility in the early-twentieth century than it does today.
The finding of historically high levels of Swedish mobility survives extensive robustness testing. First, we find a similar mobility gradient when using a broader set of linked historical samples, varying the algorithm used to link individuals across censuses, or re-weighting our estimates to account for potential selection into the linked sample. Second, the results are robust to using alternative occupational classifications, adjusting for missing occupations, or decomposing mobility patterns to rule out that a particular occupational group is driving the estimates. Third, we link individuals in our data to emigrant registers to show that attrition due to trans-Atlantic migration does not appreciably affect our results. Together, these additional estimates suggest that the high levels of Swedish mobility we find are not an artifact of either the data or the way we measure occupational mobility.
Why did Sweden display such high rates of occupational mobility historically? While much contemporary work has emphasized the role of welfare-state institutions (Corak Reference Corak2013), we study a period in which such policies were largely absent (Lindert Reference Lindert2004). Moreover, the fact that we observe sharp mobility differences between countries such as Sweden and Norway, which share a similar cultural and institutional setting, suggests that other factors are more important to account for the variation in mobility.
We, therefore, turn to examine four broad economic explanations— growth and industrialization, migration, fertility, and human capital— that have been emphasized in the mobility literature. When evaluated against the historical record, two of these seem particularly plausible: economic change and geographic dynamism.
A long-standing hypothesis holds that intergenerational mobility may increase during times of rapid economic change (Lipset and Bendix Reference Lipset and Bendix1959; Nybom and Stuhler Reference Nybom and Stuhler2014). Notably, while Sweden did not stand out in terms of equality or redistribution prior to WWI, it was one of the fastest growing economies in Western Europe. Across countries, there is a clear gradient between mobility and economic growth where the most rapidly growing economies—Argentina, Sweden, and the United States—are more mobile than the relatively more stagnant European countries. A closely related explanation is migration. All industrializing countries saw vast spatial disparities in economic development. By investing in migration, individuals were thus able to reap the benefits of significant locational arbitrage. Indeed, our analysis suggests that Sweden also exhibited high rates of internal migration from a comparative perspective. These cross-country patterns are suggestive but not sufficient to allow us to discriminate between explanations.
We, therefore, leverage the significant variation in mobility within Sweden to shed further light on these explanations. First, we characterize the variation in absolute and relative mobility across 282 municipalities. Mobility differences within Sweden span those observed between the least mobile (Norway) and most mobile (Argentina) economies in our sample, much like mobility varies locally in countries with less extensive social welfare institutions today (Chetty et al. Reference Chetty, Hendren, Kline and Saez2014; Güell et al. Reference Güell, Pellizzari, Pica and Rodríguez Mora2018; Berger and Engzell Reference Berger and Engzell2019). We then examine the local correlates of these regional mobility differences. Consistent with the cross-country patterns, we find that municipalities that underwent more rapid growth and industrialization also tend to have higher levels of absolute mobility, though not necessarily relative mobility. Instead, the most robust correlate of local differences in both absolute and relative mobility is internal migration.
Migrants primarily invested in “moves to opportunity” by migrating to areas that exhibited higher levels of growth, industrialization, and occupational mobility. To identify whether migrants also enjoyed higher occupational mobility, we use individual-level variation in migration and mobility outcomes within families, as is common in the historical literature (Abramitzky et al. Reference Abramitzky, Boustan and Eriksson2012; Ward Reference Ward2020b). We show that migrant brothers were significantly more likely to transition out of their father’s occupation compared to their brothers that stayed behind. In particular, this increase in mobility is evident among sons of farmers and unskilled workers who left more stagnant rural places for the city. While we cannot fully rule out that (non-)migrant brothers differed in non-observable ways, these results are suggestive of a causal link between migration and occupational mobility. More broadly, these results are consistent with a large literature suggesting that migration induced by spatial disparities in economic development is a central lever to open avenues for occupational mobility (Long Reference Long2005; Long and Ferrie Reference Long and Ferrie2013a; Tan Reference Tan2023; Ward Reference Ward2020b; Connor and Storper Reference Connor and Storper2020; Abramitzky et al. Reference Abramitzky, Boustan, Jácome and Pérez2021).
By providing a representative estimate of occupational mobility in Sweden around 1900, we extend backward the large literature on inter-generational mobility in the post-WWII period (Björklund and Jäntti Reference Björklund and Jäntti2000; Breen and Jonsson Reference Breen and Jonsson2007, Reference Breen, Jonsson, Breen and Müller2020; Jonsson and Mills Reference Jonsson and Mills1993).Footnote 2 Our results suggest that historical mobility differences between the Old and the New World were smaller than previously thought, and have a simple economic explanation. Rather than signaling cultural exceptionalism in the Americas, country differences are accounted for by economic growth and migration. These findings challenge longstanding beliefs about a fundamental mobility divide between the Old and New World (Marx Reference Marx1852; Tocqueville Reference Tocqueville1835; Long and Ferrie Reference Long and Ferrie2007, Reference Long and Ferrie2013a; Pérez Reference Pérez2019; Antonie et al. Reference Antonie, Inwood, Minns and Summerfield2022).
MEASURING OCCUPATIONAL MOBILITY
Historical research on intergenerational mobility has inferred social standing from occupational titles, and our work is no exception (Long & Ferrie Reference Long and Ferrie2013a; Modalsli Reference Modalsli2017; Pérez Reference Pérez2019; Antonie et al. Reference Antonie, Inwood, Minns and Summerfield2022). Occupations are an important social indicator as the main source of income, a marker of identity, and the way people spend much of their waking time. Unlike unidimensional indicators such as income or wealth, there is no unambiguous ranking of occupational positions. Thus, the data have to be analyzed using methods appropriate for nominal categories.Footnote 3
Comparing intergenerational occupational mobility between two countries involves a comparison of two-dimensional r × s mobility tables, where rows (r) denote fathers’ occupations and columns (s) denote occupations of sons. A simple metric of absolute mobility in this table is the fraction of sons that enter into a different occupational group than their father, which simply corresponds to the share of sons that end up in cells that lie off the main diagonal. This fraction depends mechanically on structural change: if certain sectors, such as farming, shrink over time, sons are forced out of those sectors and into other occupations. Therefore, we also present adjusted rates of absolute mobility where transitions have been scaled to ensure identical marginal distributions across tables (Deming and Stephan 1940). Specifically, we impose the marginal distribution of Sweden, which lets us answer the question: what would absolute mobility have looked like in other countries, had they undergone the same structural transformation at the time?
One shortcoming of absolute mobility metrics is that they do not distinguish between (a) mobility that occurs mechanically due to shifts in the marginal distribution of occupations between generations, and (b) mobility that might have occurred even if the margins had stayed identical (Long and Ferrie Reference Long and Ferrie2013a; Pérez Reference Pérez2019). The latter type of mobility— known as relative mobility—is believed to better capture the underlying structure of opportunities, or the “openness” of a society (Erikson and Goldthorpe Reference Erikson and Goldthorpe1992). Any society can show high mobility in times of rapid structural transformation, but only one that offers its members relatively equal chances will achieve high mobility absent such transformation. A common way to assess relative mobility is to use odds ratios, which reflect the relative chances of reaching a given occupational standing for sons of different origins. The odds-ratio comparison can be expressed as:

contrasting, for example, the odds p for a white-collar father’s son j of entering a white-collar job i as opposed to a job as a manual laborer i′, relative to the corresponding odds for a son of a manual worker j'. However, in an r × s table there are [r(r – l)/2][s(s – l)/2] unique odds ratios, which result in a large number of coefficients instead of a single summary measure of mobility.
As a solution, Altham (Reference Altham1970) proposed a method to summarize all the odds ratios in a crosstable, subsequently named the “Altham statistic,” which has become standard in this literature (Long and Ferrie Reference Long and Ferrie2013a). Since it is based on odds ratios, this statistic is invariant to differences in marginal distributions across tables. Hence, it allows us to compare relative mobility in two or more tables without adjusting the table’s margins. If we let P and Q denote the r × s mobility table for two countries, the Altham d(P, Q) statistic is calculated as:

which summarizes the square root of all squared log odds-ratio comparisons in each table. The resulting measure ranges between 0 and infinity, where 0 denotes that each odds ratio is identical across the two tables. In other words, a larger d(P, Q) statistic corresponds to a greater distance between the row-column associations in tables P and Q, and, consequently, a greater difference in mobility. To test whether such a difference is statistically significant, we can establish whether the gap between P and Q is non-zero using a likelihood-ratio χ Footnote 2 statistic with (r – l)(s – l) degrees of freedom (Altham and Ferrie Reference Altham and Ferrie2007). However, even in the case of a significant difference between the row-column associations in the two tables, the d(P, Q) statistic is in itself not informative about which matrix displays more mobility.
To assess which table entails more mobility, we also compare how much each of them deviates from the case of full mobility (i.e., where the occupational attainment of sons is completely independent of their fathers). That is, we compare occupational transitions to a benchmark table with no row-column association I, a matrix where all the row and column probabilities are equal to their margins, and hence all odds-ratio comparisons amount to 1. Since each log-odds ratio in the matrix of independence I is unity, its logarithm will be 0 and the Altham d(P, I) statistic, in this case, simplifies to:
where the statistic again takes on values between 0 and infinity. A larger distance between table P (or Q) and I here represent a greater divergence from the case of full mobility. Hence, the larger the Altham d(P, I) is, the lower the level of relative mobility.
Establishing whether two countries differ in terms of occupational mobility then involves two steps: (1) estimating the distance between the mobility matrix in each country relative to the case of full mobility (i.e., d(P, I) and d(Q, I), respectively); and (2) establishing whether the matrices are different from one another by estimating the d(P, Q) statistic. A useful property of the Altham statistic is that, since it is simply an aggregate of the underlying odds ratios, it can be decomposed into its constituent odds-ratio comparisons. This makes it possible to attribute total immobility to the contributions from each cell, row, or column of the table—a feature we make use of.
At the same time, the Altham statistic has the drawback that it assigns equal weight to all cells in the table and hence to each odds-ratio contrast. This may end up assigning disproportionate weight to cells that are very sparsely populated, which gives rise to two potential problems. First, sparse cells entail a larger sampling error, and one may end up mistaking sampling variability for substantive variation. We address this issue by employing a Bayesian shrinkage estimator (Zhou Reference Zhou2015). Second, even abstracting from sampling error, one may want to assign lesser substantive importance to groups that make up a small part of the population. An ad hoc solution is to re-estimate associations by excluding certain cells (e.g., farmers) from the table (Long and Ferrie Reference Long and Ferrie2013a). A more principled approach is to weight each pairwise comparison p ij p i′j′/p ij′ p i′j directly by the marginal proportion of each row and column (Bouchet-Valat Reference Bouchet-Valat2019). We implement both solutions as robustness checks.
DATA
Our main source of data is the full-count 1880 and 1910 Swedish censuses, distributed through IPUMS International (Swedish National Archives 2014, 2016; IPUMS 2019). Each census contains detailed individual- and household-level demographic and occupational information, coded to consistent international standards, for the entire universe of Swedish residents.Footnote 4
The Swedish data possess some unique strengths relative to that of other countries.Footnote 5 In particular, birthplace is recorded at the parish level, a much finer geographic unit than, for example, U.S. states (there were approximately 2,500 parishes in Sweden in 1880). In addition, since individual information in the censuses was sourced from continuous parish registers, birth years do not suffer from recall errors.Footnote 6 We next describe how these advantages let us achieve high linkage rates without sacrificing match quality when tracing individuals between censuses.
Record Linkage
We aim to create a representative sample of fathers and sons observed in both 1880 and 1910. As with historical census data for other countries, the main challenge is to trace individuals over time in the absence of unique individual identifiers. To link adult sons to their childhood house-holds, we, therefore, rely on time-invariant attributes and probabilistic matching methods (Abramitzky et al. Reference Abramitzky, Boustan, Eriksson, Feigenbaum and Pérez2019). A more detailed description of the linking procedure appears in Online Appendix A.
To link individuals between the two censuses, we proceed as follows. We first designate index variables that must match exactly for two records to be considered potential matches: sex, birth year, and parish of birth. For candidates that constitute a match on these criteria, we compare the similarity of first and last names using the Jaro-Winkler algorithm (Winkler Reference Winkler1990), which assigns a score between 0 (no similarity) and 1 (identical) by comparing characters and transpositions in text strings.Footnote 7 We consider individuals linked if there is a unique match within the same sex × birth year × place of birth cell that satisfies a Jaro-Winkler threshold of at least 0.85 for both the first and last name. In Online Appendix A, we show that this threshold value is an optimum that maximizes both the number of realized links and the share of those links that are confirmed true by matching middle initials in our sample.
We focus on cohorts born 1864–1880, who were 16 years old or less in 1880 and thus in their 30s or 40s in 1910. In total, we observed 849,996 boys belonging to these cohorts in the 1880 census. Thirty years later, following attrition due to out-migration and mortality, 543,155 of these men were enumerated in the 1910 census. In total, our method succeeds in linking 310,183 men between the two censuses, which corresponds to 36.5 percent of the relevant cohorts enumerated in 1880 and 57.1 percent in 1910.Footnote 8
These linkage rates are significantly higher than those typically achieved when linking historical censuses. For other linked samples, the retrospective rates (comparable to our rate of 57.1 percent) range from 20.3 percent and 21.9 percent for Britain and the United States (Long and Ferrie Reference Long and Ferrie2013a) to 37.0 percent for Norway (Modalsli Reference Modalsli2017). We discuss why this is unlikely to bias our comparisons, and also implement alternative linking algorithms that mimic the links in other countries.
ASSESSING THE LINKED SAMPLE
An important question is how well the linked sample represent the underlying population, since differential matching rates based on demographic or economic characteristics could introduce bias in the subsequent analysis.
We first address this question by comparing the distribution of fathers’ and sons’ characteristics for linked individuals compared to the relevant population in the 1880 and 1910 censuses. Online Appendix Table E.1, Columns (1) and (2), show that fathers’ and sons’ ages are very similar on average, though linked sons are somewhat less likely to have grown up in urban households, or households where the head has migrated from his parish of birth. However, there are virtually no differences in terms of the father’s occupational class: the difference between linked and non-linked sons is less than 1 percentage point for all four occupational groups (Column (3)). The linked sample thus closely resembles the occupational distribution in the underlying population.
We similarly find that fathers’ occupational status is a poor predictor of successful matches in multivariate regressions where we regress an indicator of a match in the 1910 census on demographic, economic, and name characteristics recorded in the 1880 census. Online Appendix Table E.2, Column (1) shows that sons with white-collar fathers are slightly more likely to be matched than, for example, sons with unskilled fathers. However, this may be driven by the fact that naming patterns differ across social groups. White-collar sons, in particular, may be easier to link if their names are longer and/or less common. The higher match probability for sons of white-collar fathers indeed becomes attenuated when controlling for name length and name commonness in Column (3). Moreover, the overall explanatory power of fathers’ occupational status and the included covariates is limited.
Taken together, the fact that occupational distributions are nearly identical among our linked sample and the underlying population suggests that any bias is likely to be small. However, to assess whether potential selection into the linked sample affects our mobility estimates, we also present estimates where we weight each father-son pair by the inverse probability that a son is linked based on the demographic, economic, and name characteristics analyzed in this section.
Classifying Occupations
Occupational titles in the Swedish censuses are coded according to the Historical International Standard of Classification of Occupations (HISCO), where titles are allocated to five-digit codes indicating one of 1,600 possible occupational unit groups (Van Leeuwen, Maas, and Miles Reference Van Leeuwen, Maas and Miles2002).Footnote 9 This allows us to aggregate occupations recorded in the census to the HISCLASS scheme, a harmonized categorization created for the purpose of comparison across countries and time periods (Van Leeuwen and Maas Reference Van Leeuwen and Maas2011). Following Long and Ferrie (Reference Long and Ferrie2013a), we aggregate the 12 HISCLASS groups into four broad groups more suitable for the analysis of occupational mobility: “White collar,” “Farmers,” “Skilled/semi-skilled,” and “Unskilled” (see Online Appendix Table E.3). In supplementary analyses, we also show additional results introducing further distinctions within the most and least skilled groups.
Additional Father-Son Datasets
We complement our linked sample of Swedish fathers and sons with similar linked samples for several additional countries. In particular, we draw on data from Pérez (Reference Pérez2019) for Argentina (1869–1896), Britain (1851–1881), Norway (1865–1900), and the United States (1850–1880).Footnote 10 The latter three datasets are all based on individual-level census data available from IPUMS International (IPUMS 2019). In all these samples, sons are linked across the two points in time using algorithmic matching based on information on reported names, place of birth, and year of birth. The sample restrictions are also similar to those in our Swedish data: all samples are limited to father-son pairs in which (1) the son co-resided with his father at the time of the initial census; (2) the son was 16 years old or younger when observed with their father in the initial census year; and (3) the father and the son were between the ages of 30 and 60 when their occupations were recorded.
MOBILITY IN THE OLD AND NEW WORLD: SWEDEN IN INTERNATIONAL PERSPECTIVE
Notes: Panel A displays estimates of absolute mobility, or the share of sons that are observed in a different occupational group than their father. Panel B reports similar measures of absolute mobility adjusted to the occupational distribution in Sweden. Panel C displays Altham d(P, I) statistics that capture the distance from the case of full mobility where a larger statistic corresponds to less mobility. Panel D reports Altham d(P, Q) statistics that measure the distance between each country’s mobility table and the Swedish mobility table.
Source: See Data section for information about data sources.

HOW MOBILE WAS SWEDEN BEFORE THE WELFARE STATE?
Main Results
We first examine historical differences in absolute mobility across countries. Figure 1A displays absolute mobility rates, the share of sons that are observed in a different occupational group than their father, for Sweden and the four other countries in our sample. Swedish sons born in the late-nineteenth century experienced significant absolute mobility: 53 percent worked in a different occupational group in the early twentieth century compared to their father. Thus, absolute mobility in Sweden was close to levels observed in Argentina and considerably higher than in Britain, Norway, and the United States, where less than half of sons transitioned into a different occupational group than their father. All these differences are significant at the 1 percent level, as shown in Online Appendix Table E.6.
OCCUPATIONAL TRANSITIONS FOR FATHERS AND SONS, 1880–1910

Notes: This table displays occupational transitions for sons relative to their fathers. Each row corresponds to the occupational group of fathers observed in the 1880 census. Each column corresponds to the occupation of sons observed in the 1910 census.
Source: See Data section for information about data sources.
Table 1 presents the full transition matrix for fathers’ and sons’ occupations, to shed more light on the underlying patterns of mobility.Footnote 11 Intergenerational persistence was strongest among the sons of white-collar and skilled/semi-skilled fathers, where more than half of all sons ended up in the same occupational group as adults. Among sons of farmers, only 9 percent transitioned into white-collar jobs, while almost half ended up in skilled or unskilled jobs. By contrast, 62 percent of sons born to unskilled fathers are observed in a different occupational group, most commonly transitioning into skilled or semi-skilled occupations.
Absolute mobility results from two different processes: (a) changes in occupational composition across generations and (b) the relative ease with which social boundaries can be crossed. When a society undergoes rapid structural transformation, many sons will be “forced” into new occupations due to the unavailability of employment in their father’s industry. Figure 1B illustrates this, where each mobility table has been constrained to Sweden’s marginal distribution (Deming and Stephan 1940; Altham and Ferrie Reference Altham and Ferrie2007). This figure demonstrates that Sweden’s high absolute mobility is partly attributable to its rapidly shifting industrial landscape compared to other countries at the time. We, therefore, focus mainly on relative mobility, which adjusts for marginal distributions.
Relative mobility is captured by the Altham statistic, which aggregates all possible odds—ratio comparisons between origins and destinations in the mobility table. Unlike absolute mobility, it is independent of marginal distributions and reflects the relative ease with which sons can enter a different occupational group from their father, compared with incumbents of that group (or sons from any other group).
Figure 1C displays Altham d(P, I) statistics for Sweden and the other American and European countries in our sample. The Altham d(P, I) statistic represents the deviation of each country’s mobility table from the case of perfect independence between sons’ and fathers’ occupations. Hence, for our relative mobility metric, higher values indicate lower mobility. As evident from Figure 1C, Sweden’s mobility matrix is closer to independence than those of both Britain and Norway, but slightly further away than the countries in the Americas. The cross-country pattern is similar to what we found in the comparison of absolute mobility using adjusted margins in Figure 1B. According to the χ Footnote 2 statistic, the deviation from the case of full mobility is significant at the 1 percent level for all countries in our sample. However, while the Altham d(P, I) statistics presented in Figure 1C allow us to compare differences in the distance to the case of full mobility, it does not tell us whether country-level mobility patterns differ in a direct comparison.
To determine whether mobility differs significantly between Sweden and the other countries, we estimate the Altham d(P, Q) statistic, aggregating the differences in row-column associations between the Swedish mobility table (P) and that of each comparison country (Q). These estimates are presented in Figure 1D. All estimated differences are statistically significant at the 1 percent level, which shows that Swedish mobility diverged from that in all other countries in the comparison. Combined with the estimates of mobility relative to independence (Figure 1C) this provides evidence that Sweden was more mobile than the other European countries and only slightly less mobile than the Americas.
Since the Altham d(P, Q) statistic is a distance measure, it also informs us about how (dis)similar mobility patterns are. Notably, the distance between Sweden compared to the Americas is smaller than to the two European countries. Specifically, the distance between Sweden and Britain (9.81) or Norway (9.56) is more than twice as large as the distance between Sweden and the United States (4.57). Thus, the pattern of mobility in Sweden lies closer to the New than the Old World. Indeed, the distance between the Swedish and U.S. mobility patterns is virtually identical to the difference between Argentina and the United States. In other words, differences in the mobility patterns within the New World (i.e., the United States vs. Argentina) are just as small as the difference between individual countries in the Old and the New World (i.e., the United States vs. Sweden).
Mobility before and after the Welfare State
So far, we have established levels of occupational mobility in Sweden that are relative to those observed in other countries prior to WWI. In this section, we compare historical mobility rates with those observed in the post-WWII era. To this end, we pair our historical data with estimates from the late-twentieth century drawn from the Swedish Study of Living Conditions (ULF) used by Breen and Jonsson (Reference Breen, Jonsson, Breen and Müller2020), the 1972 Oxford Mobility Study and 1973 Occupational Changes in a Generation Study used by Long and Ferrie (Reference Long and Ferrie2013a), and the linked set of Norwegian censuses used by Modalsli (Reference Modalsli2017). Further details on these samples and cohorts are provided in Online Appendix B.
How did Sweden’s historical levels of occupational mobility compare to those observed among cohorts who grew up during the rise of the welfare state? Figure 2 demonstrates that the level of relative mobility that we observe among Swedish cohorts born in the late-nineteenth century is higher than that among those growing up in the post-WWII era. The estimated Altham d(P, I) statistic for our historical and post- WWII cohorts are 17.93 and 20.43, respectively, which reflects a slight decline in mobility. Based on the Altham d(P, Q) statistic, we can reject at the 1 percent level that mobility patterns are identical in both periods (Online Appendix B). Thus, Sweden’s high levels of intergenerational occupational mobility were evident several decades before the emergence of the welfare state.
Additional Estimates and Robustness
Here, we describe a number of additional analyses and robustness tests reported in greater detail in Online Appendix C. We begin by demonstrating the importance of farming in understanding cross-national differences in mobility (Section C.1). Excluding farmers reduces the differences in relative mobility between countries, but retains their rank order (Figure C.1A). By contrast, the similarity in the pattern of mobility between Sweden and the New World is not driven by farming (Figure C.1B). We also examine which particular occupational groups contribute to this similarity in pattern (Section C.2). In both Sweden and the New World, there is ample mobility between skilled and unskilled labor, which explains much of their similarity (Figure C.2). We also distinguish further between occupational groups: “lower” versus “higher” white-collar occupations and farm hands versus other unskilled labor (Section C.3). The picture is similar, except Sweden actually surpasses the United States in relative mobility under the farm/non-farm distinction (Figure C.3B).
RELATIVE (IM)MOBILITY IN HISTORICAL AND MODERN SAMPLES
Notes: The figure displays Altham d(P, I) statistics that capture the distance from the case of full mobility. Note that a larger statistic corresponds to less mobility.
Source: See Data section for information about data sources.

The rest of Online Appendix C presents a series of robustness checks. In Section C.4, we implement additional estimators described by Bouchet-Valat (Reference Bouchet-Valat2019) that take into account error due to small cell counts, and weight cells by their relative population size. In Section C.5, we address life-cycle bias by estimating Altham statistics separately by cohort (and hence, by age). Mobility is stable throughout the cohort window used in our baseline sample, and also across ages of fathers used in our main analysis. In Section C.6, we consider selection into the linked sample by applying a reweighting procedure. This produces results very similar to our baseline estimates. In Section C.7, we try alternative linking procedures that mimic the methods used to link the U.S. data. We also use estimates for our comparison countries from other sources, varying the samples and procedures (Section C.8). Finally, we impute values for individuals with missing occupational information (Section C.9) or who have migrated (Section C.10). Evidence of high mobility in Sweden remains when addressing all of these potential biases.
WHAT EXPLAINS HISTORICAL MOBILITY DIFFERENCES?
In this section, we discuss four potential explanations for the relatively high level of mobility in Sweden: (1) growth and industrialization; (2) migration; (3) human capital; and (4) fertility. While stylized country comparisons may be informative, we cannot conduct a formal statistical assessment since our sample in this case is essentially limited to five observations. To examine these explanations in more detail, we, therefore, leverage spatial variation in mobility within Sweden. We first document significant regional differences in mobility, which rival the mobility gap between the most and least mobile countries in our sample. Using this variation, we then examine whether the four explanations outlined previously can account for mobility differences across Swedish municipalities.
Mobility Patterns across Countries
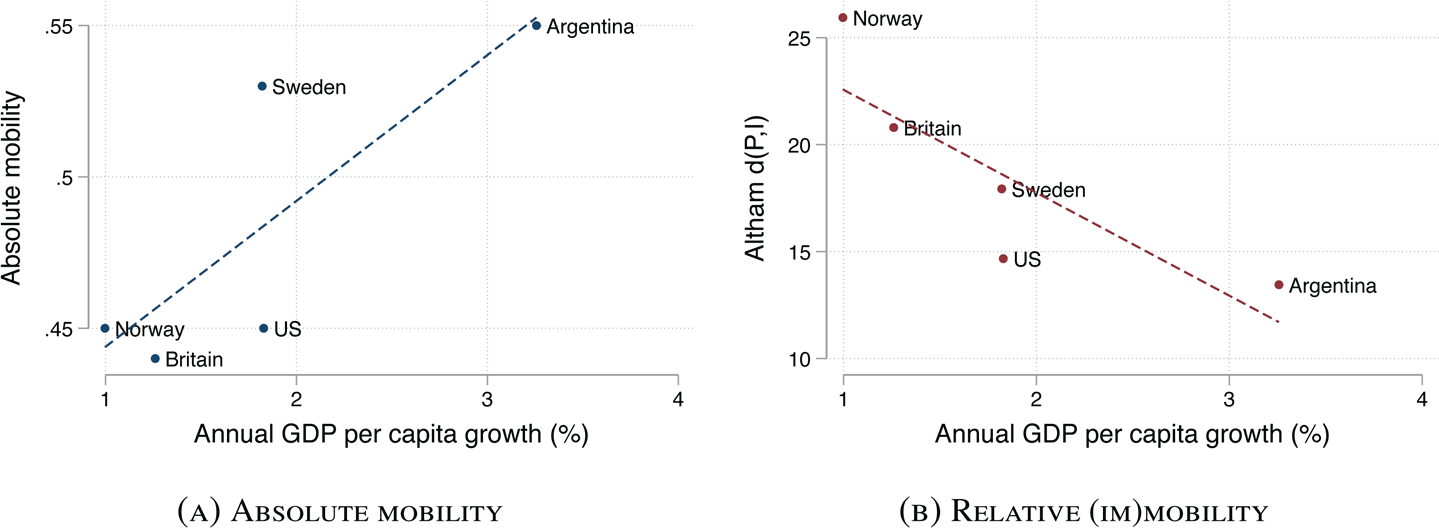
What underlying economic and social factors are consistent with Sweden’s high levels of intergenerational mobility? Two potential and interrelated factors are economic development and migration. A longstanding hypothesis is that persistence may weaken during times of economic transformation, owing to swift changes in occupational structure and the relative returns to different types of endowments and human capital (Lipset and Bendix Reference Lipset and Bendix1959; Nybom and Stuhler Reference Nybom and Stuhler2014). Indeed, Sweden was among the fastest growing European economies in the decades prior to WWI, outpacing both Britain and its Scandinavian neighbors, including Norway. Across the countries in our sample, there is a clear positive link between the rate of GDP per capita growth and mobility: the most rapidly growing countries in our sample—Argentina, Sweden, and the United States—also had the highest rates of absolute and relative mobility (see Figure 3).Footnote 12 Thus, differences in the rate of economic development closely align with observed differences in mobility.
ECONOMIC GROWTH AND MOBILITY ACROSS COUNTRIES
Notes: Panel A displays the cross-country relationship between GDP per capita growth and absolute mobility. Panel B displays the relationship between GDP per capita growth and the Altham d(P, I) statistic that capture the distance from the case of full mobility where a larger statistic corresponds to less mobility.
Source: Average yearly growth rates are measured between the census years used to compute mobility rates based on GDP per capita figures from Bolt et al. (Reference Bolt, Inklaar, de Jong and van Zanden2018).
A related explanation is migration, which may be an important lever to open up avenues for occupational mobility during times of vast disparities in economic and occupational change within countries (Long and Ferrie Reference Long and Ferrie2013a; Tan Reference Tan2023; Ward Reference Ward2020b; Connor and Storper Reference Connor and Storper2020). Previous research indicates that internal migration in Sweden was quick to respond to the opportunities that opened with industrialization and economic growth (Söderberg Reference Söderberg1985; Enflo, Lundh, and Prado Reference Enflo, Lundh and Prado2014). We similarly find high migration rates in our linked sample: between 1880 and 1910, 25 percent of sons moved between counties and more than half (59 percent) moved between parishes. While it is challenging to compare migration rates across countries due to differences in the size of geographical units, the existing evidence suggests that Sweden also exhibited high rates of internal migration in international comparison.Footnote 13
Emigration could have similarly shaped mobility patterns by decreasing the stock of high-mobility individuals in the Old World and increasing it in the New World. However, three facts suggest that emigration has limited power to explain country-level differences in mobility. First, in our robustness checks, we found little evidence that accounting for emigration affected aggregate mobility in Sweden. Second, while immigrants in the United States were indeed more mobile than natives (Abramitzky et al. Reference Abramitzky, Boustan, Jácome and Pérez2021), intergenerational mobility in the New World was high even among the native born (Pérez Reference Pérez2019). Third, emigration does not explain differences among European countries: both Norway and Sweden were major sending countries, yet had very different levels of mobility.
The provision of human capital is often seen as intertwined with mobility prospects, particularly for those at the bottom of the social ladder: mobility should be higher where the progressivity of public investments in human capital is high and the returns to skills are low (Becker and Tomes Reference Becker and Tomes1986; Solon Reference Solon and Corak2004). Both mechanisms may be relevant in the Swedish case. First, Sweden was Europe’s “impoverished sophisticate,” with the lowest rate of illiteracy in Europe, trailing only the United States, the world leader in educating its population (Sandberg Reference Sandberg1979; Lindert Reference Lindert2004). Second, earnings differentials between skilled and unskilled Swedish workers were small already in the late-nineteenth century (Ericsson and Molinder Reference Ericsson and Molinder2022). Both explanations are seemingly consistent with Sweden’s overall high mobility. Yet, the low levels of literacy and schooling in Argentina (the most mobile country in the sample) and the early commitment to education in Norway (the least mobile country) make this explanation less compelling.
Fertility is another potential factor behind mobility differences. The period we study coincides with the onset of a sustained fertility decline that started among elite groups (Dribe, Oris, and Pozzi 2014). The shift from child “quantity” to “quality” would have enabled (elite) parents to increase investments per child and amplified already existing advantages, thereby reducing mobility. However, fertility declined broadly at the same time in Britain, Norway, and Sweden. Attributing the sharp variation in mobility to class- or country-level fertility differences within Europe is therefore implausible, not least given the differences in persistence among the white-collar elite (see Online Appendix Figure C.2).
Although it is challenging to discriminate between these (non-mutually exclusive) explanations, the historical evidence discussed in this section highlights two mechanisms—economic development and geographic dynamism—as potentially central to understanding the comparatively high levels of Swedish mobility and the mobility gradient across countries. In the next section, we leverage the substantial variation in mobility within Sweden to examine whether these explanations can also account for observed regional mobility disparities.
Mobility Patterns within Sweden
MOBILITY DIFFERENCES ACROSS MUNICIPALITIES
We first characterize regional differences in mobility across the 282 Swedish municipalities. To estimate local mobility rates, we assign all sons in our linked dataset to the municipality where their household resided when they were aged 16 or below (i.e., in the 1880 census), irrespective of where they reside as adults. We then estimate the level of absolute and relative mobility for each individual municipality.Footnote 14
Figures 4A and 4B map the level of absolute and relative mobility across municipalities. Areas in central Sweden close to the capital Stockholm, as well as municipalities in the west and south close to the large cities of Gothenburg and Malmö, all exhibit high rates of mobility.Footnote 15 To put the magnitudes of these mobility differences in international perspective, Figure 5A displays the distribution of absolute and relative mobility by municipality, as well as the aggregate absolute mobility rates in Argentina, Britain, Norway, and the United States. Absolute mobility varies from below 45 percent in the bottom decile of Swedish municipalities—higher or on par with levels observed in Britain, Norway, and the United States—to above 62 percent in the top decile, a higher level than observed in any of the countries in our sample. Figure 5B documents a similar pattern in terms of relative mobility. In other words, the variation in absolute and relative mobility within Sweden spans the difference in mobility between the most (Argentina) and least (Norway) mobile countries in our sample.
CORRELATES OF MOBILITY ACROSS MUNICIPALITIES
We next examine the correlates of the mobility differences across Swedish municipalities. Although local determinants of mobility may differ from those that determine mobility at the national level, a local analysis is still likely to be informative about underlying drivers. To this end, we estimate a series of OLS regressions:
where M m is the absolute or relative mobility in municipality m, and C m corresponds to municipality-level proxies for the four explanations: growth and industrialization, fertility, human capital, and migration. Throughout the analysis, we control for a vector of municipality-level characteristics Xm measured in 1880: log population size, the share employed across the four occupational groups, and the share living in urban areas.
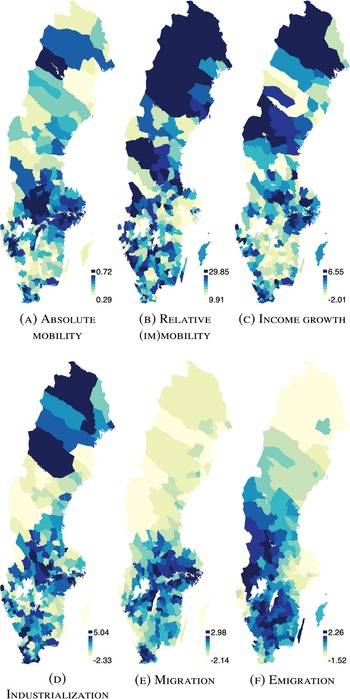
GEOGRAPHY OF OPPORTUNITY AND CORRELATES OF INTERGENERATIONAL MOBILITY
Notes: Maps display the spatial distribution of mobility and other characteristics across 282 municipalities. A: absolute mobility (the share of sons that transition into a different occupation than their father). B: Altham d(P, I) statistics that capture the distance from the case of full mobility where a larger statistic corresponds to less mobility. C: ln average changes in incomes between 1880 and 1910. D: changes in the share employed in manufacturing between 1880 and 1910. E: the share of sons that migrate out of each municipality between 1880 and 1910. F: the share of sons in each municipality that emigrated between 1880 and 1910. In C–F the variables are standardized to have a mean 0 and a standard deviation (SD) of 1. Each variable is divided into nine equal-sized bins where darker shades correspond to higher values.
Source: See Data section for information about data sources.

GEOGRAPHIC DIFFERENCES IN ABSOLUTE AND RELATIVE (IM)MOBILITY
Notes: Panel A displays a kernel density distribution of absolute mobility rates across Swedish municipalities, while panel B presents a similar density plot of municipality-level Altham d(P, I) statistics. Also shown as vertical lines in both panels are the country-level absolute mobility rates and Altham statistics d(P, I) from Figure 1.
Source: See Data section for information about data sources.

We use several proxies for growth and industrialization. First, we calculate changes in population and the share of the population that resides in urban areas from the 1880 and 1910 censuses. Second, we calculate the average income in each municipality in 1880 and the changes between 1880–1910 among all adult employed men.Footnote 16 Third, we measure industrialization as the share of adult males employed in manufacturing from the 1880 and 1910 population censuses. To measure local differences in fertility and the provision of (primary) schooling, we rely on the 1880 census to calculate the average number of children per woman (aged 20–45), and the ratio of the number of school teachers to the number of school-age children in each municipality. Rates of internal migration and emigration between 1880–1910 are based on our linked sample of sons.
Table 2 reports OLS estimates of Equation (1).Footnote 17 To facilitate interpretation, we standardize all independent variables to have a mean of 0 and a standard deviation (SD) of 1. Throughout, all regressions are weighted by the municipality populations in 1880 and standard errors are clustered at the county level to allow for spatial correlation across municipalities.
We first consider the role of local growth and industrialization in accounting for local mobility patterns. Columns (1) and (6) in Table 2 show that changes in population and urbanization are at best weakly correlated with absolute and relative mobility across municipalities. Similarly, the link between income growth and absolute and relative mobility is weak (Columns (2) and (7)). In contrast, Column (3) documents an association between industrialization (i.e., changes in the share employed in manufacturing) and absolute mobility, though not with relative mobility (Column (8)).Footnote 18 However, the association is relatively small in magnitude: a 1 SD increase in industrialization is associated with a 2.4 percentage point increase in absolute mobility. Similarly, fertility differences or the local provision of human capital are not correlated with either absolute or relative mobility (Columns (4) and (9)). While these proxies may not fully capture the many ways that fertility and human capital could shape mobility patterns, the lack of a clear link is consistent with the ambiguous pattern across countries.
A potential explanation for the relatively weak link between local economic development and mobility patterns is that we allocate sons to their municipality of residence in childhood (i.e., 1880). Thus, we are effectively asking whether sons that grew up in more rapidly expanding areas experienced higher mobility rates, irrespective of whether they remain in that location as adults following work that emphasizes the role of childhood environments in shaping mobility outcomes (Chetty et al. Reference Chetty, Hendren, Kline and Saez2014). However, recent evidence suggests that childhood environments may have been less relevant a century ago, while the local labor market one resides in mattered more (Tan Reference Tan2023). Indeed, Table 2, Column (5), shows stronger associations between absolute mobility and growth in population and the share employed in manufacturing when instead allocating sons to their municipality of residence as adults in 1910.Footnote 19 These estimates suggest a relatively larger role for local labor markets, which in turn hints that migration may have been an important lever to take advantage of opportunities in other parts of the country.
ABSOLUTE AND RELATIVE (IM)MOBILITY ACROSS MUNICIPALITIES, 1880–1910

Notes: Municipality-level OLS regressions. When estimating absolute and relative mobility rates, we allocate sons to the municipality where they resided in childhood (i.e., in 1880) except in Columns (5) and (10) where children are allocated to their municipality of residence in adulthood (i.e., in 1910). All right-hand-side variables are standardized to have mean 0 and a SD of 1. Municipality controls include the ln of population, occupational shares (white collar, farmers, skilled/semi-skilled, and unskilled), and the share living in urban areas, all measured in 1880. Robust standard errors clustered at the county level are given in parentheses. *** p < 0.01, ** p < 0.05, * p < 0.1.
Source: See Data section for information about data sources.
Migration flows are indeed highly correlated with both absolute and relative mobility levels across municipalities. Table 2 shows that the fraction who migrates out of a municipality is robustly associated with both absolute and relative mobility (Columns (4) and (8)).Footnote 20 Moreover, the association between internal migration and absolute mobility is relatively large: a 1 SD increase in the share of the population that migrates predicts a 5.5 percentage point increase in absolute mobility or a decline in the Altham d(P, I) statistic of 1.7, both of which correspond to about one-tenth of the sample mean. In contrast to internal migration, higher emigration rates are associated with lower levels of absolute mobility and higher levels of intergenerational persistence (Columns (4) and (8)), which suggests that emigrants mainly left stagnating places.
Migration, Growth, and Occupational Mobility
Internal migration flows could have enhanced mobility prospects if migrants “moved to opportunity,” in the sense that they left less mobile places for those that provided more opportunities. Figure 6 shows that the inflow of migrants was indeed much higher in areas characterized by higher levels of absolute and relative mobility.Footnote 21 A similar pattern emerges when one instead considers the rate of income growth or industrialization in migrants’ destinations (Online Appendix Figure D.9), which underscores that migrants sought out more dynamic locations. Yet, while migration flows were directed at more mobile and rapidly developing areas, it is an open question whether migrants also experienced higher rates of occupational mobility.
MIGRANTS MOVED TO MORE MOBILE PLACES
Notes: These figures display the share of in-migrants to a municipality between 1880–1910 and the level of absolute and relative mobility. We define in-migration as the share of sons in a municipality in 1910 that did not reside in that municipality in childhood. When estimating mobility rates, we allocate children to their municipality of residence in childhood (i.e., in 1880). To construct each figure, we group all municipalities into 25 equal-sized bins based on their level of absolute or relative mobility where dots denote the mean migrant inflow in each bin. Also shown is a best-fit line estimated from the underlying (ungrouped) data.
Source: See Data section for information about data sources.

To bolster the evidence of a link between migration and occupational mobility, we leverage our linked father-son data. We estimate OLS regressions of the following form:
where y i is an indicator taking the value 1 if an individual i experienced absolute mobility (i.e., is observed in a different occupation than his father); M i is an indicator capturing whether an individual is observed in a different municipality in adulthood (in 1910) compared to their municipality of residence in childhood (in 1880). In the baseline regressions, we control for a set of household characteristics (X).Footnote 22 Estimates of d, however, may partly be driven by selection into migration of more (or less) mobile individuals. To address selection issues, we add a set of household fixed effects and identify the returns to migration by comparing migrant brothers to those that stayed behind, thus effectively eliminating all selection due to factors that vary across households.
GEOGRAPHIC AND OCCUPATIONAL MOBILITY, 1880–1910: INDIVIDUAL-LEVEL ESTIMATES

Notes: Individual-level OLS regressions. Migrant is an indicator taking the value 1 if an individual is observed in a different municipality in 1910 compared to 1880. The other migration indicators take the value 1 if an individual moved between municipalities from, for example, a rural to (non-)urban municipality. Sample restricted to households with at least two (linked) sons in Columns (2)–(6). Columns (3) and (4) further limits the sample to sons that in 1880 resided in a rural or urban location, while Columns (5) and (6) limits the sample to sons that in 1880 resided in municipalities above and below the median in terms of absolute mobility. Robust standard errors clustered at the 1880 household level are given in parentheses. *** p < 0.01, ** p < 0.05, * p < 0.1.
Source: See Data section for information about data sources.
Table 3 documents a strong positive link between geographic and occupational mobility. Column (1) shows that individuals who moved between municipalities between 1880–1910 were 17 percentage points more likely to transition into a different occupation than their father. In Column (2), we include household fixed effects showing that migrant brothers were 15 percentage points more likely to change occupation compared to their brother(s) that stayed behind.Footnote 23 Migration was thus an important avenue for occupational mobility, though we cannot completely rule out that sons who moved were inherently more mobile than those who stayed behind.Footnote 24
Migrants were more likely to improve on their brothers’ mobility outcomes when leaving rural or less dynamic places. Table 3, Columns (3) and (4) show that there is at best a weak link between migration among sons born in urban areas and mobility, while there is a large and positive association among those born in rural areas, particularly among those moving from the countryside to a city. Similarly, migrants that left less mobile places experienced particularly high rates of absolute mobility (Columns (5) and (6)).Footnote 25
In sum, differences in mobility rates within Sweden were shaped by migration flows in response to uneven patterns of growth and industrialization. Migration was an important lever to achieve mobility, particularly for children that moved away from less dynamic rural regions to the city. While the factors that shape local differences in mobility may differ from those that determine national mobility patterns, the fact that these geographic differences are broadly consistent with cross-country patterns described previously offers suggestive evidence of the historical drivers of mobility.
CONCLUSIONS
The notion that the United States historically enjoyed significantly higher rates of social mobility than Europe has persisted for nearly two centuries. We challenge this view by showing that nineteenth-century Sweden exhibited high levels of social mobility, in some respects similar to that observed in the Americas. Two factors appear central in understanding the mobility variation both across countries and within Sweden: economic growth and migration. Indeed, we mainly attribute Sweden’s high mobility rates to its high rates of internal migration and it being one of the most rapidly growing economies in Europe prior to WWI.
Our reading of the evidence suggests that there was nothing “exceptional” about American mobility in the nineteenth century: its generally higher mobility rates arguably reflected prevailing economic conditions at the time rather than deep-seated cultural differences, as has been assumed by contemporary and later observers. European countries that approached the rate of growth and geographic dynamism observed in the Americas also appear to have converged toward their high levels of social mobility.


 Open access