


PPAR-α, PPAR-γ and PPAR-β/δ, which are a sub-class of the nuclear hormone receptor superfamily, represent potential molecular targets to prevent metabolic disorders associated with lipid metabolism, glucose metabolism (particularly PPAR-γ) and immune function (i.e. have anti-inflammatory potential)(Reference Bragt and Popeijus1). In non-ruminants, and particularly in rodents, PPAR-α is highly expressed in the liver and has a pivotal role in increasing the oxidation of long-chain fatty acids (LCFA)(Reference Kumamoto and Ide2, Reference Desvergne, Michalik and Wahli3). A beneficial role of PPAR-α in reducing fatty liver and overall liver inflammatory response has been demonstrated in mice(Reference Jay and Ren4–Reference Zandbergen and Plutzky6).
From a practical standpoint, the prevention of fatty liver in peripartal dairy cows, with the associated metabolic issues (e.g. ketosis), is without doubt a priority in order to prevent impairment in performance(Reference Drackley7). Fatty liver in peripartal cows is caused by the surge of NEFA as a consequence of a marked negative energy balance(Reference Drackley7). Based on the data on rodents, it has been proposed(Reference Drackley7) that activation of PPAR-α could improve the overall capacity of the peripartal bovine liver to oxidise LCFA, thus preventing fatty liver. Except for few preliminary data(Reference Loor, Dann and Everts8–Reference Litherland, Wallace and Bionaz12) there is a lack of information available on the regulation of PPAR activity in ruminant cells or tissues.
The activity of PPAR in non-ruminants is modulated by LCFA. The potency of inducing transcription through PPAR activation varies among the types of LCFA(Reference Bragt and Popeijus1) and it is dose-dependent(Reference Wolfrum, Borrmann and Borchers13). Other than preliminary evidence of an effect of LCFA on ruminant PPAR activation(Reference Bionaz, Baumrucker and Shirk10, Reference Thering, Bionaz and Loor11), the transcriptomics effects associated with specific LCFA, both dietary and rumen-derived saturated and unsaturated, remain relatively unknown.
The specific objectives of the present study were to (1) find reliable bovine PPAR-α targets among key metabolic genes (mostly established PPAR-α target genes in non-ruminants) after treatment with Wy-14 643 (WY; a potent specific PPAR-α agonist in bovine endothelial cells(Reference Goya, Sumitani and Xu14, Reference Hayashida, Kume and Minami15)); (2) test the effect of several LCFA on PPAR-α activation by measuring the expression of the bovine-specific PPAR-α genes and (3) investigate LCFA-specific effects, besides PPAR-α activation, on networks among the genes measured.
Materials and methods
Fatty acid preparation, cell culture and treatments
Treatments included WY (270-198-M010, Alexis Biochemicals, Lausen, Switzerland), palmitic acid (16 : 0; N-16-A, Nu-Chek Prep, Inc., Elysian, MN, USA), stearic acid (18 : 0; N-18-A, Nu-Chek Prep, Inc.), oleic acid (cis9–18 : 1; 1022, Matreya, Pleasant Gap, PA, USA), trans10–18 : 1 (provided by Dr R. A. Erdman, University of Maryland, College Park, MD, USA), vaccenic acid (trans11–18 : 1; U-49-A, Nu-Chek Prep, Inc.), linoleic acid (18 : 2; 215040050, Acros Organics, Morris Plains, NJ, USA), rumenic acid (c9, t11CLA; no. 1245, Matreya), trans10, cis12–18 : 2 (t10, c12CLA; no. 1249, Matreya), α-linolenic acid (18 : 3; no. 302820010, Acros Organics), phytanic acid (20 : 0; no. 1195, Matreya), EPA (20 : 5n-3; no. N-20-A, NuChek Prep, Inc.) and DHA (22 : 6n-3, no. 90 310, Cayman Chemical Company, Ann Arbor, MI, USA). Fatty acids were saponified using an equimolar concentration of NaOH and dissolved in a final solution of 95 % ethanol to obtain a stock concentration of 30 mm. WY was dissolved in 95 % ethanol.
Preliminary data demonstrated that Madin–Darby Bovine kidney cells (MDBK) are a suitable in vitro model to test PPAR activation(Reference Bionaz, Baumrucker and Shirk10, Reference Thering, Bionaz and Loor11). The MDBK cells were obtained from ATCC (CCL-22, Manassas, VA, USA) at passage 110. A previous investigation was conducted to characterise them and to set optimal conditions for the present study(Reference Thering, Bionaz and Loor11). The results from the previous investigation indicated 6 h of incubation, use of LCFA not bound to albumin and addition of insulin to the culture were the best conditions to measure maximal expression of most genes of interest. Based on another preliminary study(Reference Bionaz, Baumrucker and Shirk10), the present study was performed using 150 μm each of LCFA and WY in order to directly compare the potency in the activation of gene expression among treatments. All treatments were administered in HyQ® Minimum Essential Media/Earle's Balanced Salts (MEM/EBSS; no. SH30024·02, HyClone, Logan, UT, USA) without fetal bovine serum and containing bovine insulin (5 mg/l; no. 1882, Sigma, St Louis, MO, USA). In addition, an ethanol control (CTR) to account for the ethanol effect (5 ml/l) and only media were run. All treatments were run in triplicate. After 6 h incubation the cells were harvested in 1 ml TRIzol® reagent (Invitrogen, Carlsbad, CA, USA) and immediately stored at − 80°C until RNA extraction.
Transcripts measured
The description, main function(s) and sub-cellular location of the products of the genes of interest are reported in Table S1 (additional file 1, available online at http://www.journals.cambridge.org/bjn). Those genes were chosen partly because of their potential as targets of PPAR-α in non-ruminant species, as highlighted by Fig. S1 (additional file 1, available online at http://www.journals.cambridge.org/bjn) and based on key functions in LCFA uptake and trafficking (e.g. CD36 molecule (CD36), fatty acid binding protein 3 (FABP3)), LCFA oxidation (e.g. acyl-coenzyme A oxidase 1 (ACOX1), carnitine palmitoyltransferase 1A (CPT1A)), TAG synthesis (e.g. stearoyl-CoA desaturase (SCD), lipin 1 (LPIN1)), cholesterol synthesis (e.g. 3-hydroxy-3-methylglutaryl-coenzyme A reductase (HMGCR)), gene transcription (e.g. sterol regulatory element binding transcription factor 1 (SREBF1)), gluconeogenesis (pyruvate carboxylase (PC)) and immune response (including acute-phase reaction) (e.g. IL6, haptoglobin (HP)). We also characterised the response to LCFA of isoforms of novel genes, which have been demonstrated to be crucial in bovine mammary TAG synthesis(Reference Bionaz and Loor16) and are targets(Reference Durgan, Smith and Hotze17) or co-activators(Reference Phan, Peterfy and Reue18, Reference Finck, Gropler and Chen19) of non-ruminant PPARα (acyl-CoA synthetase long-chain family member and lipin isoforms, respectively).
Additional materials and methods
The details of RNA extraction and quantitative real-time RT-PCR (qPCR), relative mRNA abundance between measured transcripts, network development using Ingenuity Pathway Analysis® (Ingenuity Systems Inc., Redwood City, CA, USA) and hierarchical clustering among genes and treatments are reported in additional file 1 (supplementary material available online http://www.journals.cambridge.org/bjn). qPCR performance and primer features are reported in Tables S2 and S3 (additional file 1, available online at http://www.journals.cambridge.org/bjn).
Minimum Information for publication of Quantitative real-time PCR Experiments (MIQE) compliance of quantitative real-time RT-PCR data
The qPCR data with all available information have been submitted as an Real-time PCR Data Markup Language (RDML)(Reference Lefever, Hellemans and Pattyn20) file and, except for RNA integrity, all the other information required by the MIQE guideline(Reference Bustin, Benes and Garson21) are provided in the main paper or in additional file 1 (supplementary material available online at http://www.journals.cambridge.org/bjn).
Statistical analysis
qPCR-normalised data are presented as log2-transformed fold-change relative to CTR. In earlier statistical analysis all data were transformed as fold-change relative to CTR and log2 transformed to normalise the data, to minimise the effects of the outliers and to prevent a bias towards the treatments with extremely large effects. The presence of possible outliers was assessed by PROC REG of SAS (SAS Institute Inc., Cary, NC, USA, release 9.0) on log2-transformed data and data points with studentised residuals ≥ 2·5 were considered outliers and excluded from the analysis. This final data set was analysed using a generalised linear model (GLM). Treatment was considered as a fixed effect and replicate as a random effect. The multiple comparisons were corrected using Tukey's test. Significance was declared at P-corrected ≤ 0·05 for all comparisons. Pearson's correlation analysis was run using the PROC CORR procedure of SAS.
Peroxisome proliferator-activated receptor response element and three-dimensional structure modelling analyses
In order to uncover the potential PPAR response element (PPRE) in the sequence (promoter+coding sequence) of the measured genes we used the software RESearch(Reference Heinaniemi, Uski and Degenhardt22). To evaluate the similarity of three-dimensional structure of PPAR-α between species and between PPAR isotypes we used the Swiss-Pdb Viewer(Reference Guex and Peitsch23). Both methodologies are described in detail in additional file 1 (supplementary material available online at http://www.journals.cambridge.org/bjn).
Results and discussion
Bovine PPAR-α target genes
Among several methods available to assess the activity of PPAR-α, e.g. through firefly luciferase reporter, the use of well-established agonists is a reliable and easy, albeit indirect, alternative. In all mammalian cells tested to date(Reference Rakhshandehroo, Hooiveld and Müller24), including bovine(Reference Goya, Sumitani and Xu14, Reference Hayashida, Kume and Minami15), WY has been demonstrated to be a potent PPAR-α activator and a weak PPAR-γ activator(Reference Lehmann, Lenhard and Oliver25). We used WY as positive CTR in the present study.
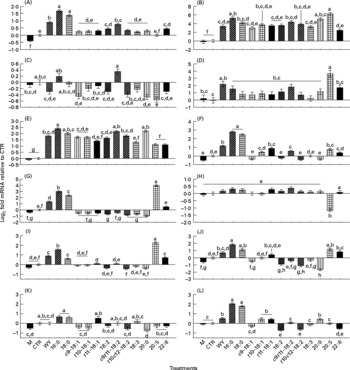
Figs. S1 and S2 (additional file 1, available online at http://www.journals.cambridge.org/bjn) report the percentage of abundance among the measured genes and the known networks among all the genes measured. The networks generated using both the Ingenuity Pathway Analysis Knowledge Base and previous reports(Reference Mandard, Muller and Kersten26–Reference van der Meer, Degenhardt and Vaisanen28) encompass fifteen out of thirty genes measured in the present study, whose expression has been demonstrated to be specifically under control of PPAR-α (i.e. these are downstream PPAR-α target genes). Among the fifteen known PPAR-α target genes in the non-ruminants that we tested, nine genes including ACSL1, ACSL3, ANGPTL4, CD36, CPT1A, FABP4, LPIN1, SCD and SREBF1 were significantly up-regulated by treatment with WY (Figs. 1 and 2 and summary in Fig. 3) confirming they also are PPAR-α targets in bovines (bold arrows in Fig. 3). Among the remaining PPAR-α target genes reported in non-ruminants, FABP3, DBI, ACOX1 and UCP2 were not significantly affected by WY and HMGCS1 had only a numerical increase in expression (Fig. 3). In addition, in non-ruminants, PPAR-α controls the expression of its own gene (i.e. PPARA)(Reference Mandard, Muller and Kersten26, Reference Pineda Torra, Jamshidi and Flavell29). Our data clearly indicated that 6 h incubation with WY did not affect PPARA expression (Fig. 2). These data support previous results from a 24 h time-course experiment using MDBK cells(Reference Thering, Bionaz and Loor11). Expression of SPP1 and LPIN3 appeared to be induced by WY (Table 1 and Fig. 2) but they have not been previously reported to be PPAR-α targets; thus, they can be considered putative bovine-specific PPAR-α targets (dashed lines in Fig. 3).
Effect of 150 μm of Wy-14 643 (WY) or several long-chain fatty acid (LCFA) treatments for 6 h on the expression of selected genes related to lipid metabolism. Mean values with unlike letters were significantly different (P < 0·05; Tukey's corrected). (A) ACSL1, acyl-coenzyme A synthetase long-chain family member 1; (B) CD36, fatty acid translocase CD36 molecule (thrombospondin receptor); (C) FABP3, fatty acid-binding protein 3; (D) FABP4, fatty acid-binding protein 4; (E) CPT1A, carnitine palmitoyltransferase 1A; (F) SCD, stearoyl-coenzyme A desaturase; (G) LPIN1, lipin 1; (H) DGAT1, diacylglycerol-O-acyltransferase homolog 1; (I) HMGCR, 3-hydroxy-3-methylglutaryl-coenzyme A reductase; (J) HMGCS1, 3-hydroxy-3-methylglutaryl-coenzyme A synthase 1 (soluble); (K) SREBF2, sterol regulatory element-binding transcription factor 2; (L) SREBF1, sterol regulatory element-binding transcription factor 1. M, media; CTR, control (ethanol).
Effect of 150 μm of Wy-14 643 (WY) or several long-chain fatty acid (LCFA) treatments for 6 h on the expression of selected genes related to PPARα signalling and immune response. Mean values with unlike letters were significantly different (P < 0·05; Tukey's corrected). (A) PPARA, PPAR alpha; (B) PPARGC1A, PPAR gamma coactivator 1-α; (C) ANGPTL4, angiopoietin-like 4; (D) PC, pyruvate carboxylase; (E) IL6; (F) HP, haptoglobin; (G) SAA3, serum amyloid A 3; (H) SPP1, secreted phosphoprotein 1. M, media; CTR, control (ethanol).

Networks generated with Ingenuity Pathway Analysis® (IPA) among all genes measured with information from the IPA Knowledge Database (IKB; i.e. all known interactions) (last updated November 2009). The genes are denoted by objects and the letters along the arrows denote the type of effect (activation (A), effects on gene expression (E), protein–protein interactions (PP), protein–DNA interactions (PD), inhibition (I), RNA binding (RB), effect on translation (T) and effect on localisation (LO)). Black shade objects fill denotes up-regulation of the gene with Wy-14 643 treatment relative to control. Genes have been grouped based on main biological function. The bold arrows highlight the downstream targets genes of PPARα uncovered by using the IKB (ACOX1, ACSL1, ANGPL4, CD36, CPT1A, DBI, FABP3, FABP4, HMGCS1, PPARA, SCD and UCP2) and additional published targets such as ACSL3 and SREBF1 (Reference Rakhshandehroo, Hooiveld and Müller24), HMGCR (Reference van der Meer, Degenhardt and Vaisanen28) and LPIN1 (Reference Reue and Zhang30), which overlap with results of our analysis after treatment with Wy-14 643 for 6 h (i.e. similar between non-ruminants and bovine). In dotted lines are highlighted the PPARα target genes uncovered by using the IKB which were not confirmed by our data. In dashed lines are highlighted positive effect of Wy-14 643 on expression of SPP1 and LPIN3. Those genes were not recognised in IKB or were not previously published to be PPARα target genes (i.e. novel and bovine-specific PPARα target genes). The link between PPARA and HMGCS1 uncovered by IPA is actually referring to the link between PPARA and HMGCS2; however, in rat hepatocytes, HMGCS1 appears to be a PPARα target gene(Reference Tamura, Ono and Miyagishima27). LCFA, long-chain fatty acid; ANGPTL4, angiopoietin-like 4; SPP1, secreted phosphoprotein 1; HP, haptoglobin; SAA3, serum amyloid A 3; SOD1, superoxide dismutase 1; CD36, CD36 molecule; FABP3 and 4, fatty acid-binding protein 3 and 4; DBI, diazepam binding inhibitor; ACSL1, acyl-coenzyme A synthetase long-chain family member 1; ACOX1, acyl-coenzyme A oxidase 1; CPT1A, carnitine palmitoyltransferase 1A; ACSL3, 4, 5, and 6, acyl-coenzyme A synthetase long-chain family member 3, 4, 5 and 6; UCP2, uncoupling protein 2; SCD, stearoyl CoA desaturase; LPIN1, 2 and 3, lipin 1, 2 and 3; DGAT1, diacylglycerol-O-acyltransferase homolog 1; HMGCR, 3-hydroxy-3-methylglutaryl-coenzyme A reductase; HMGCS1, 3-hydroxy-3-methylglutaryl-coenzyme A synthase 1; PC, pyruvate carboxylase; SREBF1 and 2, sterol regulatory element binding transcription factor 1 and 2; PPARA, PPAR alpha; PPARGC1A, PPAR gamma coactivator 1-α.

Effect of 150 μm treatment with Wy-14 643 (WY) or long-chain fatty acids for 6 h on the expression of genes not reported in Figs. 1 and 2

a,b,c,d,e,f Mean values within a row with unlike superscript letters were significantly different (P < 0·05, Tukey's corrected).
ACOX1, acyl-coenzyme A oxidase 1; ACSL3, 4, 5, and 6, acyl-coenzyme A synthetase long-chain family member 3, 4, 5 and 6; DBI, diazepam binding inhibitor (GABA receptor modulator, acyl-coenzyme A binding protein); LPIN2 and 3, lipin 2 and 3; SOD1, superoxide dismutase 1, soluble; UCP2, uncoupling protein 2 (mitochondrial, proton carrier); CTR, control.
Among the fifteen known PPAR-α target genes in non-ruminants (Fig. 3), ten (approximately 67 %) were confirmed to be PPAR-α target genes in MDBK cells. A comparison with other studies where hepatocytes from mice, humans or rats were treated with WY(Reference Rakhshandehroo, Hooiveld and Müller24, Reference Tamura, Ono and Miyagishima27) (see additional file 1 for detailed discussion, supplementary material for this article can be found at http://www.journals.cambridge.org/bjn) revealed some overlap in response but a greater sensitivity of MDBK to WY compared with non-ruminant hepatocytes. Ligand-induced activation of PPAR-α in non-ruminants, especially in rodents, leads to altered expression of many genes associated with fatty acid oxidation as well as other liver-specific functions(Reference Desvergne, Michalik and Wahli3, Reference Rakhshandehroo, Hooiveld and Müller24, Reference Mandard, Muller and Kersten26). In this regard, besides the lack in response of ACOX1, our data in MDBK suggest a potential increase in the capacity for LCFA oxidation through greater LCFA entry and transport into cytoplasm (⇑CD36, ⇑FABP4 and ⇑ACSL1) as well as mitochondria (⇑CPT1A; Figs. 1 and 3), all data that appear to support the findings in non-ruminants. In addition, our data suggest that some of the steps leading to the synthesis of TAG and cholesterol are under the control of PPAR-α (Fig. 3). The control of the expression of the genes related to desaturation, as well of LPIN1 (Reference Reue and Zhang30), by PPAR-α in mouse liver has been reported previously(Reference Mandard, Muller and Kersten26, Reference Wang, Botolin and Xu31), but there are no reports, to our knowledge, of an increased amount of intra- or extra-cellular quantity of TAG via the activation of PPAR-α. We recognise that the increase in the expression of one or few genes in a pathway would probably not increase the total metabolic flux, as discussed previously(Reference Bionaz and Loor16, Reference Morandini, Salamini and Gantet32). However, the induction of lipogenesis as a consequence of PPAR-α activation seems more supported by the increase in SREBF1 expression, which is a well-established regulator of lipid synthesis in non-ruminants (particularly de novo LCFA synthesis)(Reference Horton33). The increase in expression of this gene after treatment with WY also has been observed in mouse and human hepatocytes(Reference Rakhshandehroo, Hooiveld and Müller24, Reference van der Meer, Degenhardt and Vaisanen28). The biological meaning of this is not apparent, but reinforces previous findings from our laboratory using bovine mammary cells, where it was evident that activation of PPARγ after 6 h of treatment with rosiglitazone increased SREBF1 expression approximately twofold(Reference Kadegowda, Bionaz and Piperova34). Overall, it appears that bovine SREBF1 is under control of PPAR isotypes. We cannot exclude that the increase in expression of SREBF1 in the present study was due to a partial activation of PPARγ by WY(Reference Lehmann, Lenhard and Oliver25). However, recent data in HepG2 cells appear to support the idea that PPARα through cross-talk with SREBP signalling(Reference van der Meer, Degenhardt and Vaisanen28) controls lipid and cholesterol synthesis.
To evaluate a potential relationship between PPRE and genes responsive to WY, we conducted an in silico analysis that provided number, location and strength of PPRE in the sequence of all measured genes(Reference Heinaniemi, Uski and Degenhardt22). The analysis of PPRE (see Tables S6 and S7, Figs. S3 and S4 and relative results and discussion in additional file 1, supplementary material for this article can be found at http://www.journals.cambridge.org/bjn) provided some support for the gene expression data as reflected by the fact that we found a greater percentage of medium-strong PPRE in genes affected by WY compared with the non-WY-sensitive genes (additional files 2 and 3, supplementary material for this article can be found at http://www.journals.cambridge.org/bjn). However, the in silico approach for the prediction of PPAR target genes in bovines appears to be weak. The system used to evaluate the PPRE in the selected genes was developed for non-ruminants(Reference Heinaniemi, Uski and Degenhardt22) and a difference in PPRE response between non-ruminant species has been demonstrated for ACOX1 (Reference Lambe, Woodyatt and Macdonald35, Reference Rodriguez, Noe and Cabrero36). An interesting outcome from the PPRE analysis was the finding of a PPRE in bovine SPP1. This gene has not been reported to be a PPAR-α target in non-ruminants but, rather, its expression is down-regulated by the activation of both PPAR-α(Reference Lee, Banerjee and Ueno37) and PPAR-γ(Reference Oyama, Akuzawa and Nagai38). However, those results were not confirmed by transcriptomics analysis in mice, humans(Reference Rakhshandehroo, Hooiveld and Müller24) or rats(Reference Tamura, Ono and Miyagishima27), where SPP1 expression was unchanged after WY treatment. PPRE analysis in bovines clearly showed that this gene presents, uniquely among all measured genes, only two medium-strength PPRE for PPAR-α located far up-stream relative to the transcription start site (probably considered distal) but none, except a weak PPRE, for the other two PPAR isotypes (Fig. S3 in additional file 1, supplementary material for this article can be found at http://www.journals.cambridge.org/bjn). Together, with the gene expression results (Fig. 2), these data strongly support the notion that bovine SPP1 is a specific target gene of PPAR-α in bovines.
We conducted an alignment and three-dimensional structure analyses of the PPAR-α proteins with the purpose of evaluating the potential differences in PPAR-α response to WY observed between the species (see above). The conservation of amino acid sequence of PPAR-α proteins between mice, humans and bovines is >90 %, with 100 % conservation in the DNA-binding domain, which interacts with the PPRE (Table S8 in the additional file 1, supplementary material for this article can be found at http://www.journals.cambridge.org/bjn). The remarkable degree of homology at the protein level is indicative of a high degree of functional conservation, which in turn suggests that bovine PPAR-α should be able to bind to non-ruminant PPRE. This has been clearly demonstrated by the successful activation of a luciferase construct with rat acyl-CoA oxidase PPRE in bovine cells(Reference Forman, Tontonoz and Chen39). The sequence homology of the ligand-binding domain, which constitutes the pocket for the entry and binding of agonists, is >90 % conserved between the three species, with almost 98 % conservation between bovines and humans (Table S8·2 in additional file 1, supplementary material for this article can be found at http://www.journals.cambridge.org/bjn), but the differences observed with the three-dimensional protein structure of the ligand-binding domain (Figs. S5–S9 and related results and discussion in additional file 1, supplementary material for this article can be found at http://www.journals.cambridge.org/bjn) appear to shed some light on the varying response of mice and bovines to PPAR-α agonists despite the high degree of conservation of the primary structure. The data indicated a larger and more neutral ligand pocket in bovine compared with mouse PPAR-α. Detailed molecular analyses will have to be performed to determine the specific consequences of the observed differences but might explain the contrast in WY response between species and the poor agreement between the PPRE analysis and our gene expression data.
Overall, our data confirm that MDBK, and by inference other bovine cells, respond to PPAR-α agonists and suggest, based on the thirty genes measured, a peculiar landscape in the transcriptomics response to WY in this species compared with non-ruminants. Even though the gene expression landscape was different between bovines and non-ruminants, the activation of PPAR-α appears to strongly control lipid metabolism as in non-ruminants.
Long-chain fatty acids effect on PPARα activation
It has been well established in non-ruminants that PPAR are able to bind, and thus are activated by, LCFA. In addition, LCFA are capable of increasing the expression of PPARA, as has been shown by treatment of human hepatocytes with 150 μm of 16 : 0(Reference Swagell, Henly and Morris40). In non-ruminant species, unsaturated LCFA are more potent agonists of PPAR isotypes than saturated LCFA(Reference Kliewer, Sundseth and Jones41–Reference Larter43). The larger degree of PPAR activation in rodents by polyunsaturated compared with saturated LCFA has been well established(Reference Bragt and Popeijus1).
Our gene expression data (Figs. 1 and 2) summarised by the gene networks for each single LCFA treatment (Figs. 3–5 and S10–S18 in additional file 1, supplementary material for this article can be found at http://www.journals.cambridge.org/bjn) suggested that all LCFA elicited their effects partly through the activation of PPARα (i.e. up-regulated genes positively affected by WY). The same analyses support a greater degree of PPAR-α activation by saturated compared with unsaturated LCFA.
Gene networks encompassing all genes measured that were affected by the saturated long-chain fatty acids (LCFA) 16 : 0 and 18 : 0. The expected biological outcome of those two LCFA considering the effect in expression of networks of genes measured would be an increase of lipid metabolism. This would occur by increasing uptake (CD36) and activation (ACSL1 and ACSL3) of LCFA, by increasing catabolism, particularly in the mitochondria through increase in LCFA transport (CPT1A), and anabolism, particularly synthesis of TAG (LPIN isoforms and SCD) and cholesterol (HMGCR and HMGCS1). Interestingly, the two saturated LCFA-activated expression of two transcription factors (TF) (PPARGC1A and SREBF1) involved in controlling expression of lipogenic genes and strongly activated expression of inflammatory response-related genes (IL6, SAA3, and HP) and signalling genes (SPP1 and ANGPTL4). The genes are denoted by objects and the letters along the arrows denote the type of effect (activation (A), effects on gene expression (E), protein–protein interactions (PP), protein–DNA interactions (PD), inhibition (I), RNA binding (RB), effect on translation (T) and effect on localisation (LO)). Black objects fill denote up-regulation of the gene relative to control. Genes have been grouped based on main functions. The bolded black lines highlight the downstream targets genes of PPARα (see Fig. 3). In dotted lines are highlighted genes responsive to Wy-14 643 but not to 16 : 0 and 18 : 0. In dashed lines are highlighted non-ruminants PPARα target genes which expression was up-regulated by 16 : 0 and 18 : 0 but not by Wy-14 643 treatment. ANGPTL4, angiopoietin-like 4; SPP1, secreted phosphoprotein 1; HP, haptoglobin; SAA3, serum amyloid A 3; SOD1, superoxide dismutase 1; CD36, CD36 molecule; FABP3 and 4, fatty acid-binding protein 3 and 4; DBI, diazepam binding inhibitor; ACSL1, acyl-coenzyme A synthetase long-chain family member 1; ACOX1, acyl-coenzyme A oxidase 1; CPT1A, carnitine palmitoyltransferase 1A; ACSL3, 4, 5, and 6, acyl-coenzyme A synthetase long-chain family member 3, 4, 5 and 6; UCP2, uncoupling protein 2; SCD, stearoyl CoA desaturase; LPIN1, 2 and 3, lipin 1, 2 and 3; DGAT1, diacylglycerol-O-acyltransferase homolog 1; HMGCR, 3-hydroxy-3-methylglutaryl-coenzyme A reductase; HMGCS1, 3-hydroxy-3-methylglutaryl-coenzyme A synthase 1; PC, pyruvate carboxylase; SREBF1 and 2, sterol regulatory element binding transcription factor 1 and 2; PPARA, PPAR alpha; PPARGC1A, PPAR gamma coactivator 1-α.

Gene networks encompassing all genes measured that were affected by EPA among all genes measured. The network analysis among measured genes indicated that treatment with EPA probably induced long-chain fatty acid (LCFA) oxidation in mitochondria, TAG and cholesterol synthesis, and production of signalling molecules; however, some of the genes involved in lipid metabolism were down-regulated (e.g. DGAT1 and ACSL5) as well PC and IL6, with a likely decrease in activation of IL6 network genes. In this regard, it was noteworthy the observed up-regulation of expression of HP, which probably indicates that expression of this gene was induced by EPA through a network not involving IL6. The genes are denoted by objects and the letters along the arrows denote the type of effect (activation (A), effects on gene expression (E), protein–protein interactions (PP), protein–DNA interactions (PD), inhibition (I), RNA binding (RB), effect on translation (T) and effect on localisation (LO)). Black objects fill denotes up-regulation and grey down-regulation of the gene relative to control. Genes have been grouped based on main functions. The bold lines highlight the downstream targets genes of PPARα that overlap with genes up-regulated by EPA treatment (see Fig. 3). In dashed lines are highlighted genes affected by EPA probably through other (putative) transcription factors (TF), among those all except HP were down-regulated and HMGCS1 was not up-regulated by Wy-14 643 but was up-regulated by EPA treatment. The dotted lines highlighted the lack of effect of EPA on ACSL1 and LPIN3, the only ruminant-specific PPARα target genes (see Fig. 3) no affected by EPA. ANGPTL4, angiopoietin-like 4; SPP1, secreted phosphoprotein 1; HP, haptoglobin; SAA3, serum amyloid A 3; SOD1, superoxide dismutase 1; CD36, CD36 molecule; FABP3 and 4, fatty acid-binding protein 3 and 4; DBI, diazepam binding inhibitor; ACSL1, acyl-coenzyme A synthetase long-chain family member 1; ACOX1, acyl-coenzyme A oxidase 1; CPT1A, carnitine palmitoyltransferase 1A; ACSL3, 4, 5, and 6, acyl-coenzyme A synthetase long-chain family member 3, 4, 5 and 6; UCP2, uncoupling protein 2; SCD, stearoyl CoA desaturase; LPIN1, 2 and 3, lipin 1, 2 and 3; DGAT1, diacylglycerol-O-acyltransferase homolog 1; HMGCR, 3-hydroxy-3-methylglutaryl-coenzyme A reductase; HMGCS1, 3-hydroxy-3-methylglutaryl-coenzyme A synthase 1; PC, pyruvate carboxylase; SREBF1 and 2, sterol regulatory element binding transcription factor 1 and 2; PPARA, PPAR alpha; PPARGC1A, PPAR gamma coactivator 1-α.

In the hierarchical clustering analysis considering data with statistical differences relative to CTR (Fig. 6), responses due to WY treatment clustered with all LCFA, particularly with saturated 16 : 0 and 18 : 0 (Fig. 6). Among all treatments EPA appeared to be the most different. The dendrogram (Fig. 6) highlighted both a remarkable similarity in effect among saturated LCFA on the measured genes and a clear separation with the unsaturated LCFA. In this regard, 20 : 0 was the LCFA with the most similar effect on the expression of the measured genes compared with unsaturated LCFA. Among the saturated LCFA, 16 : 0 and 18 : 0 clustered tightly together. The monounsaturated LCFA tended to cluster together as well as the non-conjugated and conjugated 18 : 2. The latter appeared to have an effect on the expression of the measured genes, which was more similar to saturated LCFA and WY than to the monounsaturated LCFA. Exogenous c9, t11-CLA clustered together with 20 : 0 and close to WY. Interestingly, if the cluster analysis was performed without considering the statistical difference in gene expression relative to CTR, exogenous WY did not cluster with the saturated LCFA (Fig. S19 in additional file 1, supplementary material for this article can be found at http://www.journals.cambridge.org/bjn) but, rather, with unsaturated LCFA and specifically with DHA. The correlation analysis (additional file 3, supplementary material for this article can be found at http://www.journals.cambridge.org/bjn) using both significant and non-significant outcomes seems to support a close relationship between WY and DHA. Even though the transcriptomics effect of all treatments correlated significantly, the lowest correlation was observed for 16 : 0 and 18 : 0 with other LCFA and WY. The clustering analysis among genes (Fig. 6) demonstrated a large similarity between the genes involved in LCFA entry into cells (CD36) and into the mitochondria (CPT1A). Interestingly, the two signalling molecules analysed (ANGPTL4 and SPP1) also tended to cluster together. No other functional clusters were observed among the measured genes.
Hierarchical clustering of gene expression data between treatments and between genes considering only data with significant differences relative to the control (CTR) using Genesis software(Reference Sturn, Quackenbush and Trajanoski64). Hierarchical cluster using all genes without considering the significance is reported in Fig. S19 in additional file 1 (supplementary material available online at http://www.journals.cambridge.org/bjn). The dendrogram allows visualisation of clusters of similarity in expression pattern between treatments (links denoted by the lines at the top of the figure) and between genes (links denoted by the lines at the left side of the picture). Log2 fold-change in expression relative to CTR are denoted by shades of black, increase; light grey-white, down-regulated; grey, no change relative to CTR according to the intensity bar at the top of the Fig. (refer to Table 1 and Figs. 1 and 2 for statistical differences). White dots denote the largest responses (up or down) in mRNA expression relative to CTR for each gene. CD36, CD36 molecule; ANGPTL4, angiopoietin-like 4; CPT1A, carnitine palmitoyltransferase 1A; SPP1, secreted phosphoprotein 1; LPIN1, lipin 1; FABP 4, fatty acid-binding protein 4; HMGCR, 3-hydroxy-3-methylglutaryl-coenzyme A reductase; SAA1, serum amyloid A 1; SCD, stearoyl CoA desaturase; SREBF1, sterol regulatory element binding transcription factor 1; ACSL1, acyl-coenzyme A synthetase long-chain family member 1; PPARGC1A, PPAR gamma coactivator 1-α; ACSL3, acyl-coenzyme A synthetase long-chain family member 3; HMGCS1, 3-hydroxy-3-methylglutaryl-coenzyme A synthase 1; LPIN3, lipin 3; HP, haptoglobin; LPIN2, lipin 2; ACSL4, acyl-coenzyme A synthetase long-chain family member 4; FABP3, fatty acid-binding protein 3; ACSL5, acyl-coenzyme A synthetase long-chain family member 5; PC, pyruvate carboxylase; DGAT1, diacylglycerol-O-acyltransferase homolog 1.
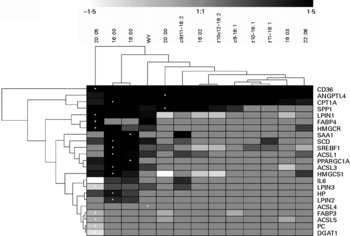
The hierarchical clustering underscored that the response to palmitic and stearic acids in MDBK was very similar to WY, suggesting those LCFA being the more potent PPAR-α agonists among the one tested; however, the gene expression data (with the sole exception of FABP4 and ANGPTL4) showed a stronger response for nearly all the PPAR-α target genes measured with the two saturated LCFA compared with WY. It is noteworthy that the expression of HMGCS1, which is a known PPAR-α target in non-ruminants, was only numerically up-regulated by WY (i.e. it is a weak PPAR-α target in ruminants), but was significantly up-regulated in response to the two saturated LCFA (Fig. 2). The apparently greater potency of saturated LCFA, particularly 16 : 0, to activate PPAR-α in MDBK has also been observed previously(Reference Bionaz, Baumrucker and Shirk10, Reference Thering, Bionaz and Loor11). Recently, we observed a larger response with saturated, namely 16 : 0, compared with a specific PPAR-γ agonist in increasing the expression of several putative PPAR-γ target genes in MacT cells(Reference Kadegowda, Bionaz and Piperova34). From a physiological point of view, those data appear to highlight a teleological evolutionary adaptation of these nuclear receptors in ruminants to greater availability of saturated rather than unsaturated LCFA. The major LCFA in ruminant blood under most circumstances are palmitic, stearic and oleic acid(Reference Leroy, Vanholder and Mateusen44). In addition, the lower response of PPAR-α in MDBK to polyunsaturated LCFA, with the exception of EPA, is meaningful considering the large degree of ruminal biohydrogenation of those LCFA in bovine(Reference Hess, Moss and Rule45). It is interesting from this point of view that, among unsaturated LCFA, the more potent activator of PPAR-α after EPA was c9, t11-CLA (Fig. S11 in additional file 1, supplementary material for this article can be found at http://www.journals.cambridge.org/bjn), which can accumulate in the rumen due to unsaturated lipid feeding(Reference Loor, Ferlay and Ollier46) or can be synthesised endogenously from vaccenic acid (another biohydrogenation intermediate) in tissues via the enzyme SCD(Reference Dhiman, Nam and Ure47). This LCFA is one of the most abundant conjugated 18 : 2 in the blood of dairy cows(Reference Loor, Ferlay and Ollier46) and the most abundant CLA in ruminant milk and meat(Reference Dhiman, Nam and Ure47).
The overall PPRE analysis (Table S7 in additional file 1, supplementary material for this article can be found at http://www.journals.cambridge.org/bjn), but especially the correlation analysis between gene expression and the in silico PPRE binding strength (additional file 3, supplementary material for this article can be found at http://www.journals.cambridge.org/bjn), does not provide evidence of greater potential for LCFA in bovine to activate PPAR-γ and PPAR-β/δ compared with PPAR-α. In non-ruminants, all three PPAR subtypes appear able to bind and be activated by LCFA(Reference Grimaldi48). Differences exist in non-ruminants in the binding capacity of the three PPAR isotypes, with α and β/δ being equally able to bind saturated and unsaturated LCFA while PPAR-γ appears to be more prone to binding polyunsaturated LCFA(Reference Grimaldi48). The PPRE analysis of the three bovine PPAR isotypes seems to indicate that the LCFA could have increased/decreased expression of measured genes also through PPAR-γ. This was surmised because its PPRE is the most abundant in the genomic sequences of the genes analysed (Table S7 and Fig. S4 in additional file 1, supplementary material for this article can be found at http://www.journals.cambridge.org/bjn). In this regard, PPAR-β/δ appears to be a weaker player and our data do not support a strong functional overlap with PPAR-α.
To evaluate the potential differences in LCFA binding in bovine cells, we have conducted an initial analysis of the three-dimensional structure of the ligand-binding domain of the three bovine PPAR isotypes (Fig. S20 in additional file 1, supplementary material for this article can be found at http://www.journals.cambridge.org/bjn) which does allow, with limitations, to make some inferences about the difference in binding capacity for LCFA between the three PPAR. In this regard, it was interesting from the three-dimensional images the apparent larger and more neutrally charged ligand pocket in PPAR-α compared with the other two PPAR isotypes, which is suggestive that it can accommodate larger and more neutral molecules (larger neutral carbon chain?) compared with other PPAR. The more negative charge in PPAR-γ and the very large positive charge in PPAR-β/δ also emerged as interesting characteristics of the differences among PPAR isotypes. As stated above, the in silico data have to be considered preliminary and in-depth molecular analyses (e.g. crystallography) are needed in order to uncover specific differences in the ligand-binding capacity between the three bovine PPAR isotypes.
Gene networks affected by long-chain fatty acids
Most of the measured genes, with the exception of ACOX1, ACSL4, ACSL6, DBI, SOD1 and UCP2, were significantly affected after treatment with one or more LCFA (Figs. 1 and 2 and Table 1). The saturated LCFA appeared to have had a larger effect on the expression of the measured genes compared with unsaturated LCFA. The largest effect was observed for 16 : 0 and 18 : 0 (up-regulation of seventeen out of thirty measured transcripts or 56·7 %, Fig. 4) among the saturated (20 : 0 affected 30 % of genes, with four down-regulated, Fig. S10 in additional file 1, supplementary material for this article can be found at http://www.journals.cambridge.org/bjn) and EPA among the unsaturated LCFA (60 % measured transcripts affected, six genes down-regulated, Fig. 5). Among the other unsaturated LCFA, the effect on the expression of measured genes was c9, t11CLA ≥ 18 : 2>t10, c12CLA = DHA>>18 : 3 ≥ c9-18 : 1 = t11- ≥ t10-18 : 1 (Figs. S10–S18 in additional file 1, supplementary material for this article can be found at http://www.journals.cambridge.org/bjn).
When considering the gene networks among the measured genes, all the LCFA tested appeared capable of eliciting oxidation of fatty acids (⇑CD36 and ⇑CPT1A) and signalling through ANGPTL4 (summary in Figs. 4 and 5 and S10–S18 in additional file 1, supplementary material for this article can be found at http://www.journals.cambridge.org/bjn). This general response was probably due to the fact that the culture media used was devoid of LCFA. Before starting the experiment, the MDBK cells were in the media with 10 % fetal bovine serum containing approximately 0·015 mEq/l NEFA(Reference Thering, Bionaz and Loor11). This was approximately 10-fold less than the plasma NEFA concentration in bovines under normal conditions and approximately 50-fold less compared with cows just after parturition (see, for instance, Bionaz et al.(Reference Bionaz, Trevisi and Calamari49)). Interestingly, CD36 and ANGPTL4 were the least abundant genes among all those measured in MDBK (Fig. S1 in additional file 1, supplementary material for this article can be found at http://www.journals.cambridge.org/bjn).
The effect on ANGPTL4 is of interest because this gene codes for a protein that is synthesised in several tissues including adipose and liver and seems to play roles within the liver and peripheral tissues including adipose(Reference Lichtenstein and Kersten50). For example, ANGPTL4 is up-regulated during fasting in bovines(Reference Loor, Everts and Bionaz51) and non-ruminants(Reference Lichtenstein and Kersten50), and can bind and inactivate lipoprotein lipase in adipose tissue. An end-result of ANGPTL4 action is to increase plasma TAG and cholesteryl ester and decrease the uptake of fatty acids and cholesterol into peripheral tissues but, probably, increase availability of NEFA to the liver(Reference Lichtenstein and Kersten50). Interestingly, it was demonstrated recently that ANGPTL4 is up-regulated during the lipopolysacharide challenge in murine adipose, muscle and heart(Reference Lu, Moser and Shigenaga52). Thus, ANGPTL4 can be considered a novel positive acute-phase protein(Reference Lu, Moser and Shigenaga52). In the same study, the transcription of ANGPTL4 in the liver was down-regulated during the early response and up-regulated during the late response to lipopolysacharide. In the present study, ANGPTL4 responded rapidly regardless of the type of LCFA treatment. We cannot exclude that in some of the treatments (e.g. saturated LCFA) ANGPTL4 responded as an acute-phase response molecule.
From an in vivo ruminant perspective, the responses in gene expression observed in the present study can be classified into two categories, those associated with the LCFA found primarily in the diet (16 : 0, 18 : 0, c9-18 : 1, 18 : 2, 18 : 3, EPA and DHA) and those associated with ruminal metabolism (t10-18 : 1, t11-18 : 1, c9, t11-CLA, t10, c12-CLA and 20 : 0). An in-depth discussion of the gene networks affected by those categories of LCFA is reported in additional file 1 (supplementary material available online at http://www.journals.cambridge.org/bjn). In the following section, we briefly report the main findings within each category.
Dietary long-chain fatty acids
Among dietary LCFA, 16 : 0 and 18 : 0 and EPA elicited the largest changes in gene expression (Figs. 1 and 2). All three LCFA appear to have increased both catabolic and anabolic utilisation of LCFA (Figs. 4 and 5). Results for the saturated LCFA confirmed previous data obtained in hepatocytes from pre-ruminant calves(Reference Mashek and Grummer53). Overall, the data indicated that saturated LCFA and EPA would increase uptake and utilisation of NEFA along with increased formation of cholesterol. The increase in cholesterol synthesis can be considered a positive outcome in bovine liver (and particularly in the peripartal period) because it is essential for the formation of lipoproteins to remove TAG(Reference Hocquette and Bauchart54). The present and previous(Reference Mashek and Grummer53) data appear to be supported by a recent in vivo study in which greater plasma cholesterol level was measured in late pregnant cows fed a palmitic acid-enriched diet(Reference Andersen, Ridder and Larsen55).
The difference in the regulation of the expression of pro-inflammatory genes between the two saturated fatty acids and EPA was noteworthy (Fig. 2). The saturated LCFA elicited an evident increase in inflammation, at least considering the expression of the measured genes; EPA appeared to have reduced (mostly through ⇓ IL6) inflammation. Although this represents the first evidence in bovine cells, judging from non-ruminant data, the decrease of inflammation by EPA(Reference Soumura, Kume and Isshiki56) and increase of inflammation by 16 : 0 are not entirely novel findings(Reference Ajuwon and Spurlock57–Reference Coll, Eyre and Rodriguez-Calvo59). The inflammatory response induced by palmitate appears to occur through the activation of the NF-κB transcription factor, which, in turn, increases the expression of IL6 (Reference Ajuwon and Spurlock57–Reference Coll, Eyre and Rodriguez-Calvo59). In our case, the ‘putative transcription factor(s)’ reported in Fig. 4 could probably be NF-κB; however, this remains to be proven experimentally in bovines.
Even though PPARA was not up-regulated significantly by the dietary LCFA in the present study, up-regulation of its known co-activators, PPARGC1A (Reference Mandard, Muller and Kersten26) and LPIN1 (Reference Finck, Gropler and Chen19), was substantial in response to 16 : 0, 18 : 0 and EPA (Figs. 1 and 2), suggesting that, besides activating PPAR-α through direct binding, those LCFA also increase its activation by enhancing the availability of co-activators. The other dietary LCFA (c9-18 : 1, 18 : 2, 18 : 3 and DHA) elicited only moderate effects on measured genes (Figs. 1 and 2 and S13–S15 in additional file 1, supplementary material for this article can be found at http://www.journals.cambridge.org/bjn).
Rumen-related long-chain fatty acids
Far fewer changes were observed with LCFA that arise from ruminal metabolism (Figs. 1 and 2). Of all rumen-derived fatty acids investigated, 20 : 0 and c9, t11CLA elicited the most changes in gene expression (Figs. S10 and S11 in additional file 1, supplementary material for this article can be found at http://www.journals.cambridge.org/bjn). Phytanic acid (20 : 0) is a branched-chained LCFA derived from the ruminal metabolism of chlorophyll(Reference Dawson, Hemington and Grime60) and, as such, its production and deposition in tissues or milk is probably greater in cattle fed forage-based diets(Reference Lee, Connelly and Tweed61). Phytanic acid is known to be a potent murine liver PPAR-α ligand(Reference Wolfrum, Borrmann and Borchers13) but also activates the other two PPAR isoforms, at least in the rat(Reference Heim, Johnson and Boess62). The effect of 20 : 0 on gene expression of measured genes suggested a reduced TAG and cholesterol synthesis in MDBK (Figs. S10 in additional file 1, supplementary material for this article can be found at http://www.journals.cambridge.org/bjn). To our knowledge, no previous bovine cell culture work has been carried out with 20 : 0, but in rat hepatocytes, it was demonstrated that it is involved in increasing glucose metabolism(Reference Heim, Johnson and Boess62).
The functional responses of measured genes with exogenous c9, t11CLA (or rumenic acid) as inferred by network analysis (Fig. S11, supplementary material for this article can be found at http://www.journals.cambridge.org/bjn) is partly consistent with previous findings. In fact, as all treatments in the present study, c9, t11CLA increased the expression of genes associated with the oxidation of LCFA, which is commonly observed in rodents and humans fed with CLA(Reference DeLany and West63). The other rumen-related unsaturated LCFA had very modest effects on the expression of measured genes (Figs. 1 and 2 and summary in Figs. S12 and S16–S18 with discussion in additional file 1, supplementary material for this article can be found at http://www.journals.cambridge.org/bjn).
In a recent study, we investigated the transcriptomics effect of several LCFA on MacT cells(Reference Kadegowda, Bionaz and Piperova34). Several of those LCFA were also tested in the present study. To evaluate consistency in bovine cell responses to LCFA, we have conducted a comparison between the gene expression results between MDBK and MacT cells. The results are summarised in Table S10 (additional file 1 with therein relative discussion, available online at http://www.journals.cambridge.org/bjn). The analysis uncovered differences in response to LCFA between the two immortalised bovine cells, with a strikingly consistent greater response associated with saturated rather than unsaturated LCFA. The results from this comparison suggest caution when inferring data from one cell type to another; however, results support the fact that, opposite to non-ruminants, ruminant cells are more sensitive to saturated rather than unsaturated LCFA. The large response of bovine cells to PPAR agonists and LCFA strongly supports an effect of LCFA on the transcriptome.
Conclusions
The present study uncovered that ACSL1, ACSL3, ANGPTL4, CD36, CPT1A, FABP4, HMGCR, LPIN1, SCD and SREBF1, which are known PPAR-α targets in non-ruminants, are also induced by WY in the bovine. Novel and apparently bovine-specific PPAR-α targets were SPP1and LPIN3.
Our data provided potential avenues for the future, and more oriented, experiments in order to test the feasibility of using dietary LCFA to finely modulate metabolism in ruminant tissues such as the liver. The present study provides support for several LCFA as being PPAR-α agonists (particularly 16 : 0, 18 : 0 and EPA), but additional studies should be conducted to examine with greater confidence the binding and potency of activation of PPAR-α by LCFA, e.g. studies using the same experimental design but with the use of PPAR-α antagonists or the inhibition of PPAR-α expression/translation (e.g. by using siRNA).
In conclusion, the results from the present study strongly support the possibility that dietary LCFA, and particularly 16 : 0 and 18 : 0, are able to modulate ruminant metabolism, particularly lipid metabolism, with the major effects probably induced via the activation of PPAR. Those findings need to be verified in an in vivo milieu with the exciting possibility that, if verified, they will open novel opportunities for fine-tuning the regulation of bovine metabolism via careful/controlled dietary approaches. Those could have a tremendous impact in the dairy industry, for example, by providing the means to prevent metabolic disorders such as fatty liver.
Acknowledgements
We gratefully acknowledge funding from National Institute of Food and Agriculture (Washington, DC, USA) under projects ILLU-538-952 and ILLU-538-961. M. B. and J. J. L. conceived and designed the study. As part of the MS thesis B. J. T. coordinated and performed the study and qPCR analysis, and conducted the initial statistical analysis of qPCR data. M. B. helped perform and coordinate the study, performed final statistical analysis of the qPCR data, performed the PPRE and three-dimensional analyses, prepared the figures, and wrote the manuscript. J. J. L. supervised all aspects of the study and helped write the final manuscript. All authors read and approved the final manuscript. There are no financial or other contractual agreements that might cause conflict of interests.



