Se is an essential micronutrient for the immune system, thyroid metabolism and oxidative balance. It is particularly necessary in infants because of their rapid physical growth period, in addition to being indispensable for neurodevelopment(Reference Rayman1–Reference Pitts, Byrns and Ogawa3). Severe deficiency can lead to cardiomyopathy, muscular weakness, erythrocyte macrocytosis, hypothyroidism, pseudoalbinism, faltering growth and alopecia(Reference Litov and Combs4,Reference Masumoto, Nagata and Higashi5) . However, at high doses, Se can be toxic, causing adverse effects, or even increase the all-cause mortality(Reference Rayman6). Therefore, it is recommended to treat only deficiency or supplement individuals who have inadequate food ingestion according to recommendations for a specific age(Reference Berger, Shenkin and Schweinlin7).
Se status can be assessed by tissue analysis (hair, nails and blood), residues (urine, stool and expired air) or functional tests (selenoproteins activities). Plasma or serum Se is the most commonly used biomarker for evaluating variations in a short period of time(Reference Combs8). Erythrocyte Se is a marker for detecting chronic deficiency, as it reflects Se ingestion within 120 d, when hemocatheresis usually occurs(Reference Stefanowicz, Talwar and O’Reilly9).
In the paediatric age group, plasma/serum Se and erythrocyte Se seem to increase with age(Reference Muntau, Streiter and Kappler10–Reference Al Fify, Nichols and Alexiadou12), except in the first year of life. In a cohort of 166 healthy German children younger than 1 year, Muntau et al. observed a decrease in serum Se concentrations from birth to 4 months of age, followed by an increase in subsequent age groups until adulthood(Reference Muntau, Streiter and Kappler10). In another sample of newborns and infants, there was also a decrease in plasma and erythrocyte Se in healthy infants younger than 1 year of age(Reference Mengübaş, Diab and Gökmen13).
Newborns store Se in proportion to their birth weight and gestational age(Reference Dorea14–Reference Atazadegan, Heidari-Beni and Riahi16), which is used as they grow and is gradually replaced by food(Reference Lönnerdal, Vargas-Fernández and Whitacre17). Preterm and small-for-gestational-age neonates are born with a low Se body content and are at greater risk of developing deficiency; therefore, they are candidates for supplementation(Reference Atazadegan, Heidari-Beni and Riahi16). There are reports of Se deficiency in infants under 6 months of age receiving parenteral nutrition without Se supplementation, which evolved with growth retardation and alopecia, and reversible pseudoalbinism with supplementation(Reference Masumoto, Nagata and Higashi5). Se deficiency has also been linked to various diseases, including retinopathy of prematurity, pulmonary bronchodysplasia, necrotising enterocolitis and other pulmonary diseases(Reference Lönnerdal, Vargas-Fernández and Whitacre17).
In pregnancy, higher Se intake is associated with a lower incidence of preterm birth(Reference Barman, Brantsæter and Nilsson18), and low serum Se concentrations are associated with gestational diabetes mellitus(Reference Kong, Ma and Chen19) and preeclampsia(Reference Hamdan, Hamdan and Adam20). However, Se supplementation doesn’t appear to improve maternal, fetal or neonatal outcomes(Reference McDougall, Dore and Aboud21). In addition, children of mothers deficient in Se during pregnancy are at greater risk of developing infections, neurodevelopmental delays, attention deficit hyperactivity disorder and autism spectrum disorder(Reference Varsi, Bolann and Torsvik22,Reference Demircan, Chillon and Jensen23) .
Understanding the variability of Se status during the first year of life can help identify infants at risk of deficiency and develop strategies for controlling and preventing its consequences. Therefore, the aim of this study was to identify the extent and characteristics of this variability.
Methods
A systematic review was conducted following the Preferred Reporting Items for Systematic Reviews and Meta-Analyses(Reference Page, McKenzie and Bossuyt24) as a reporting guideline. The review protocol was registered at the PROSPERO registry (CRD42023456203).
Search strategy
A search was conducted across five databases (Embase, PubMed, Scopus, Lilacs and Scielo) using the key search terms ‘selenium’ AND ‘infant’ to find articles published until 30 July 2024 in peer-reviewed journals (specific terms included in the search are available in online Supplementary Table S1). A manual search was conducted in the bibliography of the selected articles. There were no limitations on language or date of publication.
Eligibility criteria and study selection
A Population, Intervention, Comparison, Outcomes and Study (PICOS) sequence (Table 1) was used to identify relevant studies. The eligibility screening of titles and abstracts was carried out by two independent researchers (C.B.A. and T.T.S.) using Rayyan QCRI® (Qatar Computing Research Institute) software. A third reviewer (L.H.P.) was consulted when disagreements arose in this phase. Bibliographic references of included studies were also checked.
PICOS criteria for inclusion and exclusion of studies

Reviews, letter to the editor, case reports, cohorts of unhealthy children, premature or children older than 1 year old and studies that didn’t answer the research question and with incomplete data were excluded. Since breastfeeding is the gold standard(Reference Victora, Bahl and Barros25,Reference Walker26) and standard formula is its first alternative, both breastfed and standard formula-fed infants were included in the study. Considering that the aim of the study was not to compare different formulas, other formula-fed infants were excluded if they were younger than 6 months. Specifically, soy formula-fed infants were also excluded due to the potential risk to child development and thyroid function associated with the high content of isoflavones, as well as the lack of consensus regarding their use at this age(Reference Vandenplas, Hegar and Munasir27–Reference Adgent, Umbach and Zemel29).
Studies were included when conducted on healthy full-term birth infants younger than 1 year old who had blood samples of plasma/serum or erythrocyte Se collected at different ages (specific age or no more than 3 months of age range) and whose values were described according to age.
Data extraction and synthesis
Data and characteristics of studies and populations, feeding (breastfeeding or infant formula), laboratory analysis methods, blood samples (plasma/serum and erythrocyte Se) and methodological limitations were extracted independently by two authors (C.B.A. and T.T.S.) and tabulated on Microsoft Office Excel®. Plasma and erythrocyte Se in μmol/l were converted to μg/l (× 78·74) for comparison. The data were synthesised in two tables and five figures. In Figures 1 and 2, descriptive statistical analyses were conducted, with the mean concentration over time aggregated by study, depicted through extraction graphs, utilising Stata MP 14·0 (Stata Corporation).
Mean plasma/serum selenium concentration according to age of studies that did not evaluate infant feeding. The lines represent the mean plasma/serum selenium concentration of a specific study. Study reference numbers in brackets at the end of the line. Sample sizes > 50 subjects in bold type.

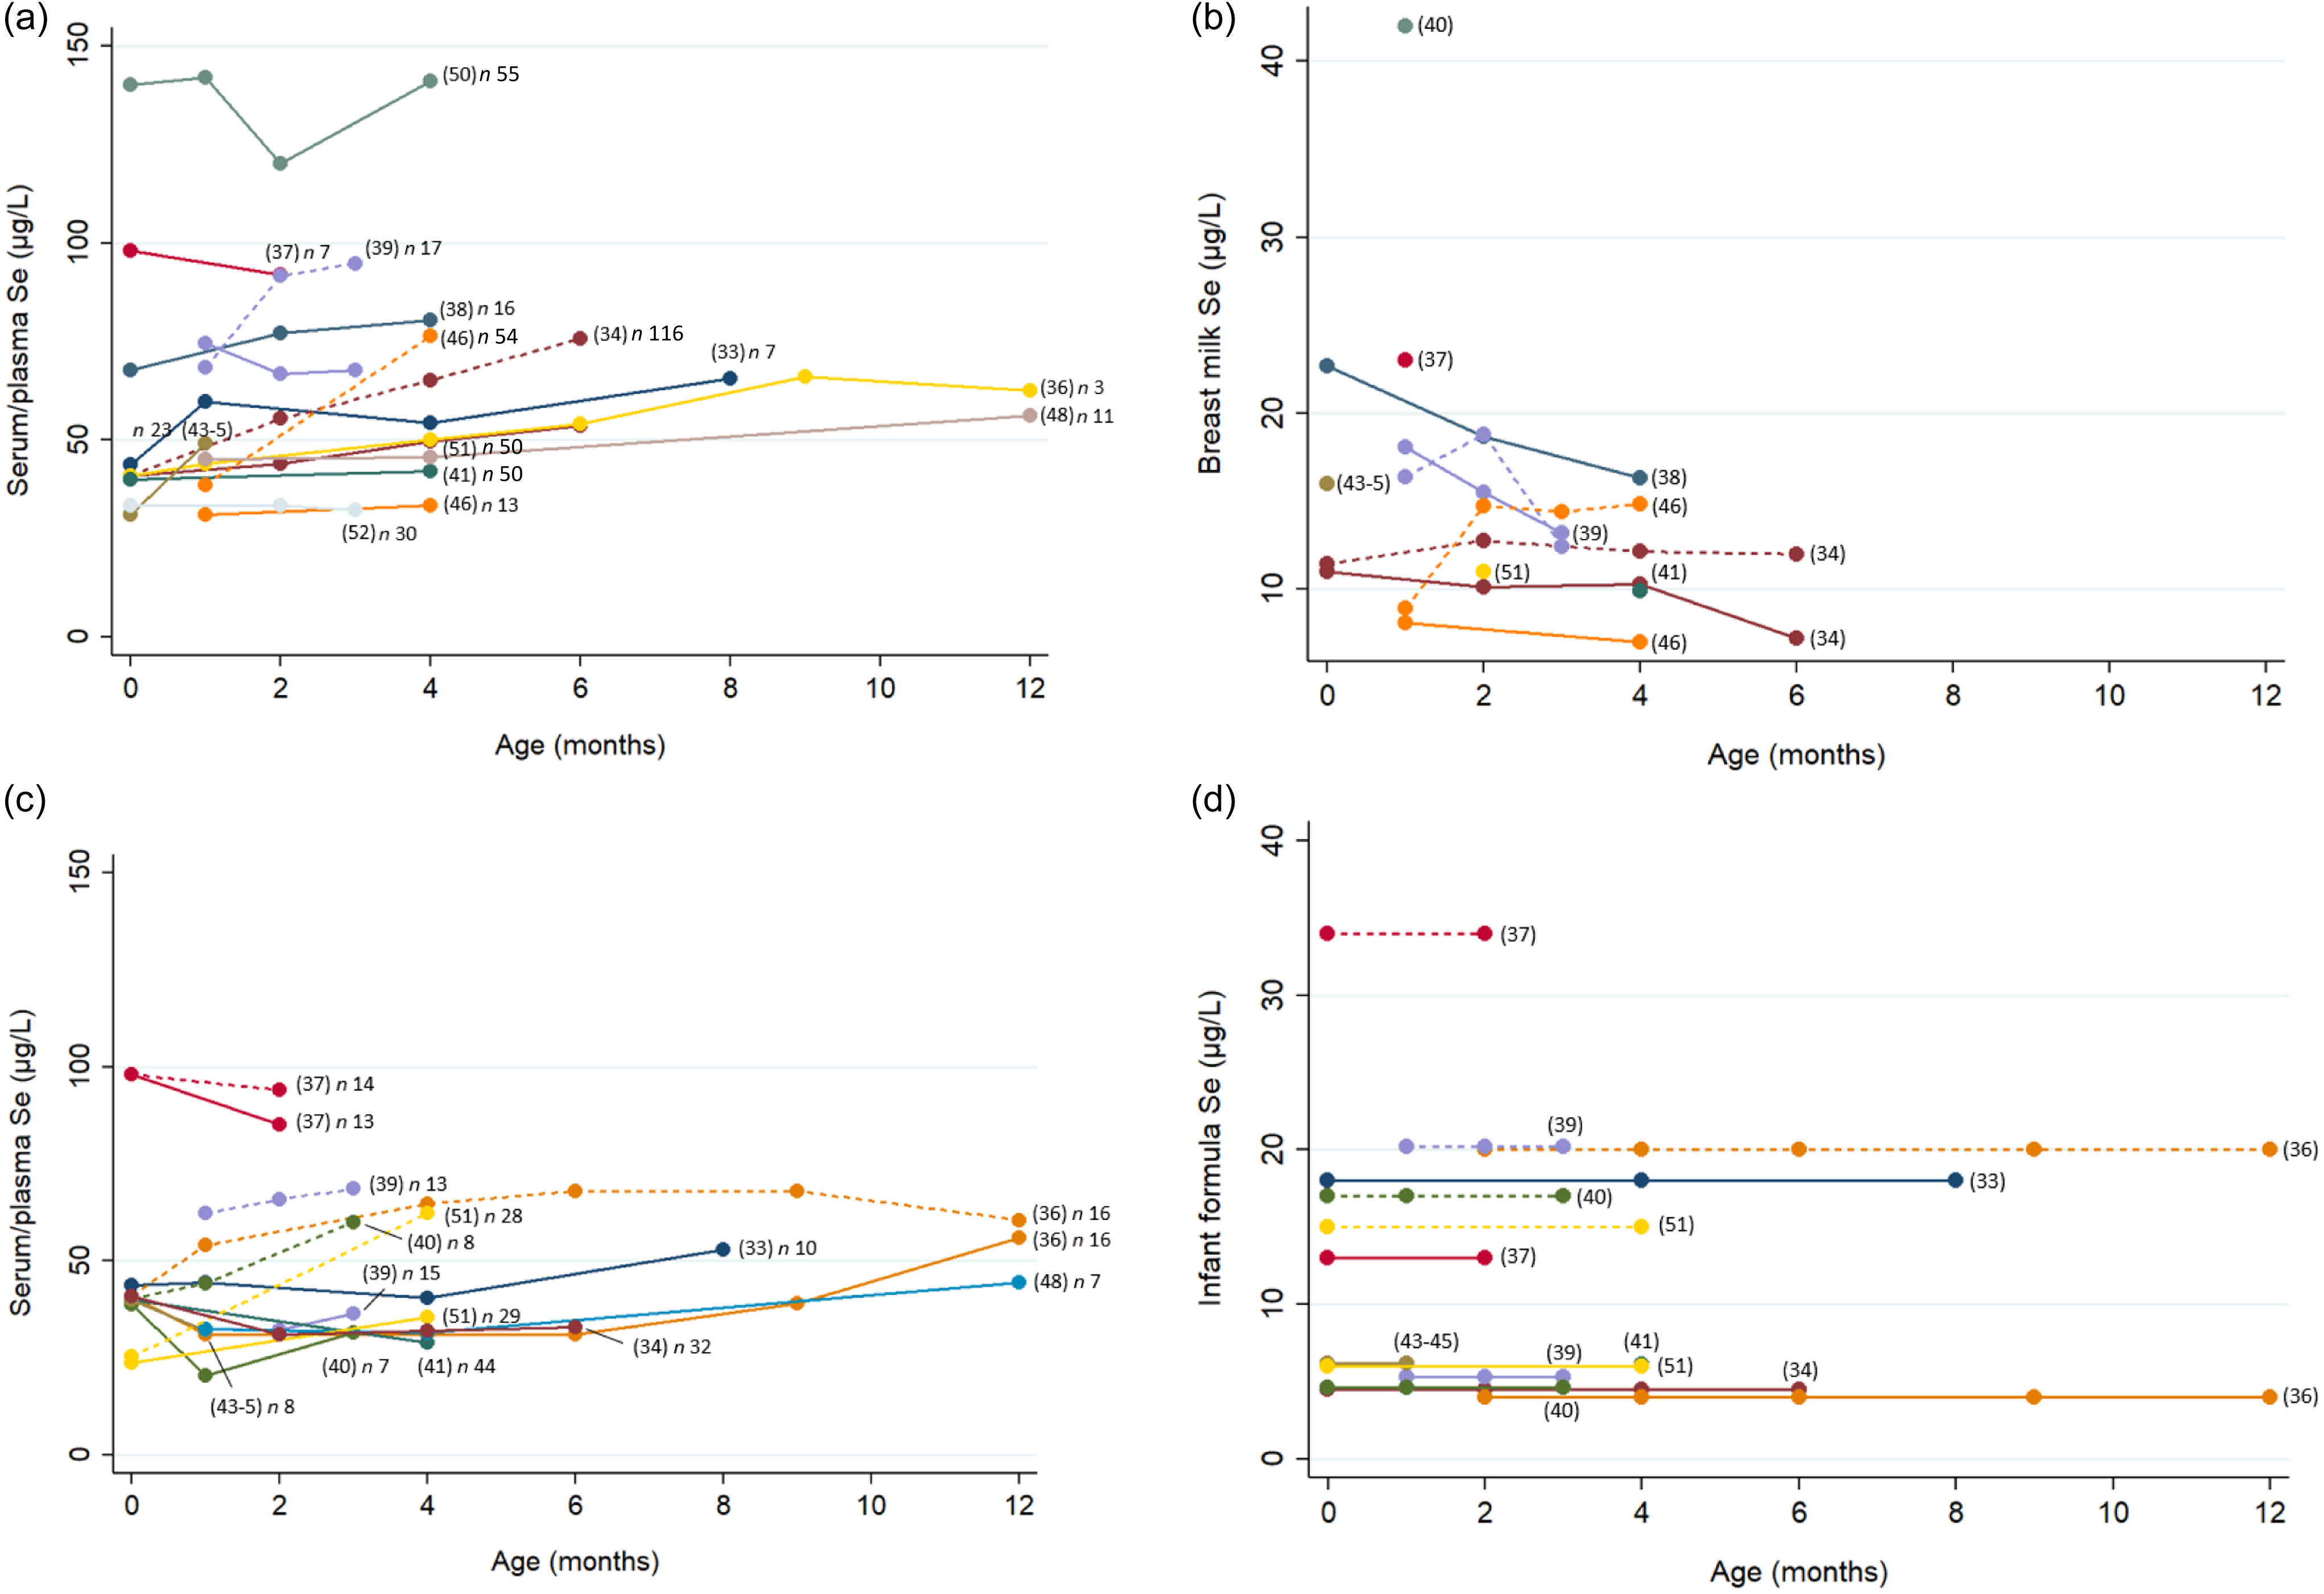
(a) Mean serum/plasma selenium concentration of breastfed infants according to age. (b) Mean breast milk selenium variation according to infant age. (c) Mean serum/plasma selenium concentration in formula-fed infants according to age. (d) Mean infant formula selenium concentration. Study reference numbers in parentheses at the end of the line. Continuous lines represent the mean serum/plasma selenium concentrations of breastfed infants from not supplemented mothers or not supplemented infant formulas. Short-dash lines represent mean concentrations of infants from supplemented mothers or fortified infant formula or mean selenium concentration from supplemented mothers or supplemented formula. Studies are differentiated by colours.

Quality assessment
Clinical trials and observational studies, including cohort, cross-sectional and case–control, were assessed using a modified version of the Newcastle–Ottawa Scale(Reference Herzog, Álvarez-Pasquin and Díaz30–Reference Silveira, Stefenon and Júnior32) (online Supplementary Table S2). Since our review’s focus did not involve evaluating the quality of intervention in clinical trial studies, we abstained from conducting a risk of bias evaluation for the clinical trials included in the present review. Therefore, the same quality assessment from the Newcastle–Ottawa Scale criteria for cohort studies was employed in the clinical trials.
Results
The initial search resulted in 6148 articles, of which 2092 were duplicates. The exclusion of articles based on titles and abstracts resulted in ninety-six articles for full-text screening. Despite attempts to contact the authors, five full reports could not be retrieved, resulting in ninety-one articles to the next step of screening. A total of twenty-three studies met the inclusion criteria. An additional article was detected in manual search, resulting in a total of twenty-four articles in this review (Figure 3). Three articles comprised the same population and had complementary information; therefore, they were combined and considered as a single study in the subsequent analysis, resulting in a total of twenty-two studies.
Flow diagram of selected articles.

Study characteristics
Studies included were published between 1985 and 2019. Most of them were carried out in European countries (n 10) and comprised cohorts or clinical trials (n 16). Biomarkers of Se status assessed in papers were plasma/serum Se (n 21) and erythrocyte Se (n 12), which are illustrated in the Venn diagram (Figure 4).
Venn diagram illustrating articles that assessed serum/plasma and erythrocyte selenium. Circles with numbers inside represent referenced articles.

Sixteen studies (72 %) evaluated children younger than 6 months old, and six studies (27 %) evaluated children up to 1 year old. Fifteen studies (68 %) assessed feeding: breastfeeding v. infant formula (n 10), breastfeeding (n 3) or infant formula alone (n 2). Six studies used infant formula supplemented with Se. Three studies supplemented lactating mothers with Se and evaluated Se in breastmilk, Se ingestion and biomarkers in infants and (two of them) plasma/serum Se in mothers. Characteristics of studies and biomarkers of Se status according to age and feeding are described in Tables 2 and 3, respectively. The results are structured into serum/plasma and erythrocyte Se. Serum/plasma Se comprised the following subtopics: no feeding assessment, serum/plasma Se concentration in breastfed infants and formula-fed infants. The concentration of Se in breast milk has been included as a specific topic due to its potential variability based on maternal Se status and its potential impact on the Se status of the breastfed infant. The main findings are summarised in Figure 5.
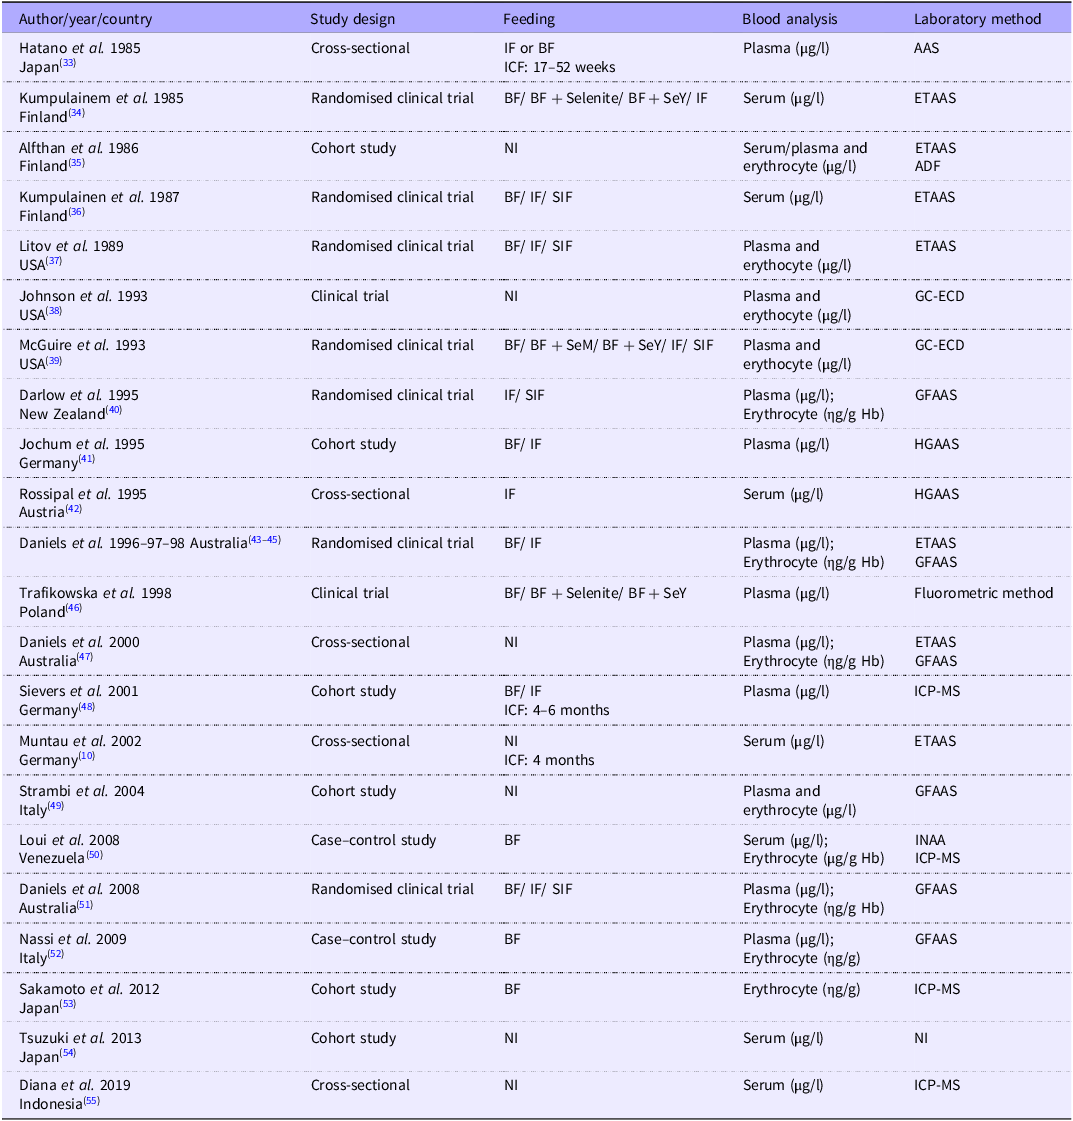
Methodological characteristics of studies included in the review

IF, infant formula; BF, breastfeeding; ICF, introduction of complementary feeding; AAS, atomic absorption spectrometry; SeY, Se enriched yeast; ETAAS, electrothermal atomic absorption spectrometry; NI, not informed; ADF, acid digestion fluorimetry; SIF, supplemented infant formula; GC-ECD, GC-electron capture detector; SeM, selenomethionine; GFAAS, graphite furnace atomic absorption spectrometry; HGAAS, hydride generation atomic absorption spectrometry; ICP-MS, inductively coupled plasma MS; INAA, instrumental neutron activation analysis.
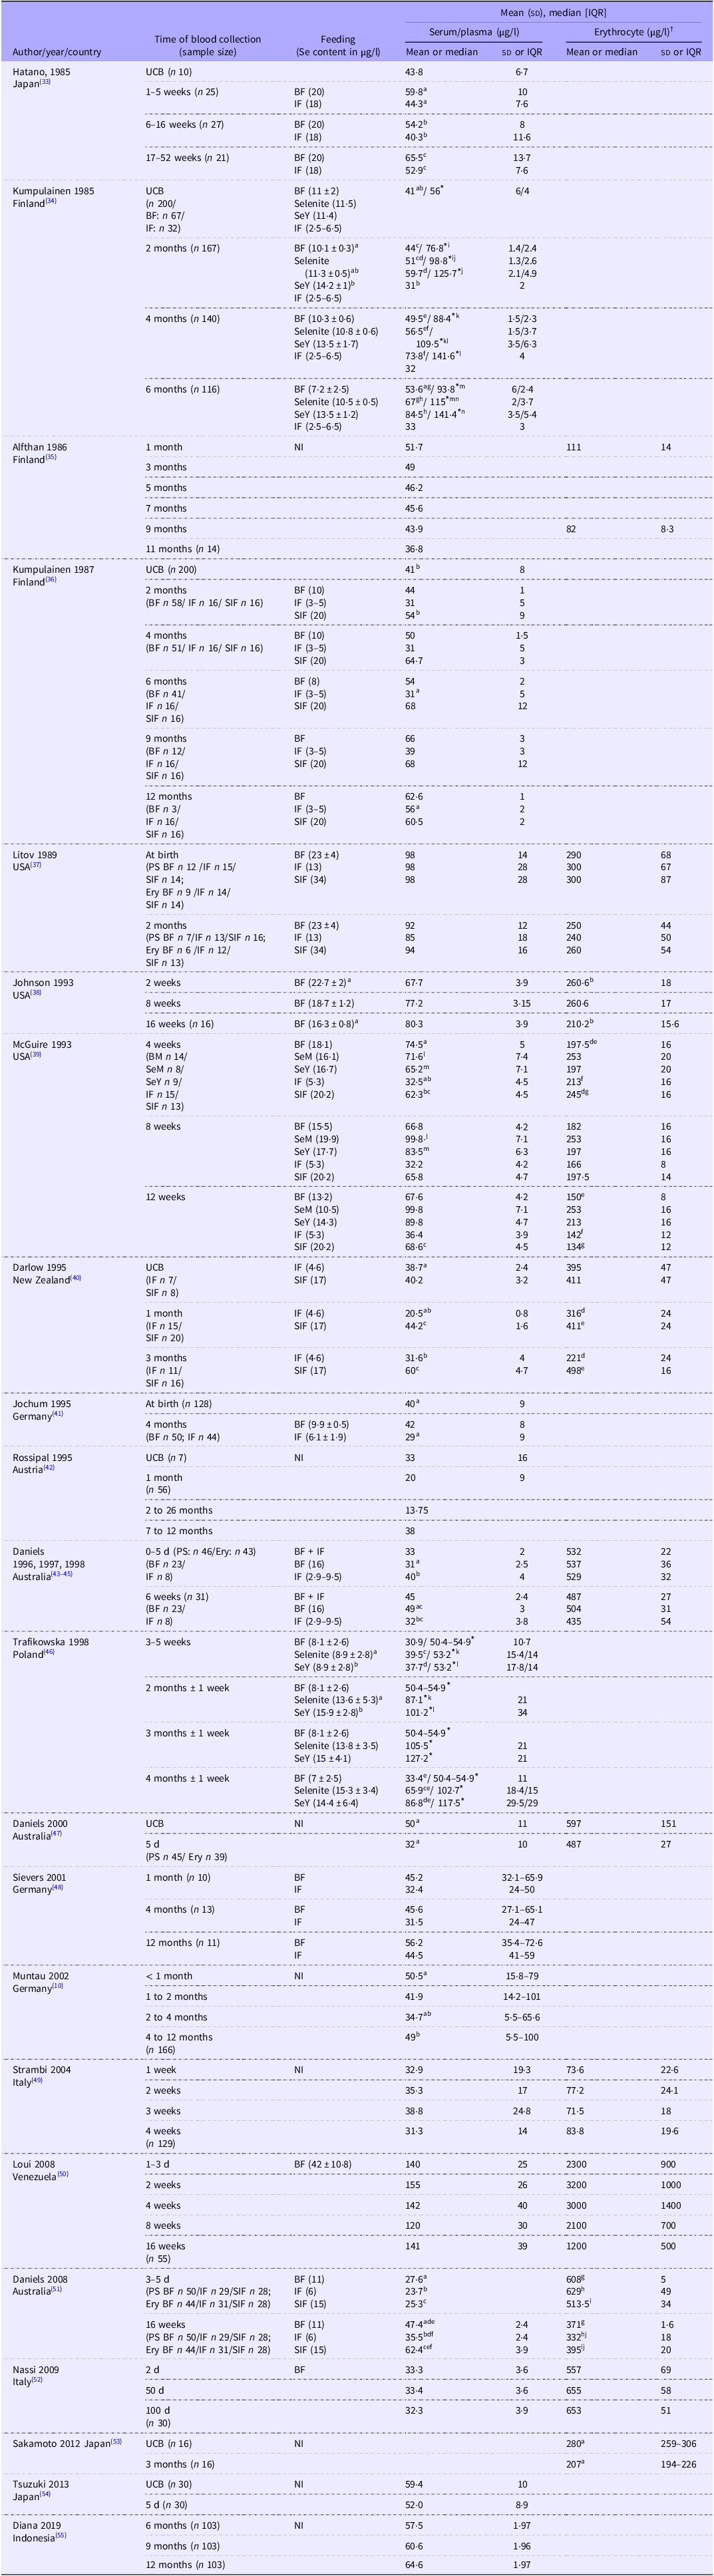
Biomarkers of selenium according to age group and feeding

IQR, interquartile range; UCB, umbilical cord blood; BF, breastfeeding; IF, infant formula; SeY, breastfeeding from mothers supplemented with Se enriched yeast; NI, not informed; SIF, supplemented infant formula; SeM, breastfeeding from mothers supplemented with selenomethionine; PS, plasma/serum; Ery, erythrocyte.
* Mother serum Se concentration. Statistical differences (P < 0.05) are indicated by superscript letters.
† Except for the studies of Darlow et al. (1995) (ηg/g Hb), Daniels et al. (1996, 1997, 1998, 2000, 2008) (ηg/g Hb), Nassi et al. (2009) (ηg/g Hb) and Loui et al. (2008) (μg/g Hb).
Main findings of the analysed studies. *Erythrocyte selenium probably not affected by feeding during the first 4 months of age.

Serum/plasma selenium (no feeding assessment)
Of the 21 studies that evaluated serum/plasma Se, 7 did not evaluate infant feeding, with a total of 543 participants, representing 32 % of the population included in the review. Figure 1 shows the mean plasma/serum Se concentrations of the five studies that had at least 1 month between blood samples. In two European studies, concentrations decreased during the first 4 months and then increased(Reference Muntau, Streiter and Kappler10,Reference Rossipal and Tiran42) . In the Indonesian study(Reference Diana, Purnamasari and Rahmannia55), there was a slight increase from 6 to 12 months. In the Finnish study(Reference Alfthan35), concentrations decreased from 1 month to 11 months, and in the Italian study(Reference Strambi, Longini and Vezzosi49), Se concentrations remained stable at 1 month. In studies with a larger sample size (454 participants in total, or 84 % of the population in the trials that did not evaluate feeding), Se concentrations decreased during the first 4 months and increased up to 1 year(Reference Muntau, Streiter and Kappler10,Reference Rossipal and Tiran42,Reference Strambi, Longini and Vezzosi49,Reference Diana, Purnamasari and Rahmannia55) .
Serum/plasma selenium in breastfed infants
Thirteen studies with a total of 469 participants evaluated serum/plasma Se concentrations in breastfed infants, as shown in Figure 2(a). In three of these studies, the mothers were supplemented with Se (Na selenite, Se-fortified yeast or selenomethionine)(Reference Kumpulainen, Salmenpera and Siimes34,Reference McGuire, Burgert and Milner39,Reference Trafikowska, Sobkowiak and Butler46) .
In breastfed infants of unsupplemented mothers, Se concentrations remained stable or increased in most studies(Reference Hatano, Aihara and Nishi33,Reference Kumpulainen, Salmenperä and Siimes36–Reference Johnson, Smith and Chan38,Reference Jochum, Fuchs and Cser41,Reference Daniels, Gibson and Simmer44,Reference Trafikowska, Sobkowiak and Butler46,Reference Sievers, Arpe and Schleyerbach48,Reference Daniels, Gibson and Simmer51,Reference Nassi, Ponziani and Becatti52) . In two studies (one American and one Venezuelan), Se decreased during the first 2 months(Reference McGuire, Burgert and Milner39,Reference Loui, Raab and Braetter50) . In the American study(Reference McGuire, Burgert and Milner39), Se concentrations remained stable for up to 3 months, whereas in the Venezuelan study(Reference Loui, Raab and Braetter50), Se concentrations increased from 2 to 4 months. The overlap of the mean concentrations in Kumpulainen’s studies(Reference Kumpulainen, Salmenpera and Siimes34,Reference Kumpulainen, Salmenperä and Siimes36) suggests that they represent a similar sample (therefore, only one study is shown in Figure 2(a)). In breastfed infants of supplemented mothers, Se concentrations increased more than those in infants of unsupplemented mothers(Reference Kumpulainen, Salmenpera and Siimes34,Reference McGuire, Burgert and Milner39,Reference Trafikowska, Sobkowiak and Butler46) .
Serum/plasma Se concentrations ranged from 27·6 to 140 μg/l in the first days of life – the lowest in the Australian study(Reference Daniels, Gibson and Simmer51) and the highest in the Venezuelan study(Reference Loui, Raab and Braetter50). During the first 4 months, concentrations remained lower in the Polish study(Reference Trafikowska, Sobkowiak and Butler46), at 30·9 μg/l, and in the Italian study(Reference Nassi, Ponziani and Becatti52), at 32·3 μg/l; and higher in the Venezuelan study(Reference Loui, Raab and Braetter50), at 155 μg/l, and the American studies(Reference Litov, Sickles and Chan37–Reference McGuire, Burgert and Milner39), with variations of 80–100 μg/l.
Only four studies had a sample size of more than fifty children(Reference Kumpulainen, Salmenpera and Siimes34,Reference Jochum, Fuchs and Cser41,Reference Loui, Raab and Braetter50,Reference Daniels, Gibson and Simmer51) . Three of these studies, with a total of 221 participants, showed stabilisation of plasma/serum Se concentrations during the first 4 months in breastfed infants of unsupplemented mothers(Reference Kumpulainen, Salmenpera and Siimes34,Reference Jochum, Fuchs and Cser41,Reference Loui, Raab and Braetter50) . During this period, Se concentrations increased in infants of supplemented mothers, in a total of seventy-four participants(Reference Kumpulainen, Salmenpera and Siimes34,Reference McGuire, Burgert and Milner39,Reference Trafikowska, Sobkowiak and Butler46) . From 4 months to 1 year, 3 studies, with a total of 134 participants, showed increased concentrations in infants of unsupplemented mothers(Reference Hatano, Aihara and Nishi33,Reference Kumpulainen, Salmenpera and Siimes34,Reference Sievers, Arpe and Schleyerbach48) .
Selenium concentration in breast milk
Se concentration in breast milk was analysed in nine studies, as shown in Figure 2(b). The Se concentration in the breast milk of unsupplemented mothers varied between 6 and 27 μg/l(Reference Kumpulainen, Salmenpera and Siimes34,Reference Litov, Sickles and Chan37–Reference McGuire, Burgert and Milner39,Reference Jochum, Fuchs and Cser41,Reference Daniels, Gibson and Simmer44,Reference Trafikowska, Sobkowiak and Butler46,Reference Daniels, Gibson and Simmer51) , with the lowest value in the Polish study(Reference Trafikowska, Sobkowiak and Butler46) and the highest in one of the American studies(Reference Litov and Combs4). The exception was the Venezuelan study(Reference Loui, Raab and Braetter50), which showed even higher Se concentrations, ranging from 31 to 53 μg/l. In mothers supplemented with Se (Na selenite, Se-fortified yeast or selenomethionine), the Se content of breast milk ranged from 10 to 20 μg/l(Reference Kumpulainen, Salmenpera and Siimes34,Reference McGuire, Burgert and Milner39,Reference Trafikowska, Sobkowiak and Butler46) .
Se concentrations in breast milk were assessed over time in four studies(Reference Kumpulainen, Salmenpera and Siimes34,Reference Johnson, Smith and Chan38,Reference McGuire, Burgert and Milner39,Reference Trafikowska, Sobkowiak and Butler46) . In these four studies, Se concentration in unsupplemented mothers gradually decreased during the first 6 months. In three of these four studies, Se increased in supplemented mothers only in the first 2 months and was maintained or decreased over the following 6 months(Reference Kumpulainen, Salmenpera and Siimes34,Reference McGuire, Burgert and Milner39,Reference Trafikowska, Sobkowiak and Butler46) .
Serum/plasma selenium in formula-fed infants
Ten studies evaluated infants fed supplemented or unsupplemented infant formula. Figure 2(c) shows the mean serum/plasma Se concentrations of formula-fed infants, and Figure 2(d) shows the mean Se concentration in infant formula. Again, as observed in breastfed infants, there was an overlap in mean serum/plasma Se concentrations in the Finnish studies, suggesting a similar sample(Reference Kumpulainen, Salmenpera and Siimes34,Reference Kumpulainen, Salmenperä and Siimes36) .
In unsupplemented formula-fed infants, serum/plasma Se concentrations decreased during the first 4 months in 6 studies(Reference Kumpulainen, Salmenpera and Siimes34,Reference Kumpulainen, Salmenperä and Siimes36,Reference Litov, Sickles and Chan37,Reference Darlow, Inder and Sluis40,Reference Jochum, Fuchs and Cser41,Reference Daniels, Gibson and Simmer44) , with a total of 120 participants. In supplemented formula-fed infants, evaluated in five studies (seventy-five participants), concentrations were maintained or increased(Reference Hatano, Aihara and Nishi33,Reference Litov, Sickles and Chan37,Reference McGuire, Burgert and Milner39,Reference Sievers, Arpe and Schleyerbach48,Reference Daniels, Gibson and Simmer51) . The Se content of unsupplemented infant formula ranged from 2·5 to 13 μg/l and that of supplemented formula from 15 to 34 μg/l.
Serum/plasma Se concentrations in formula-fed infants ranged from 20·5 to 98 μg/l. The lowest values were observed in the New Zealand study(Reference Darlow, Inder and Sluis40) and the highest in one of the American studies(Reference Litov, Sickles and Chan37).
In summary, serum/plasma Se concentrations in formula-fed infants decreased when the Se content of infant formula was less than 15 μg/l(Reference Kumpulainen, Salmenpera and Siimes34,Reference Kumpulainen, Salmenperä and Siimes36,Reference Litov, Sickles and Chan37,Reference McGuire, Burgert and Milner39–Reference Jochum, Fuchs and Cser41,Reference Daniels, Gibson and Simmer43–Reference Daniels, Gibson and Simmer45,Reference Daniels, Gibson and Simmer51) and were maintained or increased when it was 15 μg/l or more(Reference Hatano, Aihara and Nishi33,Reference Kumpulainen, Salmenperä and Siimes36,Reference Litov, Sickles and Chan37,Reference McGuire, Burgert and Milner39,Reference Darlow, Inder and Sluis40,Reference Daniels, Gibson and Simmer51) .
Erythrocyte selenium
Twelve studies with a total of 426 participants evaluated erythrocyte Se concentrations in infants younger than 4 months of age(Reference Alfthan35,Reference Litov, Sickles and Chan37–Reference Darlow, Inder and Sluis40,Reference Daniels, Gibson and Simmer44,Reference Daniels, Gibson and Simmer47,Reference Strambi, Longini and Vezzosi49–Reference Sakamoto, Man Chan and Domingo53,Reference Daniels56) . Eight of these twelve studies evaluated feeding (breastfed infants by supplemented and unsupplemented mothers and supplemented or unsupplemented formula-fed infants). In most studies, erythrocyte Se concentration remained stable or decreased, regardless of feeding. In four studies, an increase in erythrocyte Se concentration was observed during the first months(Reference Darlow, Inder and Sluis40,Reference Strambi, Longini and Vezzosi49,Reference Loui, Raab and Braetter50,Reference Nassi, Ponziani and Becatti52) , except in the Venezuelan study, where a decrease was observed after 2 weeks(Reference Loui, Raab and Braetter50).
In studies with samples smaller than forty-five infants(Reference Alfthan35,Reference Litov, Sickles and Chan37–Reference McGuire, Burgert and Milner39,Reference Daniels, Gibson and Simmer44,Reference Daniels, Gibson and Simmer47,Reference Daniels, Gibson and Simmer51,Reference Sakamoto, Man Chan and Domingo53) , erythrocyte Se decreased during the first 4 months. In the Italian study(Reference Strambi, Longini and Vezzosi49), in which the sample size was larger (n 129), erythrocyte Se concentrations were maintained during the first month(Reference Loui, Raab and Braetter50).
Discussion
In this systematic review, comprising 24 articles (22 studies) and 1288 participants, we analysed the extent and characteristics of the variability of Se status during the first year of life, represented by plasma/serum Se and erythrocyte Se. Feeding was assessed in fourteen of the included studies.
Serum/plasma selenium during the first year
In studies with no feeding assessment, serum/plasma Se concentrations tended to decrease during the first 4 months of age, followed by an increase in subsequent months. This coincides with the introduction of complementary feeding (between 4 and 6 months of age) recommended by the Committee on Nutrition of the European Society for Paediatric Gastroenterology, Hepatology and Nutrition (Reference Fewtrell, Bronsky and Campoy57).
When formula-fed infants were evaluated in the first 4 months of age, plasma/serum Se concentrations varied with the quantity of Se in formulas, showing stabilisation or increase when Se was ≥ 15 μg/l. It is worth noting that since 2005, the European Society of Gastroenterology, Hepatology and Nutrition has recommended the fortification of infant formula. However, it was not until 2015 that the Food and Drug Administration published a recommendation requiring 13–46 μg Se/l(Reference Lönnerdal, Vargas-Fernández and Whitacre17). Prior to the standardisation of infant formula fortification, the amount of Se varied depending on the raw materials used in manufacturing(Reference Levander58). Therefore, studies assessing infant formula fortification were conducted before the recommendations.
On the other hand, breastfeeding ensured the stability of plasma/serum Se concentrations in infants. Three to 6 months of maternal supplementation was associated with increased plasma/serum Se concentrations in infants, with greater increases with the use of selenomethionine, followed by Se-fortified yeast and Na selenite. In contrast, Se concentrations remained stable in the breastfed infants of unsupplemented mothers. However, there are no currently recommendations for maternal supplementation.
Selenium concentration in breast milk and the effect of selenium supplementation on mother serum selenium concentration
When analysing the Se concentration in breast milk, studies showed a gradual decrease during the first 6 months, whereas maternal supplementation promoted an increase in Se during the first 2 months, after which it remained stable or decreased until 6 months. The literature shows that colostrum has a high Se content; however, the trend demonstrates variability, showing a decrease as lactation progresses(Reference Dorea14) or an initial increase from colostrum to 3 months, followed by a subsequent decrease(Reference Ish Shalom, Lubetzky and Mimouni59). Otherwise, serum/plasma Se remains stable or increases in infants, suggesting that this is a more physiological trend.
Se concentrations in mature milk vary widely, from as low as 2·6 µg/l in the Keshan region (recognised as Se-deficient) in China to 15–22 µg/l in the USA and Japan and as high as 49–90 µg/l in Venezuela(Reference Dorea14,Reference Trafikowska, Sobkowiak and Butler46) . In the included studies, the Se content of breast milk varied from 5 to 24 µg/l in unsupplemented mothers and from 10 to 20 µg/l in supplemented mothers. Accordingly, differences in the Se content of breast milk depend on the geographical region, as does the amount of maternal Se intake over time and the resulting Se status(Reference Kumpulainen60).
The importance of maternal Se intake can be illustrated in the case of Finland, where Se intake is associated with grain consumption. In 1976, when the population only consumed grains from local producers, a low Se intake was estimated (mean of 30 μg/d), which resulted in a decrease in the mean Se concentration in breast milk from 10·7 to 5·8 μg/l in the first 3 months. In 1980, with the importation of grains from the USA, Se consumption increased to 50 µg/d, resulting in a smaller decrease in the Se content of breast milk (from 11·8 to 10 µg/l) within the first 3 months(Reference Kumpulainen, Vuori and Siimes61). The following year (1981), an increase in Se consumption of 75 µg/d was estimated due to the import of new wheat and rye, and the use of fertilisers containing Na selenite since 1984(Reference Alfthan, Eurola and Ekholm62) could explain both the tendency to increase Se concentrations in breast milk and serum of supplemented or unsupplemented mothers observed by Kumpulainen et al. in 1985(Reference Kumpulainen, Salmenpera and Siimes34).
Lactation requires 8–15 µg of Se daily to maintain concentrations of 10–20 µg/l of Se in breast milk. The recommendation during lactation is 59–70 µg/d (while the recommendation for women is 45–55 µg/d) to meet the needs of the infant and mother during this period(Reference Kumpulainen60,63) . Supplementation, preferably with selenomethionine and Se-fortified yeast, which appears to be more effective, should be considered if Se intake is low, especially if intake has been low since pregnancy, when Se requirements may increase by 10–23 µg/d(Reference Swanson, Reamer and Veillon64), with recommended intakes ranging from 49 to 60 µg/d(65).
In studies that evaluated maternal supplementation, mothers received 100–200 µg/d of Se (higher than recommended) in the form of Na selenite, Se-fortified yeast or selenomethionine. Se-fortified yeast and selenomethionine promoted an increase in breast milk Se concentrations up to 2 months, followed by maintenance or decline in subsequent months(Reference Kumpulainen, Salmenpera and Siimes34,Reference McGuire, Burgert and Milner39,Reference Trafikowska, Sobkowiak and Butler46) , whereas Na selenite would maintain Se concentrations at 100 µg and promote an increase of up to 4 months at 200 µg(Reference Kumpulainen, Salmenpera and Siimes34,Reference Trafikowska, Sobkowiak and Butler46) . A gradual decline over the months would be expected in mothers with adequate or elevated serum Se concentrations.
Two of the included studies evaluated maternal serum Se in supplemented mothers(Reference Kumpulainen, Salmenpera and Siimes34,Reference Trafikowska, Sobkowiak and Butler46) . Maternal Se supplementation resulted in an increase in serum Se concentrations during the first 4–6 months, followed by stabilisation. From a mean baseline status of 55 µg/l, the increase ranged from 35 to 50 µg/l when supplemented with Na selenite and from 50 to 85 µg/l with Se-fortified yeast in the first few months(Reference Kumpulainen, Salmenpera and Siimes34,Reference Trafikowska, Sobkowiak and Butler46) .
Erythrocyte selenium
Erythrocyte Se decreased over time in most studies (nine of twelve studies), but because it is a long-term marker and the studies evaluated children up to 4 months of age, it would be necessary to know the maternal Se status during pregnancy to predict the behaviour of this marker during this period.
Maternal Se status during pregnancy plays an important role, as there is a high demand for Se due to increased thyroid hormone synthesis (thyroxine (T4) and triiodothyronine (T3)), which is essential for fetal and neonatal growth and brain development. Within 4–6 weeks after delivery, maternal serum T4 and T3 levels return to pre-gestational levels(Reference Soldin, Tractenberg and Hollowell66,Reference Eng and Lam67) . After birth, thyroid hormone synthesis in newborns is stimulated by placental abruption and thermal environmental changes. At 48 h, T4 levels reach a peak that takes several weeks to normalise, while T3 production increases fourfold after birth. T4 levels do not fully inhibit Thyroid-stimulating hormone secretion, maintaining rising T4 and T3 levels until 1–2 months after birth, when the hypothalamic-pituitary-thyroid axis matures(Reference Eng and Lam67). During this period, there may be a consequent high requirement for Se, as Se is essential for key enzymes that catalyse the activation of thyroid hormone to active T3(Reference Köhrle68).
In addition, most studies evaluating Se concentration were not adjusted per erythrocyte mass, and considering that Hb decreases in the first few months of life(Reference Moghadam69), the decrease in erythrocyte Se may reflect this physiological state rather than a decrease in Se stores themselves.
Study limitations
The studies analysed in this review were conducted in different geographical regions with different soil concentrations and Se consumption patterns, which makes it difficult to interpret and compare the results. Furthermore, the lack of information on maternal Se status since pregnancy hinders the ability to predict its influence on the variability of long-term markers. This review did not use exclusion criteria for methodological quality due to the heterogeneity of the studies. Additionally, differences in control group selection criteria, which were not consistently reported, as well as differences in laboratory analysis methods and follow-up periods, affected comparisons between groups.
Conclusion
It cannot be asserted that Se levels in serum/plasma and erythrocytes increase with age in infants under 1 year of age, as has been observed in older children(Reference Al Fify, Nichols and Alexiadou12). As expected, the studies analysed in this review indicate that the variability of these Se biomarkers in the first year is associated with maternal Se intake/supplementation and the Se content of the infant’s diet.
Serum/plasma Se concentrations are generally maintained or even increased during the first few months of life in breastfed infants. These concentrations are associated with Se intake and, in children younger than 1 year old, with the Se content of breast milk or infant formula until the introduction of complementary feeding. Consequently, it cannot be deduced from the available studies that there is a physiological decrease in Se concentrations during this timeframe. Studies show a declining trend in erythrocyte Se, except in infants fed supplemented formula or breastfed by supplemented mothers.
In addition, a more pronounced decrease in Se concentration in breast milk may be associated with inadequate maternal intake. Therefore, maternal intake of Se as well as other micronutrients should be assessed and, if necessary, adjusted for exclusively breastfed infants. Maternal supplementation should be considered in cases of micronutrient depletion when low intake occurs over a prolonged period of time. Compared with breastfed infants, exclusively formula-fed infants appear to be at lower risk of Se depletion as a result of adjustments made to the Se content of infant formulae over the past few decades.
Given the lack of consensus on whether serum or plasma Se concentrations decrease physiologically during the first year of life, and whether the decrease is associated with poor outcomes, population-based studies are needed in geographical regions with low and high soil Se levels. These studies should assess biochemical Se markers in children and their mothers and Se concentrations in the breast milk of healthy, exclusively breastfed children under 6 months. In the absence of such studies, supplementation should be considered in cases based on thorough clinical and dietary assessment.
Supplementary material
For supplementary material/s referred to in this article, please visit https://doi.org/10.1017/S0007114525000728.
Acknowledgments
No funding was received for conducting this study.
C. B. A., T. T. S. and H. P. L. designed and developed the research plan. C. B. A. and T. T. S. collected the data with support and supervision from H. P. L. All authors contributed to the interpretation of the results, the writing and the critical revision of the manuscript. All authors read and approved the final manuscript and take responsibility for its final content.
The authors declare none.